Head‐to‐head trials of antibiotics for bronchiectasis
Information
- DOI:
- https://doi.org/10.1002/14651858.CD012590.pub2Copy DOI

- Database:
-
- Cochrane Database of Systematic Reviews
- Version published:
-
- 05 September 2018see what's new
- Type:
-
- Intervention
- Stage:
-
- Review
- Cochrane Editorial Group:
-
Cochrane Airways Group
- Copyright:
-
- Copyright © 2018 The Cochrane Collaboration. Published by John Wiley & Sons, Ltd.
Article metrics
Altmetric:
Cited by:
Authors
Contributions of authors
All protocol authors contributed to the Background section. SJM, SS, LF, and PM contributed to the Methods section.
ES and LF screened the searches; AK and LF extracted data and completed the risk of bias assessment; LF transferred data to Review Manager; LF and SS undertook data analysis; AK, LF, and SS completed the results section; and all review authors contributed to the Discussion and Authors' conclusions.
Sources of support
Internal sources
-
Edge Hill University, Other.
Funded SS to provide support for a series of reviews on bronchiectasis
External sources
-
The authors declare that no external funding was received for this systematic review, Other.
Declarations of interest
SS: lead applicant on a grant from Edge Hill University that provided support to LF for several bronchiectasis reviews. She is also an editor with the Cochrane Airways Group.
AK: none known.
SJM: none known.
LF: none known.
ES: none known.
PM: received lecture fees and conference accommodations/fees from industry unrelated to the current review.
Acknowledgements
We thank Edge Hill University and the Cochrane Airways Group for their support.
We also thank Haley Harrison (HH) for searching trial registries. HH was an NIHR intern based at the Postgraduate Medical Institute, Edge Hill University.
Rebecca Normansell was the Editor for this protocol and commented critically on the document.
The Background and Methods section of this protocol are based on a standard template used by Cochrane Airways.
This project was supported by the National Institute for Health Research (NIHR), via Cochrane Infrastructure funding to the Cochrane Airways Group. The views and opinions expressed therein are those of the authors and do not necessarily reflect those of the Systematic Reviews Programme, NIHR, NHS, or the Department of Health.
Version history
| Published | Title | Stage | Authors | Version |
| 2018 Sep 05 | Head‐to‐head trials of antibiotics for bronchiectasis | Review | Axel Kaehne, Stephen J Milan, Lambert M Felix, Emer Sheridan, Paul A Marsden, Sally Spencer | |
| 2017 Mar 13 | Head‐to‐head trials of antibiotics for non‐cystic fibrosis bronchiectasis | Protocol | Axel Kaehne, Stephen J Milan, Lambert M Felix, Sally Spencer, Emer Sheridan, Paul A Marsden | |
Keywords
MeSH
Medical Subject Headings (MeSH) Keywords
- Aminoglycosides [*therapeutic use];
- Amoxicillin [therapeutic use];
- Anti‐Bacterial Agents [*therapeutic use];
- Bronchiectasis [*drug therapy];
- Fluoroquinolones [*therapeutic use];
- Forced Expiratory Volume;
- Polymyxins [*therapeutic use];
- Pseudomonas Infections [drug therapy];
- Randomized Controlled Trials as Topic;
- beta‐Lactams [*therapeutic use];
Medical Subject Headings Check Words
Adult; Child; Humans;
PICOs

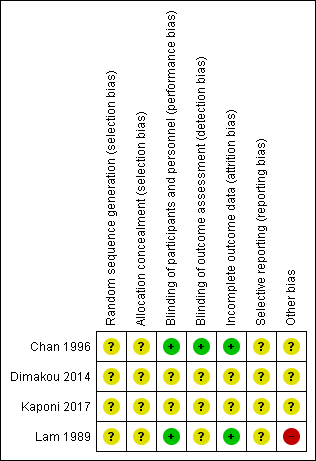
Risk of bias summary: review authors' judgements about each risk of bias item for each included study.

Comparison 1 Fluoroquinolones versus β‐lactam (amoxicillin), Outcome 1 Response rate ‐ treatment failure.

Comparison 1 Fluoroquinolones versus β‐lactam (amoxicillin), Outcome 2 Response rate ‐ microbiological response: patients with organisms eliminated.

Comparison 1 Fluoroquinolones versus β‐lactam (amoxicillin), Outcome 3 Response rate ‐ improvement in sputum purulence (excellent).

Comparison 1 Fluoroquinolones versus β‐lactam (amoxicillin), Outcome 4 Response rate ‐ improvement in sputum purulence (fair).

Comparison 1 Fluoroquinolones versus β‐lactam (amoxicillin), Outcome 5 Response rate ‐ relapse of sputum purulence at 3‐month follow‐up.

Comparison 1 Fluoroquinolones versus β‐lactam (amoxicillin), Outcome 6 Sputum volume (change mL).

Comparison 1 Fluoroquinolones versus β‐lactam (amoxicillin), Outcome 7 FEV1 % predicted (change).

Comparison 2 Polymyxins versus aminoglycosides, Outcome 1 Response rate ‐ improvement in sputum purulence.

Comparison 2 Polymyxins versus aminoglycosides, Outcome 2 Response rate ‐ P aeruginosa eradication.

Comparison 2 Polymyxins versus aminoglycosides, Outcome 3 Sputum purulence ‐ improvement in score at 3 months.

Comparison 2 Polymyxins versus aminoglycosides, Outcome 4 Adverse events.
| Fluoroquinolones compared to amoxicillin for bronchiectasis: short‐term studies (< 4 weeks) | ||||||
| Patient or population: adults aged 18 years and above with diagnosis of non‐cystic fibrosis bronchiectasis | ||||||
| Outcomes | Anticipated absolute effects* (95% CI) | Relative effect | № of participants | Quality of the evidence | Comments | |
| Risk with amoxicillin | Risk with fluoroquinolones | |||||
| Exacerbations | ‐ | ‐ | Not estimable | ‐ | ‐ | Outcome not reported in included studies |
| Serious adverse events | 0 per 1000 | 0 per 1000 | Not estimable | 83 (2 RCTs) | ⊕⊕⊝⊝ | Evidence graded on the overall quality of the study |
| Response rate ‐ treatment failure | 429 per 1000 | 50 per 1000 | OR 0.07 | 83 | ⊕⊕⊝⊝ | |
| Response rate ‐ microbiological response | 2 out of 8 participants responded. | 8 out of 8 participants responded. | Peto OR 20.09 (2.83 to 142.59) | 16 | ⊕⊕⊝⊝ | Small single study. Peto OR used owing to 100% response in intervention arm |
| Response rate ‐ improvement in sputum purulence (excellent) | 357 per 1000 | 566 per 1000 | OR 2.35 | 83 | ⊕⊝⊝⊝ | |
| Deaths | 0 per 1000 | 0 per 1000 | Not estimable | 83 (2 RCTs) | ⊕⊕⊝⊝ | No deaths reported. Evidence graded on the overall quality of the study |
| Quality of life | ‐ | ‐ | Not estimable | ‐ | ‐ | Outcome not reported in included studies |
| *The risk in the intervention group (and its 95% confidence interval) is based on the assumed risk in the comparison group and the relative effect of the intervention (and its 95% CI). | ||||||
| GRADE Working Group grades of evidence. | ||||||
| aOne point deducted in relation to design and implementation of available studies suggesting likelihood of bias (unclear generation of randomisation sequence, potential selective reporting bias, and risk of other bias in Lam 1989). bOne point deducted for imprecision (small sample size and few events). cOne point deducted for imprecision (wide confidence interval). | ||||||
| Polymyxins compared to aminoglycosides for bronchiectasis: long‐term studies (≥ 4 weeks) | ||||||
| Patient or population: adults aged 18 years and above with diagnosis of bronchiectasis | ||||||
| Outcomes | Anticipated absolute effects* (95% CI) | Relative effect | № of participants | Quality of the evidence | Comments | |
| Risk with aminoglycosides | Risk with polymyxins | |||||
| Exacerbation | ‐ | ‐ | Not estimable | ‐ | ‐ | Outcome not reported in included studies |
| Serious adverse events | 0 per 1000 | 0 per 1000 | Not estimable | 20 (1 RCT) | ⊕⊝⊝⊝ | Evidence graded on the overall quality of the study |
| Response rate ‐ improvement in sputum purulence | 800 per 1000 | 390 per 1000 (38 to 939) | OR 0.16 (0.01 to 3.85) | 20 | ⊕⊝⊝⊝ | Definition of improvement not reported |
| Response rate ‐ P aeruginosa eradication | 471 per 1000 | 554 per 1000 (242 to 826) | OR 1.40 (0.36 to 5.35) | 35 (1 RCT) | ⊕⊝⊝⊝ | Head‐to‐head comparison not reported directly |
| Deaths | 0 per 1000 | 0 per 1000 | Not estimable | 20 | ⊕⊝⊝⊝ | No deaths reported. Evidence graded on the overall quality of the study |
| Quality of life | ‐ | ‐ | Not estimable | ‐ | ‐ | Outcome not reported in included studies |
| *The risk in the intervention group (and its 95% confidence interval) is based on the assumed risk in the comparison group and the relative effect of the intervention (and its 95% CI). | ||||||
| GRADE Working Group grades of evidence. | ||||||
| aOne point deducted in relation to design and implementation of available studies suggesting likelihood of bias (all study methods unclear). bOne point deducted for indirectness (no direct head‐to‐head comparisons). cOne point deducted for imprecision (small sample size and few events). dOne point deducted for imprecision (wide confidence intervals). | ||||||
| Study | Adults/ Children (N) | Arm 1 | Arm 2 | Arm 3 | Duration | ||||||
| Antibiotic (N) | Dose/ Frequency | Mode of delivery | Antibiotic (N) | Dose/ Frequency | Mode of delivery | Comparison (N) | Dose/ Frequency | Mode of delivery | |||
| Fluoroquinolones vs β‐lactams (amoxicillin) | |||||||||||
| Adults (42) | Ciprofloxacin (plus amoxicillin placebo) (21) | 500 mg 3 times daily | Oral | Amoxicillin (plus ciprofloxacin placebo) (21) | 1000 mg 3 times daily | Oral | ‐ | ‐ | ‐ | 7 days | |
| Adults (41) | Ofloxacin (plus amoxicillin placebo) (20) | 200 mg 3 times daily | Oral | Amoxicillin (plus (21) | 1000 mg 3 times daily | Oral | ‐ | ‐ | ‐ | 10 days | |
| Aminoglycosides vs polymyxins | |||||||||||
| Adults (29) | Tobramycin (10) | 300 mg twice daily | Inhalation by nebuliser | 1 MU colistimethate sodium (10) | 300 mg twice daily | Inhalation by nebuliser | Saline solution (9) | 4 mL of 0.9% solution | Inhalation by nebuliser | 4 weeks | |
| Adults (52) | Tobramycin (17) | 300 mg twice daily | Inhalation by nebuliser | 1 MU colistimethate sodium (18) | 300 mg twice daily | Inhalation by nebuliser | Saline solution (17) | 4 mL of 0.9% solution | Inhalation by nebuliser | 3 months | |
| N: number of participants. | |||||||||||
| Outcome or subgroup title | No. of studies | No. of participants | Statistical method | Effect size |
| 1 Response rate ‐ treatment failure Show forest plot | 2 | 83 | Odds Ratio (M‐H, Fixed, 95% CI) | 0.07 [0.01, 0.32] |
| 1.1 Ciprofloxacin | 1 | 42 | Odds Ratio (M‐H, Fixed, 95% CI) | 0.06 [0.01, 0.49] |
| 1.2 Ofloxacin | 1 | 41 | Odds Ratio (M‐H, Fixed, 95% CI) | 0.09 [0.01, 0.77] |
| 2 Response rate ‐ microbiological response: patients with organisms eliminated Show forest plot | 1 | Peto Odds Ratio (Peto, Fixed, 95% CI) | Totals not selected | |
| 3 Response rate ‐ improvement in sputum purulence (excellent) Show forest plot | 2 | 83 | Odds Ratio (M‐H, Fixed, 95% CI) | 2.35 [0.96, 5.72] |
| 3.1 Ciprofloxacin vs amoxicillin | 1 | 42 | Odds Ratio (M‐H, Fixed, 95% CI) | 1.5 [0.43, 5.25] |
| 3.2 Ofloxacin vs amoxicillin | 1 | 41 | Odds Ratio (M‐H, Fixed, 95% CI) | 3.79 [1.03, 13.91] |
| 4 Response rate ‐ improvement in sputum purulence (fair) Show forest plot | 2 | 83 | Odds Ratio (M‐H, Fixed, 95% CI) | 2.30 [0.88, 6.00] |
| 4.1 Ciprofloxacin vs amoxicillin | 1 | 42 | Odds Ratio (M‐H, Fixed, 95% CI) | 4.68 [1.17, 18.69] |
| 4.2 Ofloxacin vs amoxicillin | 1 | 41 | Odds Ratio (M‐H, Fixed, 95% CI) | 1.07 [0.26, 4.44] |
| 5 Response rate ‐ relapse of sputum purulence at 3‐month follow‐up Show forest plot | 1 | Odds Ratio (M‐H, Fixed, 95% CI) | Totals not selected | |
| 6 Sputum volume (change mL) Show forest plot | 1 | Mean Difference (IV, Fixed, 95% CI) | Totals not selected | |
| 7 FEV1 % predicted (change) Show forest plot | 1 | Mean Difference (IV, Fixed, 95% CI) | Totals not selected | |
| Outcome or subgroup title | No. of studies | No. of participants | Statistical method | Effect size |
| 1 Response rate ‐ improvement in sputum purulence Show forest plot | 1 | Odds Ratio (M‐H, Fixed, 95% CI) | Totals not selected | |
| 2 Response rate ‐ P aeruginosa eradication Show forest plot | 1 | Odds Ratio (M‐H, Fixed, 95% CI) | Totals not selected | |
| 3 Sputum purulence ‐ improvement in score at 3 months Show forest plot | 1 | Mean Difference (IV, Fixed, 95% CI) | Totals not selected | |
| 4 Adverse events Show forest plot | 1 | Odds Ratio (M‐H, Fixed, 95% CI) | Totals not selected | |