Autocuidado para la bronquiectasia
Appendices
Appendix 1. Sources and search methods for the Cochrane Airways Group's Specialised Register (CAGR)
Electronic searches: core databases
| Database | Frequency of search |
| MEDLINE (Ovid) | Weekly |
| Embase (Ovid) | Weekly |
| CENTRAL (crso.cochrane.org) | Monthly |
| PsycINFO (Ovid) | Monthly |
| CINAHL (EBSCO) | Monthly |
| AMED (EBSCO) | Monthly |
Handsearches: core respiratory conference abstracts
| Conference | Years searched |
| American Academy of Allergy, Asthma and Immunology (AAAAI) | 2001 onwards |
| American Thoracic Society (ATS) | 2001 onwards |
| Asia Pacific Society of Respirology (APSR) | 2004 onwards |
| British Thoracic Society Winter Meeting (BTS) | 2000 onwards |
| Chest Meeting | 2003 onwards |
| European Respiratory Society (ERS) | 1992, 1994, 2000 onwards |
| International Primary Care Respiratory Group Congress (IPCRG) | 2002 onwards |
| Thoracic Society of Australia and New Zealand (TSANZ) | 1999 onwards |
MEDLINE search strategy used to identify trials for the CAGR
Bronchiectasis topic search
1. exp Bronchiectasis/
2. bronchiect$.mp.
3. bronchoect$.mp.
4. kartagener$.mp.
5. (bronchial$ adj3 dilat$).mp.
6. or/1‐5
Filter to identify RCTs
1. exp "clinical trial [publication type]"/
2. (randomised or randomised).ab,ti.
3. placebo.ab,ti.
4. dt.fs.
5. randomly.ab,ti.
6. trial.ab,ti.
7. groups.ab,ti.
8. or/1‐7
9. Animals/
10. Humans/
11. 9 not (9 and 10)
12. 8 not 11
The MEDLINE strategy and RCT filter (Lefebvre 2011) are adapted to identify trials in other electronic databases.
Appendix 2. Search strategy to identify relevant trials from the CAGR
#1 BRONCH:MISC1
#2 MeSH DESCRIPTOR Bronchiectasis Explode All
#3 bronchiect*
#4 #1 or #2 or #3
#5 MeSH DESCRIPTOR Self Care Explode All
#6 MeSH DESCRIPTOR Education
#7 MeSH DESCRIPTOR Patient Education as Topic
#8 educat*
#9 self‐manag*
#10 "self manag*"
#11 self‐car* or "self car*"
#12 train* or instruct*
#13 "patient cent*" or patient‐cent*
#14 patient‐focus* or "patient focus*"
#15 patient‐education or "patient education"
#16 "management plan" or management‐plan
#17 management* NEAR1 program*
#18 behavior* or behaviour*
#19 disease* NEAR2 management*
#20 self‐efficac*
#21 empower*
#22 #5 or #6 or #7 or #8 or #9 or #10 or #11 or #12 or #13 or #14 or #15 or #16 or #17 or #18 or #19 or #20 or #21
#23 #4 AND #22
[In search line #1, MISC1 denotes the field in the record where the reference has been coded for condition, in this case, bronchiectasis]

Risk of bias summary: review authors' judgements about each risk of bias item for each included study.

Risk of bias graph: review authors' judgements about each risk of bias item presented as percentages across all included studies.

Comparison 1 Early rehab versus usual care, Outcome 1 SGRQ Total: mean difference.
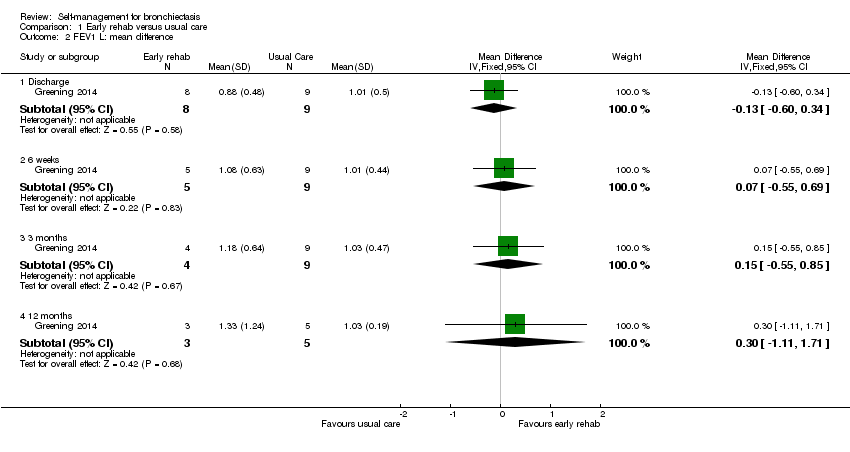
Comparison 1 Early rehab versus usual care, Outcome 2 FEV1 L: mean difference.

Comparison 1 Early rehab versus usual care, Outcome 3 Mortality.

Comparison 2 Expert patient programme versus usual care, Outcome 1 SGRQ Total: mean difference.
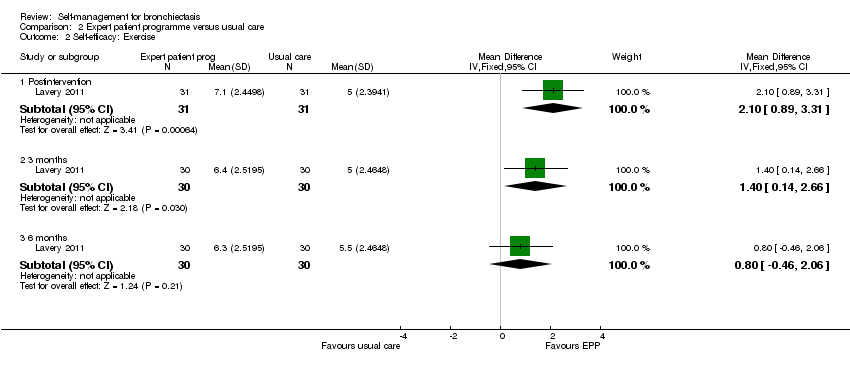
Comparison 2 Expert patient programme versus usual care, Outcome 2 Self‐efficacy: Exercise.
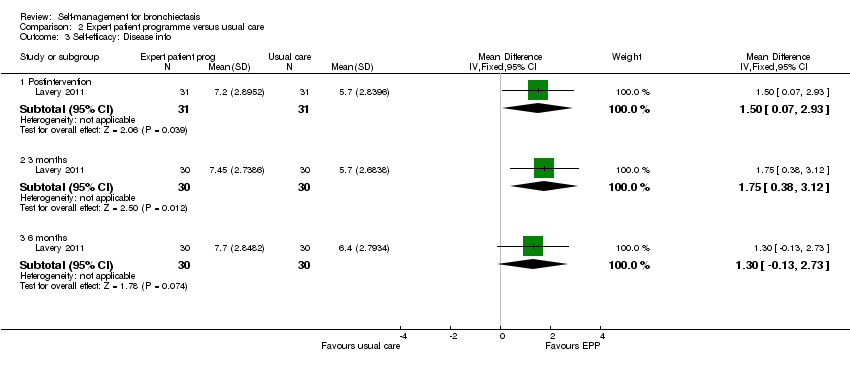
Comparison 2 Expert patient programme versus usual care, Outcome 3 Self‐efficacy: Disease info.
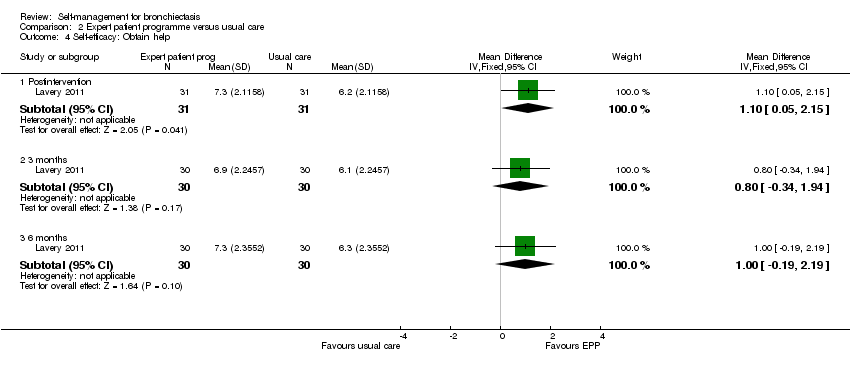
Comparison 2 Expert patient programme versus usual care, Outcome 4 Self‐efficacy: Obtain help.

Comparison 2 Expert patient programme versus usual care, Outcome 5 Self‐efficacy: Communication.

Comparison 2 Expert patient programme versus usual care, Outcome 6 Self‐efficacy: Manage disease.
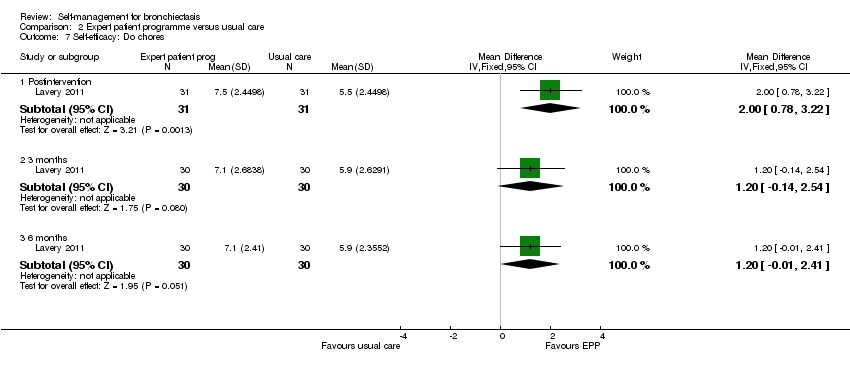
Comparison 2 Expert patient programme versus usual care, Outcome 7 Self‐efficacy: Do chores.

Comparison 2 Expert patient programme versus usual care, Outcome 8 Self‐efficacy: Social activity.

Comparison 2 Expert patient programme versus usual care, Outcome 9 Self‐efficacy: Manage symptoms.

Comparison 2 Expert patient programme versus usual care, Outcome 10 Self‐efficacy: Manage breathlessness.

Comparison 2 Expert patient programme versus usual care, Outcome 11 Self‐efficacy: Manage depression.
| Self‐management compared to usual care for bronchiectasis | ||||||
| Patient or population: people with non‐cystic fibrosis bronchiectasis | ||||||
| Outcomes | Anticipated absolute effects* (95% CI) | Relative effect | № of participants | Certainty of the evidence | Comments | |
| Risk with usual care | Risk with self‐management | |||||
| Health‐related quality of life | The mean health‐related quality of life was 56.02 points | MD 10.27 lower | ‐ | 20 | ⊕⊝⊝⊝ | No clear benefit or harm from self‐management (very low‐quality evidence) |
| Health‐related quality of life Follow up: range post‐intervention to 6 months | The mean health‐related quality of life was 44.7 points | MD 3.2 higher | ‐ | 60 | ⊕⊕⊝⊝ | No clear benefit or harm from self‐management |
| Exacerbations requiring antibiotics | ‐ | ‐ | ‐ | ‐ | ‐ | Not reported |
| Serious adverse events: mortality | ‐ | ‐ | not estimable | 20 | ||
| Hospital admissions (number admitted at least once) | ‐ | ‐ | not estimable | 20 | ‐ | |
| Lung function assessed with: FEV1 L | The mean FEV1 was 1.03 L | MD 0.3 higher | ‐ | 20 | ⊕⊝⊝⊝ | No clear benefit or harm from self‐management |
| Self‐efficacy assessed with: CDSS Follow‐up: postintervention to 6 months | ‐ | ‐ | not estimable | 60 | ⊕⊕⊝⊝ | Six out of ten scales showed significant improvements over time with the intervention. We elected not to include all 10 scales in the table but graded the evidence based on overall quality of the study |
| Economic costs | ‐ | ‐ | ‐ | ‐ | ‐ | Not reported |
| *The risk in the intervention group (and its 95% confidence interval) is based on the assumed risk in the comparison group and the relative effect of the intervention (and its 95% CI). | ||||||
| GRADE Working Group grades of evidence | ||||||
| 1One point deducted for the unblinded nature of the comparison. | ||||||
| Outcome or subgroup title | No. of studies | No. of participants | Statistical method | Effect size |
| 1 SGRQ Total: mean difference Show forest plot | 1 | Mean Difference (IV, Fixed, 95% CI) | Subtotals only | |
| 1.1 6 weeks | 1 | 13 | Mean Difference (IV, Fixed, 95% CI) | ‐12.70 [‐30.39, 4.99] |
| 1.2 3 months | 1 | 12 | Mean Difference (IV, Fixed, 95% CI) | ‐9.15 [‐28.08, 9.78] |
| 1.3 12 months | 1 | 7 | Mean Difference (IV, Fixed, 95% CI) | ‐10.27 [‐45.15, 24.61] |
| 2 FEV1 L: mean difference Show forest plot | 1 | Mean Difference (IV, Fixed, 95% CI) | Subtotals only | |
| 2.1 Discharge | 1 | 17 | Mean Difference (IV, Fixed, 95% CI) | ‐0.13 [‐0.60, 0.34] |
| 2.2 6 weeks | 1 | 14 | Mean Difference (IV, Fixed, 95% CI) | 0.07 [‐0.55, 0.69] |
| 2.3 3 months | 1 | 13 | Mean Difference (IV, Fixed, 95% CI) | 0.15 [‐0.55, 0.85] |
| 2.4 12 months | 1 | 8 | Mean Difference (IV, Fixed, 95% CI) | 0.30 [‐1.11, 1.71] |
| 3 Mortality Show forest plot | 1 | 20 | Odds Ratio (M‐H, Fixed, 95% CI) | 5.0 [0.64, 39.06] |
| Outcome or subgroup title | No. of studies | No. of participants | Statistical method | Effect size |
| 1 SGRQ Total: mean difference Show forest plot | 1 | Mean Difference (IV, Fixed, 95% CI) | Subtotals only | |
| 1.1 Post‐intervention | 1 | 62 | Mean Difference (IV, Fixed, 95% CI) | ‐6.5 [‐16.59, 3.59] |
| 1.2 3 months | 1 | 60 | Mean Difference (IV, Fixed, 95% CI) | ‐2.60 [‐12.97, 7.77] |
| 1.3 6 months | 1 | 60 | Mean Difference (IV, Fixed, 95% CI) | 3.20 [‐6.64, 13.04] |
| 2 Self‐efficacy: Exercise Show forest plot | 1 | Mean Difference (IV, Fixed, 95% CI) | Subtotals only | |
| 2.1 Postintervention | 1 | 62 | Mean Difference (IV, Fixed, 95% CI) | 2.10 [0.89, 3.31] |
| 2.2 3 months | 1 | 60 | Mean Difference (IV, Fixed, 95% CI) | 1.40 [0.14, 2.66] |
| 2.3 6 months | 1 | 60 | Mean Difference (IV, Fixed, 95% CI) | 0.80 [‐0.46, 2.06] |
| 3 Self‐efficacy: Disease info Show forest plot | 1 | Mean Difference (IV, Fixed, 95% CI) | Subtotals only | |
| 3.1 Postintervention | 1 | 62 | Mean Difference (IV, Fixed, 95% CI) | 1.5 [0.07, 2.93] |
| 3.2 3 months | 1 | 60 | Mean Difference (IV, Fixed, 95% CI) | 1.75 [0.38, 3.12] |
| 3.3 6 months | 1 | 60 | Mean Difference (IV, Fixed, 95% CI) | 1.30 [‐0.13, 2.73] |
| 4 Self‐efficacy: Obtain help Show forest plot | 1 | Mean Difference (IV, Fixed, 95% CI) | Subtotals only | |
| 4.1 Postintervention | 1 | 62 | Mean Difference (IV, Fixed, 95% CI) | 1.10 [0.05, 2.15] |
| 4.2 3 months | 1 | 60 | Mean Difference (IV, Fixed, 95% CI) | 0.80 [‐0.34, 1.94] |
| 4.3 6 months | 1 | 60 | Mean Difference (IV, Fixed, 95% CI) | 1.0 [‐0.19, 2.19] |
| 5 Self‐efficacy: Communication Show forest plot | 1 | Mean Difference (IV, Fixed, 95% CI) | Subtotals only | |
| 5.1 Postintervention | 1 | 62 | Mean Difference (IV, Fixed, 95% CI) | 1.10 [0.14, 2.06] |
| 5.2 3 months | 1 | 60 | Mean Difference (IV, Fixed, 95% CI) | 0.90 [0.04, 1.76] |
| 5.3 6 months | 1 | 60 | Mean Difference (IV, Fixed, 95% CI) | 0.90 [‐0.07, 1.87] |
| 6 Self‐efficacy: Manage disease Show forest plot | 1 | Mean Difference (IV, Fixed, 95% CI) | Subtotals only | |
| 6.1 Postintervention | 1 | 62 | Mean Difference (IV, Fixed, 95% CI) | 1.10 [0.17, 2.03] |
| 6.2 3 months | 1 | 60 | Mean Difference (IV, Fixed, 95% CI) | 1.10 [0.27, 1.93] |
| 6.3 6 months | 1 | 60 | Mean Difference (IV, Fixed, 95% CI) | 0.70 [‐0.27, 1.67] |
| 7 Self‐efficacy: Do chores Show forest plot | 1 | Mean Difference (IV, Fixed, 95% CI) | Subtotals only | |
| 7.1 Postintervention | 1 | 62 | Mean Difference (IV, Fixed, 95% CI) | 2.0 [0.78, 3.22] |
| 7.2 3 months | 1 | 60 | Mean Difference (IV, Fixed, 95% CI) | 1.20 [‐0.14, 2.54] |
| 7.3 6 months | 1 | 60 | Mean Difference (IV, Fixed, 95% CI) | 1.20 [‐0.01, 2.41] |
| 8 Self‐efficacy: Social activity Show forest plot | 1 | Mean Difference (IV, Fixed, 95% CI) | Subtotals only | |
| 8.1 Postintervention | 1 | 62 | Mean Difference (IV, Fixed, 95% CI) | 2.0 [0.84, 3.16] |
| 8.2 3 months | 1 | 60 | Mean Difference (IV, Fixed, 95% CI) | 0.90 [‐0.42, 2.22] |
| 8.3 6 months | 1 | 60 | Mean Difference (IV, Fixed, 95% CI) | 0.40 [‐0.88, 1.68] |
| 9 Self‐efficacy: Manage symptoms Show forest plot | 1 | Mean Difference (IV, Fixed, 95% CI) | Subtotals only | |
| 9.1 Postintervention | 1 | 62 | Mean Difference (IV, Fixed, 95% CI) | 1.90 [0.78, 3.02] |
| 9.2 3 months | 1 | 60 | Mean Difference (IV, Fixed, 95% CI) | 1.20 [0.13, 2.27] |
| 9.3 6 months | 1 | 60 | Mean Difference (IV, Fixed, 95% CI) | 0.70 [‐0.41, 1.81] |
| 10 Self‐efficacy: Manage breathlessness Show forest plot | 1 | Mean Difference (IV, Fixed, 95% CI) | Subtotals only | |
| 10.1 Postintervention | 1 | 62 | Mean Difference (IV, Fixed, 95% CI) | 1.5 [0.32, 2.68] |
| 10.2 3 months | 1 | 60 | Mean Difference (IV, Fixed, 95% CI) | 0.90 [‐0.31, 2.11] |
| 10.3 6 months | 1 | 60 | Mean Difference (IV, Fixed, 95% CI) | 0.90 [‐0.36, 2.16] |
| 11 Self‐efficacy: Manage depression Show forest plot | 1 | Mean Difference (IV, Fixed, 95% CI) | Subtotals only | |
| 11.1 Postintervention | 1 | 62 | Mean Difference (IV, Fixed, 95% CI) | 2.0 [0.91, 3.09] |
| 11.2 3 months | 1 | 60 | Mean Difference (IV, Fixed, 95% CI) | 1.40 [0.19, 2.61] |
| 11.3 6 months | 1 | 60 | Mean Difference (IV, Fixed, 95% CI) | 1.30 [0.09, 2.51] |