Intervenciones para mejorar la adherencia al tratamiento de quelación del hierro en pacientes con anemia de células falciformes o talasemia
Appendices
Appendix 1. Search strategies
The following databases will be searched using the strategies below (without study filters):
CENTRAL & DARE, (The Cochrane Library)
#1 MeSH descriptor: [Patient Acceptance of Health Care] explode all trees
#2 MeSH descriptor: [Patient Education as Topic] this term only
#3 MeSH descriptor: [Data Collection] explode all trees
#4 (adher* or nonadher* or complian* or comply* or noncomplian* or noncomply* or complier* or noncomplier* or accept* or nonaccept* or abandon* or co‐operat* or cooperat* or unco‐operative* or uncooperative* or nonco‐operat* or noncooperat* or satisfaction or dissatisfaction or persist* or educat* or questionnaire*):ti
#5 ((adher* or nonadher* or complian* or comply* or noncomplian* or noncomply* or complier* or noncomplier* or accept* or nonaccept* or abandon* or co‐operat* or cooperat* or unco‐operative* or uncooperative* or nonco‐operat* or noncooperat* or satisfaction or dissatisfaction or persist* or educat* or questionnaire*) near/6 (patient* or treatment* or therapy or therapies or medication* or drug*)):ab
#6 (patient* near/3 (dropout* or drop* out*))
#7 MeSH descriptor: [Treatment Refusal] this term only
#8 (treatment* near/3 refus*)
#9 #1 or #2 or #3 or #4 or #5 or #6 or #7 or #8
#10 MeSH descriptor: [Iron Chelating Agents] explode all trees
#11 MeSH descriptor: [Chelation Therapy] this term only
#12 (chelat* near/3 (treatment* or therap*))
#13 (deferoxamine* or deferoximine* or deferrioxamine* or desferioximine* or desferrioxamine* or desferroxamine* or desferal* or desferral* or DFO or desferin* or desferol* or dfom)
#14 (deferiprone or L1* or kelfer or DMHP or ferriprox or CP20 or dmohpo or hdmpp CPD or hdpp)
#15 (exjade* or deferasirox* or ICL 670* or icl670* or "CGP 72670")
#16 (iron near/5 (chelat* or reduc*))
#17 #10 or #11 or #12 or #13 or #14 or #15 or #16
#18 MeSH descriptor: [Thalassemia] explode all trees
#19 (thalassemi* or thalassaemi* or lepore or hydrops fetalis)
#20 ((hemoglobin or haemoglobin) near/3 disease)
#21 (hemochromatosis or haemochromatosis or hemosiderosis or haemosiderosis)
#22 ((mediterranean or erythroblastic or cooley*) next (anemi* or anaemi*))
#23 MeSH descriptor: [Iron Overload] explode all trees
#24 (iron near/3 (overload* or over‐load*))
#25 MeSH descriptor: [Hemoglobinopathies] this term only
#26 MeSH descriptor: [Hemoglobin C Disease] this term only
#27 (hemoglobinopath* or haemoglobinopath*)
#28 MeSH descriptor: [Anemia, Sickle Cell] explode all trees
#29 (barts and (blood or plasma))
#30 (sickle cell or sicklemi* or sickled or sickling or meniscocyt* or drepanocyt*)
#31 (hemoglobin S or hemoglobin SC or hemoglobin SE or hemoglobin SS or hemoglobin C or hemoglobin D or
haemoglobin S or haemoglobin SC or haemoglobin SE or haemoglobin SS or haemoglobin C or haemoglobin D Hb S or Hb SC or Hb SE or Hb SS or Hb C or Hb D or SC disease)
#32 #18 or #19 or #20 or #21 or #22 or #23 or #24 or #25 or #26 or #27 or #28 or #29 or #30 or #31
#33 #9 and #17 and #32
#34 ((thalassemi* or thalassaemi* or sickle or hemoglobinopath* or haemoglobinopath*) and (adher* or nonadher* or complian* or comply* or noncomplian* or noncomply* or complier* or noncomplier* or accept* or nonaccept* or co‐operat* or cooperat* or unco‐operative* or uncooperative* or nonco‐operat* or noncooperat* or satisfaction or dissatisfaction or educat*)):ti
#35 #33 or #34
PubMed (for Epub Ahead of Print, In‐Process & Other Non‐Indexed Citations only)
#1 ((adher* OR nonadher* OR complian* OR comply* OR noncomplian* OR noncomply* OR complier* OR noncomplier* OR accept* OR nonaccept* OR abandon* OR co‐operat* OR cooperat* OR unco‐operative* OR uncooperative* OR nonco‐operat* OR noncooperat* OR satisfaction OR dissatisfaction OR persist* OR educat* OR questionnaire*) AND (patient OR patients OR treatment* OR therapy OR therapies OR medication* OR drug*))
#2 (patient dropout* OR patient drop* outs OR patients drop* out OR treatment* refus* OR refus* treatment*)
#3 #1 OR #2
#4 (deferoxamine* OR deferoximine* OR deferrioxamine* OR desferioximine* OR desferrioxamine* OR desferroxamine* OR desferal* OR desferral* OR DFO OR desferin* OR desferol* OR dfom OR deferiprone OR L1 OR kelfer OR DMHP OR ferriprox OR CP20 OR dmohpo OR hdmpp CPD OR hdpp OR exjade* OR deferasirox* OR ICL 670* OR icl670* OR CGP "72670" OR iron chelat* OR iron reduc* OR chelat* treatment* OR chelat* therapy)
#5 (thalassemi* OR thalassaemi* OR lepore OR hydrops fetalis OR cooley* anemi* OR cooley* anaemi*)
#6 (hemoglobin disease OR haemoglobin disease OR hemochromatosis OR haemochromatosis OR hemosiderosis OR haemosiderosis)
#7 (mediterranean anemi* OR mediterranean anaemi* OR erythroblastic anemi* OR erythroblastic anaemi*)
#8 hemoglobinopath* OR haemoglobinopath* OR iron overload* OR iron over‐load*
#9 ("sickle cell" OR sicklemi* OR sickled OR sickling OR meniscocyt* OR drepanocyt* OR "hemoglobin S" OR "hemoglobin SC" OR "hemoglobin SE" OR "hemoglobin SS" OR "hemoglobin C" OR "hemoglobin D" OR "haemoglobin S" OR "haemoglobin SC" OR "haemoglobin SE" OR "haemoglobin SS" OR "haemoglobin C" OR "haemoglobin D" OR "Hb S" OR "Hb SC" OR "Hb SE" OR "Hb SS" OR "Hb C" OR "Hb D" OR "SC disease")
#10 #5 OR #6 OR #7 OR #8 OR #9
#11 #3 AND 4 AND #10
#12 ((adher*[TI] OR nonadher*[TI] OR complian*[TI] OR comply*[TI] OR noncomplian*[TI] OR noncomply*[TI] OR complier*[TI] OR noncomplier*[TI] OR accept*[TI] OR nonaccept*[TI] OR abandon*[TI] OR co‐operat*[TI] OR cooperat*[TI] OR unco‐operative*[TI] OR uncooperative*[TI] OR nonco‐operat*[TI] OR noncooperat*[TI] OR satisfaction[TI] OR dissatisfaction[TI] OR persist*[TI] OR educat*[TI] OR questionnaire*[TI]) AND (thalassemia*[TI] OR thalassaemia*[TI] OR sickle[TI] OR iron overload*[TI]))
#13 #11 OR #12
#14 (publisher[sb] OR inprocess[sb] OR pubmednotmedline[sb])
#15 #13 AND #14
MEDLINE (OvidSP)
1. exp "Patient Acceptance of Health Care"/
2. (px or ed).fs.
3. "Patient Education as Topic"/
4. exp Data Collection/
5. (adher* or nonadher* or complian* or comply* or noncomplian* or noncomply* or complier* or noncomplier* or accept* or nonaccept* or abandon* or co‐operat* or cooperat* or unco‐operative* or uncooperative* or nonco‐operat* or noncooperat* or satisfaction or dissatisfaction or persist* or educat* or questionnaire*).ti.
6. ((adher* or nonadher* or complian* or comply* or noncomplian* or noncomply* or complier* or noncomplier* or accept* or nonaccept* or abandon* or co‐operat* or cooperat* or unco‐operative* or uncooperative* or nonco‐operat* or noncooperat* or satisfaction or dissatisfaction or persist* or educat* or questionnaire*) adj6 (patient* or treatment* or therapy or therapies or medication* or drug*)).ab,kf.
7. (patient* adj3 (dropout* or drop* out*)).tw,kf.
8. Treatment Refusal/
9. (treatment* adj3 refus*).tw,kf.
10. or/1‐9
11. exp IRON CHELATING AGENTS/
12. CHELATION THERAPY/
13. (chelation adj3 (treatment* or therap*)).tw,kf.
14. (deferoxamine* or deferoximine* or deferrioxamine* or desferioximine* or desferrioxamine* or desferroxamine* or desferal* or desferral* or DFO or desferin* or desferol* or dfom).mp.
15. (deferiprone or L1* or kelfer or DMHP or ferriprox or CP20 or dmohpo or hdmpp CPD or hdpp).mp.
16. (exjade* or deferasirox* or ICL 670* or icl670* or "CGP 72670").mp.
17. (iron adj5 (chelat* or reduc*)).tw,kf.
18. or/11‐17
19. exp THALASSEMIA/
20. (thalass?emi* or lepore or hydrops fetalis).tw,kf.
21. ((hemoglobin or haemoglobin) adj3 disease).tw,kf.
22. (hemochromatosis or haemochromatosis or hemosiderosis or haemosiderosis).tw,kf.
23. ((mediterranean or erythroblastic or cooley*) adj (anemi* or anaemi*)).tw,kf.
24. exp IRON OVERLOAD/
25. (iron adj3 (overload* or over‐load*)).tw,kf.
26. exp HEMOGLOBINOPATHIES/
27. exp HEMOGLOBIN, SICKLE/
28. (hemoglobinopath* or haemoglobinopath*).tw,kf.
29. exp ANEMIA, SICKLE CELL/
30. (barts and (blood or plasma)).tw,kf.
31. (sickle or sicklemi* or sickled or sickling or meniscocyt* or drepanocyt*).tw,kf.
32. (h?emoglobin s or h?emoglobin sc or h?emoglobin se or h?emoglobin ss or h?emoglobin c or h?emoglobin d or Hb s or Hb sc or Hb se or Hb ss or Hb c or Hb d or sc disease*).tw,kf.
33. or/19‐32
34. 10 and 18 and 33
35. exp *Hemoglobinopathies/ or (thalass?emi* or sickle or hemoglobinopath* or haemoglobinopath*).ti.
36. exp *Patient Compliance/ or (adher* or nonadher* or complian* or comply* or noncomplian* or noncomply* or complier* or noncomplier* or accept* or nonaccept* or co‐operat* or cooperat* or unco‐operative* or uncooperative* or nonco‐operat* or noncooperat* or satisfaction or dissatisfaction or educat*).ti.
37. 35 and 36
38. 34 or 37
Embase (OvidSP)
1. exp THALASSEMIA/
2. (thalass?emi* or lepore or hydrops fetalis).tw,kf.
3. ((hemoglobin or haemoglobin) adj3 disease).tw,kf.
4. (hemochromatosis or haemochromatosis or hemosiderosis or haemosiderosis).tw,kf.
5. ((mediterranean or erythroblastic or cooley*) adj (anemi* or anaemi*)).tw,kf.
6. IRON OVERLOAD/
7. (iron adj3 (overload* or over‐load*)).tw,kf.
8. HEMOGLOBINOPATHY/
9. HEMOGLOBIN S/
10. (hemoglobinopath* or haemoglobinopath*).tw,kf.
11. exp SICKLE CELL ANEMIA/
12. (barts and (blood or plasma)).tw,kf.
13. (sickle or sicklemi* or sickled or sickling or meniscocyt* or drepanocyt*).tw,kf.
14. (h?emoglobin s or h?emoglobin sc or h?emoglobin se or h?emoglobin ss or h?emoglobin c or h?emoglobin d or Hb s or Hb sc or Hb se or Hb ss or Hb c or Hb d or sc disease*).tw,kf.
15. or/1‐14
16. exp PATIENT ATTITUDE/
17. PATIENT EDUCATION/
18. "PATIENT EDUCATION AS TOPIC"/
19. exp DATA COLLECTION METHOD/
20. (adher* or nonadher* or complian* or comply* or noncomplian* or noncomply* or complier* or noncomplier* or accept* or nonaccept* or abandon* or co‐operat* or cooperat* or unco‐operative* or uncooperative* or nonco‐operat* or noncooperat* or satisfaction or dissatisfaction or persist* or educat* or questionnaire*).ti.
21. ((adher* or nonadher* or complian* or comply* or noncomplian* or noncomply* or complier* or noncomplier* or accept* or nonaccept* or abandon* or co‐operat* or cooperat* or unco‐operative* or uncooperative* or nonco‐operat* or noncooperat* or satisfaction or dissatisfaction or persist* or educat* or questionnaire*) adj6 (patient* or treatment* or therapy or therapies or medication* or drug*)).ab,kf.
22. (patient* adj3 (dropout* or drop* out*)).tw.
23. (treatment* adj3 refus*).tw.
24. or/16‐23
25. IRON CHELATING AGENT/
26. CHELATION THERAPY/
27. (chelation adj3 (treatment* or therap*)).tw,kf.
28. (deferoxamine* or deferoximine* or deferrioxamine* or desferioximine* or desferrioxamine* or desferroxamine* or desferal* or desferral* or DFO or desferin* or desferol* or dfom).mp.
29. (deferiprone or L1* or kelfer or DMHP or ferriprox or cp20 or dmohpo or hdmpp CPD or hdpp).mp.
30. (exjade* or deferasirox* or (icl adj 670*) or icl670* or (cgp adj "72670")).mp.
31. (iron adj5 (chelat* or reduc*)).tw.
32. or/25‐31
33. 15 and 24 and 32
34. exp *Hemoglobinopathy/ or (thalass?emi* or sickle or hemoglobinopath* or haemoglobinopath*).ti.
35. exp *Patient Compliance/ or (adher* or nonadher* or complian* or comply* or noncomplian* or noncomply* or complier* or noncomplier* or accept* or nonaccept* or co‐operat* or cooperat* or unco‐operative* or uncooperative* or nonco‐operat* or noncooperat* or satisfaction or dissatisfaction or educat*).ti.
36. 34 and 35
37. 33 or 36
CINAHL (EBSCOHost)
S1 (MH "Patient Compliance+")
S2 (MH "Patient Education")
S3 (MH "Instrument by Type+")
S4 TI (adher* or nonadher* or complian* or comply* or noncomplian* or noncomply* or complier* or noncomplier* or accept* or nonaccept* or abandon* or co‐operat* or cooperat* or unco‐operative* or uncooperative* or nonco‐operat* or noncooperat* or satisfaction or dissatisfaction or persist* or educat* or questionnaire*)
S5 AB ((adher* or nonadher* or complian* or comply* or noncomplian* or noncomply* or complier* or noncomplier* or accept* or nonaccept* or abandon* or co‐operat* or cooperat* or unco‐operative* or uncooperative* or nonco‐operat* or noncooperat* or satisfaction or dissatisfaction or persist* or educat* or questionnaire*) N6 (patient* or treatment* or therapy or therapies or medication* or drug*))
S6 TX (patient* N3 (dropout* or drop* out*))
S7 MH Treatment Refusal
S8 TX (treatment* N3 refus*)
9 S1 OR S2 OR S3 OR S4 OR S5 OR S6 OR S7 OR S8
S10 (MH "Chelating Agents+")
S11 (MH "Chelation Therapy")
S12 TX (deferoxamine* or deferoximine* or deferrioxamine* or desferioximine* or desferrioxamine* or desferroxamine* or desferal* or desferral* or DFO or desferin* or desferol* or dfom)
S13 TX (deferiprone or L1* or kelfer or DMHP or ferriprox or CP20 or dmohpo or hdmpp CPD or hdpp)
S14 TX (exjade* or deferasirox* or ICL 670* or icl670* or "CGP 72670")
S15 TX (iron N5 (chelat* or reduc*)) OR TX (chelat* N3 (treatment* or therap*))
S16 S10 OR S11 OR S12 OR S13 OR S14 OR S15
S17 (MH "Thalassemia+")
S18 TX (thalassemi* or thalassaemi* or lepore or hydrops fetalis)
S19 TX ((hemoglobin or haemoglobin) N3 disease)
S20 TX (hemochromatosis or haemochromatosis or hemosiderosis or haemosiderosis)
S21 TX ((mediterranean or erythroblastic or cooley*) N1 (anemi* or anaemi*))
S22 (MH "Iron Overload+")
S23 TX (iron N3 (overload* or over‐load*))
S24 (MH "Hemoglobinopathies")
S25 TX (hemoglobinopath* or haemoglobinopath*)
S26 (MH "Anemia, Sickle Cell+")
S27 TX (barts and (blood or plasma))
S28 TX (sickle OR sicklemi* OR sickled OR sickling OR meniscocyt* OR drepanocyt* OR "hemoglobin S" OR "hemoglobin SC" OR "hemoglobin SE" OR "hemoglobin SS" OR "hemoglobin C" OR "hemoglobin D" OR "haemoglobin S" OR "haemoglobin SC" OR "haemoglobin SE" OR "haemoglobin SS" OR "haemoglobin C" OR "haemoglobin D" OR "Hb S" OR "Hb SC" OR "Hb SE" OR "Hb SS" OR "Hb C" OR "Hb D" OR "SC disease")
S29 S17 OR S18 OR S19 OR S20 OR S21 OR S22 OR S23 OR S24 OR S25 OR S26 OR S27 OR S28
S30 S9 AND S16 AND S29
S31 (MM "Patient Compliance+")
S32 TI (adher* or nonadher* or complian* or comply* or noncomplian* or noncomply* or complier* or noncomplier* or accept* or nonaccept* or co‐operat* or cooperat* or unco‐operative* or uncooperative* or nonco‐operat* or noncooperat* or satisfaction or dissatisfaction or educat*)
S33 S31 OR S32
S34 (MM "Hemoglobinopathies+")
S35 TI (thalassemi* or thalassaemi* or sickle or hemoglobinopath* or haemoglobinopath*)
S36 S34 OR S35
S37 S33 AND S36
S38 S30 OR S37
ProQuest Dissertations & Theses Global
ti(adher* OR nonadher* OR complian* OR comply* OR noncomplian* OR noncomply* OR complier* OR noncomplier* OR accept* OR nonaccept* OR abandon* OR co‐operat* OR cooperat* OR unco‐operative* OR uncooperative* OR nonco‐operat* OR noncooperat* OR satisfaction OR dissatisfaction OR refus* OR persist* OR educat* OR questionnaire*) AND ti(thalassemia OR thalassaemia OR sickle OR sickled OR sickling OR iron overload OR hemoglobinopath*) AND (chelation OR chelating OR deferiprone OR deferoxamine OR deferasirox OR DFO OR ferriprox OR exjade OR iron reduction)
PsycINFO (EBSCOHost) & Psychology and Behavioral Sciences Collection (EBSCOHost)
S1 DE "Treatment Compliance" OR DE "Compliance" OR DE "Treatment Refusal" OR DE "Treatment Dropouts" OR DE "Treatment Termination"
S2 DE "Client Education"
S3 DE "Questionnaires" OR DE "General Health Questionnaire"
S4 TI (adher* or nonadher* or complian* or comply* or noncomplian* or noncomply* or complier* or noncomplier* or accept* or nonaccept* or abandon* or co‐operat* or cooperat* or unco‐operative* or uncooperative* or nonco‐operat* or noncooperat* or satisfaction or dissatisfaction or persist* or educat* or questionnaire*)
S5 AB ((adher* or nonadher* or complian* or comply* or noncomplian* or noncomply* or complier* or noncomplier* or accept* or nonaccept* or abandon* or co‐operat* or cooperat* or unco‐operative* or uncooperative* or nonco‐operat* or noncooperat* or satisfaction or dissatisfaction or persist* or educat* or questionnaire*) N6 (patient* or treatment* or therapy or therapies or medication* or drug*))
S6 TX (patient* N3 (dropout* or drop* out*))
S7 DE Treatment Refusal
S8 TX (treatment* N3 refus*)
S9 S1 OR S2 OR S3 OR S4 OR S5 OR S6 OR S7 OR S8
S10 TX (deferoxamine* or deferoximine* or deferrioxamine* or desferioximine* or desferrioxamine* or desferroxamine* or desferal* or desferral* or DFO or desferin* or desferol* or dfom)
S11 TX (deferiprone or L1* or kelfer or DMHP or ferriprox or CP20 or dmohpo or hdmpp CPD or hdpp)
S12 TX (exjade* or deferasirox* or ICL 670* or icl670* or "CGP 72670")
S13 TX (iron N5 (chelat* or reduc*)) OR TX (chelat* N3 (treatment* or therap*))
S14 S10 OR S11 OR S12 OR S13
S15 TX (thalassemi* or thalassaemi* or lepore or hydrops fetalis)
S16 TX ((hemoglobin or haemoglobin) N3 disease)
S17 TX (hemochromatosis or haemochromatosis or hemosiderosis or haemosiderosis)
S18 TX ((mediterranean or erythroblastic or cooley*) N1 (anemi* or anaemi*))
S19 TX (iron N3 (overload* or over‐load*))
S20 TX (hemoglobinopath* or haemoglobinopath*)
S21 DE "Sickle Cell Disease"
S22 TX (barts and (blood or plasma))
S23 TX (sickle OR sicklemi* OR sickled OR sickling OR meniscocyt* OR drepanocyt* OR "hemoglobin S" OR
"hemoglobin SC" OR "hemoglobin SE" OR "hemoglobin SS" OR "hemoglobin C" OR "hemoglobin D" OR "haemoglobin S" OR "haemoglobin SC" OR "haemoglobin SE" OR "haemoglobin SS" OR "haemoglobin C" OR "haemoglobin D" OR "Hb S" OR "Hb SC" OR "Hb SE" OR "Hb SS" OR "Hb C" OR "Hb D" OR "SC disease")
S24 S15 OR S16 OR S17 OR S18 OR S19 OR S20 OR S21 OR S22 OR S23
S25 S9 AND S14 AND S24
S26 MM "Treatment Compliance"
S27 TI (adher* or nonadher* or complian* or comply* or noncomplian* or noncomply* or complier* or noncomplier* or accept* or nonaccept* or co‐operat* or cooperat* or unco‐operative* or uncooperative* or nonco‐operat* or noncooperat* or satisfaction or dissatisfaction or educat*)
S28 S26 OR S27
S29 MM "Sickle Cell Disease"
S30 TI (thalassemi* or thalassaemi* or sickle or hemoglobinopath* or haemoglobinopath*)
31 S29 OR S30
S32 S28 AND S31
S33 S25 OR S32
Web of Science CPCI‐S & CPSSI
#1 TS=((adher* OR nonadher* OR complian* OR comply* OR noncomplian* OR noncomply* OR complier* OR noncomplier* OR accept* OR nonaccept* OR abandon* OR co‐operat* OR cooperat* OR unco‐operative* OR uncooperative* OR nonco‐operat* OR noncooperat* OR satisfaction OR dissatisfaction OR persist* OR educat* OR questionnaire*) AND (patient* OR treatment* OR therapy OR therapies OR medication* OR drug*))
#2 TS=(patient dropout* OR patient drop* outs OR patients drop* out OR treatment* refus* OR refus* treatment*)
#3 #1 OR #2
#4 TS=(deferoxamine* OR deferoximine* OR deferrioxamine* OR desferioximine* OR desferrioxamine* OR desferroxamine* OR desferal* OR desferral* OR DFO OR desferin* OR desferol* OR dfom OR deferiprone OR L1 OR kelfer OR DMHP OR ferriprox OR CP20 OR dmohpo OR hdmpp CPD OR hdpp OR exjade* OR deferasirox* OR ICL 670* OR icl670* OR CGP "72670" OR iron chelat* OR iron reduc* OR chelat* treatment* OR chelat* therap*)
#5 TS=(thalassemi* OR thalassaemi* OR lepore OR hydrops fetalis OR cooley* anemi* OR cooley* anaemi* OR hemoglobin disease OR haemoglobin disease OR hemochromatosis OR haemochromatosis OR hemosiderosis OR haemosiderosis OR mediterranean anemi* OR mediterranean anaemi* OR erythroblastic anemi* OR erythroblastic anaemi* OR iron overload* OR iron over‐load* OR hemoglobinopath* OR haemoglobinopath*)
#6 TS=(sickle OR sicklemi* OR sickled OR sickling OR meniscocyt* OR drepanocyt* OR "hemoglobin S" OR "hemoglobin SC" OR "hemoglobin SE" OR "hemoglobin SS" OR "hemoglobin C" OR "hemoglobin D" OR "haemoglobin S" OR "haemoglobin SC" OR "haemoglobin SE" OR "haemoglobin SS" OR "haemoglobin C" OR "haemoglobin D" OR "Hb S" OR "Hb SC" OR "Hb SE" OR "Hb SS" OR "Hb C" OR "Hb D" OR "SC disease")
#7 #5 OR #6
#8 #3 AND #4 AND #7
ClinicalTrials.gov
Other Terms: (thalassemia OR sickle cell anemia OR iron overload OR hemoglobinopathies) AND (iron chelation OR chelation therapy OR deferiprone OR deferoxamine OR deferasirox OR DFO OR iron reduction)
WHO ICTRP
Condition: thalassemia OR sickle cell anemia OR iron overload OR hemoglobinopathies
Intervention: iron chelation OR chelation therapy OR deferiprone OR deferoxamine OR deferasirox OR DFO OR iron reduction
ISRCTN
Condition: thalassemia OR sickle cell anemia OR iron overload OR hemoglobinopathies
Interventions: iron chelation OR chelation therapy OR deferiprone OR deferoxamine OR deferasirox OR DFO OR iron reduction
Appendix 2. The Risk Of Bias In Non‐randomised Studies of Interventions (ROBINS‐I) assessment tool
ROBINS‐I tool (Stage I)
Specify the review question
| Participants | |
| Experimental intervention | |
| Control intervention | |
| Outcomes |
List the confounding areas relevant to all or most studies
List the possible co‐interventions that could be different between intervention groups and could have an impact on outcomes
The ROBINS‐I tool (Stage II): For each study
Specify a target trial specific to the study.
| Design | Individually randomised or cluster randomised or matched |
| Participants | |
| Experimental intervention | |
| Control intervention |
Is your aim for this study...?
□ to assess the effect of initiating intervention (as in an intention‐to‐treat analysis)
□ to assess the effect of initiating and adhering to intervention (as in a per protocol analysis)
Specify the outcome
Specify which outcome is being assessed for risk of bias (typically from among those earmarked for the Summary of Findings table). Specify whether this is a proposed benefit or harm of intervention.
Specify the numerical result being assessed
In case of multiple alternative analyses being presented, specify the numeric result (e.g. RR = 1.52 (95% CI 0.83 to 2.77) or a reference (e.g. to a table, figure or paragraph) that uniquely defines the result being assessed (or both).
Preliminary consideration of confounders
Complete a row for each important confounding area (i) listed in the review protocol; and (ii) relevant to the setting of this particular study, or which the study authors identified as potentially important.
'Important' confounding areas are those for which, in the context of this study, adjustment is expected to lead to a clinically important change in the estimated effect of the intervention. 'Validity' refers to whether the confounding variable or variables fully measure the area, while 'reliability' refers to the precision of the measurement (more measurement error means less reliability).
| (i) Confounding areas listed in the review protocol | ||||
| Confounding area | Measured variable(s) | Is there evidence that controlling for this variable was unnecessary?* | Is the confounding area measured validly and reliably by this variable (or these variables)? | OPTIONAL: is adjusting for this variable (alone) expected to favour the experimental or the control group? |
| Yes / No / No information | Favour intervention / Favour control / No information | |||
| (ii) Additional confounding areas relevant to the setting of this particular study, or which the study authors identified as important | ||||
| Confounding area | Measured Variable(s) | Is there evidence that controlling for this variable was unnecessary?* | Is the confounding area measured validly and reliably by this variable (or these variables)? | OPTIONAL: is adjusting for this variable (alone) expected to favour the experimental or the control group? |
| Yes / No / No information | Favour intervention / Favour control / No information | |||
* In the context of a particular study, variables can be demonstrated not to be confounders and so not included in the analysis: (a) if they are not predictive of the outcome; (b) if they are not predictive of intervention; or (c) because adjustment makes no or minimal difference to the estimated effect of the primary parameter. Note that “no statistically significant association” is not the same as “not predictive”.
Preliminary consideration of co‐interventions
Complete a row for each important co‐intervention (i) listed in the review protocol; and (ii) relevant to the setting of this particular study, or which the study authors identified as important.
'Important' co‐interventions are those for which, in the context of this study, adjustment is expected to lead to a clinically important change in the estimated effect of the intervention.
| (i) Co‐interventions listed in the review protocol | ||
| Co‐intervention | Is there evidence that controlling for this co‐intervention was unnecessary (e.g. because it was not administered)? | Is presence of this co‐intervention likely to favour outcomes in the experimental or the control group |
| Favour experimental / Favour comparator / No information | ||
| Favour experimental / Favour comparator / No information | ||
| Favour experimental / Favour comparator / No information | ||
| (ii) Additional co‐interventions relevant to the setting of this particular study, or which the study authors identified as important | ||
| Co‐intervention | Is there evidence that controlling for this co‐intervention was unnecessary (e.g. because it was not administered)? | Is presence of this co‐intervention likely to favour outcomes in the experimental or the control group |
| Favour experimental / Favour comparator / No information | ||
| Favour experimental / Favour comparator / No information | ||
| Favour experimental / Favour comparator / No information | ||
Risk of bias assessment (cohort‐type studies)
| Bias domain | Signalling questions | Elaboration | Response options |
| Bias due to confounding | 1.1 Is there potential for confounding of the effect of intervention in this study? IfN or PN to1.1: the study can be considered to be at low risk of bias due to confounding and no further signalling questions need be considered | In rare situations, such as when studying harms that are very unlikely to be related to factors that influence treatment decisions, no confounding is expected and the study can be considered to be at low risk of bias due to confounding, equivalent to a fully randomised trial. There is no NI (No information) option for this signalling question. | Y / PY / PN / N |
| If Y or PY to 1.1: determine whether there is a need to assess time‐varying confounding: | |||
| 1.2. Was the analysis based on splitting participants’ follow up time according to intervention received? If N orPN, answer questions relating to baseline confounding (1.4 to 1.6) If Y orPY, proceed to question 1.3. | If participants could switch between intervention groups then associations between intervention and outcome may be biased by time‐varying confounding. This occurs when prognostic factors influence switches between intended interventions. | NA / Y / PY / PN / N / NI | |
| 1.3. Were intervention discontinuations or switches likely to be related to factors that are prognostic for the outcome? If N or PN, answer questions relating to baseline confounding (1.4 to 1.6) If Y orPY, answer questions relating to both baseline and time‐varying confounding (1.7 and 1.8) | If intervention switches are unrelated to the outcome, for example when the outcome is an unexpected harm, then time‐varying confounding will not be present and only control for baseline confounding is required. | NA / Y / PY / PN / N / NI | |
| Questions relating to baseline confounding only | |||
| 1.4. Did the authors use an appropriate analysis method that controlled for all the important confounding areas? | Appropriate methods to control for measured confounders include stratification, regression, matching, standardization, and inverse probability weighting. They may control for individual variables or for the estimated propensity score. Inverse probability weighting is based on a function of the propensity score. Each method depends on the assumption that there is no unmeasured or residual confounding. | NA / Y / PY / PN / N / NI | |
| 1.5.If Y or PY to1.4: were confounding areas that were controlled for measured validly and reliably by the variables available in this study? | Appropriate control of confounding requires that the variables adjusted for are valid and reliable measures of the confounding domains. For some topics, a list of valid and reliable measures of confounding domains will be specified in the review protocol but for others such a list may not be available. Study authors may cite references to support the use of a particular measure. If authors control for confounding variables with no indication of their validity or reliability pay attention to the subjectivity of the measure. Subjective measures (e.g. based on self‐report) may have lower validity and reliability than objective measures such as lab findings. | NA / Y / PY / PN / N / NI | |
| 1.6. Did the authors control for any post‐intervention variables? | Controlling for post‐intervention variables is not appropriate. Controlling for mediating variables estimates the direct effect of intervention and may introduce confounding. Controlling for common effects of intervention and outcome causes bias. | NA / Y / PY / PN / N / NI | |
| Questions relating to baseline and time‐varying confounding | |||
| 1.7. Did the authors use an appropriate analysis method that adjusted for all the important confounding areas and for time‐varying confounding? | Adjustment for time‐varying confounding is necessary to estimate per‐protocol effects in both randomised trials and NRSI. Appropriate methods include those based on inverse‐probability weighting. Standard regression models that include time‐updated confounders may be problematic if time‐varying confounding is present. | NA / Y / PY / PN / N / NI | |
| 1.8. IfY orPY to1.7: Were confounding areas that were adjusted for measured validly and reliably by the variables available in this study? | See 1.5 above. | NA / Y / PY / PN / N / NI | |
| Risk of bias judgement | Low ‐ no confounding expected. | Low / Moderate / Serious / Critical / NI | |
| Moderate ‐ confounding expected, all known important confounding domains appropriately measured and controlled for; and Reliability and validity of measurement of important domains were sufficient, such that we do not expect serious residual confounding. | |||
| Serious ‐ at least one known important domain was not appropriately measured, or not controlled for; or Reliability or validity of measurement of a important domain was low enough that we expect serious residual confounding. | |||
| Critical ‐ confounding inherently not controllable, or the use of negative controls strongly suggests unmeasured confounding. | |||
| Optional: what is the predicted direction of bias due to confounding? | Can the true effect estimate be predicted to be greater or less than the estimated effect in the study because one or more of the important confounding domains was not controlled for? Answering this question will be based on expert knowledge and results in other studies and therefore can only be completed after all of the studies in the body of evidence have been reviewed. Consider the potential effect of each of the unmeasured domains and whether all important confounding domains not controlled for in the analysis would be likely to change the estimate in the same direction, or if one important confounding domain that was not controlled for in the analysis is likely to have a dominant impact. | Favours experimental / Favours comparator / Unpredictable | |
| Bias in selection of participants into the study | 2.1. Was selection of participants into the study (or into the analysis) based on participant characteristics observed after the start of intervention? | This domain is concerned only with selection into the study based on participant characteristics observed after the start of intervention. Selection based on characteristics observed before the start of intervention can be addressed by controlling for imbalances between intervention and control groups in baseline characteristics that are prognostic for the outcome (baseline confounding). | Y / PY / PN / N / NI |
| IfN orPN to2.1: go to 2.4 | |||
| 2.2. IfY orPY to2.1: were the post‐intervention variables that influenced selection likely to be associated with intervention | Selection bias occurs when selection is related to an effect of either intervention or a cause of intervention and an effect of either the outcome or a cause of the outcome. Therefore, the result is at risk of selection bias if selection into the study is related to both the intervention and the outcome. | NA / Y / PY / PN / N / NI | |
| 2.3 If Y orPY to2.2: were the post‐intervention variables that influenced selection likely to be influenced by the outcome or a cause of the outcome? | NA / Y / PY / PN / N / NI | ||
| 2.4. Do start of follow up and start of intervention coincide for most participants? | If participants are not followed from the start of the intervention then a period of follow up has been excluded, and individuals who experienced the outcome soon after intervention will be missing from analyses. This problem may occur when prevalent, rather than new (incident), users of the intervention are included in analyses. | Y / PY / PN / N / NI | |
| 2.5. IfY orPY to2.2 and2.3, or N orPN to 2.4: were adjustment techniques used that are likely to correct for the presence of selection biases? | It is in principle possible to correct for selection biases, for example by using inverse probability weights to create a pseudo‐population in which the selection bias has been removed, or by modelling the distributions of the missing participants or follow up times and outcome events and including them using missing data methodology. However such methods are rarely used and the answer to this question will usually be “No” | NA / Y / PY / PN / N / NI | |
| Risk of bias judgement | Low ‐ all participants who would have been eligible for the target trial were included in the study and start of follow up and start of intervention coincide for all subjects. | Low / Moderate / Serious / Critical / NI | |
| Moderate ‐ selection into the study may have been related to intervention and outcome, but the authors used appropriate methods to adjust for the selection bias; or Start of follow up and start of intervention do not coincide for all participants, but (a) the proportion of participants for which this was the case was too low to induce important bias; (b) the authors used appropriate methods to adjust for the selection bias; or (c) the review authors are confident that the rate (hazard) ratio for the effect of intervention remains constant over time. | |||
| Serious ‐ selection into the study was related to intervention and outcome; or Start of follow up and start of intervention do not coincide, and a potentially important amount of follow‐up time is missing from analyses, and the rate ratio is not constant over time. | |||
| Critical ‐ selection into the study was strongly related to intervention and outcome; or A substantial amount of follow‐up time is likely to be missing from analyses, and the rate ratio is not constant over time. | |||
| Optional: what is the predicted direction of bias due to selection of participants into the study? | If the likely direction of bias can be predicted, it is helpful to state this. The direction might be characterized either as being towards (or away from) the null, or as being in favour of one of the interventions. | Favours experimental / Favours comparator / Towards null /Away from null / Unpredictable | |
| Bias in classification of interventions | 3.1 Were intervention groups clearly defined? | A pre‐requisite for an appropriate comparison of interventions is that the interventions are well defined. Ambiguity in the definition may lead to bias in the classification of participants. For individual‐level interventions, criteria for considering individuals to have received each intervention should be clear and explicit, covering issues such as type, setting, dose, frequency, intensity and/or timing of intervention. For population‐level interventions (e.g. measures to control air pollution), the question relates to whether the population is clearly defined, and the answer is likely to be ‘Yes’. | Y / PY / PN / N / NI |
| 3.2 Was the information used to define intervention groups recorded at the start of the intervention? | In general, if information about interventions received is available from sources that could not have been affected by subsequent outcomes, then differential misclassification of intervention status is unlikely. Collection of the information at the time of the intervention makes it easier to avoid such misclassification. For population‐level interventions (e.g. measures to control air pollution), the answer to this question is likely to be ‘Yes’. | Y / PY / PN / N / NI | |
| 3.3 Could classification of intervention status have been affected by knowledge of the outcome or risk of the outcome? | Collection of the information at the time of the intervention may not be sufficient to avoid bias. The way in which the data are collected for the purposes of the NRSI should also avoid misclassification. | Y / PY / PN / N / NI | |
| Risk of bias judgement | Low ‐ intervention status is well defined and based solely on information collected at the time of intervention. | Low / Moderate / Serious / Critical / NI | |
| Moderate ‐ intervention status is well defined but some aspects of the assignments of intervention status were determined retrospectively | |||
| Serious ‐ intervention status is not well defined, or major aspects of the assignments of intervention status were determined in a way that could have been affected by knowledge of the outcome. | |||
| Critical ‐ (unusual) An extremely high amount of misclassification of intervention status, e.g. because of unusually strong recall biases. | |||
| Optional: what is the predicted direction of bias due to measurement of outcomes or interventions? | If the likely direction of bias can be predicted, it is helpful to state this. The direction might be characterized either as being towards (or away from) the null, or as being in favour of one of the interventions. | Favours experimental / Favours comparator / Towards null /Away from null / Unpredictable | |
| Bias due to departures from intended interventions | 4.1. Was the intervention implemented successfully for most participants? | Consider the success of implementation of the intervention in the context of its complexity. Was recommended practice followed by those administering the intervention? | Y / PY / PN / N / NI |
| If your aim for this study is to assess the effect of initiating and adhering to intervention (as in a per‐protocol analysis), answer questions 4.2 to 4.4 | |||
| 4.2. Did study participants adhere to the assigned intervention regimen? | Lack of adherence to assigned intervention includes cessation of intervention, crossovers to the comparator intervention and switches to another active intervention. We distinguish between analyses where: (1) intervention switches led to follow up time being assigned to the new intervention; and (2) intervention switches (including cessation of intervention) where follow up time remained allocated to the original intervention; (3) is addressed under time‐varying confounding, and should not be considered further here. Consider available information on the proportion of study participants who continued with their assigned intervention throughout follow up. Was lack of adherence sufficient to impact the intervention effect estimate? | NA/ Y / PY / PN / N / NI | |
| 4.3. Were important co‐interventions balanced across intervention groups? | Consider the co‐interventions that are likely to affect the outcome and to have been administered in the context of this study, based on the preliminary consideration of co‐interventions and available literature. Consider whether these co‐interventions are balanced between intervention groups. | NA/ Y / PY / PN / N / NI | |
| 4.4. IfN orPN to4.1, 4.2 or4.3: were adjustment techniques used that are likely to correct for these issues? | Such adjustment techniques include inverse‐probability weighting to adjust for censoring at deviation from intended intervention, or inverse probability weighting of marginal structural models to adjust for time‐varying confounding. Specialist advice may be needed to assess studies that used these approaches. | NA / Y / PY / PN / N / NI | |
| Risk of bias judgement | Low ‐ no bias due to deviation from the intended intervention is expected, for example if both the intervention and comparator are implemented over a short time period, and subsequent interventions are part of routine medical care, or if the specified comparison relates to initiation of intervention regardless of whether it is continued. | Low / Moderate / Serious / Critical / NI | |
| Moderate ‐ bias due to deviation from the intended intervention is expected, and switches, co‐interventions, and some problems with intervention fidelity are appropriately measured and adjusted for in the analyses. Alternatively, most (but not all) deviations from intended intervention reflect the natural course of events after initiation of intervention. | |||
| Serious ‐ switches in treatment, co‐interventions, or problems with implementation fidelity are apparent and are not adjusted for in the analyses. | |||
| Critical ‐ substantial deviations from the intended intervention are present and are not adjusted for in the analysis. | |||
| Optional: what is the predicted direction of bias due to departures from the intended interventions? | If the likely direction of bias can be predicted, it is helpful to state this. The direction might be characterized either as being towards (or away from) the null, or as being in favour of one of the interventions. | Favours experimental / Favours comparator / Towards null /Away from null / Unpredictable | |
| Bias due to missing data | 5.1 Were there missing outcome data? | This aims to elicit whether the proportion of missing observations is likely to result in missing information that could substantially impact our ability to answer the question being addressed. Guidance will be needed on what is meant by ‘reasonably complete’. One aspect of this is that review authors would ideally try and locate an analysis plan for the study. | Y / PY / PN / N / NI |
| 5.2 Were participants excluded due to missing data on intervention status? | Missing intervention status may be a problem. This requires that the intended study sample is clear, which it may not be in practice. | Y / PY / PN / N / NI | |
| 5.3 Were participants excluded due to missing data on other variables needed for the analysis? | This question relates particularly to participants excluded from the analysis because of missing information on confounders that were controlled for in the analysis. | Y / PY / PN / N / NI | |
| 5.4 If Y orPY to 5.1, 5.2 or5.3: are the proportion of participants and reasons for missing data similar across interventions? | This aims to elicit whether either (i) differential proportion of missing observations or (ii) differences in reasons for missing observations could substantially impact on our ability to answer the question being addressed. | NA / Y / PY / PN / N / NI | |
| 5.5If Y or PY to5.1, 5.2 or5.3: were appropriate statistical methods used to account for missing data? | It is important to assess whether assumptions employed in analyses are clear and plausible. Both content knowledge and statistical expertise will often be required for this. For instance, use of a statistical method such as multiple imputation does not guarantee an appropriate answer. Review authors should seek naïve (complete‐case) analyses for comparison, and clear differences between complete‐case and multiple imputation‐based findings should lead to careful assessment of the validity of the methods used. | NA / Y / PY / PN / N / NI | |
| Risk of bias judgement | Low ‐ data were reasonably complete; or Proportions of and reasons for missing participants were similar across intervention groups; or Analyses that addressed missing data are likely to have removed any risk of bias. | Low / Moderate / Serious / Critical / NI | |
| Moderate ‐ proportions of missing participants differ across interventions; or Reasons for missingness differ minimally across interventions; and Missing data were not addressed in the analysis. | |||
| Serious ‐ proportions of missing participants differ substantially across interventions; or Reasons for missingness differ substantially across interventions; and Missing data were addressed inappropriately in the analysis; or The nature of the missing data means that the risk of bias cannot be removed through appropriate analysis. | |||
| Critical ‐ (unusual) There were critical differences between interventions in participants with missing data that were not, or could not, be addressed through appropriate analysis. | |||
| Optional: what is the predicted direction of bias due to missing data? | If the likely direction of bias can be predicted, it is helpful to state this. The direction might be characterized either as being towards (or away from) the null, or as being in favour of one of the interventions. | Favours experimental / Favours comparator / Towards null /Away from null / Unpredictable | |
| Bias in measurement of outcomes | 6.1 Could the outcome measure have been influenced by knowledge of the intervention received? | Some outcome measures involve negligible assessor judgment, e.g. all‐cause mortality or non‐repeatable automated laboratory assessments. Risk of bias due to measurement of these outcomes would be expected to be low. | Y / PY / PN / N / NI |
| 6.2 Were outcome assessors aware of the intervention received by study participants? | If outcome assessors were blinded to intervention status, the answer to this question would be ‘No’. In other situations, outcome assessors may be unaware of the interventions being received by participants despite there being no active blinding by the study investigators; the answer this question would then also be ‘No’. In studies where participants report their outcomes themselves, for example in a questionnaire, the outcome assessor is the study participant. In an observational study, the answer to this question will usually be ‘Yes’ when the participants report their outcomes themselves. | Y / PY / PN / N / NI | |
| 6.3 Were the methods of outcome assessment comparable across intervention groups? | Comparable assessment methods (i.e. data collection) would involve the same outcome detection methods and thresholds, same time point, same definition, and same measurements | Y / PY / PN / N / NI | |
| 6.4 Were any systematic errors in measurement of the outcome related to intervention received? | This question refers to differential misclassification of outcomes. Systematic errors in measuring the outcome, if present, could cause bias if they are related to intervention or to a confounder of the intervention‐outcome relationship. This will usually be due either to outcome assessors being aware of the intervention received or to non‐comparability of outcome assessment methods, but there are examples of differential misclassification arising despite these controls being in place. | Y / PY / PN / N / NI | |
| Risk of bias judgement | Low ‐ the methods of outcome assessment were comparable across intervention groups; and The outcome measure was unlikely to be influenced by knowledge of the intervention received by study participants (i.e. is objective) or the outcome assessors were unaware of the intervention received by study participants; and Any error in measuring the outcome is unrelated to intervention status. | Low / Moderate / Serious / Critical / NI | |
| Moderate ‐ the methods of outcome assessment were comparable across intervention groups; and The outcome measure is only minimally influenced by knowledge of the intervention received by study participants; and Any error in measuring the outcome is only minimally related to intervention status. | |||
| Serious ‐ the methods of outcome assessment were not comparable across intervention groups; or The outcome measure was subjective (i.e. likely to be influenced by knowledge of the intervention received by study participants) and was assessed by outcome assessors aware of the intervention received by study participants; or Error in measuring the outcome was related to intervention status. | |||
| Critical ‐ the methods of outcome assessment were so different that they cannot reasonably be compared across intervention groups. | |||
| Optional: what is the predicted direction of bias due to measurement of outcomes? | If the likely direction of bias can be predicted, it is helpful to state this. The direction might be characterized either as being towards (or away from) the null, or as being in favour of one of the interventions. | Favours experimental / Favours comparator / Towards null /Away from null / Unpredictable | |
| Bias in selection of the reported result | Is the reported effect estimate unlikely to be selected, on the basis of the results, from... | ||
| 7.1. ... multiple outcome measurements within the outcome domain? | For a specified outcome domain, it is possible to generate multiple effect estimates for different measurements. If multiple measurements were made, but only one or a subset is reported, there is a risk of selective reporting on the basis of results. | Y / PY / PN / N / NI | |
| 7.2 ... multiple analyses of the intervention‐outcome relationship? | Because of the limitations of using data from non‐randomized studies for analyses of effectiveness (need to control confounding, substantial missing data, etc), analysts may implement different analytic methods to address these limitations. Examples include unadjusted and adjusted models; use of final value vs change from baseline vs analysis of covariance; different transformations of variables; a continuously scaled outcome converted to categorical data with different cutpoints; different sets of covariates used for adjustment; and different analytic strategies for dealing with missing data. Application of such methods generates multiple effect estimates for a specific outcome metric. If the analyst does not prespecify the methods to be applied, and multiple estimates are generated but only one or a subset is reported, there is a risk of selective reporting on the basis of results. | Y / PY / PN / N / NI | |
| 7.3 ... different subgroups? | Particularly with large cohorts often available from routine data sources, it is possible to generate multiple effect estimates for different subgroups or simply to omit varying proportions of the original cohort. If multiple estimates are generated but only one or a subset is reported, there is a risk of selective reporting on the basis of results. | Y / PY / PN / N / NI | |
| Risk of bias judgement | Low ‐ there is clear evidence (usually through examination of a pre‐registered protocol or statistical analysis plan) that all reported results correspond to all intended outcomes, analyses and sub‐cohorts. | Low / Moderate / Serious / Critical / NI | |
| Moderate ‐ the outcome measurements and analyses are consistent with an a priori plan; or are clearly defined and both internally and externally consistent; and there is no indication of selection of the reported analysis from among multiple analyses; and there is no indication of selection of the cohort or subgroups for analysis and reporting on the basis of the results. | |||
| Serious ‐ outcome measurements or analyses are internally or externally inconsistent; or There is a high risk of selective reporting from among multiple analyses; or The cohort or subgroup is selected from a larger study for analysis and appears to be reported on the basis of the results. | |||
| Critical ‐ there is evidence or strong suspicion of selective reporting of results, and the unreported results are likely to be substantially different from the reported results. | |||
| Optional: What is the predicted direction of bias due to selection of the reported result? | If the likely direction of bias can be predicted, it is helpful to state this. The direction might be characterized either as being towards (or away from) the null, or as being in favour of one of the interventions. | Favours experimental / Favours comparator / Towards null /Away from null / Unpredictable | |
| Overall bias | Risk of bias judgement | Low ‐ the study is judged to be at low risk of bias for all domains. | Low / Moderate / Serious / Critical / NI |
| Moderate ‐ the study is judged to be at low or moderate risk of bias for all domains. | |||
| Serious ‐ the study is judged to be at serious risk of bias in at least one domain, but not at critical risk of bias in any domain. | |||
| Critical ‐ the study is judged to be at critical risk of bias in at least one domain. | |||
| No information ‐ there is no clear indication that the study is at serious or critical risk of bias and there is a lack of information in one or more key domains of bias (a judgement is required for this). | |||
| Optional: what is the overall predicted direction of bias for this outcome? | Favours experimental / Favours comparator / Towards null /Away from null / Unpredictable | ||

Risk of bias graph: review authors' judgements about each risk of bias item presented as percentages across all included studies.
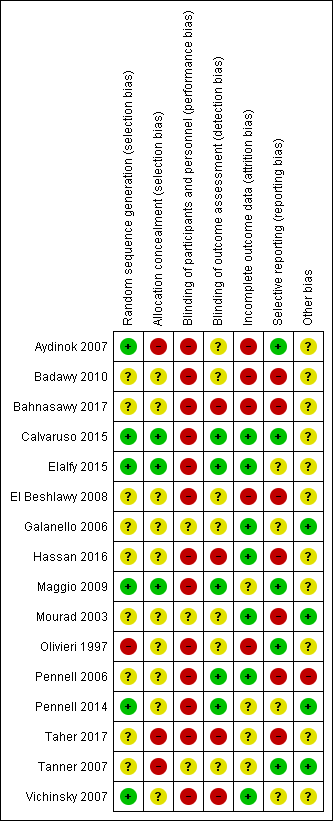
Risk of bias summary: review authors' judgements about each risk of bias item for each included study.

Comparison 1 DFP versus DFO, Outcome 1 Adherence to iron chelation therapy (%, SD).
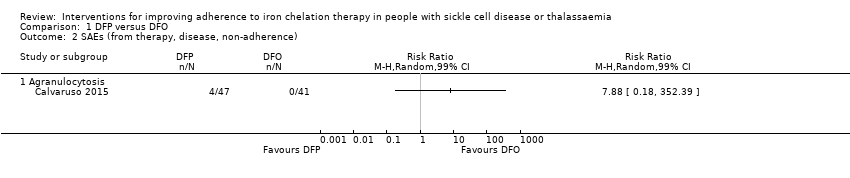
Comparison 1 DFP versus DFO, Outcome 2 SAEs (from therapy, disease, non‐adherence).
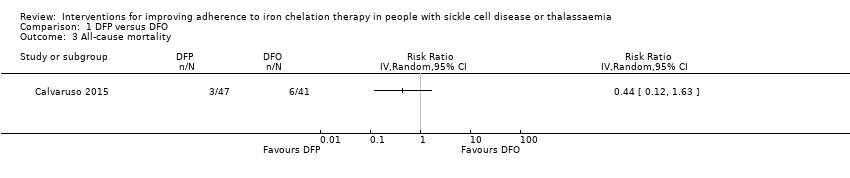
Comparison 1 DFP versus DFO, Outcome 3 All‐cause mortality.
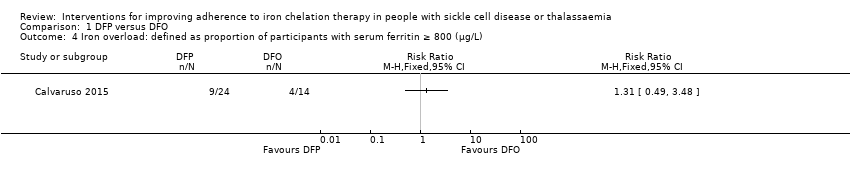
Comparison 1 DFP versus DFO, Outcome 4 Iron overload: defined as proportion of participants with serum ferritin ≥ 800 (µg/L).
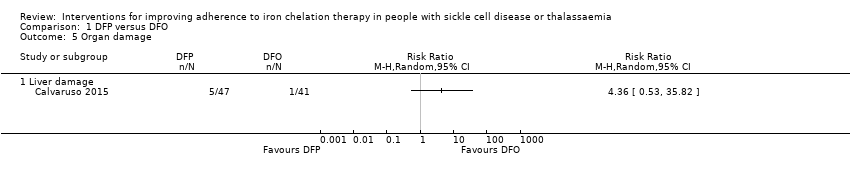
Comparison 1 DFP versus DFO, Outcome 5 Organ damage.
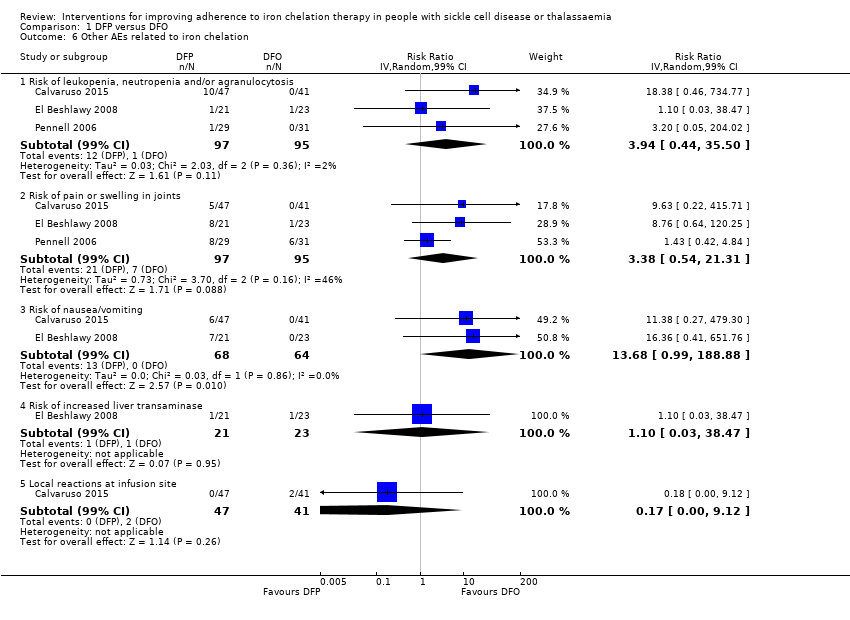
Comparison 1 DFP versus DFO, Outcome 6 Other AEs related to iron chelation.

Comparison 2 DFX versus DFO, Outcome 1 Adherence to iron chelation therapy (%, SD).

Comparison 2 DFX versus DFO, Outcome 2 SAEs.
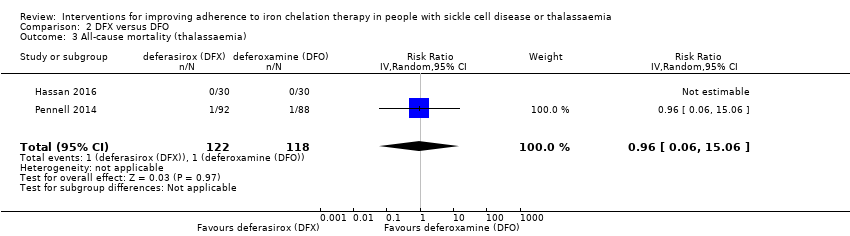
Comparison 2 DFX versus DFO, Outcome 3 All‐cause mortality (thalassaemia).

Comparison 2 DFX versus DFO, Outcome 4 Proportion of participants with iron overload (thalassaemia).

Comparison 2 DFX versus DFO, Outcome 5 Other AEs related to iron chelation ‐ (thalassaemia).
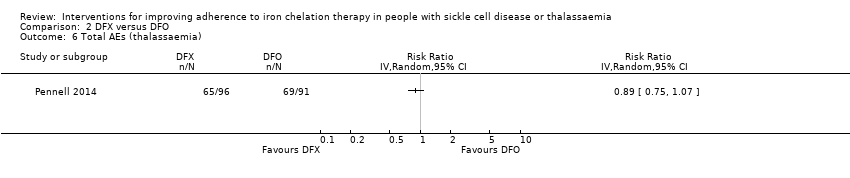
Comparison 2 DFX versus DFO, Outcome 6 Total AEs (thalassaemia).

Comparison 2 DFX versus DFO, Outcome 7 Other AEs related to iron chelation (SCD).

Comparison 3 DFX film‐coated tablet versus DFX dispersible tablet, Outcome 1 Adherence to iron chelation therapy.

Comparison 3 DFX film‐coated tablet versus DFX dispersible tablet, Outcome 2 Incidence of SAEs.
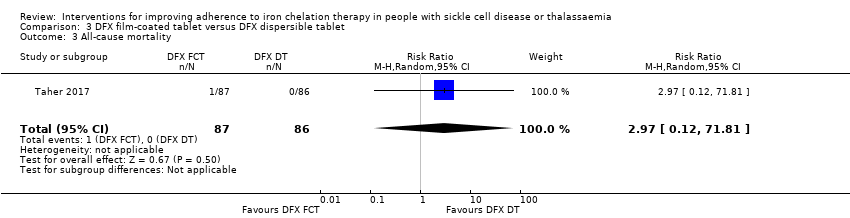
Comparison 3 DFX film‐coated tablet versus DFX dispersible tablet, Outcome 3 All‐cause mortality.
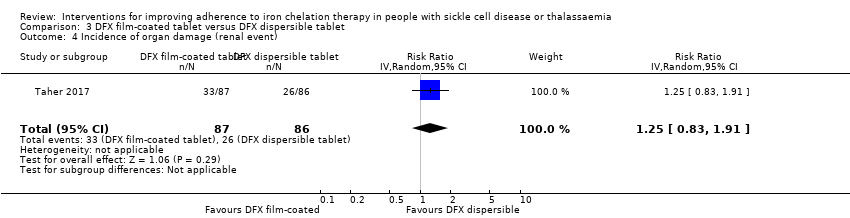
Comparison 3 DFX film‐coated tablet versus DFX dispersible tablet, Outcome 4 Incidence of organ damage (renal event).
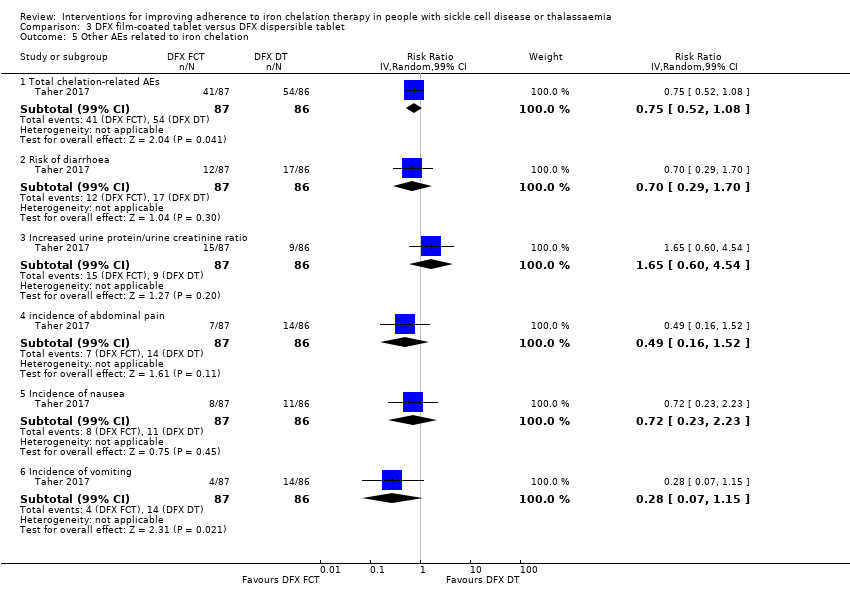
Comparison 3 DFX film‐coated tablet versus DFX dispersible tablet, Outcome 5 Other AEs related to iron chelation.

Comparison 4 DFP and DFO versus DFP, Outcome 1 Incidence of SAEs.
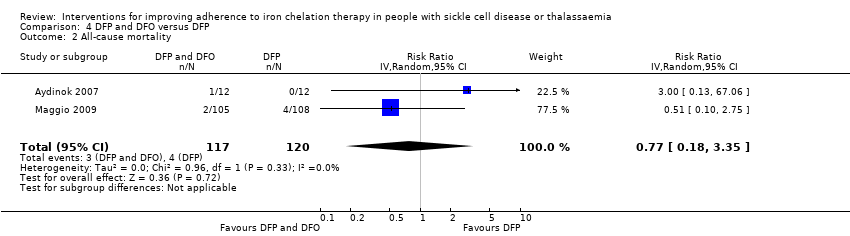
Comparison 4 DFP and DFO versus DFP, Outcome 2 All‐cause mortality.

Comparison 4 DFP and DFO versus DFP, Outcome 3 Incidence of chelation therapy‐related AEs.
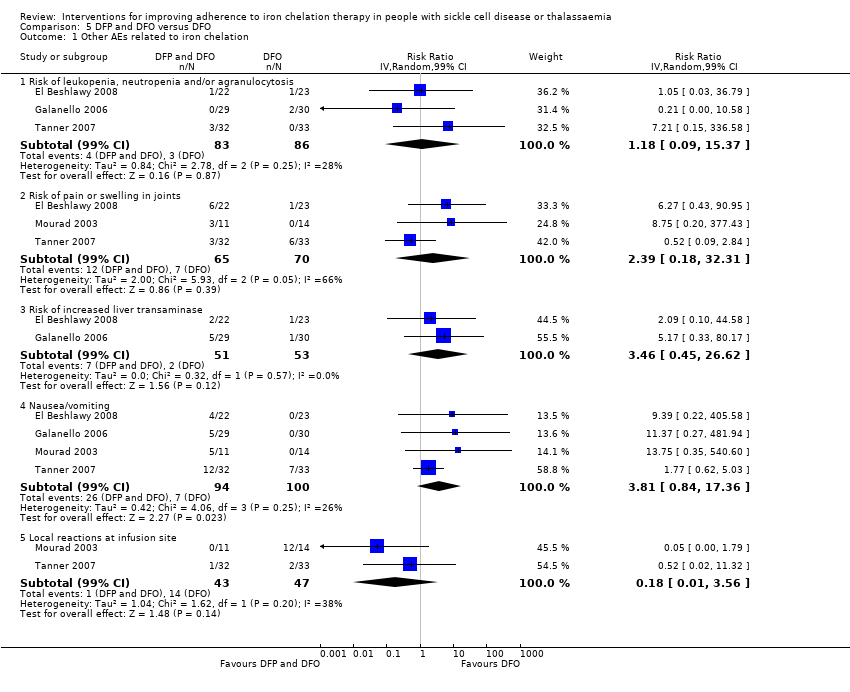
Comparison 5 DFP and DFO versus DFO, Outcome 1 Other AEs related to iron chelation.
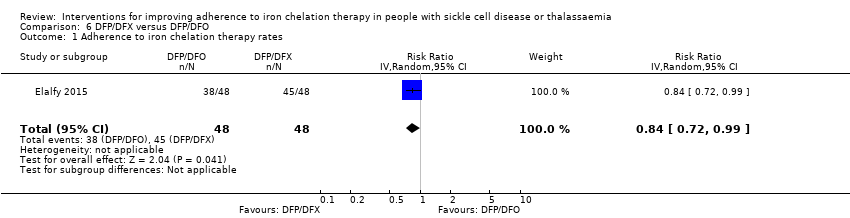
Comparison 6 DFP/DFX versus DFP/DFO, Outcome 1 Adherence to iron chelation therapy rates.

Comparison 6 DFP/DFX versus DFP/DFO, Outcome 2 Incidence of SAE.

Comparison 6 DFP/DFX versus DFP/DFO, Outcome 3 All‐cause mortality.

Comparison 6 DFP/DFX versus DFP/DFO, Outcome 4 Organ damage (serum creatinine (≥33%) above baseline in 2 consecutive occasions).
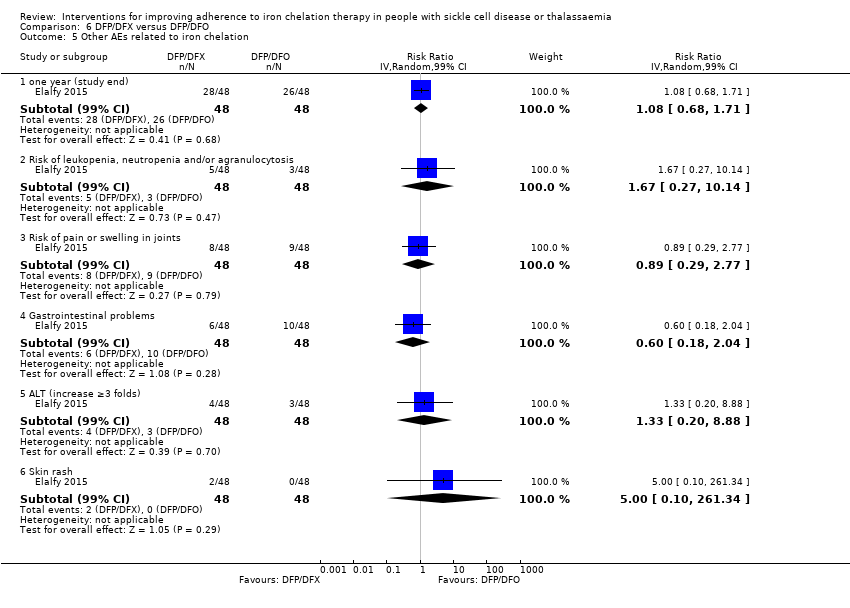
Comparison 6 DFP/DFX versus DFP/DFO, Outcome 5 Other AEs related to iron chelation.
| DFP compared to DFO for improving adherence to iron chelation therapy in people with sickle cell disease or thalassaemia | ||||||
| Patient or population: improving adherence to iron chelation therapy in people with sickle cell disease or thalassaemia | ||||||
| Outcomes | Anticipated absolute effects* (95% CI) | Relative effect | № of participants | Certainty of the evidence | Comments | |
| Risk with DFO | Risk with DFP | |||||
| Adherence to iron chelation therapy (per cent, SD) | ‐ | 242 (4 RCTs) | ⊕⊝⊝⊝ | We found considerable heterogeneity and identified age as possible cause: 1 trial in children 10 years or older and 1 conducted in participants 18 or older | ||
| SAEs (from therapy, disease, non‐adherence) Agranulocytosis** | Study population | RR 7.88 | 88 | ⊕⊝⊝⊝ | No SAEs were reported in the second trial reporting this outcome | |
| 15 per 1000 | 118 per 1,000 (7 to 1000) | |||||
| All‐cause mortality | Study population | RR 0.44 | 88 | ⊕⊝⊝⊝ | No deaths occurred in the second trial reporting this outcome | |
| 146 per 1000 | 64 per 1000 | |||||
| Sustained adherence ‐ not measured | ‐ | ‐ | ‐ | ‐ | ‐ | Sustained adherence is reported as adherence as all trials were longer than 6 months and only end of trial adherence numbers were provided |
| Quality of life ‐ not reported | ‐ | ‐ | ‐ | ‐ | ‐ | |
| *The risk in the intervention group (and its 95% confidence interval) is based on the assumed risk in the comparison group and the relative effect of the intervention (and its 95% CI). | ||||||
| GRADE Working Group grades of evidence | ||||||
| 1 We downgraded the quality of evidence by 1 for risk of bias due to high or uncertain risk of bias due to lack of blinding of participants and personnel in all four RCTs, as well as selection bias (Olivieri 1997), attrition bias (El Beshlawy 2008; Olivieri 1997), reporting bias (El Beshlawy 2008; Pennell 2006), and other bias (Pennell 2006). ** Risk estimate based on: Tricta F, Uetrecht J, Galanello R, et al. Deferiprone‐induced agranulocytosis: 20 years of clinical observations. American Journal of Hematology. 2016;91(10):1026‐1031. doi:10.1002/ajh.24479. | ||||||
| DFX compared to DFO for improving adherence to iron chelation therapy in people with sickle cell disease or thalassaemia | ||||||
| Patient or population: improving adherence to iron chelation therapy in people with sickle cell disease or thalassaemia | ||||||
| Outcomes | Anticipated absolute effects* (95% CI) | Relative effect | № of participants | Certainty of the evidence | Comments | |
| Risk with DFO | Risk with DFX | |||||
| Adherence to iron chelation therapy (per cent, SD) | The mean adherence to iron chelation therapy (per cent, SD) was 0 | MD 1.4 lower | ‐ | 197 | ⊕⊝⊝⊝ | Narrative report of adherence for 2 trials as either no or incompatible data to enable comparisons |
| SAEs ‐ thalassaemia‐related SAEs | Study population | ‐ | 247 | ⊕⊝⊝⊝ | There were no SAEs to report in one trial so no estimate of effect | |
| see comment | see comment | |||||
| SAEs ‐ SCD‐related SAEs | Study population | RR 1.08 | 195 | ⊕⊝⊝⊝ | ||
| 429 per 1000 | 463 per 1000 | |||||
| Incidence of SCD‐related SAEs ‐pain crisis | Study population | RR 1.05 | 195 | ⊕⊝⊝⊝ | ||
| 317 per 1000 | 333 per 1000 | |||||
| All‐cause mortality (thalassaemia) | Study population | RR 0.96 | 240 | ⊕⊝⊝⊝ | ||
| 8 per 1000 | 8 per 1000 | |||||
| Sustained adherence ‐ not measured | ‐ | ‐ | ‐ | ‐ | ‐ | Sustained adherence is reported as adherence as all trials were longer than 6 months and only end of trial adherence reported |
| Quality of life ‐ not reported | ‐ | ‐ | ‐ | ‐ | ‐ | |
| *The risk in the intervention group (and its 95% CI) is based on the assumed risk in the comparison group and the relative effect of the intervention (and its 95% CI). | ||||||
| GRADE Working Group grades of evidence | ||||||
| 1 We downgraded the quality of evidence by 2 due to high or uncertain risk of bias in several domains | ||||||
| DFX film‐coated tablet compared to DFX dispersible tablet for improving adherence to iron chelation therapy in people with sickle cell disease or thalassaemia | ||||||
| Patient or population: improving adherence to iron chelation therapy in people with sickle cell disease or thalassaemia | ||||||
| Outcomes | Anticipated absolute effects* (95% CI) | Relative effect | № of participants | Certainty of the evidence | Comments | |
| Risk with DFX dispersible tablet | Risk with DFX film‐coated tablet | |||||
| Adherence to iron chelation therapy (n, N) | Study population | RR 1.10 | 173 | ⊕⊕⊝⊝ | ||
| 849 per 1000 | 934 per 1000 | |||||
| Incidence of SAEs | Study population | RR 1.22 | 173 | ⊕⊝⊝⊝ | ||
| 151 per 1,000 | 184 per 1000 | |||||
| All‐cause mortality | Study population | RR 2.97 | 173 | ⊕⊝⊝⊝ | ||
| 0 per 1000 | 0 per 1000 | |||||
| Sustained adherence ‐ not measured | ‐ | ‐ | ‐ | ‐ | ‐ | Reported as adherence as trial was 6 months in duration and end of trial adherence reported |
| Quality of life ‐ not reported | ‐ | ‐ | ‐ | ‐ | ‐ | |
| *The risk in the intervention group (and its 95% confidence interval) is based on the assumed risk in the comparison group and the relative effect of the intervention (and its 95% CI). | ||||||
| GRADE Working Group grades of evidence | ||||||
| 1 We downgraded the quality of evidence by 2 for risk of bias due to high or unclear risk of bias in all domains | ||||||
| DFP and DFO compared to DFP for improving adherence to iron chelation therapy in people with sickle cell disease or thalassaemia | ||||||
| Patient or population: improving adherence to iron chelation therapy in people with sickle cell disease or thalassaemia | ||||||
| Outcomes | Anticipated absolute effects* (95% CI) | Relative effect | № of participants | Certainty of the evidence | Comments | |
| Risk with DFP | Risk with DFP and DFO | |||||
| Adherence to iron chelation therapy (per cent, SD) | see comment | see comment | ‐ | 289 (3 RCTs) | ⊕⊝⊝⊝ | Reported as narrative as no comparisons possible |
| Incidence of SAEs | Study population | RR 0.15 | 213 | ⊕⊕⊝⊝ | ||
| 28 per 1,000 | 4 per 1,000 | |||||
| All‐cause mortality | Study population | RR 0.77 | 237 | ⊕⊝⊝⊝ | ||
| 33 per 1,000 | 26 per 1,000 | |||||
| Sustained adherence ‐ not measured | ‐ | ‐ | ‐ | ‐ | ‐ | Sustained adherence is reported as adherence as trial duration longer than 6 months and reports adherence for length of trial |
| Quality of life ‐ not reported | ‐ | ‐ | ‐ | ‐ | ‐ | Quality of life was either not reported or no validated instruments were used |
| *The risk in the intervention group (and its 95% confidence interval) is based on the assumed risk in the comparison group and the relative effect of the intervention (and its 95% CI). | ||||||
| GRADE Working Group grades of evidence | ||||||
| 1 We downgraded the quality of evidence by 2 for risk of bias as there was high or uncertain risk of bias in most domains in 3 out of 4 trials | ||||||
| DFP and DFO compared to DFO for improving adherence to iron chelation therapy in people with sickle cell disease or thalassaemia | ||||||
| Patient or population: improving adherence to iron chelation therapy in people with sickle cell disease or thalassaemia | ||||||
| Outcomes | Anticipated absolute effects* (95% CI) | Relative effect | № of participants | Certainty of the evidence | Comments | |
| Risk with DFO | Risk with DFP and DFO | |||||
| Adherence to iron chelation therapy (per cent, SD) | see comment | see comment | ‐ | 205 (4 RCTs) | ⊕⊕⊝⊝ | Reported as narrative only as adherence in combined group not reported for combination therapy |
| Incidence of SAEs | Study population | ‐ | 205 (4 RCTs) | ⊕⊕⊝⊝ | 3 trials report no SAEs; SAES are not reported in one trial | |
| see comment | see comment | |||||
| All‐cause mortality | Study population | ‐ | 205 (4 RCTs) | ⊕⊕⊝⊝ | no deaths reported | |
| see comment | see comment | |||||
| Sustained adherence ‐ not measured | ‐ | ‐ | ‐ | ‐ | ‐ | Sustained adherence reported as adherence as trial duration was longer than 6 months and adherence reported at end of trial |
| Quality of life ‐ not reported | ‐ | ‐ | ‐ | ‐ | ‐ | |
| *The risk in the intervention group (and its 95% CI) is based on the assumed risk in the comparison group and the relative effect of the intervention (and its 95% CI). | ||||||
| GRADE Working Group grades of evidence | ||||||
| 1 We downgraded the quality of evidence by 2 for risk of bias as high or unclear risk of bias in all domains | ||||||
| DFP/DFO compared to DFP/DFX for improving adherence to iron chelation therapy in people with sickle cell disease or thalassaemia | ||||||
| Patient or population: improving adherence to iron chelation therapy in people with sickle cell disease or thalassaemia | ||||||
| Outcomes | Anticipated absolute effects* (95% CI) | Relative effect | № of participants | Certainty of the evidence | Comments | |
| Risk with DFP/DFX | Risk with DFP/DFO | |||||
| Adherence to iron chelation therapy rates (n,N) ‐ 1 year | Study population | RR 0.84 | 96 | ⊕⊕⊝⊝ | ||
| 938 per 1000 | 788 per 1000 | |||||
| Incidence of SAE | Study population | RR 1.00 | 96 | ⊕⊝⊝⊝ | ||
| 21 per 1,000 | 21 per 1000 | |||||
| All‐cause mortality ‐ at 1 year ‐ trial end | Study population | Not estimable | 96 | ⊕⊕⊝⊝ | No deaths were reported | |
| 0 per 1000 | 0 per 1000 | |||||
| Sustained adherence ‐ not measured | ‐ | ‐ | ‐ | ‐ | ‐ | Sustained adherence is reported as adherence as trial was 1 year in duration and end of trial adherence reported |
| Quality of life see comment | ‐ | ‐ | ‐ | ‐ | ‐ | The study uses SF36 to measure quality of life, the results are presented as a graph. Quality of life increased in both trial arms with no significant difference between trial arms P = 0.860 |
| *The risk in the intervention group (and its 95% confidence interval) is based on the assumed risk in the comparison group and the relative effect of the intervention (and its 95% CI). | ||||||
| GRADE Working Group grades of evidence | ||||||
| 1 We downgraded the quality of evidence by 1 for risk of bias as there was high or unclear risk of bias in 3 domains | ||||||
| Medication management compared to standard care for improving adherence to iron chelation therapy in people with sickle cell disease or thalassaemia | ||||||
| Patient or population: improving adherence to iron chelation therapy in people with sickle cell disease or thalassaemia | ||||||
| Outcomes | Anticipated absolute effects* (95% CI) | Relative effect | № of participants | Certainty of the evidence | Comments | |
| Risk with standard care | Risk with medication management | |||||
| Adherence to iron chelation therapy ‐ not reported | ‐ | ‐ | ‐ | Adherence was only reported in the intervention group and therefore no comparative data | ||
| SAEs ‐ not reported | ‐ | ‐ | ‐ | ‐ | ‐ | |
| Mortality ‐ not reported | ‐ | ‐ | ‐ | ‐ | ‐ | |
| Sustained adherence | ‐ | ‐ | ‐ | ‐ | ‐ | Adherence was only reported in the intervention group and therefore no comparative data |
| Quality of life | ‐ | 48 | ⊕⊝⊝⊝ | Medication management: 63.51 (51.75 – 84.54); standard care: 49.84 (41.9 – 60.81) | ||
| *The risk in the intervention group (and its 95% confidence interval) is based on the assumed risk in the comparison group and the relative effect of the intervention (and its 95% CI). | ||||||
| GRADE Working Group grades of evidence | ||||||
| 1 We downgraded the quality of evidence for indirectness by 2 because most outcomes were only reported in the medication management group | ||||||
| STUDY | HOW ADHERENCE MEASURED | RESULTS |
| Aydinok 2007 |
|
|
| Badawy 2010 |
|
|
| Bahnasawy 2017 |
|
|
| Calvaruso 2015 |
|
|
| El Beshlawy 2008 |
|
|
| Elalfy 2015 |
|
|
| Galanello 2006 |
|
|
| Hassan 2016 |
|
|
| Maggio 2009 |
|
|
| Mourad 2003 |
|
|
| Olivieri 1997 |
|
|
| Pennell 2006 |
|
|
| Pennell 2014 |
|
|
| Taher 2017 |
|
|
| Tanner 2007 |
|
|
| Vichinsky 2007 |
|
|
| DFO: deferoxamine | ||
| Outcome or subgroup title | No. of studies | No. of participants | Statistical method | Effect size |
| 1 Adherence to iron chelation therapy (%, SD) Show forest plot | 3 | Mean Difference (IV, Random, 95% CI) | Subtotals only | |
| 2 SAEs (from therapy, disease, non‐adherence) Show forest plot | 1 | Risk Ratio (M‐H, Random, 99% CI) | Totals not selected | |
| 2.1 Agranulocytosis | 1 | Risk Ratio (M‐H, Random, 99% CI) | 0.0 [0.0, 0.0] | |
| 3 All‐cause mortality Show forest plot | 1 | Risk Ratio (IV, Random, 95% CI) | Totals not selected | |
| 4 Iron overload: defined as proportion of participants with serum ferritin ≥ 800 (µg/L) Show forest plot | 1 | Risk Ratio (M‐H, Fixed, 95% CI) | Totals not selected | |
| 5 Organ damage Show forest plot | 1 | Risk Ratio (M‐H, Random, 95% CI) | Totals not selected | |
| 5.1 Liver damage | 1 | Risk Ratio (M‐H, Random, 95% CI) | 0.0 [0.0, 0.0] | |
| 6 Other AEs related to iron chelation Show forest plot | 3 | Risk Ratio (IV, Random, 99% CI) | Subtotals only | |
| 6.1 Risk of leukopenia, neutropenia and/or agranulocytosis | 3 | 192 | Risk Ratio (IV, Random, 99% CI) | 3.94 [0.44, 35.50] |
| 6.2 Risk of pain or swelling in joints | 3 | 192 | Risk Ratio (IV, Random, 99% CI) | 3.38 [0.54, 21.31] |
| 6.3 Risk of nausea/vomiting | 2 | 132 | Risk Ratio (IV, Random, 99% CI) | 13.68 [0.99, 188.88] |
| 6.4 Risk of increased liver transaminase | 1 | 44 | Risk Ratio (IV, Random, 99% CI) | 1.10 [0.03, 38.47] |
| 6.5 Local reactions at infusion site | 1 | 88 | Risk Ratio (IV, Random, 99% CI) | 0.17 [0.00, 9.12] |
| Outcome or subgroup title | No. of studies | No. of participants | Statistical method | Effect size |
| 1 Adherence to iron chelation therapy (%, SD) Show forest plot | 1 | Mean Difference (IV, Random, 95% CI) | Totals not selected | |
| 2 SAEs Show forest plot | 3 | Risk Ratio (M‐H, Random, 95% CI) | Totals not selected | |
| 2.1 Thalassaemia‐related SAEs | 2 | Risk Ratio (M‐H, Random, 95% CI) | 0.0 [0.0, 0.0] | |
| 2.2 SCD‐related SAE ‐ painful crisis | 1 | Risk Ratio (M‐H, Random, 95% CI) | 0.0 [0.0, 0.0] | |
| 2.3 SCD‐related SAEs ‐ other SCD‐related SAEs | 1 | Risk Ratio (M‐H, Random, 95% CI) | 0.0 [0.0, 0.0] | |
| 3 All‐cause mortality (thalassaemia) Show forest plot | 2 | 240 | Risk Ratio (IV, Random, 95% CI) | 0.96 [0.06, 15.06] |
| 4 Proportion of participants with iron overload (thalassaemia) Show forest plot | 2 | Risk Ratio (M‐H, Random, 95% CI) | Subtotals only | |
| 4.1 Iron overload defined by ferritin 1500 (µg/l) or higher (Thalassaemia) | 1 | 60 | Risk Ratio (M‐H, Random, 95% CI) | 1.18 [0.63, 2.20] |
| 4.2 Proportion with severe iron overload (LIC at least 15 mg/Fe/g dw) | 1 | 172 | Risk Ratio (M‐H, Random, 95% CI) | 1.00 [0.83, 1.20] |
| 4.3 Myocardial T2* < 10ms | 1 | 172 | Risk Ratio (M‐H, Random, 95% CI) | 1.10 [0.72, 1.70] |
| 5 Other AEs related to iron chelation ‐ (thalassaemia) Show forest plot | 2 | Risk Ratio (IV, Random, 95% CI) | Subtotals only | |
| 5.1 Total chelation‐related AE | 1 | 187 | Risk Ratio (IV, Random, 95% CI) | 1.15 [0.76, 1.73] |
| 5.2 Gastrointestinal upset | 1 | 60 | Risk Ratio (IV, Random, 95% CI) | 3.0 [0.66, 13.69] |
| 5.3 Rash | 2 | 247 | Risk Ratio (IV, Random, 95% CI) | 3.05 [0.98, 9.47] |
| 5.4 Risk of increased blood creatinine | 1 | 187 | Risk Ratio (IV, Random, 95% CI) | 3.79 [0.83, 17.38] |
| 5.5 Risk of proteinuria | 1 | 187 | Risk Ratio (IV, Random, 95% CI) | 2.21 [0.59, 8.29] |
| 5.6 Risk of increased ALT | 1 | 187 | Risk Ratio (IV, Random, 95% CI) | 5.69 [0.70, 46.33] |
| 5.7 Risk of increased AST | 1 | 187 | Risk Ratio (IV, Random, 95% CI) | 5.69 [0.70, 46.33] |
| 5.8 Risk of diarrhoea | 1 | 187 | Risk Ratio (IV, Random, 95% CI) | 5.69 [0.70, 46.33] |
| 5.9 Risk of vomiting | 1 | 187 | Risk Ratio (IV, Random, 95% CI) | 6.64 [0.35, 126.78] |
| 6 Total AEs (thalassaemia) Show forest plot | 1 | Risk Ratio (IV, Random, 95% CI) | Totals not selected | |
| 7 Other AEs related to iron chelation (SCD) Show forest plot | 1 | Risk Ratio (M‐H, Random, 99% CI) | Subtotals only | |
| 7.1 Risk of increased ALT | 1 | 195 | Risk Ratio (M‐H, Random, 99% CI) | 5.29 [0.12, 232.98] |
| 7.2 incidence of abdominal pain | 1 | 195 | Risk Ratio (M‐H, Random, 99% CI) | 1.91 [0.80, 4.58] |
| 7.3 Risk of pain or swelling in joints | 1 | 195 | Risk Ratio (M‐H, Random, 99% CI) | 1.06 [0.41, 2.76] |
| 7.4 Risk of diarrhoea | 1 | 195 | Risk Ratio (M‐H, Random, 99% CI) | 4.14 [0.90, 18.92] |
| 7.5 Nausea/vomiting | 1 | 195 | Risk Ratio (M‐H, Random, 99% CI) | 1.63 [0.90, 2.94] |
| Outcome or subgroup title | No. of studies | No. of participants | Statistical method | Effect size |
| 1 Adherence to iron chelation therapy Show forest plot | 1 | 173 | Risk Ratio (M‐H, Random, 95% CI) | 1.10 [0.99, 1.22] |
| 2 Incidence of SAEs Show forest plot | 1 | 173 | Risk Ratio (IV, Random, 95% CI) | 1.22 [0.62, 2.37] |
| 3 All‐cause mortality Show forest plot | 1 | 173 | Risk Ratio (M‐H, Random, 95% CI) | 2.97 [0.12, 71.81] |
| 4 Incidence of organ damage (renal event) Show forest plot | 1 | 173 | Risk Ratio (IV, Random, 95% CI) | 1.25 [0.83, 1.91] |
| 5 Other AEs related to iron chelation Show forest plot | 1 | Risk Ratio (IV, Random, 99% CI) | Subtotals only | |
| 5.1 Total chelation‐related AEs | 1 | 173 | Risk Ratio (IV, Random, 99% CI) | 0.75 [0.52, 1.08] |
| 5.2 Risk of diarrhoea | 1 | 173 | Risk Ratio (IV, Random, 99% CI) | 0.70 [0.29, 1.70] |
| 5.3 Increased urine protein/urine creatinine ratio | 1 | 173 | Risk Ratio (IV, Random, 99% CI) | 1.65 [0.60, 4.54] |
| 5.4 incidence of abdominal pain | 1 | 173 | Risk Ratio (IV, Random, 99% CI) | 0.49 [0.16, 1.52] |
| 5.5 Incidence of nausea | 1 | 173 | Risk Ratio (IV, Random, 99% CI) | 0.72 [0.23, 2.23] |
| 5.6 Incidence of vomiting | 1 | 173 | Risk Ratio (IV, Random, 99% CI) | 0.28 [0.07, 1.15] |
| Outcome or subgroup title | No. of studies | No. of participants | Statistical method | Effect size |
| 1 Incidence of SAEs Show forest plot | 1 | 213 | Risk Ratio (M‐H, Random, 95% CI) | 0.15 [0.01, 2.81] |
| 2 All‐cause mortality Show forest plot | 2 | 237 | Risk Ratio (IV, Random, 95% CI) | 0.77 [0.18, 3.35] |
| 3 Incidence of chelation therapy‐related AEs Show forest plot | 3 | Risk Ratio (IV, Random, 99% CI) | Subtotals only | |
| 3.1 Risk of leukopenia, neutropenia and/or agranulocytosis | 3 | 280 | Risk Ratio (IV, Random, 99% CI) | 1.15 [0.50, 2.62] |
| 3.2 Risk of pain or swelling in joints | 2 | 256 | Risk Ratio (IV, Random, 99% CI) | 0.76 [0.31, 1.91] |
| 3.3 Risk of gastrointestinal disturbances | 1 | 213 | Risk Ratio (IV, Random, 99% CI) | 0.45 [0.15, 1.37] |
| 3.4 Risk of increased liver transaminase | 2 | 256 | Risk Ratio (IV, Random, 99% CI) | 1.02 [0.52, 1.98] |
| 3.5 Nausea/vomiting | 1 | 43 | Risk Ratio (IV, Random, 99% CI) | 0.55 [0.13, 2.23] |
| Outcome or subgroup title | No. of studies | No. of participants | Statistical method | Effect size |
| 1 Other AEs related to iron chelation Show forest plot | 4 | Risk Ratio (IV, Random, 99% CI) | Subtotals only | |
| 1.1 Risk of leukopenia, neutropenia and/or agranulocytosis | 3 | 169 | Risk Ratio (IV, Random, 99% CI) | 1.18 [0.09, 15.37] |
| 1.2 Risk of pain or swelling in joints | 3 | 135 | Risk Ratio (IV, Random, 99% CI) | 2.39 [0.18, 32.31] |
| 1.3 Risk of increased liver transaminase | 2 | 104 | Risk Ratio (IV, Random, 99% CI) | 3.46 [0.45, 26.62] |
| 1.4 Nausea/vomiting | 4 | 194 | Risk Ratio (IV, Random, 99% CI) | 3.81 [0.84, 17.36] |
| 1.5 Local reactions at infusion site | 2 | 90 | Risk Ratio (IV, Random, 99% CI) | 0.18 [0.01, 3.56] |
| Outcome or subgroup title | No. of studies | No. of participants | Statistical method | Effect size |
| 1 Adherence to iron chelation therapy rates Show forest plot | 1 | 96 | Risk Ratio (IV, Random, 95% CI) | 0.84 [0.72, 0.99] |
| 2 Incidence of SAE Show forest plot | 1 | 96 | Risk Ratio (M‐H, Random, 95% CI) | 1.0 [0.06, 15.53] |
| 3 All‐cause mortality Show forest plot | 1 | Risk Ratio (IV, Random, 95% CI) | Totals not selected | |
| 4 Organ damage (serum creatinine (≥33%) above baseline in 2 consecutive occasions) Show forest plot | 1 | 96 | Risk Ratio (M‐H, Random, 99% CI) | 3.0 [0.16, 56.04] |
| 5 Other AEs related to iron chelation Show forest plot | 1 | Risk Ratio (IV, Random, 99% CI) | Subtotals only | |
| 5.1 one year (study end) | 1 | 96 | Risk Ratio (IV, Random, 99% CI) | 1.08 [0.68, 1.71] |
| 5.2 Risk of leukopenia, neutropenia and/or agranulocytosis | 1 | 96 | Risk Ratio (IV, Random, 99% CI) | 1.67 [0.27, 10.14] |
| 5.3 Risk of pain or swelling in joints | 1 | 96 | Risk Ratio (IV, Random, 99% CI) | 0.89 [0.29, 2.77] |
| 5.4 Gastrointestinal problems | 1 | 96 | Risk Ratio (IV, Random, 99% CI) | 0.6 [0.18, 2.04] |
| 5.5 ALT (increase ≥3 folds) | 1 | 96 | Risk Ratio (IV, Random, 99% CI) | 1.33 [0.20, 8.88] |
| 5.6 Skin rash | 1 | 96 | Risk Ratio (IV, Random, 99% CI) | 5.0 [0.10, 261.34] |