Iluminación del lugar de trabajo para mejorar el estado de alerta y el estado de ánimo en los trabajadores diurnos
References
Referencias de los estudios incluidos en esta revisión
Referencias de los estudios excluidos de esta revisión
Referencias adicionales
Referencias de otras versiones publicadas de esta revisión
Characteristics of studies
Characteristics of included studies [ordered by study ID]
Jump to:
| Methods | Randomised controlled trial with a parallel design and individual allocation. Comparison: exposure to morning bright light vs afternoon bright light. | |
| Participants | Volunteers presenting seasonal problems recruited by advertisement, with a regular daytime work schedule (n = 30). Morning light group: n = 16, all female, mean (SD) age 37 ± 11 years. Afternoon light group: n = 14, 12 females, mean (SD) age 43 ± 9 years. | |
| Interventions | Morning light group: 2 hours of bright light in the morning (during the first 2 available hours between 07:00 a.m. and 12:00 a.m.). Afternoon light group: 2 hours of bright light in the afternoon (between the last 2 available hours between 12:00 a.m. to 17:00 p.m.). The bright light source was the Philips Bright Light, 2500 Lux. No inactive controlled employed. | |
| Outcomes | Alertness assessed by VAS 100‐mm line. Mood assessed by 5 measures: SIGH‐SAD, HDRS‐21, HDRS‐17, SAD subscale, VAS 100‐mm line. Adverse effects. | |
| Notes | ||
| Risk of bias | ||
| Bias | Authors' judgement | Support for judgement |
| Random sequence generation (selection bias) | Unclear risk | Quote: "At the end of the first week, the subjects were assigned randomly to 2 weeks of bright light treatment: either 2 hours of bright light in the morning (during the first 2 available hours between 0700 and 1200) or 2 hours of bright light in the afternoon (between the last 2 available hours between 1200 to 1700)." Comment: methods for randomisation not reported. |
| Allocation concealment (selection bias) | Unclear risk | Comment: methods for allocation concealment not reported. |
| Blinding of participants and personnel (performance bias) | High risk | Comment: intervention applied at different times of day. |
| Blinding of outcome assessment (detection bias) | Low risk | Quote: "At the end of both the baseline week and the second treatment week, the subjects were assessed blindly by a psychiatrist using the SIGH‐SAD, the primary measure of improvement." Comment: participants assessed blindly by a psychiatrist using SIGH‐SAD. |
| Incomplete outcome data (attrition bias) | Low risk | Quote: "One patient assigned to afternoon light used the light in the afternoon during the first week, but mistakenly used the bright light in the morning during the second week. His data are excluded from the analyses." Comment: 1 loss due to protocol deviation in the afternoon light group (< 10% of randomised participants). |
| Selective reporting (reporting bias) | Low risk | Comment: no evidence of selective reporting identified. |
| Other bias | Unclear risk | Quote: "The VAS scales were missing baseline values for two subjects in the a.m. group and five in the p.m. group, but still showed clear evidence of improvement over time." Comment: there were missing data for baseline values of VAS for 2 participants in the a.m. group and 5 in the p.m. group. We could not assess whether this could mask baseline imbalance. |
| Methods | Randomised controlled trial with cross‐over design and individual allocation. Comparison: individually applied blue‐enriched light vs no treatment. Participants allocated into 2 blocks: ABAB and BABA, where 2 × 4‐week periods of using intervention A were alternated with 2 × 4‐week periods of not using (intervention B). | |
| Participants | Staff members (secretaries, nurses, doctors, psychologists, physicians) working in a hospital with no access to natural light; n = 25. Only 25% of the staff participated in the study. Mean (SD) age 36.6 ± 7.7 years. | |
| Interventions | Intervention A: blue‐enriched light emitted by 8 LEDs mounted in spectacles (Luminette), which were directed on the lower part of the retina. Participants used Luminette at work between 07:00 a.m. and 09:00 a.m. for a maximum of 30 minutes a day, at least 5 days a week. Intervention B: no treatment. | |
| Outcomes | Alertness assessed using Epworth Sleepiness Scale. Mood assessed and reported using Beck Depression Inventory‐II. | |
| Notes | ||
| Risk of bias | ||
| Bias | Authors' judgement | Support for judgement |
| Random sequence generation (selection bias) | Low risk | Comment: randomisation performed by random draw. |
| Allocation concealment (selection bias) | Unclear risk | Comment: methods for allocation concealment not reported. |
| Blinding of participants and personnel (performance bias) | High risk | Comment: intervention compared to no treatment. |
| Blinding of outcome assessment (detection bias) | High risk | Comment: outcomes derived from questionnaires answered by participants not blind for interventions. |
| Incomplete outcome data (attrition bias) | High risk | Quote: "Fourteen employees participated in all assessment phases. No significant scoring difference was noted at time in the questionnaires between subjects who continued (n = 14) and those who stopped (n = 11). Reasons for stopping the use of Luminette® were multiple: negative side effects (e.g. migraines, nausea), decreased interest in the study, exclusion of pregnant women, and holidays (including Christmas)." Comment: only 14/25 participants finished study protocol. Reasons not fully reported. High rate of attrition (44%). Unclear if there was imbalance between groups regarding number of losses and reasons for dropping out. |
| Selective reporting (reporting bias) | High risk | Comment: data from SIGH‐HDRS, planned in Methods section, was not reported. |
| Other bias | Low risk | Comment: no other bias identified. |
| Carry‐over effect | Unclear risk | Comment: carry‐over effect could not be ruled out. |
| Availability of 2‐period data | Low risk | Comment: data reported from first and second intervention period and for first control period. |
| Incorrect analysis | Low risk | Comment: paired analyses presented. |
| Comparability of results with those from parallel‐group trials | Unclear risk | Comment: no results from parallel‐group trials available for same intervention. |
| Methods | Randomised controlled trial with a parallel design and individual allocation. Comparison: different proportions of direct and indirect indoor lighting. | |
| Participants | Employees at 2 public service departments in a municipality near Oslo (n = 64, 23 women and 41 men), working in private offices. Age: 29 to 62 years (mean ± SD: 47.5 ± 9.7 years). Random assignment was used to form 4 groups of 16 participants. | |
| Interventions | Lighting scheme 1 (LSI.1): 100% indirect lighting. Lighting scheme 2 (LSID.2): 70% indirect and 30% direct lighting. Lighting scheme 3 (LSDI.3): 30% indirect and 70% direct lighting. Lighting scheme 4 (LSD.4): 100% direct lighting. Each office was equipped with 2 independently controlled sources of light, the overhead light specific to each intervention scheme and a desk lamp identical for all offices. | |
| Outcomes | Somatic health assessed with a modified version of a subjective symptom questionnaire, containing background variables, such as ocular and visual symptoms, musculoskeletal symptoms and systemic body symptoms. Well‐being measured by job satisfaction, job stress, anxiety and depression. | |
| Notes | ||
| Risk of bias | ||
| Bias | Authors' judgement | Support for judgement |
| Random sequence generation (selection bias) | Low risk | Quote: "The randomization procedure was a stratified randomization procedure. Building and gender were used as strata which means that the four lighting concepts were distributed evenly among the two buildings used in the study and gender." Comment: Email correspondence with author. |
| Allocation concealment (selection bias) | Unclear risk | Comment: methods for allocation concealment not reported. |
| Blinding of participants and personnel (performance bias) | High risk | Comment: different types of lighting systems compared. |
| Blinding of outcome assessment (detection bias) | High risk | Quote: "Depression was measured with the Norwegian edition of Becks Depression Inventory (BDI). The BDI is a self‐rating scale comprising 21 items. Each item has four response choices in the form of statements ranked in order of severity. The respondent selects the statement that suits the feelings at the moment." Comment: self‐assessment questionnaires. Participants not blind to interventions. |
| Incomplete outcome data (attrition bias) | High risk | Quote: "The attrition was thirteen participants, representing 25% of the original sample. Attrition was mainly caused by change of employment and long‐term sick leave, while pregnancy and higher education was stated in some instances. There was no indication of any association between the intervention factors and stated causes for sick leave. Two participants were excluded from the study because their new lighting installations did not meet the technical specifications. The attrition for each lighting scheme was three from LSI.1 (100% indirect lighting), one from LSID.2 (70% indirect and 30% direct), two from LSDI.3 (30% indirect and 70% direct lighting) and seven from LSD.4 (100% direct lighting). Separate statistical analyses conducted on the baseline measures showed no indication of bias regarding any of the dependent variables for any of the groups." Comment: reasons for attrition were presented; however, there was considerable imbalance of attrition across interventions groups, with greater rates of attrition for the group exposed to 100% direct lighting. |
| Selective reporting (reporting bias) | Low risk | Comment: data reported for all outcomes. |
| Other bias | Low risk | Comment: no other bias identified. |
| Methods | Controlled before‐after study with cluster allocation. Comparison: high CCT vs standard illumination. | |
| Participants | Participants working as call‐handlers on two different floors of call centre offices in the UK (n = 69, 23 participants on the control floor and 46 on the intervention floor). Work schedule spanned from 8 a.m. to 8 p.m. | |
| Interventions | Intervention: lamp change to the entire lighting system, with replacement of existing lighting system by new high CCT fluorescent lamps (ActiViva Active, Philips), yielding an enhanced amount of short wavelength light with colour temperature of 17,000 K. Control: lights with a CCT of 2900 K. | |
| Outcomes | Alertness assessed by two items of the Columbia Jet Lag Scale and by one non‐validated question for self‐assessment of overall alertness and concentration. | |
| Notes | ||
| Risk of bias | ||
| Bias | Authors' judgement | Support for judgement |
| Random sequence generation (selection bias) | High risk | Comment: non‐randomised study. |
| Allocation concealment (selection bias) | High risk | Comment: non‐randomised study. |
| Blinding of participants and personnel (performance bias) | High risk | Comment: different lighting conditions. |
| Blinding of outcome assessment (detection bias) | High risk | Quote: "Individuals' alertness, performance, concentration and health related quality of life were assessed by means of two online questionnaires." Comment: self‐assessment questionnaires. Participants were not blind to interventions. |
| Incomplete outcome data (attrition bias) | Low risk | Comment: no attrition identified. |
| Selective reporting (reporting bias) | Low risk | Comment: data reported for all outcomes. |
| Other bias | Low risk | Comment: no other bias identified. |
| Recruitment bias | High risk | Quote: "Sixty‐nine individuals agreed to take part in the study (23 on the control floor and 46 on the intervention floor), representing 49% of the total eligible population during the study period." Comment: low rate of acceptance of participation (49%). |
| Baseline imbalance | Low risk | Comment: no imbalance between groups identified. |
| Loss of clusters | Low risk | Comment: no loss of clusters. |
| Incorrect analysis | High risk | Comment: unity of analysis (individual) different from unit of allocation (cluster). |
| Comparability with individually randomised trials | Unclear risk | Comment: no individually randomised trial focusing on same type of intervention identified. |
| Methods | Controlled before‐after study with cluster allocation and cross‐over design. Comparison: high CCT vs standard illumination. | |
| Participants | 94 white‐collar workers, working at a distribution company in northern England, at latitude of 52º north. Two floors of a large office building, which housed the company, were selected and used. Each floor was the same with regard to layout of desks and environmental light exposure. The two floors were also very similar with respect to nature of work carried out. The habitual start was 08:30 a.m. and end time was 16:45 p.m. of work on both floors. First floor: 52 participants (26 women, aged: mean ± SD: 34.6 ± 1.4 years). Second floor: 42 participants (19 women, aged mean ± SD: 37.4 ± 1.5 years). | |
| Interventions | Two periods of four weeks under different light conditions (17,000 and 4000 K). Intervention 1: newly developed fluorescent light source with a highly CCT (17,000 K, Philip Master TL‐D ActiViva Active, Philips, Roozendaal, the Netherlands). Intervention 2: similar light source with a lower CCT (4000 K, Philips Master TL‐D super 80). Both types of fluorescent tubes were 18 W and had a similar spectral power distribution in the medium and long wavelength ranges, but the 17,000 K light source produced more output between 420 nm and 480 nm. | |
| Outcomes | Alertness assessed by Karolinska Sleepiness Scale. Questionnaires were completed on a weekly basis. Positive and negative mood assessed by PANAS scale. Adverse events (irritability, headache, eye strain, eyes discomfort, eye fatigue, difficult focusing, difficult concentrating and blurred vision) assessed by questionnaire. Symptoms were rated from 1 to 4 (severe). Outcomes reported as means of all measurements performed in different time points. | |
| Notes | ||
| Risk of bias | ||
| Bias | Authors' judgement | Support for judgement |
| Random sequence generation (selection bias) | High risk | Comment: non‐randomised study. |
| Allocation concealment (selection bias) | High risk | Comment: non‐randomised study. |
| Blinding of participants and personnel (performance bias) | High risk | Comment: different lighting conditions. |
| Blinding of outcome assessment (detection bias) | High risk | Quote: "During the two 4‐week periods of exposure to experimental lighting conditions, the participants completed questionnaires in the morning, midday, and late afternoon on the Tuesday of every week. They were requested to complete the morning measures in the hour after their arrival at work and to consider only the time since their arrival at work." Comments: self‐assessment questionnaires. Participants were not blind to interventions. |
| Incomplete outcome data (attrition bias) | High risk | Quote: "Ten participants withdrew from the study. The reasons for withdrawal included loss of interest in the study, change of floor during the study, and time off work during the study. The analyses presented in this report are therefore based on 94 participants." Comments: attrition rate 10.6%. Reasons justifying withdrawal included loss of interest in study, change of floor during study and time off during study. Withdrawals in each group were not reported. |
| Selective reporting (reporting bias) | Low risk | Comment: data reported for all outcomes. |
| Other bias | Low risk | Comment: no other bias identified. |
| Recruitment bias | Unclear risk | Comment: rate of acceptance of participation not reported. |
| Baseline imbalance | Low risk | Comment: cross‐over design |
| Loss of clusters | Low risk | Comment: no loss of clusters. |
| Incorrect analysis | High risk | Comment: unit of allocation (cluster) not taken into account in statistical analysis. |
| Comparability with individually randomised trials | Unclear risk | Comment: no individually randomised trial focusing on the same type of intervention was identified. |
| Carry‐over effect | Unclear risk | Comments: no washout period. Carry‐over effect influencing mood could not be disregarded. |
| Availability of 2‐period data | Low risk | Comment: data from both periods presented. |
| Incorrect analysis | Low risk | Comment: comparisons of repeated measures were made between the light condition using mixed‐models analyses of variance for repeated measures. |
| Comparability of results with those from parallel‐group trials | Low risk | Comment: results were in accordance with those from parallel‐group trials (Mills 2007). |
CCT: correlated colour temperature; CI: confidence interval; HDRS‐17: 17‐item Hamilton Depressive Rating Scale; HDRS‐21: 21‐item Hamilton Depressive Rating Scale; LED: light‐emitting diode; n: number of participants; PANAS: Positive and Negative Affect Schedule; SAD: seasonal affective disorder; SD: standard deviation; SIGH‐HDRS: Structured Interview Guide for the Hamilton Depressive Rating Scale; SIGH‐SAD: Structured Interview Guide for the Hamilton Depression Rating Scale‐Seasonal Affective Disorders Version; SMD: standardised mean difference; VAS: visual analogue scale.
Characteristics of excluded studies [ordered by study ID]
Jump to:
| Study | Reason for exclusion |
| This study assessed preferred lighting conditions, symptoms of visual discomfort, headache and somatic pain, but not alertness or mood. | |
| This study employed a cross‐sectional design to assess the influence of different lighting conditions on classroom occupants' behaviour and subjective perception. | |
| This study was conducted in residential and not occupational settings. | |
| This study was conducted in a laboratory, enrolling college students, not employees. | |
| This study enrolled undergraduate and graduate students, not employees. | |
| This study assessed perceived naturalness of light emitted by different light sources, but not alertness or mood. | |
| This study assessed nurses' satisfaction related to lighting conditions at different hospital locations, but not alertness or mood. | |
| This study was conducted in a laboratory and not in a real work setting. | |
| This study reported the effects of the modification of lighting system in the long term. Attempts to contact the author for data prior to the modification were unsuccessful. | |
| This study was conducted in a laboratory and not in a real work setting. | |
| The intervention of interest was the change of the colours of walls, rather than the modification of light source. | |
| This study was conducted in a laboratory and not in a real work setting. | |
| This study was conducted in a laboratory and not in a real work setting. | |
| This study did not employ a control group. | |
| This study was conducted in a laboratory and not in a real work setting. | |
| This study was conducted in a laboratory and not in a real work setting. | |
| This study was conducted in laboratory. | |
| Attempts to contact the author for determining eligibility were unsuccessful. | |
| This publication is a narrative review on illumination effects. | |
| Lighting exposure took place in both residential and work settings. | |
| This study employed a cross‐sectional design. | |
| This study employed a cross‐sectional design to assess the effects of different ventilation conditions. | |
| This study employed a cross‐sectional design. | |
| This study did not employ a control group. | |
| This study employed a cross‐sectional design. | |
| This publication is a narrative review. | |
| This study was conducted in a laboratory and not in a real work setting. | |
| This study was conducted in a laboratory and not in a real work setting. | |
| This publication is a narrative review. |
Data and analyses
| Outcome or subgroup title | No. of studies | No. of participants | Statistical method | Effect size |
| 1 Alertness ‐ Item Decreased Daytime Alertness from Columbia Jet Lag Scale 14 weeks Show forest plot | 1 | Mean Difference (IV, Fixed, 95% CI) | Totals not selected | |
| Analysis 1.1  Comparison 1 High correlated colour temperature light versus standard illumination, Outcome 1 Alertness ‐ Item Decreased Daytime Alertness from Columbia Jet Lag Scale 14 weeks. | ||||
| 2 Alertness ‐ Item Sleepiness in Day from Columbia Jet Lag Scale 14 weeks Show forest plot | 1 | Mean Difference (IV, Fixed, 95% CI) | Totals not selected | |
| Analysis 1.2  Comparison 1 High correlated colour temperature light versus standard illumination, Outcome 2 Alertness ‐ Item Sleepiness in Day from Columbia Jet Lag Scale 14 weeks. | ||||
| 3 Alertness ‐ Karolinska Sleepiness Scale: mean of all time points Show forest plot | 1 | Mean Difference (IV, Fixed, 95% CI) | Totals not selected | |
| Analysis 1.3 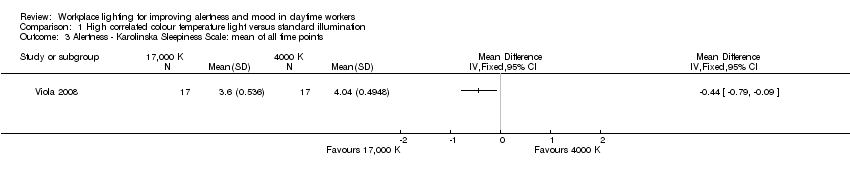 Comparison 1 High correlated colour temperature light versus standard illumination, Outcome 3 Alertness ‐ Karolinska Sleepiness Scale: mean of all time points. | ||||
| 4 Alertness ‐ meta‐analysis Show forest plot | 2 | 50 | Std. Mean Difference (IV, Fixed, 95% CI) | ‐0.69 [‐1.28, ‐0.10] |
| Analysis 1.4  Comparison 1 High correlated colour temperature light versus standard illumination, Outcome 4 Alertness ‐ meta‐analysis. | ||||
| 5 Mood ‐ Positive Mood PANAS Scale: mean of all time points Show forest plot | 1 | Mean Difference (IV, Fixed, 95% CI) | Totals not selected | |
| Analysis 1.5 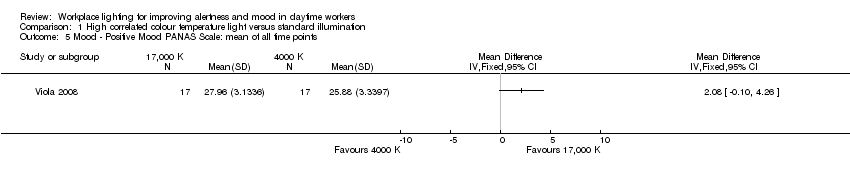 Comparison 1 High correlated colour temperature light versus standard illumination, Outcome 5 Mood ‐ Positive Mood PANAS Scale: mean of all time points. | ||||
| 6 Mood ‐ Negative Mood PANAS Scale: mean of all time points Show forest plot | 1 | Mean Difference (IV, Fixed, 95% CI) | Totals not selected | |
| Analysis 1.6  Comparison 1 High correlated colour temperature light versus standard illumination, Outcome 6 Mood ‐ Negative Mood PANAS Scale: mean of all time points. | ||||
| 7 Adverse events ‐ eye discomfort: mean of all time points Show forest plot | 1 | Mean Difference (IV, Fixed, 95% CI) | Totals not selected | |
| Analysis 1.7  Comparison 1 High correlated colour temperature light versus standard illumination, Outcome 7 Adverse events ‐ eye discomfort: mean of all time points. | ||||
| 8 Adverse events ‐ irritability: mean of all time points Show forest plot | 1 | Mean Difference (IV, Fixed, 95% CI) | Totals not selected | |
| Analysis 1.8  Comparison 1 High correlated colour temperature light versus standard illumination, Outcome 8 Adverse events ‐ irritability: mean of all time points. | ||||
| 9 Adverse events ‐ headache: mean of all time points Show forest plot | 1 | Mean Difference (IV, Fixed, 95% CI) | Totals not selected | |
| Analysis 1.9 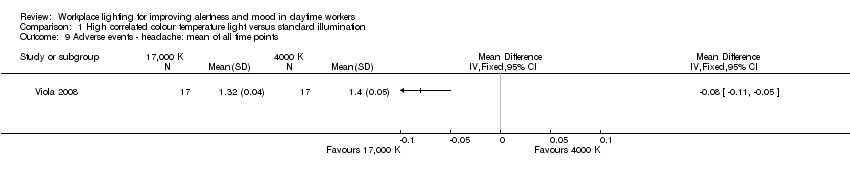 Comparison 1 High correlated colour temperature light versus standard illumination, Outcome 9 Adverse events ‐ headache: mean of all time points. | ||||
| 10 Adverse events ‐ eye strain: mean of all time points Show forest plot | 1 | Mean Difference (IV, Fixed, 95% CI) | Totals not selected | |
| Analysis 1.10 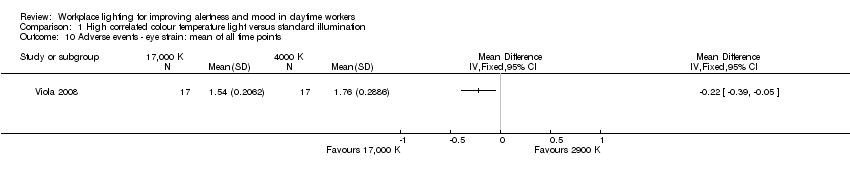 Comparison 1 High correlated colour temperature light versus standard illumination, Outcome 10 Adverse events ‐ eye strain: mean of all time points. | ||||
| 11 Adverse events ‐ eye fatigue: mean of all time points Show forest plot | 1 | Mean Difference (IV, Fixed, 95% CI) | Totals not selected | |
| Analysis 1.11  Comparison 1 High correlated colour temperature light versus standard illumination, Outcome 11 Adverse events ‐ eye fatigue: mean of all time points. | ||||
| 12 Adverse events ‐ difficult focusing: mean of all time points Show forest plot | 1 | Mean Difference (IV, Fixed, 95% CI) | Totals not selected | |
| Analysis 1.12 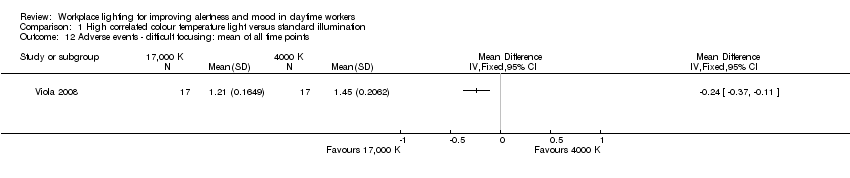 Comparison 1 High correlated colour temperature light versus standard illumination, Outcome 12 Adverse events ‐ difficult focusing: mean of all time points. | ||||
| 13 Adverse events ‐ difficulty concentrating: mean of all time points Show forest plot | 1 | Mean Difference (IV, Fixed, 95% CI) | Totals not selected | |
| Analysis 1.13  Comparison 1 High correlated colour temperature light versus standard illumination, Outcome 13 Adverse events ‐ difficulty concentrating: mean of all time points. | ||||
| 14 Adverse events ‐ blurred vision: mean of all time points Show forest plot | 1 | Mean Difference (IV, Fixed, 95% CI) | Totals not selected | |
| Analysis 1.14  Comparison 1 High correlated colour temperature light versus standard illumination, Outcome 14 Adverse events ‐ blurred vision: mean of all time points. | ||||
| Outcome or subgroup title | No. of studies | No. of participants | Statistical method | Effect size |
| 1 Mood BDI: indirect lighting versus direct lighting Show forest plot | 1 | Mean Difference (IV, Fixed, 95% CI) | Totals not selected | |
| Analysis 2.1  Comparison 2 Different proportions of direct and indirect indoor lighting, Outcome 1 Mood BDI: indirect lighting versus direct lighting. | ||||
| 1.1 Mood BDI after 2 months: indirect lighting versus direct lighting | 1 | Mean Difference (IV, Fixed, 95% CI) | 0.0 [0.0, 0.0] | |
| 1.2 Mood BDI after 5 months: indirect lighting versus direct lighting | 1 | Mean Difference (IV, Fixed, 95% CI) | 0.0 [0.0, 0.0] | |
| 2 Adverse events ‐ ocular problems indirect versus direct lighting Show forest plot | 1 | Mean Difference (IV, Fixed, 95% CI) | Totals not selected | |
| Analysis 2.2  Comparison 2 Different proportions of direct and indirect indoor lighting, Outcome 2 Adverse events ‐ ocular problems indirect versus direct lighting. | ||||
| 2.1 Adverse events after 2 months ‐ ocular problems indirect versus direct lighting | 1 | Mean Difference (IV, Fixed, 95% CI) | 0.0 [0.0, 0.0] | |
| 2.2 Adverse events after 5 months ‐ ocular problems indirect versus direct lighting | 1 | Mean Difference (IV, Fixed, 95% CI) | 0.0 [0.0, 0.0] | |
| 3 Mood Beck Depression Inventory (BDI): indirect lighting versus 70% indirect lighting Show forest plot | 1 | Mean Difference (IV, Fixed, 95% CI) | Totals not selected | |
| Analysis 2.3  Comparison 2 Different proportions of direct and indirect indoor lighting, Outcome 3 Mood Beck Depression Inventory (BDI): indirect lighting versus 70% indirect lighting. | ||||
| 3.1 Mood BDI after 2 months: indirect lighting versus 70% indirect lighting | 1 | Mean Difference (IV, Fixed, 95% CI) | 0.0 [0.0, 0.0] | |
| 3.2 Mood BDI after 5 months: indirect lighting versus 70% indirect lighting | 1 | Mean Difference (IV, Fixed, 95% CI) | 0.0 [0.0, 0.0] | |
| 4 Mood BDI: indirect lighting versus 30% indirect lighting Show forest plot | 1 | Mean Difference (IV, Fixed, 95% CI) | Totals not selected | |
| Analysis 2.4  Comparison 2 Different proportions of direct and indirect indoor lighting, Outcome 4 Mood BDI: indirect lighting versus 30% indirect lighting. | ||||
| 4.1 Mood BDI after 2 months: indirect lighting versus 30% indirect lighting | 1 | Mean Difference (IV, Fixed, 95% CI) | 0.0 [0.0, 0.0] | |
| 4.2 Mood BDI after 5 months: indirect lighting versus 30% indirect lighting | 1 | Mean Difference (IV, Fixed, 95% CI) | 0.0 [0.0, 0.0] | |
| 5 Mood BDI: 70% indirect lighting versus 30% indirect lighting Show forest plot | 1 | Mean Difference (IV, Fixed, 95% CI) | Totals not selected | |
| Analysis 2.5  Comparison 2 Different proportions of direct and indirect indoor lighting, Outcome 5 Mood BDI: 70% indirect lighting versus 30% indirect lighting. | ||||
| 5.1 Mood BDI after 2 months: 70% indirect lighting versus 30% indirect lighting | 1 | Mean Difference (IV, Fixed, 95% CI) | 0.0 [0.0, 0.0] | |
| 5.2 Mood BDI after 5 months: 70% indirect lighting versus 30% indirect lighting | 1 | Mean Difference (IV, Fixed, 95% CI) | 0.0 [0.0, 0.0] | |
| 6 Mood BDI: 70% indirect lighting versus direct lighting Show forest plot | 1 | Mean Difference (IV, Fixed, 95% CI) | Totals not selected | |
| Analysis 2.6  Comparison 2 Different proportions of direct and indirect indoor lighting, Outcome 6 Mood BDI: 70% indirect lighting versus direct lighting. | ||||
| 6.1 Mood BDI after 2 months: 70% indirect lighting versus direct lighting | 1 | Mean Difference (IV, Fixed, 95% CI) | 0.0 [0.0, 0.0] | |
| 6.2 Mood BDI after 5 months: 70% indirect lighting versus direct lighting | 1 | Mean Difference (IV, Fixed, 95% CI) | 0.0 [0.0, 0.0] | |
| 7 Mood BDI: 30% indirect lighting versus direct lighting Show forest plot | 1 | Mean Difference (IV, Fixed, 95% CI) | Totals not selected | |
| Analysis 2.7 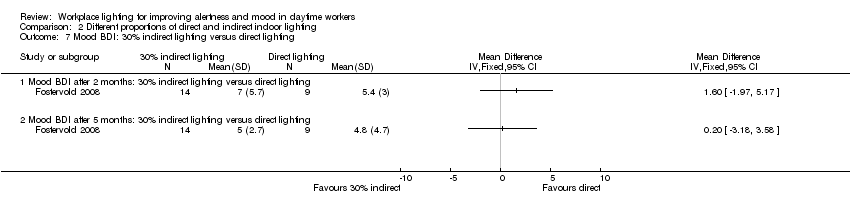 Comparison 2 Different proportions of direct and indirect indoor lighting, Outcome 7 Mood BDI: 30% indirect lighting versus direct lighting. | ||||
| 7.1 Mood BDI after 2 months: 30% indirect lighting versus direct lighting | 1 | Mean Difference (IV, Fixed, 95% CI) | 0.0 [0.0, 0.0] | |
| 7.2 Mood BDI after 5 months: 30% indirect lighting versus direct lighting | 1 | Mean Difference (IV, Fixed, 95% CI) | 0.0 [0.0, 0.0] | |
| 8 Adverse events ‐ reading problems indirect versus 30% indirect lighting Show forest plot | 1 | Mean Difference (IV, Fixed, 95% CI) | Totals not selected | |
| Analysis 2.8  Comparison 2 Different proportions of direct and indirect indoor lighting, Outcome 8 Adverse events ‐ reading problems indirect versus 30% indirect lighting. | ||||
| 8.1 Adverse events after 2 months ‐ reading problems indirect versus 30% indirect lighting | 1 | Mean Difference (IV, Fixed, 95% CI) | 0.0 [0.0, 0.0] | |
| 8.2 Adverse events after 5 months ‐ reading problems indirect versus 30% indirect lighting | 1 | Mean Difference (IV, Fixed, 95% CI) | 0.0 [0.0, 0.0] | |
| 9 Adverse events ‐ ocular problems indirect versus 70% indirect lighting Show forest plot | 1 | Mean Difference (IV, Fixed, 95% CI) | Totals not selected | |
| Analysis 2.9  Comparison 2 Different proportions of direct and indirect indoor lighting, Outcome 9 Adverse events ‐ ocular problems indirect versus 70% indirect lighting. | ||||
| 9.1 Adverse events after 2 months ‐ ocular problems indirect versus 70% indirect lighting | 1 | Mean Difference (IV, Fixed, 95% CI) | 0.0 [0.0, 0.0] | |
| 9.2 Adverse events after 5 months ‐ ocular problems indirect versus 70% indirect lighting | 1 | Mean Difference (IV, Fixed, 95% CI) | 0.0 [0.0, 0.0] | |
| 10 Adverse events ‐ ocular problems indirect versus 30% indirect lighting Show forest plot | 1 | Mean Difference (IV, Fixed, 95% CI) | Totals not selected | |
| Analysis 2.10 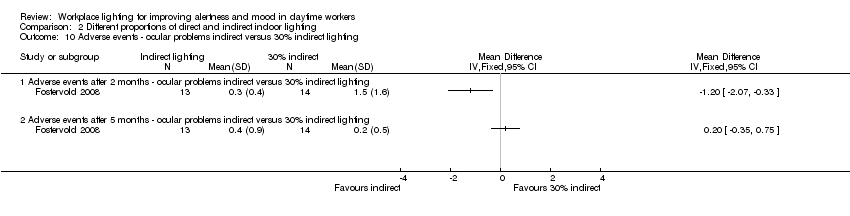 Comparison 2 Different proportions of direct and indirect indoor lighting, Outcome 10 Adverse events ‐ ocular problems indirect versus 30% indirect lighting. | ||||
| 10.1 Adverse events after 2 months ‐ ocular problems indirect versus 30% indirect lighting | 1 | Mean Difference (IV, Fixed, 95% CI) | 0.0 [0.0, 0.0] | |
| 10.2 Adverse events after 5 months ‐ ocular problems indirect versus 30% indirect lighting | 1 | Mean Difference (IV, Fixed, 95% CI) | 0.0 [0.0, 0.0] | |
| 11 Adverse events ‐ ocular problems 70% indirect versus 30% indirect lighting Show forest plot | 1 | Mean Difference (IV, Fixed, 95% CI) | Totals not selected | |
| Analysis 2.11  Comparison 2 Different proportions of direct and indirect indoor lighting, Outcome 11 Adverse events ‐ ocular problems 70% indirect versus 30% indirect lighting. | ||||
| 11.1 Adverse events after 2 months ‐ ocular problems 70% indirect versus 30% indirect lighting | 1 | Mean Difference (IV, Fixed, 95% CI) | 0.0 [0.0, 0.0] | |
| 11.2 Adverse events after 5 months ‐ ocular problems 70% indirect versus 30% indirect lighting | 1 | Mean Difference (IV, Fixed, 95% CI) | 0.0 [0.0, 0.0] | |
| 12 Adverse events ‐ ocular problems 70% indirect versus direct lighting Show forest plot | 1 | Mean Difference (IV, Fixed, 95% CI) | Totals not selected | |
| Analysis 2.12 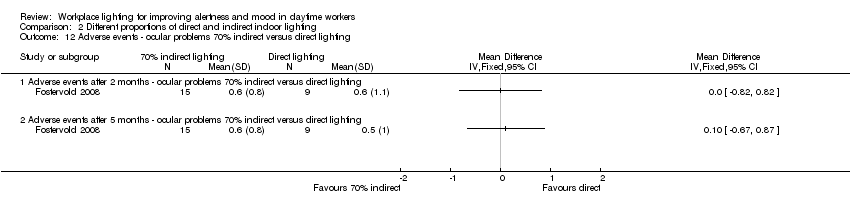 Comparison 2 Different proportions of direct and indirect indoor lighting, Outcome 12 Adverse events ‐ ocular problems 70% indirect versus direct lighting. | ||||
| 12.1 Adverse events after 2 months ‐ ocular problems 70% indirect versus direct lighting | 1 | Mean Difference (IV, Fixed, 95% CI) | 0.0 [0.0, 0.0] | |
| 12.2 Adverse events after 5 months ‐ ocular problems 70% indirect versus direct lighting | 1 | Mean Difference (IV, Fixed, 95% CI) | 0.0 [0.0, 0.0] | |
| 13 Adverse events ‐ ocular problems 30% indirect versus direct lighting Show forest plot | 1 | Mean Difference (IV, Fixed, 95% CI) | Totals not selected | |
| Analysis 2.13  Comparison 2 Different proportions of direct and indirect indoor lighting, Outcome 13 Adverse events ‐ ocular problems 30% indirect versus direct lighting. | ||||
| 13.1 Adverse events after 2 months ‐ ocular problems 30% indirect versus direct lighting | 1 | Mean Difference (IV, Fixed, 95% CI) | 0.0 [0.0, 0.0] | |
| 13.2 Adverse events after 5 months ‐ ocular problems 30% indirect versus direct lighting | 1 | Mean Difference (IV, Fixed, 95% CI) | 0.0 [0.0, 0.0] | |
| 14 Adverse events ‐ reading problems indirect versus 70% indirect lighting Show forest plot | 1 | Mean Difference (IV, Fixed, 95% CI) | Totals not selected | |
| Analysis 2.14  Comparison 2 Different proportions of direct and indirect indoor lighting, Outcome 14 Adverse events ‐ reading problems indirect versus 70% indirect lighting. | ||||
| 14.1 Adverse events after 2 months ‐ reading problems indirect versus 70% indirect lightning | 1 | Mean Difference (IV, Fixed, 95% CI) | 0.0 [0.0, 0.0] | |
| 14.2 Adverse events after 5 months ‐ reading problems indirect versus 70% indirect lightning | 1 | Mean Difference (IV, Fixed, 95% CI) | 0.0 [0.0, 0.0] | |
| 15 Adverse events ‐ reading problems indirect versus direct lighting Show forest plot | 1 | Mean Difference (IV, Fixed, 95% CI) | Totals not selected | |
| Analysis 2.15  Comparison 2 Different proportions of direct and indirect indoor lighting, Outcome 15 Adverse events ‐ reading problems indirect versus direct lighting. | ||||
| 15.1 Adverse events after 2 months ‐ reading problems indirect versus direct lighting | 1 | Mean Difference (IV, Fixed, 95% CI) | 0.0 [0.0, 0.0] | |
| 15.2 Adverse events after 5 months ‐ reading problems indirect versus direct lighting | 1 | Mean Difference (IV, Fixed, 95% CI) | 0.0 [0.0, 0.0] | |
| 16 Adverse events ‐ reading problems 70% indirect versus 30% indirect lighting Show forest plot | 1 | Mean Difference (IV, Fixed, 95% CI) | Totals not selected | |
| Analysis 2.16  Comparison 2 Different proportions of direct and indirect indoor lighting, Outcome 16 Adverse events ‐ reading problems 70% indirect versus 30% indirect lighting. | ||||
| 16.1 Adverse events after 2 months ‐ reading problems 70% indirect versus 30% indirect lighting | 1 | Mean Difference (IV, Fixed, 95% CI) | 0.0 [0.0, 0.0] | |
| 16.2 Adverse events after 5 months ‐ reading problems 70% indirect versus 30% indirect lighting | 1 | Mean Difference (IV, Fixed, 95% CI) | 0.0 [0.0, 0.0] | |
| 17 Adverse events ‐ reading problems 70% indirect versus direct lighting Show forest plot | 1 | Mean Difference (IV, Fixed, 95% CI) | Totals not selected | |
| Analysis 2.17  Comparison 2 Different proportions of direct and indirect indoor lighting, Outcome 17 Adverse events ‐ reading problems 70% indirect versus direct lighting. | ||||
| 17.1 Adverse events after 2 months ‐ reading problems 70% indirect versus direct lighting | 1 | Mean Difference (IV, Fixed, 95% CI) | 0.0 [0.0, 0.0] | |
| 17.2 Adverse events after 5 months ‐ reading problems 70% indirect versus direct lighting | 1 | Mean Difference (IV, Fixed, 95% CI) | 0.0 [0.0, 0.0] | |
| 18 Adverse events ‐ reading problems 30% indirect versus direct lighting Show forest plot | 1 | Mean Difference (IV, Fixed, 95% CI) | Totals not selected | |
| Analysis 2.18  Comparison 2 Different proportions of direct and indirect indoor lighting, Outcome 18 Adverse events ‐ reading problems 30% indirect versus direct lighting. | ||||
| 18.1 Adverse events after 2 months ‐ reading problems 30% indirect versus direct lighting | 1 | Mean Difference (IV, Fixed, 95% CI) | 0.0 [0.0, 0.0] | |
| 18.2 Adverse events after 5 months ‐ reading problems 30% indirect versus direct lighting | 1 | Mean Difference (IV, Fixed, 95% CI) | 0.0 [0.0, 0.0] | |
| 19 Adverse events ‐ concentration problems indirect versus 70% indirect lighting Show forest plot | 1 | Mean Difference (IV, Fixed, 95% CI) | Totals not selected | |
| Analysis 2.19  Comparison 2 Different proportions of direct and indirect indoor lighting, Outcome 19 Adverse events ‐ concentration problems indirect versus 70% indirect lighting. | ||||
| 19.1 Adverse events after 2 months ‐ concentration problems indirect versus 70% indirect lighting | 1 | Mean Difference (IV, Fixed, 95% CI) | 0.0 [0.0, 0.0] | |
| 19.2 Adverse events after 5 months ‐ concentration problems indirect versus 70% indirect lighting | 1 | Mean Difference (IV, Fixed, 95% CI) | 0.0 [0.0, 0.0] | |
| 20 Adverse events ‐ concentration problems indirect versus 30% indirect lighting Show forest plot | 1 | Mean Difference (IV, Fixed, 95% CI) | Totals not selected | |
| Analysis 2.20 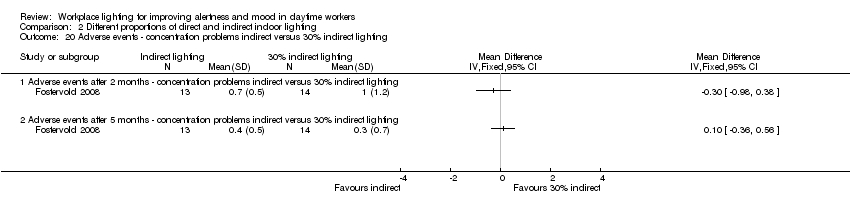 Comparison 2 Different proportions of direct and indirect indoor lighting, Outcome 20 Adverse events ‐ concentration problems indirect versus 30% indirect lighting. | ||||
| 20.1 Adverse events after 2 months ‐ concentration problems indirect versus 30% indirect lighting | 1 | Mean Difference (IV, Fixed, 95% CI) | 0.0 [0.0, 0.0] | |
| 20.2 Adverse events after 5 months ‐ concentration problems indirect versus 30% indirect lighting | 1 | Mean Difference (IV, Fixed, 95% CI) | 0.0 [0.0, 0.0] | |
| 21 Adverse events ‐ concentration problems indirect versus direct lighting Show forest plot | 1 | Mean Difference (IV, Fixed, 95% CI) | Totals not selected | |
| Analysis 2.21  Comparison 2 Different proportions of direct and indirect indoor lighting, Outcome 21 Adverse events ‐ concentration problems indirect versus direct lighting. | ||||
| 21.1 Adverse events after 2 months ‐ concentration problems indirect versus direct lighting | 1 | Mean Difference (IV, Fixed, 95% CI) | 0.0 [0.0, 0.0] | |
| 21.2 Adverse events after 5 months ‐ concentration problems indirect versus direct lighting | 1 | Mean Difference (IV, Fixed, 95% CI) | 0.0 [0.0, 0.0] | |
| 22 Adverse events ‐ concentration problems 70% indirect versus 30% indirect lighting Show forest plot | 1 | Mean Difference (IV, Fixed, 95% CI) | Totals not selected | |
| Analysis 2.22  Comparison 2 Different proportions of direct and indirect indoor lighting, Outcome 22 Adverse events ‐ concentration problems 70% indirect versus 30% indirect lighting. | ||||
| 22.1 Adverse events after 2 months ‐ concentration problems 70% indirect versus 30% indirect lighting | 1 | Mean Difference (IV, Fixed, 95% CI) | 0.0 [0.0, 0.0] | |
| 22.2 Adverse events after 5 months ‐ concentration problems 70% indirect versus 30% indirect lighting | 1 | Mean Difference (IV, Fixed, 95% CI) | 0.0 [0.0, 0.0] | |
| 23 Adverse events ‐ concentration problems 70% indirect versus direct lighting Show forest plot | 1 | Mean Difference (IV, Fixed, 95% CI) | Totals not selected | |
| Analysis 2.23  Comparison 2 Different proportions of direct and indirect indoor lighting, Outcome 23 Adverse events ‐ concentration problems 70% indirect versus direct lighting. | ||||
| 23.1 Adverse events after 2 months ‐ concentration problems 70% indirect versus direct lighting | 1 | Mean Difference (IV, Fixed, 95% CI) | 0.0 [0.0, 0.0] | |
| 23.2 Adverse events after 5 months ‐ concentration problems 70% indirect versus direct lighting | 1 | Mean Difference (IV, Fixed, 95% CI) | 0.0 [0.0, 0.0] | |
| 24 Adverse events ‐ concentration problems 30% indirect versus direct lighting Show forest plot | 1 | Mean Difference (IV, Fixed, 95% CI) | Totals not selected | |
| Analysis 2.24 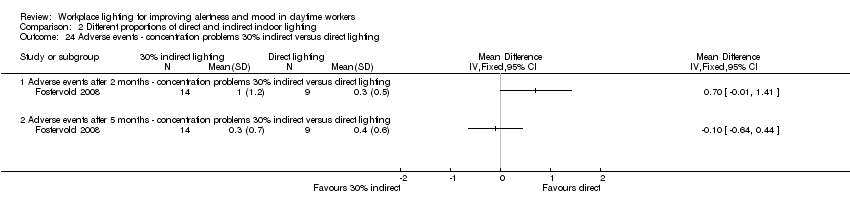 Comparison 2 Different proportions of direct and indirect indoor lighting, Outcome 24 Adverse events ‐ concentration problems 30% indirect versus direct lighting. | ||||
| 24.1 Adverse events after 2 months ‐ concentration problems 30% indirect versus direct lighting | 1 | Mean Difference (IV, Fixed, 95% CI) | 0.0 [0.0, 0.0] | |
| 24.2 Adverse events after 5 months ‐ concentration problems 30% indirect versus direct lighting | 1 | Mean Difference (IV, Fixed, 95% CI) | 0.0 [0.0, 0.0] | |
| 25 Adverse events ‐ musculoskeletal symptoms indirect versus 70% indirect lighting Show forest plot | 1 | Mean Difference (IV, Fixed, 95% CI) | Totals not selected | |
| Analysis 2.25  Comparison 2 Different proportions of direct and indirect indoor lighting, Outcome 25 Adverse events ‐ musculoskeletal symptoms indirect versus 70% indirect lighting. | ||||
| 25.1 Adverse events after 2 months ‐ musculoskeletal symptoms indirect versus 70% indirect lighting | 1 | Mean Difference (IV, Fixed, 95% CI) | 0.0 [0.0, 0.0] | |
| 25.2 Adverse events after 5 months ‐ musculoskeletal symptoms indirect versus 70% indirect lighting | 1 | Mean Difference (IV, Fixed, 95% CI) | 0.0 [0.0, 0.0] | |
| 26 Adverse events ‐ musculoskeletal symptoms indirect versus 30% indirect lighting Show forest plot | 1 | Mean Difference (IV, Fixed, 95% CI) | Totals not selected | |
| Analysis 2.26  Comparison 2 Different proportions of direct and indirect indoor lighting, Outcome 26 Adverse events ‐ musculoskeletal symptoms indirect versus 30% indirect lighting. | ||||
| 26.1 Adverse events after 2 months ‐ musculoskeletal symptoms indirect versus 30% indirect lighting | 1 | Mean Difference (IV, Fixed, 95% CI) | 0.0 [0.0, 0.0] | |
| 26.2 Adverse events after 5 months ‐ musculoskeletal symptoms indirect versus 30% indirect lighting | 1 | Mean Difference (IV, Fixed, 95% CI) | 0.0 [0.0, 0.0] | |
| 27 Adverse events ‐ musculoskeletal symptoms indirect versus direct lighting Show forest plot | 1 | Mean Difference (IV, Fixed, 95% CI) | Totals not selected | |
| Analysis 2.27  Comparison 2 Different proportions of direct and indirect indoor lighting, Outcome 27 Adverse events ‐ musculoskeletal symptoms indirect versus direct lighting. | ||||
| 27.1 Adverse events after 2 months ‐ musculoskeletal symptoms indirect versus direct lighting | 1 | Mean Difference (IV, Fixed, 95% CI) | 0.0 [0.0, 0.0] | |
| 27.2 Adverse events after 5 months ‐ musculoskeletal symptoms indirect versus direct lighting | 1 | Mean Difference (IV, Fixed, 95% CI) | 0.0 [0.0, 0.0] | |
| 28 Adverse events ‐ musculoskeletal symptoms 70% indirect versus 30% indirect lighting Show forest plot | 1 | Mean Difference (IV, Fixed, 95% CI) | Totals not selected | |
| Analysis 2.28  Comparison 2 Different proportions of direct and indirect indoor lighting, Outcome 28 Adverse events ‐ musculoskeletal symptoms 70% indirect versus 30% indirect lighting. | ||||
| 28.1 Adverse events after 2 months ‐ musculoskeletal symptoms 70% indirect versus 30% indirect lighting | 1 | Mean Difference (IV, Fixed, 95% CI) | 0.0 [0.0, 0.0] | |
| 28.2 Adverse events after 5 months ‐ musculoskeletal symptoms 70% indirect versus 30% indirect lighting | 1 | Mean Difference (IV, Fixed, 95% CI) | 0.0 [0.0, 0.0] | |
| 29 Adverse events ‐ musculoskeletal symptoms 70% indirect versus direct lighting Show forest plot | 1 | Mean Difference (IV, Fixed, 95% CI) | Totals not selected | |
| Analysis 2.29  Comparison 2 Different proportions of direct and indirect indoor lighting, Outcome 29 Adverse events ‐ musculoskeletal symptoms 70% indirect versus direct lighting. | ||||
| 29.1 Adverse events after 2 months ‐ musculoskeletal symptoms 70% indirect versus direct lighting | 1 | Mean Difference (IV, Fixed, 95% CI) | 0.0 [0.0, 0.0] | |
| 29.2 Adverse events after 5 months ‐ musculoskeletal symptoms 70% indirect versus direct lighting | 1 | Mean Difference (IV, Fixed, 95% CI) | 0.0 [0.0, 0.0] | |
| 30 Adverse events ‐ musculoskeletal symptoms 30% indirect versus direct lighting Show forest plot | 1 | Mean Difference (IV, Fixed, 95% CI) | Totals not selected | |
| Analysis 2.30 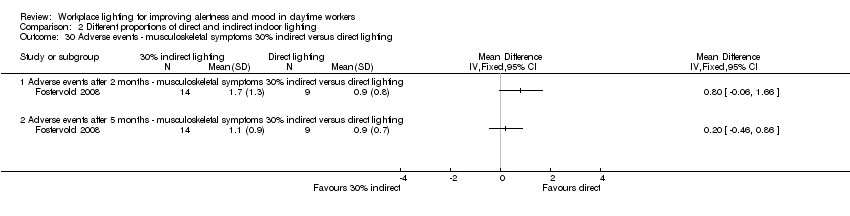 Comparison 2 Different proportions of direct and indirect indoor lighting, Outcome 30 Adverse events ‐ musculoskeletal symptoms 30% indirect versus direct lighting. | ||||
| 30.1 Adverse events after 2 months ‐ musculoskeletal symptoms 30% indirect versus direct lighting | 1 | Mean Difference (IV, Fixed, 95% CI) | 0.0 [0.0, 0.0] | |
| 30.2 Adverse events after 5 months ‐ musculoskeletal symptoms 30% indirect versus direct lighting | 1 | Mean Difference (IV, Fixed, 95% CI) | 0.0 [0.0, 0.0] | |
| Outcome or subgroup title | No. of studies | No. of participants | Statistical method | Effect size |
| 1 Alertness ‐ Epworth Sleepiness Scale Show forest plot | 1 | Mean Difference (Fixed, 95% CI) | Totals not selected | |
| Analysis 3.1  Comparison 3 Individually applied blue‐enriched light versus no treatment, Outcome 1 Alertness ‐ Epworth Sleepiness Scale. | ||||
| 2 Mood Beck Depression Inventory‐II Show forest plot | 1 | Mean Difference (Fixed, 95% CI) | Totals not selected | |
| Analysis 3.2  Comparison 3 Individually applied blue‐enriched light versus no treatment, Outcome 2 Mood Beck Depression Inventory‐II. | ||||
| Outcome or subgroup title | No. of studies | No. of participants | Statistical method | Effect size |
| 1 Alertness (visual analogue scale (VAS)) after 2 weeks of intervention Show forest plot | 1 | Mean Difference (IV, Fixed, 95% CI) | Totals not selected | |
| Analysis 4.1  Comparison 4 Morning bright light versus afternoon bright light, Outcome 1 Alertness (visual analogue scale (VAS)) after 2 weeks of intervention. | ||||
| 2 Mood (≥ 50% of reduction of Structured Interview Guide for the Hamilton Depression Rating Scale‐Seasonal Affective Disorders Version (SIGH‐SAD) scores from baseline after 2 weeks of treatment)) Show forest plot | 1 | Risk Ratio (M‐H, Fixed, 95% CI) | Totals not selected | |
| Analysis 4.2  Comparison 4 Morning bright light versus afternoon bright light, Outcome 2 Mood (≥ 50% of reduction of Structured Interview Guide for the Hamilton Depression Rating Scale‐Seasonal Affective Disorders Version (SIGH‐SAD) scores from baseline after 2 weeks of treatment)). | ||||
| 3 Mood SIGH‐SAD after 2 weeks of intervention Show forest plot | 1 | Mean Difference (IV, Fixed, 95% CI) | Totals not selected | |
| Analysis 4.3  Comparison 4 Morning bright light versus afternoon bright light, Outcome 3 Mood SIGH‐SAD after 2 weeks of intervention. | ||||
| 4 Mood 21‐item Hamilton Depressive Rating Scale after 2 weeks of interventions Show forest plot | 1 | Mean Difference (IV, Fixed, 95% CI) | Totals not selected | |
| Analysis 4.4 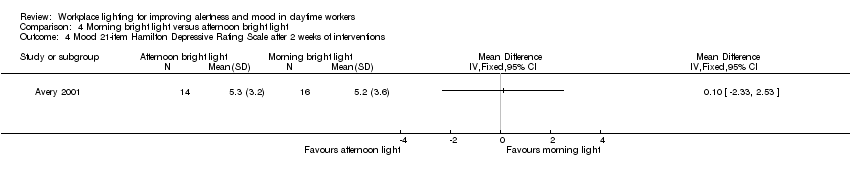 Comparison 4 Morning bright light versus afternoon bright light, Outcome 4 Mood 21‐item Hamilton Depressive Rating Scale after 2 weeks of interventions. | ||||
| 5 Mood 17‐item Hamilton Depressive Rating Scale after 2 weeks of intervention Show forest plot | 1 | Mean Difference (IV, Fixed, 95% CI) | Totals not selected | |
| Analysis 4.5  Comparison 4 Morning bright light versus afternoon bright light, Outcome 5 Mood 17‐item Hamilton Depressive Rating Scale after 2 weeks of intervention. | ||||
| 6 Mood Seasonal Affective Disorders subscale after 2 weeks of intervention Show forest plot | 1 | Mean Difference (IV, Fixed, 95% CI) | Totals not selected | |
| Analysis 4.6  Comparison 4 Morning bright light versus afternoon bright light, Outcome 6 Mood Seasonal Affective Disorders subscale after 2 weeks of intervention. | ||||
| 7 Mood VAS after 2 weeks of intervention Show forest plot | 1 | Mean Difference (IV, Fixed, 95% CI) | Totals not selected | |
| Analysis 4.7  Comparison 4 Morning bright light versus afternoon bright light, Outcome 7 Mood VAS after 2 weeks of intervention. | ||||
| 8 Frequency of adverse events after 2 weeks of intervention Show forest plot | 1 | Risk Ratio (M‐H, Fixed, 95% CI) | Totals not selected | |
| Analysis 4.8  Comparison 4 Morning bright light versus afternoon bright light, Outcome 8 Frequency of adverse events after 2 weeks of intervention. | ||||

PRISMA study flow diagram.
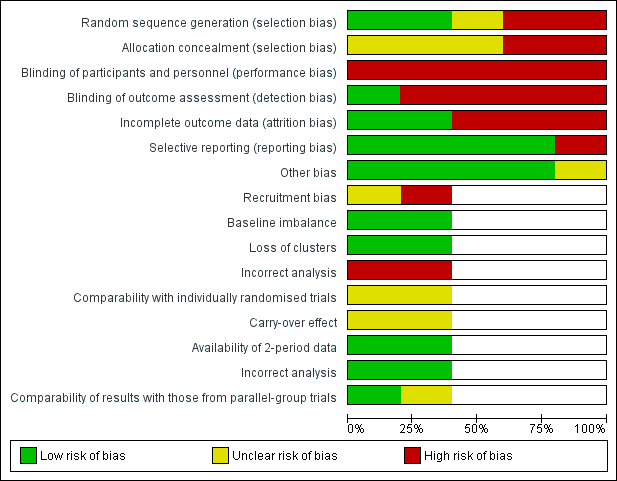
Risk of bias graph: review authors' judgements about each risk of bias item presented as percentages across all included studies.

Risk of bias summary: review authors' judgements about each risk of bias item for each included study.
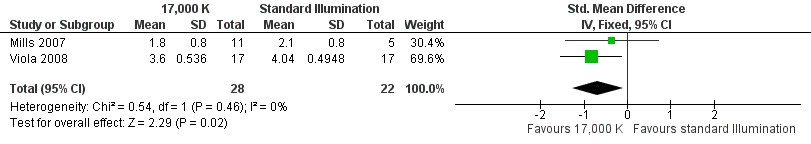
Forest plot of comparison: 4 High correlated colour temperature light versus standard illumination, outcome: alertness.
Comparison 1 High correlated colour temperature light versus standard illumination, Outcome 1 Alertness ‐ Item Decreased Daytime Alertness from Columbia Jet Lag Scale 14 weeks.
Comparison 1 High correlated colour temperature light versus standard illumination, Outcome 2 Alertness ‐ Item Sleepiness in Day from Columbia Jet Lag Scale 14 weeks.
Comparison 1 High correlated colour temperature light versus standard illumination, Outcome 3 Alertness ‐ Karolinska Sleepiness Scale: mean of all time points.
Comparison 1 High correlated colour temperature light versus standard illumination, Outcome 4 Alertness ‐ meta‐analysis.
Comparison 1 High correlated colour temperature light versus standard illumination, Outcome 5 Mood ‐ Positive Mood PANAS Scale: mean of all time points.
Comparison 1 High correlated colour temperature light versus standard illumination, Outcome 6 Mood ‐ Negative Mood PANAS Scale: mean of all time points.
Comparison 1 High correlated colour temperature light versus standard illumination, Outcome 7 Adverse events ‐ eye discomfort: mean of all time points.
Comparison 1 High correlated colour temperature light versus standard illumination, Outcome 8 Adverse events ‐ irritability: mean of all time points.
Comparison 1 High correlated colour temperature light versus standard illumination, Outcome 9 Adverse events ‐ headache: mean of all time points.
Comparison 1 High correlated colour temperature light versus standard illumination, Outcome 10 Adverse events ‐ eye strain: mean of all time points.
Comparison 1 High correlated colour temperature light versus standard illumination, Outcome 11 Adverse events ‐ eye fatigue: mean of all time points.
Comparison 1 High correlated colour temperature light versus standard illumination, Outcome 12 Adverse events ‐ difficult focusing: mean of all time points.
Comparison 1 High correlated colour temperature light versus standard illumination, Outcome 13 Adverse events ‐ difficulty concentrating: mean of all time points.
Comparison 1 High correlated colour temperature light versus standard illumination, Outcome 14 Adverse events ‐ blurred vision: mean of all time points.
Comparison 2 Different proportions of direct and indirect indoor lighting, Outcome 1 Mood BDI: indirect lighting versus direct lighting.
Comparison 2 Different proportions of direct and indirect indoor lighting, Outcome 2 Adverse events ‐ ocular problems indirect versus direct lighting.
Comparison 2 Different proportions of direct and indirect indoor lighting, Outcome 3 Mood Beck Depression Inventory (BDI): indirect lighting versus 70% indirect lighting.
Comparison 2 Different proportions of direct and indirect indoor lighting, Outcome 4 Mood BDI: indirect lighting versus 30% indirect lighting.
Comparison 2 Different proportions of direct and indirect indoor lighting, Outcome 5 Mood BDI: 70% indirect lighting versus 30% indirect lighting.
Comparison 2 Different proportions of direct and indirect indoor lighting, Outcome 6 Mood BDI: 70% indirect lighting versus direct lighting.
Comparison 2 Different proportions of direct and indirect indoor lighting, Outcome 7 Mood BDI: 30% indirect lighting versus direct lighting.
Comparison 2 Different proportions of direct and indirect indoor lighting, Outcome 8 Adverse events ‐ reading problems indirect versus 30% indirect lighting.
Comparison 2 Different proportions of direct and indirect indoor lighting, Outcome 9 Adverse events ‐ ocular problems indirect versus 70% indirect lighting.
Comparison 2 Different proportions of direct and indirect indoor lighting, Outcome 10 Adverse events ‐ ocular problems indirect versus 30% indirect lighting.
Comparison 2 Different proportions of direct and indirect indoor lighting, Outcome 11 Adverse events ‐ ocular problems 70% indirect versus 30% indirect lighting.
Comparison 2 Different proportions of direct and indirect indoor lighting, Outcome 12 Adverse events ‐ ocular problems 70% indirect versus direct lighting.
Comparison 2 Different proportions of direct and indirect indoor lighting, Outcome 13 Adverse events ‐ ocular problems 30% indirect versus direct lighting.
Comparison 2 Different proportions of direct and indirect indoor lighting, Outcome 14 Adverse events ‐ reading problems indirect versus 70% indirect lighting.
Comparison 2 Different proportions of direct and indirect indoor lighting, Outcome 15 Adverse events ‐ reading problems indirect versus direct lighting.
Comparison 2 Different proportions of direct and indirect indoor lighting, Outcome 16 Adverse events ‐ reading problems 70% indirect versus 30% indirect lighting.
Comparison 2 Different proportions of direct and indirect indoor lighting, Outcome 17 Adverse events ‐ reading problems 70% indirect versus direct lighting.
Comparison 2 Different proportions of direct and indirect indoor lighting, Outcome 18 Adverse events ‐ reading problems 30% indirect versus direct lighting.
Comparison 2 Different proportions of direct and indirect indoor lighting, Outcome 19 Adverse events ‐ concentration problems indirect versus 70% indirect lighting.
Comparison 2 Different proportions of direct and indirect indoor lighting, Outcome 20 Adverse events ‐ concentration problems indirect versus 30% indirect lighting.
Comparison 2 Different proportions of direct and indirect indoor lighting, Outcome 21 Adverse events ‐ concentration problems indirect versus direct lighting.
Comparison 2 Different proportions of direct and indirect indoor lighting, Outcome 22 Adverse events ‐ concentration problems 70% indirect versus 30% indirect lighting.
Comparison 2 Different proportions of direct and indirect indoor lighting, Outcome 23 Adverse events ‐ concentration problems 70% indirect versus direct lighting.
Comparison 2 Different proportions of direct and indirect indoor lighting, Outcome 24 Adverse events ‐ concentration problems 30% indirect versus direct lighting.
Comparison 2 Different proportions of direct and indirect indoor lighting, Outcome 25 Adverse events ‐ musculoskeletal symptoms indirect versus 70% indirect lighting.
Comparison 2 Different proportions of direct and indirect indoor lighting, Outcome 26 Adverse events ‐ musculoskeletal symptoms indirect versus 30% indirect lighting.
Comparison 2 Different proportions of direct and indirect indoor lighting, Outcome 27 Adverse events ‐ musculoskeletal symptoms indirect versus direct lighting.
Comparison 2 Different proportions of direct and indirect indoor lighting, Outcome 28 Adverse events ‐ musculoskeletal symptoms 70% indirect versus 30% indirect lighting.
Comparison 2 Different proportions of direct and indirect indoor lighting, Outcome 29 Adverse events ‐ musculoskeletal symptoms 70% indirect versus direct lighting.
Comparison 2 Different proportions of direct and indirect indoor lighting, Outcome 30 Adverse events ‐ musculoskeletal symptoms 30% indirect versus direct lighting.
Comparison 3 Individually applied blue‐enriched light versus no treatment, Outcome 1 Alertness ‐ Epworth Sleepiness Scale.
Comparison 3 Individually applied blue‐enriched light versus no treatment, Outcome 2 Mood Beck Depression Inventory‐II.
Comparison 4 Morning bright light versus afternoon bright light, Outcome 1 Alertness (visual analogue scale (VAS)) after 2 weeks of intervention.
Comparison 4 Morning bright light versus afternoon bright light, Outcome 2 Mood (≥ 50% of reduction of Structured Interview Guide for the Hamilton Depression Rating Scale‐Seasonal Affective Disorders Version (SIGH‐SAD) scores from baseline after 2 weeks of treatment)).
Comparison 4 Morning bright light versus afternoon bright light, Outcome 3 Mood SIGH‐SAD after 2 weeks of intervention.
Comparison 4 Morning bright light versus afternoon bright light, Outcome 4 Mood 21‐item Hamilton Depressive Rating Scale after 2 weeks of interventions.
Comparison 4 Morning bright light versus afternoon bright light, Outcome 5 Mood 17‐item Hamilton Depressive Rating Scale after 2 weeks of intervention.
Comparison 4 Morning bright light versus afternoon bright light, Outcome 6 Mood Seasonal Affective Disorders subscale after 2 weeks of intervention.
Comparison 4 Morning bright light versus afternoon bright light, Outcome 7 Mood VAS after 2 weeks of intervention.
Comparison 4 Morning bright light versus afternoon bright light, Outcome 8 Frequency of adverse events after 2 weeks of intervention.
| High correlated colour temperature light versus standard illumination for improving mood and alertness in daytime workers | ||||
| Patient or population: daytime workers | ||||
| Outcomes | Anticipated absolute effects (95% CI) | № of participants (studies) | Quality of the evidence | |
| Risk with standard illumination | Risk with CCT light | |||
| Alertness KS range 1 to 9 (worst) | ‐‐ | SMD** 0.69 lower | 163 Effective sample size = 50 | ⊕⊝⊝⊝ |
| Mood (positive) | Mean standard positive mood 25.9 | MD 2.08 higher | 94 Effective sample size = 34 | ⊕⊝⊝⊝ |
| Mood (negative) | Mean standard negative mood 13.7 | MD 0.45 lower | 94 Effective sample size = 34 | ⊕⊝⊝⊝ |
| Adverse events ‐ eye discomfort | Mean standard adverse events 1.7 | MD 0.23 lower | 94 Effective sample size = 34 | ⊕⊝⊝⊝ |
| * Effective sample sizes applied to correct for the unit‐of‐analysis error. ** As a rule of thumb, 0.2 Standard Deviations represents a small difference, 0.5 a moderate difference, and 0.8 a large difference. CI: confidence interval; CCT: correlated colour temperature; MD: mean difference; PANAS: Positive and Negative Affect Schedule; SMD: standardised mean difference. | ||||
| GRADE Working Group grades of evidence | ||||
| 1 The assessment of risk of bias for non‐randomised studies starts at low‐quality evidence. We downgraded the level of evidence with one level, i.e. to very low quality, due to imprecision caused by a small sample size. 2 We would have downgraded the level of evidence with one more level due to imprecision caused by wide confidence intervals that include a null effect but we had already reached a judgment of very low‐quality evidence. | ||||
| Indirect light versus direct light for improving mood and alertness in daytime workers | ||||
| Patient or population: daytime workers | ||||
| Outcomes | Anticipated absolute effects (95% CI) | № of participants | Quality of the evidence | |
| Risk with direct light | Risk with indirect light | |||
| Alertness | Not assessed | Not assessed | Not assessed | Not assessed |
| Mood | Mean mood 5.8 | MD 1 higher | 22 | ⊕⊕⊝⊝ |
| Adverse events (ocular problems) | Mean adverse events 0.4 | MD 0.1 lower | 22 | ⊕⊕⊝⊝ |
| CI: confidence interval; MD: mean difference; RCT: randomised controlled trial. | ||||
| GRADE Working Group grades of evidence | ||||
| 1 We downgraded the level of evidence with one level, i.e. from high to moderate quality, due to risk of bias (the authors did not fully describe how or if they employed allocation concealment, outcome assessors were not blinded and there was a high and unbalanced attrition rate). 2 We downgraded the level of evidence with one level, i.e. from moderate to low quality, due to imprecision (a small sample size and a wide confidence interval including a null effect). | ||||
| Individually applied blue‐enriched light versus no treatment for improving mood and alertness in daytime workers | ||||
| Patient or population: daytime workers | ||||
| Outcomes | Anticipated absolute effects (95% CI) | № of participants | Quality of the evidence | |
| Risk with light as usual | Risk with blue‐enriched light | |||
| Alertness | Mean alertness | MD 3.3 lower | 25 | ⊕⊝⊝⊝ |
| Mood | Mean mood | MD 4.8 lower | 25 | ⊕⊝⊝⊝ |
| Adverse events | Not assessed | Not assessed | Not assessed | Not assessed |
| CI: confidence interval; MD: mean difference; RCT: randomised controlled trial. | ||||
| GRADE Working Group grades of evidence | ||||
| 1 We downgraded the level of evidence with two levels, i.e. from high to low quality, due to risk of bias (the authors did not fully describe how or if they employed allocation concealment, outcome assessors were not blinded, results for SIGH‐HDRS were not reported and there was a high attrition rate). 2 We downgraded the level of evidence with one level, i.e. from low to very low quality, due to imprecision (a small sample size and a wide confidence interval). | ||||
| Morning bright light versus afternoon bright light for improving mood and alertness in daytime workers | |||||
| Patient or population: daytime workers | |||||
| Outcomes | Anticipated absolute effects* (95% CI) | Relative effect with morning bright light | № of participants | Quality of the evidence | |
| Risk with afternoon bright light | Risk with morning bright light | ||||
| Alertness | Mean 59 (SD 23) | Mean 66 (SD 25) | MD 7 higher | 30 | ⊕⊕⊝⊝ |
| Mood | 426 per 1000 | 688 per 1000 | RR 1.60 | 30 | ⊕⊕⊝⊝ |
| Adverse events (frequency) | 712 per 1000 | 375 per 1000 | RR 0.53 | 30 | ⊕⊕⊝⊝ |
| *The risk in the intervention group (and its 95% confidence interval) is based on the assumed risk in the comparison group and the relative effect of the intervention (and its 95% CI). CI: confidence interval; MD: mean difference; RCT: randomised controlled trial; RR: risk ratio; SIGH‐SAD: Structured Interview Guide for the Hamilton Depression Rating Scale‐Seasonal Affective Disorders Version. | |||||
| GRADE Working Group grades of evidence | |||||
| 1 We downgraded the level of evidence with one level, i.e. from high to moderate quality, due to risk of bias (the authors did not fully describe their randomisation method nor how or if they employed allocation concealment). 2 We downgraded the level of evidence with one level, i.e. from moderate to low quality, due to imprecision (a small sample size and a wide confidence interval including a null effect). | |||||
| Outcome or subgroup title | No. of studies | No. of participants | Statistical method | Effect size |
| 1 Alertness ‐ Item Decreased Daytime Alertness from Columbia Jet Lag Scale 14 weeks Show forest plot | 1 | Mean Difference (IV, Fixed, 95% CI) | Totals not selected | |
| 2 Alertness ‐ Item Sleepiness in Day from Columbia Jet Lag Scale 14 weeks Show forest plot | 1 | Mean Difference (IV, Fixed, 95% CI) | Totals not selected | |
| 3 Alertness ‐ Karolinska Sleepiness Scale: mean of all time points Show forest plot | 1 | Mean Difference (IV, Fixed, 95% CI) | Totals not selected | |
| 4 Alertness ‐ meta‐analysis Show forest plot | 2 | 50 | Std. Mean Difference (IV, Fixed, 95% CI) | ‐0.69 [‐1.28, ‐0.10] |
| 5 Mood ‐ Positive Mood PANAS Scale: mean of all time points Show forest plot | 1 | Mean Difference (IV, Fixed, 95% CI) | Totals not selected | |
| 6 Mood ‐ Negative Mood PANAS Scale: mean of all time points Show forest plot | 1 | Mean Difference (IV, Fixed, 95% CI) | Totals not selected | |
| 7 Adverse events ‐ eye discomfort: mean of all time points Show forest plot | 1 | Mean Difference (IV, Fixed, 95% CI) | Totals not selected | |
| 8 Adverse events ‐ irritability: mean of all time points Show forest plot | 1 | Mean Difference (IV, Fixed, 95% CI) | Totals not selected | |
| 9 Adverse events ‐ headache: mean of all time points Show forest plot | 1 | Mean Difference (IV, Fixed, 95% CI) | Totals not selected | |
| 10 Adverse events ‐ eye strain: mean of all time points Show forest plot | 1 | Mean Difference (IV, Fixed, 95% CI) | Totals not selected | |
| 11 Adverse events ‐ eye fatigue: mean of all time points Show forest plot | 1 | Mean Difference (IV, Fixed, 95% CI) | Totals not selected | |
| 12 Adverse events ‐ difficult focusing: mean of all time points Show forest plot | 1 | Mean Difference (IV, Fixed, 95% CI) | Totals not selected | |
| 13 Adverse events ‐ difficulty concentrating: mean of all time points Show forest plot | 1 | Mean Difference (IV, Fixed, 95% CI) | Totals not selected | |
| 14 Adverse events ‐ blurred vision: mean of all time points Show forest plot | 1 | Mean Difference (IV, Fixed, 95% CI) | Totals not selected | |
| Outcome or subgroup title | No. of studies | No. of participants | Statistical method | Effect size |
| 1 Mood BDI: indirect lighting versus direct lighting Show forest plot | 1 | Mean Difference (IV, Fixed, 95% CI) | Totals not selected | |
| 1.1 Mood BDI after 2 months: indirect lighting versus direct lighting | 1 | Mean Difference (IV, Fixed, 95% CI) | 0.0 [0.0, 0.0] | |
| 1.2 Mood BDI after 5 months: indirect lighting versus direct lighting | 1 | Mean Difference (IV, Fixed, 95% CI) | 0.0 [0.0, 0.0] | |
| 2 Adverse events ‐ ocular problems indirect versus direct lighting Show forest plot | 1 | Mean Difference (IV, Fixed, 95% CI) | Totals not selected | |
| 2.1 Adverse events after 2 months ‐ ocular problems indirect versus direct lighting | 1 | Mean Difference (IV, Fixed, 95% CI) | 0.0 [0.0, 0.0] | |
| 2.2 Adverse events after 5 months ‐ ocular problems indirect versus direct lighting | 1 | Mean Difference (IV, Fixed, 95% CI) | 0.0 [0.0, 0.0] | |
| 3 Mood Beck Depression Inventory (BDI): indirect lighting versus 70% indirect lighting Show forest plot | 1 | Mean Difference (IV, Fixed, 95% CI) | Totals not selected | |
| 3.1 Mood BDI after 2 months: indirect lighting versus 70% indirect lighting | 1 | Mean Difference (IV, Fixed, 95% CI) | 0.0 [0.0, 0.0] | |
| 3.2 Mood BDI after 5 months: indirect lighting versus 70% indirect lighting | 1 | Mean Difference (IV, Fixed, 95% CI) | 0.0 [0.0, 0.0] | |
| 4 Mood BDI: indirect lighting versus 30% indirect lighting Show forest plot | 1 | Mean Difference (IV, Fixed, 95% CI) | Totals not selected | |
| 4.1 Mood BDI after 2 months: indirect lighting versus 30% indirect lighting | 1 | Mean Difference (IV, Fixed, 95% CI) | 0.0 [0.0, 0.0] | |
| 4.2 Mood BDI after 5 months: indirect lighting versus 30% indirect lighting | 1 | Mean Difference (IV, Fixed, 95% CI) | 0.0 [0.0, 0.0] | |
| 5 Mood BDI: 70% indirect lighting versus 30% indirect lighting Show forest plot | 1 | Mean Difference (IV, Fixed, 95% CI) | Totals not selected | |
| 5.1 Mood BDI after 2 months: 70% indirect lighting versus 30% indirect lighting | 1 | Mean Difference (IV, Fixed, 95% CI) | 0.0 [0.0, 0.0] | |
| 5.2 Mood BDI after 5 months: 70% indirect lighting versus 30% indirect lighting | 1 | Mean Difference (IV, Fixed, 95% CI) | 0.0 [0.0, 0.0] | |
| 6 Mood BDI: 70% indirect lighting versus direct lighting Show forest plot | 1 | Mean Difference (IV, Fixed, 95% CI) | Totals not selected | |
| 6.1 Mood BDI after 2 months: 70% indirect lighting versus direct lighting | 1 | Mean Difference (IV, Fixed, 95% CI) | 0.0 [0.0, 0.0] | |
| 6.2 Mood BDI after 5 months: 70% indirect lighting versus direct lighting | 1 | Mean Difference (IV, Fixed, 95% CI) | 0.0 [0.0, 0.0] | |
| 7 Mood BDI: 30% indirect lighting versus direct lighting Show forest plot | 1 | Mean Difference (IV, Fixed, 95% CI) | Totals not selected | |
| 7.1 Mood BDI after 2 months: 30% indirect lighting versus direct lighting | 1 | Mean Difference (IV, Fixed, 95% CI) | 0.0 [0.0, 0.0] | |
| 7.2 Mood BDI after 5 months: 30% indirect lighting versus direct lighting | 1 | Mean Difference (IV, Fixed, 95% CI) | 0.0 [0.0, 0.0] | |
| 8 Adverse events ‐ reading problems indirect versus 30% indirect lighting Show forest plot | 1 | Mean Difference (IV, Fixed, 95% CI) | Totals not selected | |
| 8.1 Adverse events after 2 months ‐ reading problems indirect versus 30% indirect lighting | 1 | Mean Difference (IV, Fixed, 95% CI) | 0.0 [0.0, 0.0] | |
| 8.2 Adverse events after 5 months ‐ reading problems indirect versus 30% indirect lighting | 1 | Mean Difference (IV, Fixed, 95% CI) | 0.0 [0.0, 0.0] | |
| 9 Adverse events ‐ ocular problems indirect versus 70% indirect lighting Show forest plot | 1 | Mean Difference (IV, Fixed, 95% CI) | Totals not selected | |
| 9.1 Adverse events after 2 months ‐ ocular problems indirect versus 70% indirect lighting | 1 | Mean Difference (IV, Fixed, 95% CI) | 0.0 [0.0, 0.0] | |
| 9.2 Adverse events after 5 months ‐ ocular problems indirect versus 70% indirect lighting | 1 | Mean Difference (IV, Fixed, 95% CI) | 0.0 [0.0, 0.0] | |
| 10 Adverse events ‐ ocular problems indirect versus 30% indirect lighting Show forest plot | 1 | Mean Difference (IV, Fixed, 95% CI) | Totals not selected | |
| 10.1 Adverse events after 2 months ‐ ocular problems indirect versus 30% indirect lighting | 1 | Mean Difference (IV, Fixed, 95% CI) | 0.0 [0.0, 0.0] | |
| 10.2 Adverse events after 5 months ‐ ocular problems indirect versus 30% indirect lighting | 1 | Mean Difference (IV, Fixed, 95% CI) | 0.0 [0.0, 0.0] | |
| 11 Adverse events ‐ ocular problems 70% indirect versus 30% indirect lighting Show forest plot | 1 | Mean Difference (IV, Fixed, 95% CI) | Totals not selected | |
| 11.1 Adverse events after 2 months ‐ ocular problems 70% indirect versus 30% indirect lighting | 1 | Mean Difference (IV, Fixed, 95% CI) | 0.0 [0.0, 0.0] | |
| 11.2 Adverse events after 5 months ‐ ocular problems 70% indirect versus 30% indirect lighting | 1 | Mean Difference (IV, Fixed, 95% CI) | 0.0 [0.0, 0.0] | |
| 12 Adverse events ‐ ocular problems 70% indirect versus direct lighting Show forest plot | 1 | Mean Difference (IV, Fixed, 95% CI) | Totals not selected | |
| 12.1 Adverse events after 2 months ‐ ocular problems 70% indirect versus direct lighting | 1 | Mean Difference (IV, Fixed, 95% CI) | 0.0 [0.0, 0.0] | |
| 12.2 Adverse events after 5 months ‐ ocular problems 70% indirect versus direct lighting | 1 | Mean Difference (IV, Fixed, 95% CI) | 0.0 [0.0, 0.0] | |
| 13 Adverse events ‐ ocular problems 30% indirect versus direct lighting Show forest plot | 1 | Mean Difference (IV, Fixed, 95% CI) | Totals not selected | |
| 13.1 Adverse events after 2 months ‐ ocular problems 30% indirect versus direct lighting | 1 | Mean Difference (IV, Fixed, 95% CI) | 0.0 [0.0, 0.0] | |
| 13.2 Adverse events after 5 months ‐ ocular problems 30% indirect versus direct lighting | 1 | Mean Difference (IV, Fixed, 95% CI) | 0.0 [0.0, 0.0] | |
| 14 Adverse events ‐ reading problems indirect versus 70% indirect lighting Show forest plot | 1 | Mean Difference (IV, Fixed, 95% CI) | Totals not selected | |
| 14.1 Adverse events after 2 months ‐ reading problems indirect versus 70% indirect lightning | 1 | Mean Difference (IV, Fixed, 95% CI) | 0.0 [0.0, 0.0] | |
| 14.2 Adverse events after 5 months ‐ reading problems indirect versus 70% indirect lightning | 1 | Mean Difference (IV, Fixed, 95% CI) | 0.0 [0.0, 0.0] | |
| 15 Adverse events ‐ reading problems indirect versus direct lighting Show forest plot | 1 | Mean Difference (IV, Fixed, 95% CI) | Totals not selected | |
| 15.1 Adverse events after 2 months ‐ reading problems indirect versus direct lighting | 1 | Mean Difference (IV, Fixed, 95% CI) | 0.0 [0.0, 0.0] | |
| 15.2 Adverse events after 5 months ‐ reading problems indirect versus direct lighting | 1 | Mean Difference (IV, Fixed, 95% CI) | 0.0 [0.0, 0.0] | |
| 16 Adverse events ‐ reading problems 70% indirect versus 30% indirect lighting Show forest plot | 1 | Mean Difference (IV, Fixed, 95% CI) | Totals not selected | |
| 16.1 Adverse events after 2 months ‐ reading problems 70% indirect versus 30% indirect lighting | 1 | Mean Difference (IV, Fixed, 95% CI) | 0.0 [0.0, 0.0] | |
| 16.2 Adverse events after 5 months ‐ reading problems 70% indirect versus 30% indirect lighting | 1 | Mean Difference (IV, Fixed, 95% CI) | 0.0 [0.0, 0.0] | |
| 17 Adverse events ‐ reading problems 70% indirect versus direct lighting Show forest plot | 1 | Mean Difference (IV, Fixed, 95% CI) | Totals not selected | |
| 17.1 Adverse events after 2 months ‐ reading problems 70% indirect versus direct lighting | 1 | Mean Difference (IV, Fixed, 95% CI) | 0.0 [0.0, 0.0] | |
| 17.2 Adverse events after 5 months ‐ reading problems 70% indirect versus direct lighting | 1 | Mean Difference (IV, Fixed, 95% CI) | 0.0 [0.0, 0.0] | |
| 18 Adverse events ‐ reading problems 30% indirect versus direct lighting Show forest plot | 1 | Mean Difference (IV, Fixed, 95% CI) | Totals not selected | |
| 18.1 Adverse events after 2 months ‐ reading problems 30% indirect versus direct lighting | 1 | Mean Difference (IV, Fixed, 95% CI) | 0.0 [0.0, 0.0] | |
| 18.2 Adverse events after 5 months ‐ reading problems 30% indirect versus direct lighting | 1 | Mean Difference (IV, Fixed, 95% CI) | 0.0 [0.0, 0.0] | |
| 19 Adverse events ‐ concentration problems indirect versus 70% indirect lighting Show forest plot | 1 | Mean Difference (IV, Fixed, 95% CI) | Totals not selected | |
| 19.1 Adverse events after 2 months ‐ concentration problems indirect versus 70% indirect lighting | 1 | Mean Difference (IV, Fixed, 95% CI) | 0.0 [0.0, 0.0] | |
| 19.2 Adverse events after 5 months ‐ concentration problems indirect versus 70% indirect lighting | 1 | Mean Difference (IV, Fixed, 95% CI) | 0.0 [0.0, 0.0] | |
| 20 Adverse events ‐ concentration problems indirect versus 30% indirect lighting Show forest plot | 1 | Mean Difference (IV, Fixed, 95% CI) | Totals not selected | |
| 20.1 Adverse events after 2 months ‐ concentration problems indirect versus 30% indirect lighting | 1 | Mean Difference (IV, Fixed, 95% CI) | 0.0 [0.0, 0.0] | |
| 20.2 Adverse events after 5 months ‐ concentration problems indirect versus 30% indirect lighting | 1 | Mean Difference (IV, Fixed, 95% CI) | 0.0 [0.0, 0.0] | |
| 21 Adverse events ‐ concentration problems indirect versus direct lighting Show forest plot | 1 | Mean Difference (IV, Fixed, 95% CI) | Totals not selected | |
| 21.1 Adverse events after 2 months ‐ concentration problems indirect versus direct lighting | 1 | Mean Difference (IV, Fixed, 95% CI) | 0.0 [0.0, 0.0] | |
| 21.2 Adverse events after 5 months ‐ concentration problems indirect versus direct lighting | 1 | Mean Difference (IV, Fixed, 95% CI) | 0.0 [0.0, 0.0] | |
| 22 Adverse events ‐ concentration problems 70% indirect versus 30% indirect lighting Show forest plot | 1 | Mean Difference (IV, Fixed, 95% CI) | Totals not selected | |
| 22.1 Adverse events after 2 months ‐ concentration problems 70% indirect versus 30% indirect lighting | 1 | Mean Difference (IV, Fixed, 95% CI) | 0.0 [0.0, 0.0] | |
| 22.2 Adverse events after 5 months ‐ concentration problems 70% indirect versus 30% indirect lighting | 1 | Mean Difference (IV, Fixed, 95% CI) | 0.0 [0.0, 0.0] | |
| 23 Adverse events ‐ concentration problems 70% indirect versus direct lighting Show forest plot | 1 | Mean Difference (IV, Fixed, 95% CI) | Totals not selected | |
| 23.1 Adverse events after 2 months ‐ concentration problems 70% indirect versus direct lighting | 1 | Mean Difference (IV, Fixed, 95% CI) | 0.0 [0.0, 0.0] | |
| 23.2 Adverse events after 5 months ‐ concentration problems 70% indirect versus direct lighting | 1 | Mean Difference (IV, Fixed, 95% CI) | 0.0 [0.0, 0.0] | |
| 24 Adverse events ‐ concentration problems 30% indirect versus direct lighting Show forest plot | 1 | Mean Difference (IV, Fixed, 95% CI) | Totals not selected | |
| 24.1 Adverse events after 2 months ‐ concentration problems 30% indirect versus direct lighting | 1 | Mean Difference (IV, Fixed, 95% CI) | 0.0 [0.0, 0.0] | |
| 24.2 Adverse events after 5 months ‐ concentration problems 30% indirect versus direct lighting | 1 | Mean Difference (IV, Fixed, 95% CI) | 0.0 [0.0, 0.0] | |
| 25 Adverse events ‐ musculoskeletal symptoms indirect versus 70% indirect lighting Show forest plot | 1 | Mean Difference (IV, Fixed, 95% CI) | Totals not selected | |
| 25.1 Adverse events after 2 months ‐ musculoskeletal symptoms indirect versus 70% indirect lighting | 1 | Mean Difference (IV, Fixed, 95% CI) | 0.0 [0.0, 0.0] | |
| 25.2 Adverse events after 5 months ‐ musculoskeletal symptoms indirect versus 70% indirect lighting | 1 | Mean Difference (IV, Fixed, 95% CI) | 0.0 [0.0, 0.0] | |
| 26 Adverse events ‐ musculoskeletal symptoms indirect versus 30% indirect lighting Show forest plot | 1 | Mean Difference (IV, Fixed, 95% CI) | Totals not selected | |
| 26.1 Adverse events after 2 months ‐ musculoskeletal symptoms indirect versus 30% indirect lighting | 1 | Mean Difference (IV, Fixed, 95% CI) | 0.0 [0.0, 0.0] | |
| 26.2 Adverse events after 5 months ‐ musculoskeletal symptoms indirect versus 30% indirect lighting | 1 | Mean Difference (IV, Fixed, 95% CI) | 0.0 [0.0, 0.0] | |
| 27 Adverse events ‐ musculoskeletal symptoms indirect versus direct lighting Show forest plot | 1 | Mean Difference (IV, Fixed, 95% CI) | Totals not selected | |
| 27.1 Adverse events after 2 months ‐ musculoskeletal symptoms indirect versus direct lighting | 1 | Mean Difference (IV, Fixed, 95% CI) | 0.0 [0.0, 0.0] | |
| 27.2 Adverse events after 5 months ‐ musculoskeletal symptoms indirect versus direct lighting | 1 | Mean Difference (IV, Fixed, 95% CI) | 0.0 [0.0, 0.0] | |
| 28 Adverse events ‐ musculoskeletal symptoms 70% indirect versus 30% indirect lighting Show forest plot | 1 | Mean Difference (IV, Fixed, 95% CI) | Totals not selected | |
| 28.1 Adverse events after 2 months ‐ musculoskeletal symptoms 70% indirect versus 30% indirect lighting | 1 | Mean Difference (IV, Fixed, 95% CI) | 0.0 [0.0, 0.0] | |
| 28.2 Adverse events after 5 months ‐ musculoskeletal symptoms 70% indirect versus 30% indirect lighting | 1 | Mean Difference (IV, Fixed, 95% CI) | 0.0 [0.0, 0.0] | |
| 29 Adverse events ‐ musculoskeletal symptoms 70% indirect versus direct lighting Show forest plot | 1 | Mean Difference (IV, Fixed, 95% CI) | Totals not selected | |
| 29.1 Adverse events after 2 months ‐ musculoskeletal symptoms 70% indirect versus direct lighting | 1 | Mean Difference (IV, Fixed, 95% CI) | 0.0 [0.0, 0.0] | |
| 29.2 Adverse events after 5 months ‐ musculoskeletal symptoms 70% indirect versus direct lighting | 1 | Mean Difference (IV, Fixed, 95% CI) | 0.0 [0.0, 0.0] | |
| 30 Adverse events ‐ musculoskeletal symptoms 30% indirect versus direct lighting Show forest plot | 1 | Mean Difference (IV, Fixed, 95% CI) | Totals not selected | |
| 30.1 Adverse events after 2 months ‐ musculoskeletal symptoms 30% indirect versus direct lighting | 1 | Mean Difference (IV, Fixed, 95% CI) | 0.0 [0.0, 0.0] | |
| 30.2 Adverse events after 5 months ‐ musculoskeletal symptoms 30% indirect versus direct lighting | 1 | Mean Difference (IV, Fixed, 95% CI) | 0.0 [0.0, 0.0] | |
| Outcome or subgroup title | No. of studies | No. of participants | Statistical method | Effect size |
| 1 Alertness ‐ Epworth Sleepiness Scale Show forest plot | 1 | Mean Difference (Fixed, 95% CI) | Totals not selected | |
| 2 Mood Beck Depression Inventory‐II Show forest plot | 1 | Mean Difference (Fixed, 95% CI) | Totals not selected | |
| Outcome or subgroup title | No. of studies | No. of participants | Statistical method | Effect size |
| 1 Alertness (visual analogue scale (VAS)) after 2 weeks of intervention Show forest plot | 1 | Mean Difference (IV, Fixed, 95% CI) | Totals not selected | |
| 2 Mood (≥ 50% of reduction of Structured Interview Guide for the Hamilton Depression Rating Scale‐Seasonal Affective Disorders Version (SIGH‐SAD) scores from baseline after 2 weeks of treatment)) Show forest plot | 1 | Risk Ratio (M‐H, Fixed, 95% CI) | Totals not selected | |
| 3 Mood SIGH‐SAD after 2 weeks of intervention Show forest plot | 1 | Mean Difference (IV, Fixed, 95% CI) | Totals not selected | |
| 4 Mood 21‐item Hamilton Depressive Rating Scale after 2 weeks of interventions Show forest plot | 1 | Mean Difference (IV, Fixed, 95% CI) | Totals not selected | |
| 5 Mood 17‐item Hamilton Depressive Rating Scale after 2 weeks of intervention Show forest plot | 1 | Mean Difference (IV, Fixed, 95% CI) | Totals not selected | |
| 6 Mood Seasonal Affective Disorders subscale after 2 weeks of intervention Show forest plot | 1 | Mean Difference (IV, Fixed, 95% CI) | Totals not selected | |
| 7 Mood VAS after 2 weeks of intervention Show forest plot | 1 | Mean Difference (IV, Fixed, 95% CI) | Totals not selected | |
| 8 Frequency of adverse events after 2 weeks of intervention Show forest plot | 1 | Risk Ratio (M‐H, Fixed, 95% CI) | Totals not selected | |