Tratamiento con fármacos modificadores de la enfermedad para los pacientes con un primer episodio clínico indicativo de esclerosis múltiple
References
References to studies included in this review
References to studies excluded from this review
References to ongoing studies
Additional references
Characteristics of studies
Characteristics of included studies [ordered by study ID]
Jump to:
| Methods | RCT, parallel‐group. Recruitment period: March 1998‐March 2003. Countries: 1 (Israel). Centres: 1 | |
| Participants | N = 91. Women 74%. Age, mean (range): 34 years (15‐50 years) Participants with a first neurological episode suggesting MS in the previous 3 months. They had positive brain MRI according to Fazekas criteria | |
| Interventions | Immunoglobulins 0.4 g/kg body weight intravenously daily for 5 consecutive days followed by additional booster doses of immunoglobulins 0.4 g/kg body weight intravenously daily once every 6 weeks for a period of 12 months (N = 45) | |
| Outcomes | Conversion to CDMS, i.e. number of participants who experienced a second attack within 12 months | |
| Notes | The study was supported by a research grant from Omrix Biopharmaceuticals, Tel‐Aviv, Israel, which also supplied the study drugs. The authors have no financial relationship to Omrix Biopharmaceuticals. All authors had full access to all the data and had the right to publish all the data. The data were analysed by an independent statistician (p 1519‐20) | |
| Risk of bias | ||
| Bias | Authors' judgement | Support for judgement |
| Random sequence generation (selection bias) | Low risk | A block‐stratified randomisation procedure (p 1516) |
| Allocation concealment (selection bias) | Unclear risk | "According to block‐stratified randomisation, participants were randomly assigned to each of the two treatment groups" (p 1516) |
| Other major baseline imbalance | Unclear risk | The study appears to be free of sources of bias related to major baseline imbalance (Table 1; p 1517) |
| Blinding of participants and personnel (performance bias) | Low risk | "At the pharmacy, containers and tubing of IVIg or saline were wrapped in sealed opaque bags. The active treatment and placebo were administered intravenously in identical settings and regime" (p 1516) |
| Blinding of outcome assessment (detection bias) | Low risk | "Each patient was evaluated by an examining neurologist who was unaware of the patient’s treatment assignment. Changes on neurological examination to determine whether a new relapse had occurred were based on the neurological examination performed by two evaluating neurologists both unaware of treatment assignment" (p 1516) |
| Incomplete outcome data (attrition bias) | Low risk | One participant in the treated group and zero participants in the placebo group were lost to follow‐up (Fig. 1, p 1516) |
| Selective reporting (reporting bias) | High risk | Disability‐worsening that was included as a secondary outcome was not reported in the results |
| Methods | Cohort study. Austrian MS participating centres: 29. Participant recruitment started in September 2003 and terminated in December 2005. Final participant follow‐up visits in December 2007 | |
| Participants | N = 296. Women 72%. Age, mean (sd): 32.5 (9.5) years. Participants with newly diagnosed CIS. The diagnosis of a CIS was based on the presence of signs and symptoms compatible with MS without evidence for any other CNS disorder which might have caused them (Miller 2008). Monofocal presentation 80% (optic neuritis 29%; spinal cord syndrome 27%; brain stem 25%; other 19%). Multifocal presentation: 16%. EDSS , median (range): 2.0 (0‐6). Brain MRI, abnormal: 94% of participants. Oligoclonal antibodies in cerebrospinal fluid, positive: 82% of participants | |
| Interventions | Treatments for 163 participants who completed 2 years of observation were: N = 49 treated with DMTs within 3 months of CIS onset (early treatment). INF‐ß 1a intramuscular: 76%; INFß‐1a subcutaneous and INF‐ß 1b subcutaneous: 12% each; glatiramer acetate: 16%; others: 4% N = 59 treated with DMTs between 3‐24 months of follow‐up (delayed treatment). IFNs: 76%; glatiramer acetate 20%; others: 4% N = 55 never treated up to 24 months of follow‐up | |
| Outcomes | Proportion of participants who converted to CDMS. Number of relapses over 2 years. EDSS (median and range). Quality of life assessed globally with a VAS, which ranged from 0 (worst) to 100 (best). It was recorded at baseline and through the follow‐up by the participant and the treating physician independently | |
| Notes | No analysis was done to reduce confounding. The study organisation and monitoring were supported by Biogen Idec Austria | |
| Methods | RCT, parallel‐group. Recruitment period: February 2002‐June 2003. Countries: 18 European countries, Israel and Canada. Centres: 98 | |
| Participants | N = 487. Women 71%; Age, mean (range): 31 years (18‐45 years). Participants with a a first neurological event suggestive of MS within 2 months after onset of the first event. Presentation: monofocal 52% (optic neuritis 17%; spinal cord syndrome 16%; brain stem or cerebellar syndrome 12%; other cerebral 7%), or multifocal 48%. They had at least two clinically silent lesions on their T2‐weighted brain MRI scan with a size of at least 3 mm, at least one of which being ovoid, periventricular, or infratentorial | |
| Interventions | Interferon beta‐1b (Betaseron) 250 µg subcutaneous every other day for 24 months (N= 305) Placebo subcutaneous every other day for 24 months (N = 182) Corticosteroid treatment of first relapse: 71% Participants who converted to CDMS during the double‐blind period were offered interferon beta‐1b 250 µg subcutaneously every other day for up to 5 years from randomisation. (BENEFIT 2007 (3 years FU)) (p 390) | |
| Outcomes | Primary: time to conversion to CDMS represented by Kaplan‐Meier estimates of the cumulative percentage of participants with CDMS, defined by: 1) a relapse with clinical evidence of at least one CNS lesion, and if the first presentation was monofocal distinct from the lesion responsible for the CIS presentation, or 2) sustained progression by 1.5 points on the EDSS reaching a total EDSS score of 2.5 and confirmed at a consecutive visit 3 months later (slightly modified Poser criteria). The validity of CDMS diagnoses was confirmed by a central committee | |
| Notes | Funded by Schering AG. Four co‐authors of Schering AG. Restriction description: any manuscript/abstract related to the study had to be submitted for review to the sponsor at least 90 days prior to publication (clinicalTrials.gov) | |
| Risk of bias | ||
| Bias | Authors' judgement | Support for judgement |
| Random sequence generation (selection bias) | Low risk | "A minimization procedure with an element of chance was applied to minimize imbalance of treatment groups for (selected) factors with potential impact on the risk of developing definite MS: steroid use during the first clinical event; onset of the first event as monofocal vs multifocal by central assessment; number of T2 lesions on the screening MRI" (p 1243) |
| Allocation concealment (selection bias) | Low risk | Central randomisation in a 5:3 ratio (p 1243) |
| Other major baseline imbalance | Low risk | The study appears to be free of sources of bias related to major baseline imbalance (table 1; p 1244) |
| Blinding of participants and personnel (performance bias) | High risk | "After CDMS confirmation, all evaluations foreseen per protocol for the month 24/end‐of‐study visit were performed. At this end‐of‐study visit—without breaking the randomisation code—participants were given the option of participating in the follow‐up study with open‐label interferon beta‐1b treatment" (p 1243). High risk of un‐blinding after shifting to open‐label active treatment during the randomised study |
| Blinding of outcome assessment (detection bias) | Unclear risk | "Participants were instructed to cover injection sites during the examination by the masked evaluation neurologist". The diagnosis of CDMS had to be confirmed by a central committee whose masking was not reported (p 1243) |
| Incomplete outcome data (attrition bias) | Low risk | Proportions and reasons of incomplete outcome data did not differ substantially across intervention groups. 437 (89.7%) of the 487 randomised participants completed the study (271 (88.8%) of 305 allocated to IFNB‐1b and 166 (91.2%) of 182 allocated to placebo). 34 (11.2%) IFNB‐1b participants did not complete the study: 13 did not receive IFNB‐1b and were not followed; 8 adverse event; 3 lost to follow‐up; 9 withdrawal by subject; 1 adverse event, then subject's withdrawal. 16 (8.8%) placebo did not complete the study: 6 did not receive placebo and were not followed; 2 lost to follow‐up; 7 withdrawal by subject; 1 fulfilled local definition and McDonald criteria |
| Selective reporting (reporting bias) | Low risk | The study protocol was not available but it is clear that the published reports included all expected outcomes, including those that were pre‐specified |
| Methods | OLE study of the BENEFIT 2006 (placebo‐controlled phase of 24 months). Centres: 97 of the original 98 BENEFIT study sites | |
| Participants | N = 418. Women 71%. Age, median: 30 years | |
| Interventions | N = 261/305 originally randomised to Interferon beta‐1b 250 µg subcutaneous every other day (early‐treatment group). Active treatment exposure: 36 months N = 157/182 originally randomised to placebo (delayed‐treatment group). Active treatment exposure: 12 months | |
| Outcomes | Time to CDMS and time to confirmed disability progression measured by EDSS scale at 36 months. Annualised relapse rate | |
| Notes | Multivariate Cox regressions for time to CDMS and time to McDonald MS (steroid use during the first clinical event, onset of disease (monofocal vs multifocal), age at screening, sex, and number of T2 lesions and gadolinium‐enhanced lesions at screening; time to confirmed EDSS progression was adjusted (as preplanned) for T2‐lesion volume at screening) | |
| Risk of bias | ||
| Bias | Authors' judgement | Support for judgement |
| Random sequence generation (selection bias) | High risk | No random assignment to the OLE groups |
| Allocation concealment (selection bias) | High risk | No allocation concealment to the OLE groups |
| Other major baseline imbalance | Low risk | Clinical characteristics were similar between the two groups. |
| Blinding of participants and personnel (performance bias) | High risk | Unblinding |
| Blinding of outcome assessment (detection bias) | High risk | Unblinding |
| Incomplete outcome data (attrition bias) | Low risk | 18% and 21% of early and delayed treatment groups, respectively, dropped out. Proportions and reasons of missing participants did not differ substantially across intervention groups. |
| Selective reporting (reporting bias) | High risk | Serious adverse events not reported |
| Methods | OLE study of the BENEFIT 2006 (placebo‐controlled phase of 24 months). Centres: 97 of the original 98 BENEFIT study sites | |
| Participants | N = 418. Women 71%. Age, median: 30 years | |
| Interventions | N = 261/305 originally randomised to Interferon beta‐1b 250 µg subcutaneous every other day (early‐treatment group). Active treatment exposure: 60 months N = 157/182 originally randomised to placebo (delayed‐treatment group). Active treatment exposure: 36 months | |
| Outcomes | Time to CDMS and time to confirmed disability progression measured by EDSS scale at 60 months. Annualised relapse rate and proportions with relapses | |
| Notes | Adjusted Cox proportional hazards regression for time to conversion (steroid use during the first clinical event, onset of disease (monofocal vs multifocal), age, sex, and number of T2 lesions and gadolinium‐enhancing lesions at screening) | |
| Risk of bias | ||
| Bias | Authors' judgement | Support for judgement |
| Random sequence generation (selection bias) | High risk | No random assignment to the OLE groups |
| Allocation concealment (selection bias) | High risk | No allocation concealment to the OLE groups |
| Other major baseline imbalance | Unclear risk | Insufficient information |
| Blinding of participants and personnel (performance bias) | High risk | Unblinding |
| Blinding of outcome assessment (detection bias) | High risk | Unblinding |
| Incomplete outcome data (attrition bias) | High risk | 23% and 32% of early and delayed treatment groups, respectively, dropped out. Proportions and reasons for missing participants differed substantially across intervention groups |
| Selective reporting (reporting bias) | High risk | Treatment discontinuation for adverse events not reported |
| Methods | OLE study of the BENEFIT 2006 (placebo‐controlled phase of 24 months). Centres: 72 of the original 98 BENEFIT study sites | |
| Participants | N = 284 recruited from 72 of the 97 initial centres in the BENEFIT RCT. Women 71%. Age, median: 30 years | |
| Interventions | N = 178/305 originally randomised to Interferon beta‐1b 250 µg subcutaneous every other day (early‐treatment group). Active treatment exposure: 60 months N = 106/182 originally randomised to placebo (delayed‐treatment group). Active treatment exposure: 36 months | |
| Outcomes | Time to CDMS and time to confirmed disability progression measured by EDSS scale at 8.7 years. Annualised relapse rate | |
| Notes | Proportional hazards regression (covariates: randomised treatment, steroid use during the first clinical event, type of disease onset and categorised number of T2 lesions on BENEFITscreening MRI) | |
| Risk of bias | ||
| Bias | Authors' judgement | Support for judgement |
| Random sequence generation (selection bias) | High risk | No random assignment to the OLE groups |
| Allocation concealment (selection bias) | High risk | No allocation concealment to the OLE groups |
| Other major baseline imbalance | Unclear risk | Insufficient information |
| Blinding of participants and personnel (performance bias) | High risk | Unblinding |
| Blinding of outcome assessment (detection bias) | High risk | Unblinding |
| Incomplete outcome data (attrition bias) | High risk | 48.5% and 44.5% of early and delayed treatment groups, respectively, dropped out. Proportions and reasons for missing participants differed substantially across intervention groups |
| Selective reporting (reporting bias) | High risk | Treatment discontinuation for adverse events not reported |
| Methods | Following the OLE study, a prospective, comprehensive, 11‐year, cross‐sectional reassessment of the BENEFIT 2006 (placebo‐controlled phase of 24 months). Centres: 66 of the original 98 BENEFIT study sites | |
| Participants | N = 278 recruited from 66 of the 97 initial centres in the BENEFIT RCT. Women 70%. Age, median: 30 years | |
| Interventions | N = 167/305 originally randomised to Interferon beta‐1b 250 µg subcutaneous every other day (early‐treatment group). Active treatment exposure: 60 months N = 111/182 originally randomised to placebo (delayed‐treatment group). Active treatment exposure: 36 months | |
| Outcomes | Time to CDMS and time to confirmed disability progression measured by EDSS scale at 11 years. Annualised relapse rate | |
| Notes | Proportional hazards regression for time‐to‐event outcomes and generalised linear regression models. Steroid use during first event (yes or no), multifocal or monofocal onset of disease, and number of T2 lesions at screening (2–4, 5–8, or ≥9) included as the standard set of covariates. An extended set of covariates that included number of gadolinium‐enhancing (Gd1) lesions at screening, age, and sex in addition to the standard covariates was used for analysis of time to CDMS, time to first relapse, and ARR | |
| Risk of bias | ||
| Bias | Authors' judgement | Support for judgement |
| Random sequence generation (selection bias) | High risk | No random assignment to the OLE groups |
| Allocation concealment (selection bias) | High risk | No allocation concealment to the OLE groups |
| Other major baseline imbalance | Unclear risk | Insufficient information |
| Blinding of participants and personnel (performance bias) | High risk | Unblinding |
| Blinding of outcome assessment (detection bias) | High risk | Unblinding |
| Incomplete outcome data (attrition bias) | High risk | 45% and 39% of early and delayed treatment groups, respectively, dropped out. Proportions and reasons for missing participants differed substantially across intervention groups |
| Selective reporting (reporting bias) | High risk | Treatment discontinuation for adverse events not reported |
| Methods | RCT, parallel‐group. Recruitment period: April 1996‐March 2000. Countries: 2 (USA and Canada). Centres: 50 | |
| Participants | N = 383. Women 75%. Age, mean (range): 33 years (18‐50 years). Participants with a first isolated, well‐defined neurologic event no more than 27 days before randomisation. Monofocal presentation: 70% (optic neuritis 50%; spinal cord syndrome 22%; brain stem or cerebellar syndrome 28%). They had 2 or more clinically silent lesions of the brain that were at least 3 mm in diameter on MRI scans (at least 1 lesion had to be periventricular or ovoid) | |
| Interventions | Interferon beta‐1a (Avonex) 30 µg intramuscular once a week for 18 months (N = 193) Placebo intramuscular once a week for 18 months (N = 190) All participants (100%) received corticosteroid treatment (18 days) Acetaminophen (paracetamol) 650 mg before and after each injection during the first 6 months of treatment | |
| Outcomes | Primary: conversion to CDMS as defined by: 1) a new clinical abnormality consistent with the participant's report of neurological or visual symptom distinct from that of the initial episode at study entry or: 2) worsening by 1.5 points on the EDSS confirmed at a consecutive visit 3 months later (slightly modified Poser criteria) | |
| Notes | Funded by Biogen. Stopped after 18‐month interim analysis | |
| Risk of bias | ||
| Bias | Authors' judgement | Support for judgement |
| Random sequence generation (selection bias) | Low risk | "To assign participants randomly in approximately equal numbers to the two treatment groups, we used a minimization procedure to minimize imbalance of treatment groups for (selected) factors the number of lesions on T2‐weighted MRI scans and the type of initial clinical event" (p 899) |
| Allocation concealment (selection bias) | Unclear risk | No information |
| Other major baseline imbalance | Low risk | The study appears to be free of sources of bias related to major baseline imbalance |
| Blinding of participants and personnel (performance bias) | Unclear risk | Unclear risk of unblinding because it is unclear if participants could have shifted to active treatment during the randomised study |
| Blinding of outcome assessment (detection bias) | Low risk | "Each patient was examined by a treating and an examining neurologist, both of whom were unaware of the patient’s treatment assignment (p 899). Clinical outcomes were confirmed by a central end‐point committee whose members were unaware of the participants’ treatment assignments" (p 899) |
| Incomplete outcome data (attrition bias) | High risk | Truncated. The study period was planned to be 3 years. It was stopped early after 18‐month interim analysis of efficacy. 177 participants (46% of the randomised) (80 treated and 97 placebo) had completed the study. At 3 years, 30 withdrawals + 83 interrupted = 113 (58.5%) in interferon group; 27 withdrawals + 66 interrupted = 93 (48.9%) in placebo group. (Fig. 1; p 902) |
| Selective reporting (reporting bias) | Low risk | The study protocol was not available but the published reports included all expected outcomes, including those that were pre‐specified |
| Methods | OLE study of the CHAMPS 2000 (placebo‐controlled phase of 36 months) Centres: 32 of the original 50 CHAMPS study sites | |
| Participants | N = 203 recruited from 32 of the 50 initial centres in the CHAMPS trial. Women 77% (early treatment), 74% delayed treatment. Age, mean: 35 years | |
| Interventions | N = 100/193 originally randomised to interferon beta‐1a (Avonex) 30 µg intramuscular once a week (early‐treatment group). Active treatment exposure: 60 months N = 103/190 originally randomised to placebo (delayed‐treatment group). Active treatment exposure: 24 months | |
| Outcomes | Time to CDMS and time to confirmed disability progression measured by EDSS scale at 60 months. Annualised relapse rate | |
| Notes | Multivariate model was used to adjust for recipient age, clinical centre, baseline brain MRI T2 lesion volume (log transformation), and the number of Gd lesions at baseline. Effect modification related to these factors was assessed with interaction terms in the model. Possible violations of the proportional hazards assumption were checked using time‐dependent variables | |
| Risk of bias | ||
| Bias | Authors' judgement | Support for judgement |
| Random sequence generation (selection bias) | High risk | No random assignment to the OLE groups |
| Allocation concealment (selection bias) | High risk | No allocation concealment to the OLE groups |
| Other major baseline imbalance | Low risk | Demographic and clinical characteristics were similar between the 2 groups |
| Blinding of participants and personnel (performance bias) | High risk | Unblinding |
| Blinding of outcome assessment (detection bias) | High risk | Unblinding |
| Incomplete outcome data (attrition bias) | High risk | 50% and 51% of early and delayed treatment groups, respectively, dropped out. Proportions and reasons for missing participants differed substantially across intervention groups |
| Selective reporting (reporting bias) | High risk | Treatment discontinuation for adverse events and serious adverse events not reported |
| Methods | OLE study of the CHAMPS 2000 (placebo‐controlled phase of 36 months). Centres: 24 of the original 50 CHAMPS study sites | |
| Participants | N = 155 recruited from 24 of the 50 initial centres in the CHAMPS trial. Women 74% (early treatment), 72% delayed treatment. Age, mean: 35 years | |
| Interventions | N = 81/193 originally randomised to interferon beta‐1a (Avonex) 30 µg intramuscular once a week (early‐treatment group). Active treatment exposure: 120 months N = 74/190 originally randomised to placebo (delayed‐treatment group). Active treatment exposure: 84 months | |
| Outcomes | Time to CDMS and time to confirmed disability progression measured by EDSS scale at 60 months. Annualised relapse rate | |
| Notes | Multivariate model was used to adjust for recipient age, clinical centre, baseline brain MRI T2 lesion volume (log transformation), and the number of Gd lesions at baseline. Effect modification related to these factors was assessed with interaction terms in the model. Possible violations of the proportional hazards assumption were checked using time‐dependent variables | |
| Risk of bias | ||
| Bias | Authors' judgement | Support for judgement |
| Random sequence generation (selection bias) | High risk | No random assignment to the OLE groups |
| Allocation concealment (selection bias) | High risk | No allocation concealment to the OLE groups |
| Other major baseline imbalance | Unclear risk | Insufficient information about clinical characteristics of participants |
| Blinding of participants and personnel (performance bias) | High risk | Unblinding |
| Blinding of outcome assessment (detection bias) | High risk | Unblinding |
| Incomplete outcome data (attrition bias) | High risk | 65% and 69% of early and delayed treatment groups, respectively, dropped out. Proportions and reasons for missing participants differed substantially across intervention groups |
| Selective reporting (reporting bias) | High risk | Treatment discontinuation for adverse events not reported |
| Methods | RCT, parallel‐group. Recruitment period: August 1995‐July 1997. 14 countries in Europe. Centres: 57 | |
| Participants | N = 309. Women 64%. Age, mean (range): 28 years (18‐40 years) Participants with a first neurological episode suggesting multiple sclerosis in the previous 3 months. Monofocal (61%) or multifocal presentation. They had positive brain MRI for at least 4 white‐matter lesions on the T2‐weighted scans, or presence of at least 3 white‐matter lesions, if at least one was infratentorial or enhancing after gadolinium | |
| Interventions | Interferon beta‐1a (Rebif ) 22 µg subcutaneous once a week for 24 months (N = 154) Steroid use at first clinical demyelinating event: 70% After the conversion to CDMS, the investigator discussed with the participant the possibility of starting open‐label treatment with interferon beta‐1a once weekly until the completion of the trial (p 1577) | |
| Outcomes | Primary: conversion to CDMS defined according to Poser diagnostic criteria | |
| Notes | Funded by Serono. COI of authors not reported | |
| Risk of bias | ||
| Bias | Authors' judgement | Support for judgement |
| Random sequence generation (selection bias) | Low risk | "The treatment was assigned according to a computer‐generated randomisation list stratified by centre" (p 1577) |
| Allocation concealment (selection bias) | Unclear risk | No information |
| Other major baseline imbalance | Low risk | The study appears to be free of sources of bias related to major baseline imbalance |
| Blinding of participants and personnel (performance bias) | High risk | "After the occurrence of the second exacerbation, as stipulated in the protocol, the investigator discussed with the patient the possibility of starting open‐label treatment with interferon beta‐1a once weekly until the completion of the trial". (p 1577) High risk of unblinding after shifting to open‐label active treatment during the randomised study |
| Blinding of outcome assessment (detection bias) | Unclear risk | "At each study site, a treating physician was responsible for the overall management of the patient, including safety monitoring. An evaluating physician was responsible for all scheduled neurological examinations and exacerbation follow‐up. Two members of the steering committee reviewed the documentation of all exacerbations and, by consensus, classified them as confirmed or unconfirmed" (p 1577) |
| Incomplete outcome data (attrition bias) | Low risk | Proportions and reasons of incomplete outcome data did not differ substantially across intervention groups. 141 (91.6%) of 154 participants in Interferon beta‐1a and 137 (88.4%) of 155 participants in the placebo group completed the study |
| Selective reporting (reporting bias) | Low risk | The study protocol is available and all of the study’s pre‐specified (primary and secondary) outcomes have been reported |
| Methods | Prospective cohort study. Regione Emilia Romagna, Italy. MS participating centres: 22. Recruitment of participants from December 2004‐June 2007. Censoring date: 31 March 2010 | |
| Participants | N = 168. Women 69%. Age, mean (sd): 33.0 (8.0) years. Participants with first symptom suggestive of an inflammatory demyelinating disorder of the central nervous system in the preceding 6 months. Monofocal presentation 73% (optic neuritis 29%; brain stem/cerebellar 21%; cerebral or spinal 23%). Multifocal presentation: 27%. EDSS, median (range): 1.0 (0‐6.5). Participants with MRI positive for ≥ 3 Barkhof criteria: 60% of participants. Oligoclonal antibodies in cerebrospinal fluid, positive: 68% of participants | |
| Interventions | N = 31 (18%) and N = 51 (30%) of participants were treated with disease‐modifying drugs before or after conversion to CDMS. N = 86 not treated. N = 67 interferon; N = 9 glatiramer acetate; N =3 intravenous immunoglobulin; N =2 azathioprine; N = 1 mitoxantrone N = 18 participants underwent at least one other treatment: natalizumab (10); glatiramer acetate (5); mitoxantrone (3); azathioprine (2); plasma exchange (1) | |
| Outcomes | CDMS according to Poser criteria. Follow‐up 2 and 4 years | |
| Notes | Multivariate analysis was done using the Cox proportional‐hazard regression model. Functional systems at onset were categorised as afferent (visual or sensitive or both), efferent (any of the others) or combined (afferent and efferent); Barkhof criteria were dichotomised as C3 of 4 (positive) versus B2 of 4 (negative). All the variables statistically significant in the univariate analysis for conversion to MS according to either McDonald criteria or CDMS criteria were simultaneously entered in the multivariate model, except the number of T2 lesions and GD positive lesions that are already included in Barkhof criteria. This study was supported with an unconditional grant by Biogen Idec. | |
| Methods | RCT. Recruitment period: October 2002‐March 2005. Country: Iran. One centre | |
| Participants | N = 25. Women 68%. Age, mean (range): 25 years (17‐39 years) Participants with a first, isolated optic neuritis (32%), spinal cord (28%), brain stem (24%) or cerebellar (16%) syndrome, and which was confirmed on ophthalmologic or neurologic examination Mean EDSS: 1.74 (SD = 0.76) MRI scan judged to be positive according to McDonald criteria (revision of 2005) | |
| Interventions | N = 11: interferon beta‐1a (Rebif) 22 µg subcutaneous 3 times a week for 21 months N = 14: no disease‐modifying treatment | |
| Outcomes | Worsening of disability measured by Kurtzke Expanded Disability Status Scale (EDSS) and numbers of new relapses during 21 months of follow‐up | |
| Notes | Sponsor not reported. Potential conflicts of interest of authors not reported | |
| Risk of bias | ||
| Bias | Authors' judgement | Support for judgement |
| Random sequence generation (selection bias) | Unclear risk | No information |
| Allocation concealment (selection bias) | Unclear risk | No information |
| Other major baseline imbalance | Unclear risk | Baseline MRI findings imbalance. (Table 1; p 346) |
| Blinding of participants and personnel (performance bias) | High risk | Absence of blinding. (p 348) |
| Blinding of outcome assessment (detection bias) | High risk | Absence of blinding. (p 348) |
| Incomplete outcome data (attrition bias) | Unclear risk | No information |
| Selective reporting (reporting bias) | Unclear risk | No information |
| Methods | Prospective cohort study (the MSBase Incident Study ‐ MSBasis) from an international MSBase Registry. MSBasis started in November 2004. Centres: 50. Countries: 22 | |
| Participants | N = 3296. Women 70.5%. Age, median (IQR): 31.6 (25.3‐39.3) years. Registry participants with a CIS with symptom onset less than 12 months from the enrolment date. Clinical presentation: optic pathways 22%; supratentorial 20.5%; brainstem 21.5%; spinal cord syndrome 26%). EDSS, median (IQR): 2.0 (1‐2.5). Abnormal T1 and T2 MRI scans were recorded in 47% and 96% of participants, respectively. Oligoclonal antibodies in cerebrospinal fluid, positive: 32% of participants | |
| Interventions | N = 910 (28%) participants were treated with intramuscular IFNβ‐1a (42.7%), subcutaneous IFNβ‐1a (33.8%), IFNβ‐1b (18.4%), or glatiramer acetate (13.7%) N = 2386 (72%) were not exposed to disease‐modifying drugs during follow‐up | |
| Outcomes | Primary outcome: time to CDMS, i.e. individualised risk of clinical conversion to CDMS at 12 months. CDMS defined as examination evidence of a symptomatic second neurological episode attributable to demyelination of more than 24 hs' duration and more than 4 weeks from the initial attack (Poser criteria). N = 5378.70 person‐years contributed to outcome data | |
| Notes | All models presented were adjusted for country to control for any residual inter‐country heterogeneity, for baseline and time‐varying factors. The MSBasis study was supported by Merck Serono, between 2004 and 2009 | |
| Methods | RCT, parallel‐group. Recruitment period: October 2008‐October 2010. Countries: 34 (Argentina (2), Austria (2), Belgium (4), Bosnia and Herzegovina (1), Bulgaria (9), Canada (1), Croatia (2), Czech Republic (6), Estonia (2), Finland (4), France (3), Georgia (3), Germany (2), India (6), Italy (19), Korea (5), Lebanon (1), Macedonia (1), Norway (2), Poland (9), Portugal (4), Romania (4), Russia (25), Serbia (3), Singapore (1), Spain (2), Sweden (3), Taiwan (3), Thailand (1), Turkey (2), Ukraine (3), United Arab Emirates (1), UK (1), USA (23). Centres: 160 | |
| Participants | N = 617. Women 65%. Age, mean (range): 32 years (18‐55 years). Presentation: monofocal 52%; multifocal 48%. Participants with a first clinical demyelinating event within 75 days before screening. They had an abnormal brain MRI consisting of at least two clinically silent T2‐weighted MRI lesions, at least one of which was ovoid, periventricular, or infratentorial, of at least 3 mm in diameter | |
| Interventions | Cladribine cumulative dose: 3.5 mg/kg body weight oral for 22 months (N = 206) Cladribine cumulative dose: 5.25 mg/kg body weight oral for 22 months (N = 205) Placebo oral tablets (undefined) oral for 22 months (N = 206) Corticosteroid treatment of first relapse: 66% Participants who converted to CDMS during the double‐blind period entered the open‐label maintenance period and were offered open‐label treatment with subcutaneous interferon beta‐1a, 44 μg 3 times weekly. participants who did not convert to CDMS were eligible to enter the long‐term follow‐up without study drug until conversion to MS according to the 2005 McDonald criteria, when they were treated with open‐label cladribine 3.5 mg/kg under the original design, or with subcutaneous interferon beta‐1a 44 μg three times weekly after the protocol amendment due to the sponsor’s decision to terminate development of oral cladribine. Participants converting to CDMS during long‐term follow‐up received interferon beta‐1a 44 μg 3 times weekly. (p 258) | |
| Outcomes | Primary: time to CDMS conversion represented by Kaplan‐Meier estimates of the cumulative percentage of participants with CDMS (time frame: baseline up to month 22) defined according to Poser criteria, i.e. the occurrence of a second attack or a sustained increase in the expanded disability status scale (EDSS) score. Secondary: 1) time to develop MS conversion according to the revised McDonald Criteria (2005) represented by Kaplan‐Meier estimates of the cumulative percentage of participants with McDonald MS (time frame: baseline up to month 22); 2) number of participants with adverse events and serious adverse events (time frame: baseline up to month 22) | |
| Notes | Funded by Merck Serono SA Geneva, a subsidiary of Merck KGaA, Darmstadt, Germany. Early termination following the sponsor's decision (October 2011) (p 258). The study was designed by members of the steering committee and the sponsor. Data were collected, analysed, and interpreted by the sponsor. All authors had access to the data and contributed to data analysis and interpretation (p 261) | |
| Risk of bias | ||
| Bias | Authors' judgement | Support for judgement |
| Random sequence generation (selection bias) | Low risk | "Randomisation was done using a central web‐based randomisation system and was stratified by geographic region". (p 258) |
| Allocation concealment (selection bias) | Low risk | A central web‐based randomisation system. (p 258) |
| Other major baseline imbalance | Low risk | The study appears to be free of sources of bias related to major baseline imbalance |
| Blinding of participants and personnel (performance bias) | High risk | "Participants who converted to CDMS during the double‐blind period entered the open‐label maintenance period and were offered open‐label treatment with subcutaneous interferon beta‐1a, 44 μg three times weekly". (p 258) High risk of unblinding after shifting to open‐label active treatment during the randomised study |
| Blinding of outcome assessment (detection bias) | Low risk | "Masking was maintained using a two‐physician model (both doctors were masked). The treating physician supervised study medication administration, and recorded and treated adverse events and MS relapses. The evaluating physician assessed all neurological findings and relapses, and was additionally masked to patient laboratory data. For every patient, conversion to CDMS required confirmation and approval by a sponsor‐appointed, treatment‐blinded study adjudication committee". (p 258) |
| Incomplete outcome data (attrition bias) | High risk | Truncated. The study period was planned to be 22 months. It was stopped early following the sponsor’s decision to stop the cladribine programme (Supplementary web‐appendix). 211 (34%) of 614 randomised participants (104 Cladribine 5.25 mg/kg; 131 Cladribine 3.5 mg/kg; and 104 placebo) completed the study (Fig. 3; p 262). The number excludes participants who converted to CDMS during the double‐blind period, and therefore left the double‐blind period to enter the open‐label maintenance |
| Selective reporting (reporting bias) | High risk | In the original protocol, an analysis of disability‐worsening was to be done in participants who had converted to CDMS but, owing to the early trial termination, the sponsor decided before database lock, and with an amended statistical analysis plan, not to analyse time to disability‐worsening. (p 260) |
| Methods | RCT, parallel‐group. Recruitment period: February 2002‐August 2005. Country: Iran. Centres: 4 | |
| Participants | N = 217. Women 68%. Age, range: 19‐50 years. Participants with a first optic neuritis (48%), spinal cord syndrome (24%), brain stem or cerebellar syndrome (22%) in the previous 3 months confirmed by neurologic examination. They had an abnormal brain MRI consisting of 2 or more clinically silent lesions that were at least 3 mm in diameter and at least 1 had to be periventricular or ovoid | |
| Interventions | Interferon beta‐1a (Avonex) 30 µg intramuscular once a week for 36 months (N = 104 included in analysis) | |
| Outcomes | Primary: time to conversion to CDMS as defined by the occurrence of a second exacerbation that was attributed to a part of central nervous system that differed from the initial episode at study entry Secondary: time to second exacerbation | |
| Notes | Sponsor not reported. Potential conflicts of interest of authors not reported | |
| Risk of bias | ||
| Bias | Authors' judgement | Support for judgement |
| Random sequence generation (selection bias) | Unclear risk | No information |
| Allocation concealment (selection bias) | Unclear risk | No information |
| Other major baseline imbalance | Low risk | The study appears to be free of sources of bias related to major baseline imbalance (Table 1; p 430) |
| Blinding of participants and personnel (performance bias) | Unclear risk | Insufficient information. Only "double blind trial" is reported |
| Blinding of outcome assessment (detection bias) | Unclear risk | Insufficient information |
| Incomplete outcome data (attrition bias) | Unclear risk | Of the 217 participants randomised, 202 (93%) completed the study; 104 received interferon beta 1a and 98 received placebo. Data on participants in whom CDMS did not occur were censored on the date they were last seen by the neurologist. (p 430) |
| Selective reporting (reporting bias) | High risk | Selective under‐reporting of data: conversion to CDMS was reported but with inadequate detail for the data |
| Methods | RCT, parallel‐group. Recruitment period: January 2004‐January 2006. 16 countries worldwide, in 80 centres from the USA, Europe, Argentina, Australia, and New Zealand | |
| Participants | N = 481. Women 67%. Age, mean (range): 31 years (18‐45 years). Monofocal presentation: 100%. Participants with one unifocal neurological event within 90 days after onset. They had positive brain MRI for at least 2 cerebral lesions on the T2‐weighted images of at least 6 mm in diameter | |
| Interventions | Glatiramer acetate (Copaxone) 20 µg subcutaneous once a day for 36 months (N = 243) Steroid use at first clinical demyelinating event: 64% Ibuprofen (400 mg) or paracetamol (acetaminophen) (1000 mg) prophylactically with each injection during the first 3 months of treatment. All participants switched to active treatment with glatiramer acetate upon conversion to CDMS. (p 1506) | |
| Outcomes | Primary: time to conversion to CDMS defined by: 1) a second event suggestive of MS lasting at least 48 h duration or: 2) worsening by 1.5 points on the EDSS confirmed at a consecutive visit 3 months later (slightly modified Poser criteria) | |
| Notes | Funded by TEVA. The sponsor was involved in the study design, conduct, monitoring, data analysis, and writing of the report. The corresponding author had full access to all the data and had final responsibility for the decision to submit for publication (p 1507) Restriction: should the investigator wish to publish the results of this study, he/she agrees to provide Teva with a manuscript for review 60 days prior to submission for publication. Teva retains the right to delete confidential information and to object to suggest publication and/or its timing (at the Company's sole discretion). If Teva chooses to publish this study a copy will be provided to the investigator at least 30 days prior to the expected date of submission to the intended publisher (trial.gov) | |
| Risk of bias | ||
| Bias | Authors' judgement | Support for judgement |
| Random sequence generation (selection bias) | Low risk | "The randomisation scheme was produced by the sponsor of the study with a 1:1 assignment ratio. A SAS‐based blocks with block size of 4, stratified by centre was used". (p 1504) |
| Allocation concealment (selection bias) | Unclear risk | No information |
| Other major baseline imbalance | Low risk | The study appears to be free of sources of bias related to major baseline imbalance. (table 2; p 1506) |
| Blinding of participants and personnel (performance bias) | High risk | The criterion to enter the prospectively planned open label study phase was either a second relapse or the end of the double‐blind phase, whichever came first. High risk of unblinding after shifting to open‐label active treatment during the randomised study |
| Blinding of outcome assessment (detection bias) | Unclear risk | Unclear risk for blinding of clinical outcome assessment. "Treating and examining neurologists at the sites were masked to MRI results during the study. The unmasked statistician presented unmasked results to the Data Monitoring Committee, as per their request" (p 1504) |
| Incomplete outcome data (attrition bias) | High risk | Truncated. The study period was planned to be 3 years. Based on the results of a planned interim analysis of efficacy and on the recommendations of the data monitoring committee (unmasked), the trial was stopped early and all participants were switched to glatiramer acetate. At the time of the interim analysis, 230 (47.8%) of 481 randomised participants completed the study. 98 (40.3%) of 243 treated participants and 132 (55.5%) of 238 placebo completed the study. Proportion and reasons of incomplete data differed between the groups. 39 (16.0%) of 243 participants in the glatiramer group and 23 (8.8%) of 238 in the placebo group discontinued treatment early (table 1, p 1505) and the proportion of termination because of adverse events differed significantly between the two treatment groups |
| Selective reporting (reporting bias) | Low risk | The study protocol was available and all of the study’s pre‐specified primary outcomes were reported |
| Methods | OLE study of the PRECISE 2009 (placebo‐controlled phase of 36 months). Centres: 80 of the original 80 PRECISE study sites | |
| Participants | N = 409. Women 69% and 65% in the early and delayed groups, respectively. Age, median: 30 years | |
| Interventions | N = 198/243 originally randomised to glatiramer acetate (early‐treatment group). Active treatment exposure: 60 months N = 211/238 originally randomised to placebo (delayed‐treatment group). Active treatment exposure: 24 months | |
| Outcomes | Time to CDMS and time to confirmed disability progression measured by EDSS scale at 60 months. Annualised relapse rate. Proportion of participants with relapses or disability progression | |
| Notes | Risk of conversion to CDMS from a Cox’s proportional hazards model was assessed for early‐ and delayed‐treatment subgroups defined by demographics, characteristics of CIS (gender, age, presenting syndrome, steroid treatment for the initial attack) and MRI findings (disease dissemination and activity), at baseline | |
| Risk of bias | ||
| Bias | Authors' judgement | Support for judgement |
| Random sequence generation (selection bias) | High risk | No random assignment to the OLE groups |
| Allocation concealment (selection bias) | High risk | No allocation concealment to the OLE groups |
| Other major baseline imbalance | Unclear risk | Clinical characteristics were similar between the two groups |
| Blinding of participants and personnel (performance bias) | High risk | Unblinding |
| Blinding of outcome assessment (detection bias) | High risk | Unblinding |
| Incomplete outcome data (attrition bias) | High risk | 33% and 47% of early and delayed treatment groups, respectively, dropped out. Proportions and reasons for missing participants differed substantially across intervention groups |
| Selective reporting (reporting bias) | Low risk | Prespecified outcome were reported including adverse events and serious adverse events |
| Methods | RCT, parallel‐group. Recruitment period: November 2006‐August 2010. 28 countries in Europe and Canada. Centres: 78 | |
| Participants | N = 517. Women 64%. Age, mean (range): 31 years (18‐50 years). Participants with a single event suggestive of MS within 60 days before study entry. Presentation: monofocal 54%; multifocal 46%. They had at least two clinically silent lesions of 3 mm or more on T2‐weighted brain MRI scan, at least one of which was ovoid, periventricular, or infratentorial | |
| Interventions | Interferon beta‐1a (Rebif ) 44 µg subcutaneous 3 times a week for 24 months (N = 171) Steroid use at first clinical demyelinating event: 71% Ibuprofen (400 mg) or paracetamol (acetaminophen) (1000 mg) prophylactically with each injection during the first 3 months of treatment. On conversion to CDMS, participants were switched to open‐label subcutaneous interferon beta‐1a at 44 μg 3 times a week until the end of the 24 months | |
| Outcomes | Primary: time to conversion to MS according to the McDonald Criteria (2005) to 24 months Secondary: time to conversion to CDMS defined by either a second attack or a 3‐month sustained increase (≥ to 1.5 points) in EDSS score (slightly modified Poser criteria) | |
| Notes | Funded by Merck Serono. The study was designed by members of the steering committee and the sponsor. The sponsor collected the data, did the analysis, and was involved in the interpretation of the data. The data were available to all authors, and they contributed to the analysis and interpretation of the data. The steering committee was responsible for the final decision to submit this report for publication. Restriction: sponsor has the right to publish any results communication in connection with the study. The PI shall submit any communications including study results to the sponsor for review 30 working days prior to communication submission. The sponsor can request the PI to modify or delete any sponsor's proprietary information. If the PI refuses the modification, the submission shall be postponed for 60 days from PI refusal, to provide the sponsor the opportunity to file a patent or seek legal remedies (trial.gov) | |
| Risk of bias | ||
| Bias | Authors' judgement | Support for judgement |
| Random sequence generation (selection bias) | Low risk | Central randomisation. "Randomisation was stratified according to baseline factors: age (<30 years vs ≥30 years), steroid use for first event (yes vs no), classification of first event (monofocal vs multifocal), and at least one MRI gadolinium‐enhancing lesion (yes vs no)". (p 34) |
| Allocation concealment (selection bias) | Low risk | "The study centre dialled a centralised interactive voice response system to randomly assign participants in a 1:1:1 ratio" (p 34). "A treatment kit number, corresponding to the randomisation group, was allocated centrally to each patient for use only by that individual". (p 34) |
| Other major baseline imbalance | Low risk | The study appears to be free of sources of bias related to major baseline imbalance. (table 1; p 36) |
| Blinding of participants and personnel (performance bias) | High risk | "On conversion to CDMS, participants were switched to open‐label subcutaneous interferon beta‐1a at 44 μg three times a week until the end of the 24 months". (p 34) High risk of unblinding after shifting to open‐label active treatment during the randomised study |
| Blinding of outcome assessment (detection bias) | Low risk | "A two‐physician (treating and assessing) model was used to assist with study masking. The treating physician was responsible for supervision of study drug administration and for recording adverse events and safety assessments. The assessing physician was not involved in the care of study participants and was exclusively responsible for all neurological assessments, beginning with the pre‐study assessment. Injection sites were covered before a patient saw the assessing physician to maintain masking". (p 34) |
| Incomplete outcome data (attrition bias) | Low risk | 448 (87%) of the 517 randomised participants had completed the study: 146 (85%) of 171 participants in interferon beta‐1a 44 µg 3 times a week; 156 (89%) of 175 participants in interferon beta‐1a 44 µg once a week; 146 (85%) of 171 in placebo. Proportion and reasons of withdrawn from study did not differ between the groups: 26 (15.2%) of 171 participants in interferon beta‐1a 44 µg 3 times a week; 20 (11.4%) of 175 participants in interferon beta‐1a 44 µg once a week; and 26 (15.2) of 171 in placebo |
| Selective reporting (reporting bias) | Low risk | The study protocol was available and all of the study’s pre‐specified (primary and secondary) outcomes were reported |
| Methods | OLE study of the REFLEX 2012 (placebo‐controlled phase of 24 months). Centres: 70 of the original 78 REFLEX study sites | |
| Participants | N = 402. Women 61%, 62% and 62% in the 3 groups, respectively. Age, mean: 31.4 (SD 8.3) years | |
| Interventions | N = 127/171 originally randomised to sc IFN β‐1a 44 mg tiw (early‐treatment group). Active treatment exposure: 60 months N = 142/175 originally randomised to sc IFN β‐1a 44 μg qw (early‐treatment group). Active treatment exposure: 60 months N = 133/171 in the delayed‐treatment arm (originally randomised to placebo). Active treatment exposure: 36 months | |
| Outcomes | Time to CDMS conversion (defined in REFLEX 2012) from first randomisation to month 36; time to CDMS to month 60 (secondary end point). Proportion of participants remaining relapse‐free; time to confirmed disability‐worsening (increase of EDSS ≥ 1.0 point, confirmed during a visit 6 months later) and EDSS change from baseline | |
| Notes | Probabilities of CDMS conversion, McDonald MS conversion and EDSS progression over time were determined for each treatment group in the form of cumulative incidence curves estimated using the non‐parametric Kaplan‐Meier method | |
| Risk of bias | ||
| Bias | Authors' judgement | Support for judgement |
| Random sequence generation (selection bias) | High risk | No random assignment to theOLE groups |
| Allocation concealment (selection bias) | High risk | No allocation concealment to the OLE groups |
| Other major baseline imbalance | Unclear risk | Insufficient information about clinical characteristics of participants |
| Blinding of participants and personnel (performance bias) | High risk | Unblinding |
| Blinding of outcome assessment (detection bias) | High risk | Unblinding |
| Incomplete outcome data (attrition bias) | High risk | 30%, 25%, and 29% dropped out respectively in early and delayed treatments groups with different reasons. Not reported reasons for discontinuation across the groups |
| Selective reporting (reporting bias) | Low risk | All expected outcomes were reported |
| Methods | Prospective cohort study. Study started in January 1995 and the database was locked on 15 March 2013 | |
| Participants | N = 1015. Women 68%. Age, mean (SD): 31.1(8.2) years. Monocentric. Participants with CIS that was suggestive of CNS demyelination and was not attributable to other diseases, with symptom onset within 3 months of the first clinical evaluation. Clinical topography at onset: optic neuritis 37%; spinal cord syndrome 26%; brain stem 27%; other 11%. EDSS , median (range): 2.0 (0‐6). Brain MRI available for 94% of participants and abnormal in 69% of them. Oligoclonal antibodies in cerebrospinal fluid available for 79% of participants and positive in 57% of them. N = 1058 enrolled ‐ N = 43 (4%) excluded for various reasons: previous attack (N = 7), age over 50 (N = 4), exceeded entry window (N = 12), and alternative diagnosis (N = 20) ‐ N = 1015 included in analysis ‐ N = 7 (0.7%) died during follow‐up: car accident (N = 1), myocardial infarction (N = 1), pancreatic cancer (N = 1), meningitis as a complication of septoplasty (N = 1), septic shock in a participant with severe disability (N = 1), cardiogenic shock of unknown origin (N = 1) and acute leukemia in a participant who received mitoxantrone (N = 1) | |
| Interventions | N = 388 (38.3%) of participants were on DMT at least once during follow‐up (IFNs or glatiramer acetate). N = 174 (45%) of participants were on DMTs prior to conversion to clinical definite MS (early treatment) N = 214 (55%) of participants were on DMTs after conversion to CDMS (delayed treatment) N = 376 (97%) of participants were on DMTs prior to reaching an EDSS score of 3.0 N = 281(75.3%) of 375 participants with 3–4 Barkhof criteria at baseline received DMT, 143 (51%) of those prior CDMS (early treatment), and 273 (97%) prior to EDSS score of 3.0 The mean time to DMT was significantly shorter in the participants with CIS from 2002–2007 compared with those from 1995–2001 (15.2 months SD = 21 versus 41.5 months, SD = 38, P < 0.001) | |
| Outcomes | CDMS and disability‐worsening (reaching EDSS score 3.0). Clinical follow‐up duration, mean (SD) (range): 81 (57) (0.3–220) months. The participants were evaluated on a regular basis (every 3‐6 months or annually depending on each participant’s characteristics). The participants who did not attend two consecutive follow‐up visits were defined as ‘lost to follow‐up’ | |
| Notes | Multivariate Cox proportional hazards regression analyses for the time to conversion to CDMS or McDonald. Covariates including age, gender, clinical topography, oligoclonal bands, MRI criteria (Barkhof criteria and the number of lesions) and DMT onset prior to the diagnosis of CDMS or McDonald 2005 multiple sclerosis criteria, depending on the outcome, were considered. Possible interactions between age, gender, topographic characteristics, the presence of oligoclonal bands, the number of lesions and DMT were also evaluated. DMT was used in these models as a time‐dependent variable to take into account the date of treatment onset. This work is independent of all the funding bodies, which have played no part in any of its stages. | |
| Methods | RCT, parallel‐group. Recruitment period: February 2008‐August 2012. 20 countries in Europe, USA, Canada, and Australia. Centres: 112 | |
| Participants | N = 618. Women 68%. Age, mean (range): 32 years (18‐55 years). Presentation: monofocal 59%; multifocal 41%. Participants with a first acute or subacute optic neuritis, spinal cord syndrome, brain stem or cerebellar syndrome occurring within 3 months before randomisation. They had an abnormal brain MRI consisting of at least two T2‐weighted MRI lesions of at least 3 mm in diameter | |
| Interventions | Teriflunomide 14 mg oral capsule once daily for up to 25 months (N = 216) Previous systemic corticosteroid treatment: 14% | |
| Outcomes | Primary: conversion to CDMS as defined by the occurrence of a second relapse (Poser diagnostic criteria) Secondary: time to relapse | |
| Notes | Funder Sanofi, Genzyme. Data were obtained by the investigators and were analysed by the sponsor. Interpretation of the data was done by the sponsor and the authors. All authors had full access to, and take responsibility for, the veracity of study data. TOPIC was stopped on Aug 10, 2012, because the 2010 revisions of the MCDonald diagnostic criteria enabled an earlier diagnosis of multiple sclerosis, in some cases at first clinical event. Re‐evaluation of the power calculation based on updated information from the teriflunomide clinical programme, especially from the TOWER study, indicated that sufficient power to detect a reduction in risk of relapse had already been achieved | |
| Risk of bias | ||
| Bias | Authors' judgement | Support for judgement |
| Random sequence generation (selection bias) | Low risk | "Randomisation was done centrally, by an interactive voice recognition system that generated an allocation sequence using a permuted‐block randomisation schedule (block size of six) with stratification by baseline monofocal or multifocal status". (p 978) |
| Allocation concealment (selection bias) | Low risk | "An independent company (ClinPhone, Perceptive Informatics, Nottingham, UK) ran and maintained the interactive voice recognition system for the duration of the study, under the responsibility of the study funder. After a screening phase (up to 4 weeks), investigators called the interactive voice recognition system to receive a random, masked treatment assignment for each patient". (p 978) |
| Other major baseline imbalance | Low risk | The study appears to be free of sources of bias related to major baseline imbalance. (table 1; p 980) |
| Blinding of participants and personnel (performance bias) | High risk | Participants who had a relapse which defined CDMS, and had been treated for at least 24 weeks, could also enter the OLE study. (p 978) High risk of unblinding after shifting to open‐label active treatment during the randomised study |
| Blinding of outcome assessment (detection bias) | Unclear risk | "A treating neurologist at each site assessed participant eligibility, supervised study drug administration, and did the safety assessments. An independent examining neurologist was responsible for all functional system and EDSS assessments. Relapses indicating CDMS were confirmed by the treating neurologist based on the examining neurologist’s EDSS assessment" (p 979) |
| Incomplete outcome data (attrition bias) | High risk | At least 41% and 45% in the treated groups and 40% in the placebo group were lost to follow‐up (Fig. 2; p 980) |
| Selective reporting (reporting bias) | Low risk | The study protocol is not available, however the published reports included all expected outcomes |
CDMS: clinically definite multiple sclerosis; CIS: clinically isolated syndrome; CNS: central nervous system; DMT: disease‐modifying treatment; EDSS: Expanded Disability Status Scale; h: hour; IFN: interferon; MRI: magnetic resonance imaging; MS: multiple sclerosis; N: number; OLE: open‐label extension; VAS: visual analogue scale
Characteristics of excluded studies [ordered by study ID]
Jump to:
| Study | Reason for exclusion |
| Subanalysis of BENEFIT 2006 to evaluate prognostic effect of MRI at baseline on conversion to CDMS | |
| Subanalysis of BENEFIT 2006 trial to evaluate predictive effect of treatment in subgroups of participants | |
| Subanalysis of BENEFIT 2006 trial to evaluate the frequency and consequences of neutralizing antibodies in subgroups of participants | |
| Subanalysis of BENEFIT 2006 trial and open label extension (5 years) study to evaluate cognitive performance in subgroups of participants | |
| Subanalysis of BENEFIT 2006 trial to evaluate effect of Vitamin‐D on conversion to CDMS | |
| Reanalysis of BENEFIT 2006 trial and OLE (5 years) study (BENEFIT 2009 (5 years FU)) to evaluate predictive effect of treatment on persisting T1 hypointensities on MRI | |
| Reanalysis of CHAMPS 2000 trial and OLE (10 years) study (CHAMPS 2012 (10 years FU)) to compare the 10‐year disease progression between subgroups of participants with different baseline MRI characteristics (low and higher T2 lesion counts) | |
| Subanalysis of CHAMPS 2000 trial in participants with a first clinical attack of optic neuritis | |
| Subanalysis of CHAMPS 2000 trial in participants allocated to placebo group | |
| Subanalysis of CHAMPS 2000 trial to evaluate predictive effect of baseline characteristics on conversion to CDMS | |
| Subanalysis of CHAMPS 2000 trial to evaluate prognostic effect of MRI at baseline on conversion to CDMS | |
| Subanalysis of CHAMPS 2000 trial to evaluate predictive effect of treatment in subgroups of high risk participants | |
| Reanalysis of CHAMPS 2000 trial to evaluate predictive effect of treatment in subgroups of participants with different baseline risk of disease progression. | |
| Outcomes were not measured. A retrospective study using insurance claims data (2000–2008) of participants with a first clinical attack suggestive of MS. The objective of the study was to assess health care utilisation and expenditures associated with treating participants early with disease‐modifying drugs rather than delaying until participants met the full diagnostic criteria of MS | |
| Subanalysis of ETOMS 2001 trial to evaluate prognostic effect of MRI at baseline on conversion to CDMS | |
| Subanalysis of ETOMS 2001 trial to evaluate prognostic effect of MRI at baseline on conversion to CDMS | |
| Cohort study. No treatment with disease‐modifying drugs | |
| An open cohorts epidemiological model based on demographics of participants enrolled in the BENEFIT 2006 trial. The model arbitrarily started with 2000 CIS participants diagnosed according to Mc Donald criteria, i.e. MS | |
| Prospective cohort study. N = 125 (10%) participants initially treated with disease‐modifying drugs at the first clinical attack suggestive of MS were not reported separately from participants (1094; 88%) who converted to relapsing‐remitting MS at the time of their first disease‐modifying drugs commencement | |
| Reanalysis of CHAMPS 2000 trial to assess the prognostic value of baseline MRI for conversion to CDMS over 3 years and the predictive effect of the intervention | |
| Prospective cohort study. N = 9 (9%) participants who began disease‐modifying drugs within 1 year of their first clinical attack suggestive of MS were not reported separately from participants (96; 91%) who converted to relapsing‐remitting MS at the time of their first disease‐modifying drugs commencement | |
| Prospective cohort study, a sub‐study of the MSBase Registry (an international online database on MS). N = 252 (19%) participants who began disease‐modifying drugs at their first clinical attack suggestive of MS were not reported separately from participants (1087; 81%) who converted to relapsing‐remitting MS at the time of their first disease‐modifying drugs commencement | |
| Subanalysis of REFLEX 2012 trial to evaluate predictive effect of participants' baseline characteristics | |
| Subanalysis of REFLEX 2012 trial to evaluate prognostic effect of MRI at baseline on conversion to CDMS | |
| Cohort Study. N = 54 (10%) participants initially treated with disease‐modifying drugs at their first clinical attack suggestive of MS were not reported separately from participants (492; 90%) who converted to relapsing‐remitting MS at the time of their first disease‐modifying drugs commencement | |
| Cohort study. Outcomes were not measured |
CDMS: clinically definite multiple sclerosis; CIS: clinically isolated syndrome; MRI: magnetic resonance imaging; MS: multiple sclerosis; OLE: open‐label extension
Characteristics of ongoing studies [ordered by study ID]
Jump to:
| Trial name or title | Prospective observational long‐term safety registry of multiple sclerosis patients who have participated in cladribine clinical trials (PREMIERE) |
| Methods | Observational study |
| Participants | Estimated enrolment: 1190. Subjects with MS and had already participated in sponsor oral cladribine clinical development trials |
| Interventions | Cladribine |
| Outcomes |
Time frame: up to the end of the registry, which is planned for 2018, or 8 years after the participant's first enrolment into a cladribine clinical trial, whichever occurs first |
| Starting date | November 2009 |
| Contact information | US Medical Information |
| Notes | ClinicalTrials.gov identifier: NCT01013350 |
| Trial name or title | Cohort study of clinically isolated syndrome and early multiple sclerosis (CIS‐COHORT) |
| Methods | Prospective cohort |
| Participants | Estimated enrolment: 200 participants with CIS within the last 6 months or diagnosis of MS within the last 2 years |
| Interventions | Immunomodulatory therapy |
| Outcomes | Primary: time (in days) until relapse during the observation period of 4 years |
| Starting date | January 2011 |
| Contact information | Prof. Friedemann Paul [email protected]; Dr. Klemens Ruprecht [email protected] |
| Notes | ClinicalTrials.gov identifier: NCT01371071 |
CIS: clinically isolated syndrome; MS: multiple sclerosis
Data and analyses
| Outcome or subgroup title | No. of studies | No. of participants | Statistical method | Effect size |
| 1 Occurrence of at least one serious adverse event over 24 months Show forest plot | 7 | 3385 | Odds Ratio (M‐H, Random, 95% CI) | 0.78 [0.60, 1.03] |
| Analysis 1.1  Comparison 1 Active intervention versus placebo, Outcome 1 Occurrence of at least one serious adverse event over 24 months. | ||||
| 1.1 Interferon beta‐1b (Betaseron) versus placebo | 1 | 468 | Odds Ratio (M‐H, Random, 95% CI) | 1.00 [0.48, 2.11] |
| 1.2 Interferon beta‐1a (Avonex) versus placebo | 1 | 383 | Odds Ratio (M‐H, Random, 95% CI) | 0.60 [0.28, 1.27] |
| 1.3 Interferon beta‐1a (Rebif) versus placebo | 2 | 823 | Odds Ratio (M‐H, Random, 95% CI) | 0.72 [0.35, 1.46] |
| 1.4 Glatiramer acetate versus placebo | 1 | 481 | Odds Ratio (M‐H, Random, 95% CI) | 0.55 [0.25, 1.17] |
| 1.5 Teriflunomide versus placebo | 1 | 614 | Odds Ratio (M‐H, Random, 95% CI) | 1.06 [0.59, 1.89] |
| 1.6 Cladribine versus placebo | 1 | 616 | Odds Ratio (M‐H, Random, 95% CI) | 0.77 [0.43, 1.37] |
| 2 Occurrence of at least one serious adverse event over 36 months Show forest plot | 1 | Odds Ratio (M‐H, Random, 95% CI) | Subtotals only | |
| Analysis 1.2  Comparison 1 Active intervention versus placebo, Outcome 2 Occurrence of at least one serious adverse event over 36 months. | ||||
| 2.1 Interferon beta‐1a (Avonex) versus placebo | 1 | 202 | Odds Ratio (M‐H, Random, 95% CI) | 1.23 [0.44, 3.45] |
| 3 Withdrawing from the study or discontinuing the drug due to adverse events over 24 months Show forest plot | 5 | 2693 | Odds Ratio (M‐H, Random, 95% CI) | 2.43 [0.91, 6.49] |
| Analysis 1.3  Comparison 1 Active intervention versus placebo, Outcome 3 Withdrawing from the study or discontinuing the drug due to adverse events over 24 months. | ||||
| 3.1 Interferon beta‐1b (Betaseron) versus placebo | 1 | 468 | Odds Ratio (M‐H, Random, 95% CI) | 21.54 [2.92, 159.08] |
| 3.2 Interferon beta‐1a (Rebif) versus placebo | 1 | 514 | Odds Ratio (M‐H, Random, 95% CI) | 0.73 [0.26, 2.10] |
| 3.3 Glatiramer acetate versus placebo | 1 | 481 | Odds Ratio (M‐H, Random, 95% CI) | 3.58 [1.16, 11.03] |
| 3.4 Teriflunomide versus placebo | 1 | 614 | Odds Ratio (M‐H, Random, 95% CI) | 1.02 [0.58, 1.81] |
| 3.5 Cladribine versus placebo | 1 | 616 | Odds Ratio (M‐H, Random, 95% CI) | 4.13 [1.44, 11.87] |
| 4 Withdrawing from the study or discontinuing the drug due to adverse events over 12 months Show forest plot | 1 | Odds Ratio (M‐H, Random, 95% CI) | Subtotals only | |
| Analysis 1.4 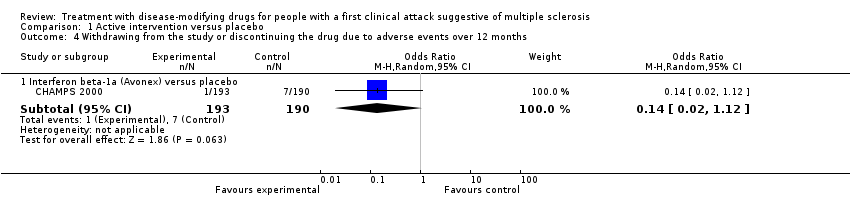 Comparison 1 Active intervention versus placebo, Outcome 4 Withdrawing from the study or discontinuing the drug due to adverse events over 12 months. | ||||
| 4.1 Interferon beta‐1a (Avonex) versus placebo | 1 | 383 | Odds Ratio (M‐H, Random, 95% CI) | 0.14 [0.02, 1.12] |
| 5 Time to conversion to CDMS over 24 months Show forest plot | 9 | Hazard Ratio (Random, 95% CI) | 0.53 [0.47, 0.60] | |
| Analysis 1.5 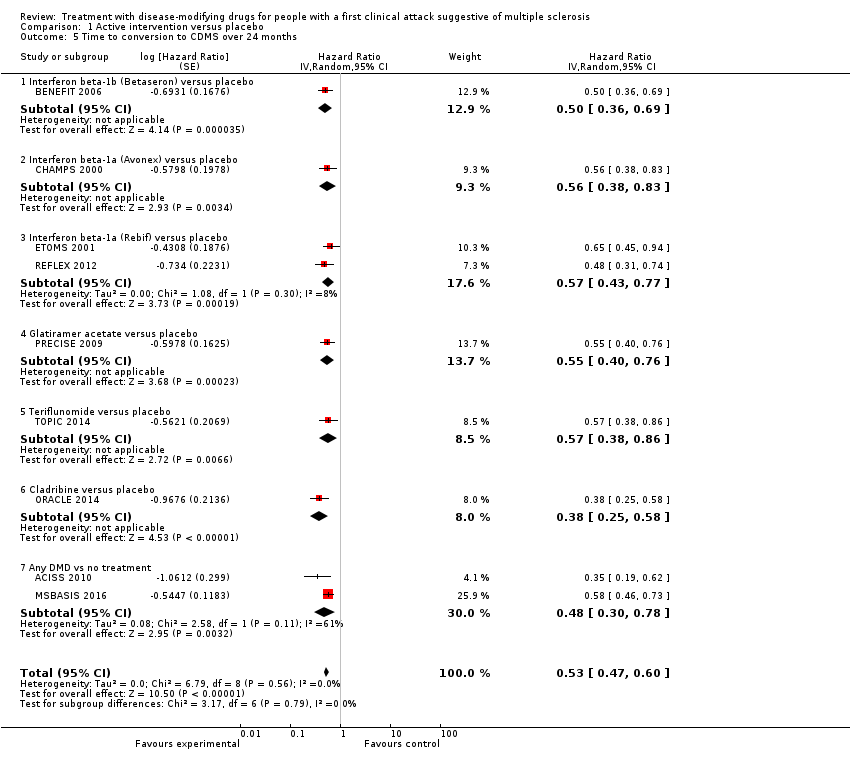 Comparison 1 Active intervention versus placebo, Outcome 5 Time to conversion to CDMS over 24 months. | ||||
| 5.1 Interferon beta‐1b (Betaseron) versus placebo | 1 | Hazard Ratio (Random, 95% CI) | 0.50 [0.36, 0.69] | |
| 5.2 Interferon beta‐1a (Avonex) versus placebo | 1 | Hazard Ratio (Random, 95% CI) | 0.56 [0.38, 0.83] | |
| 5.3 Interferon beta‐1a (Rebif) versus placebo | 2 | Hazard Ratio (Random, 95% CI) | 0.57 [0.43, 0.77] | |
| 5.4 Glatiramer acetate versus placebo | 1 | Hazard Ratio (Random, 95% CI) | 0.55 [0.40, 0.76] | |
| 5.5 Teriflunomide versus placebo | 1 | Hazard Ratio (Random, 95% CI) | 0.57 [0.38, 0.86] | |
| 5.6 Cladribine versus placebo | 1 | Hazard Ratio (Random, 95% CI) | 0.38 [0.25, 0.58] | |
| 5.7 Any DMD vs no treatment | 2 | Hazard Ratio (Random, 95% CI) | 0.48 [0.30, 0.78] | |
| 6 Time to conversion to CDMS over 12 months Show forest plot | 1 | Hazard Ratio (Random, 95% CI) | Subtotals only | |
| Analysis 1.6  Comparison 1 Active intervention versus placebo, Outcome 6 Time to conversion to CDMS over 12 months. | ||||
| 6.1 Immunoglobulins versus placebo | 1 | Hazard Ratio (Random, 95% CI) | 0.36 [0.15, 0.86] | |
| 7 Withdrawing from the study or discontinuing the drug for any reason over 24 months Show forest plot | 6 | 2931 | Odds Ratio (M‐H, Random, 95% CI) | 1.00 [0.61, 1.62] |
| Analysis 1.7  Comparison 1 Active intervention versus placebo, Outcome 7 Withdrawing from the study or discontinuing the drug for any reason over 24 months. | ||||
| 7.1 Interferon beta‐1b (Betaseron) versus placebo | 1 | 487 | Odds Ratio (M‐H, Random, 95% CI) | 1.50 [0.95, 2.35] |
| 7.2 Interferon beta‐1a (Avonex) versus placebo | 1 | 383 | Odds Ratio (M‐H, Random, 95% CI) | 1.09 [0.65, 1.81] |
| 7.3 Interferon beta‐1a (Rebif) versus placebo | 2 | 826 | Odds Ratio (M‐H, Random, 95% CI) | 0.52 [0.18, 1.44] |
| 7.4 Teriflunomide versus placebo | 1 | 618 | Odds Ratio (M‐H, Random, 95% CI) | 0.87 [0.59, 1.27] |
| 7.5 Cladribine versus placebo | 1 | 617 | Odds Ratio (M‐H, Random, 95% CI) | 2.30 [1.49, 3.56] |
| 8 Withdrawing from the study or discontinuing the drug for any reason over 12 months Show forest plot | 1 | Odds Ratio (M‐H, Random, 95% CI) | Subtotals only | |
| Analysis 1.8  Comparison 1 Active intervention versus placebo, Outcome 8 Withdrawing from the study or discontinuing the drug for any reason over 12 months. | ||||
| 8.1 Immunoglobulins versus placebo | 1 | 91 | Odds Ratio (M‐H, Random, 95% CI) | 2.15 [0.37, 12.35] |
| Outcome or subgroup title | No. of studies | No. of participants | Statistical method | Effect size |
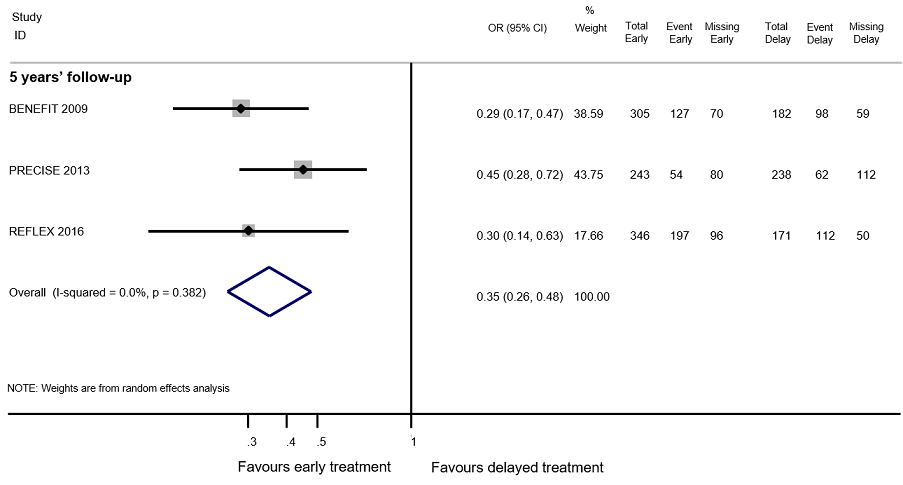
| 1 Time to conversion to CDMS at different follow‐up years Show forest plot | 10 | Hazard Ratio (Random, 95% CI) | Subtotals only | |
| Analysis 2.1  Comparison 2 Early versus delayed treatment, Outcome 1 Time to conversion to CDMS at different follow‐up years. | ||||
| 1.1 2‐4 years' follow‐up | 5 | Hazard Ratio (Random, 95% CI) | 0.62 [0.48, 0.81] | |
| 1.2 5 years' follow‐up | 4 | Hazard Ratio (Random, 95% CI) | 0.62 [0.53, 0.73] | |
| 1.3 8.7‐10 years' follow‐up | 2 | Hazard Ratio (Random, 95% CI) | 0.65 [0.54, 0.79] | |
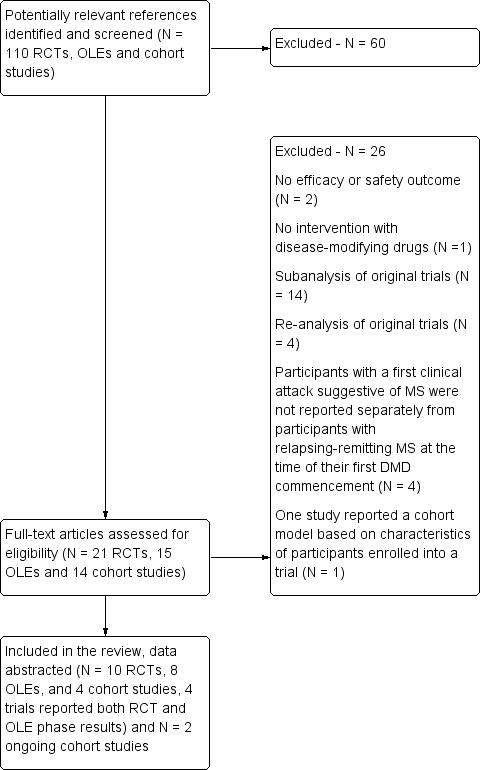
Study flow diagram.
DMD: disease‐modifying drugs; OLEs: open label extension studies; RCTs: randomised controlled trials

Review authors' judgements about each risk of bias item presented as percentages across all included studies and review authors' judgements about each risk of bias item for each included study

Forest plot of comparison: treatment with disease‐modifying drugs compared with placebo. Random‐effects meta‐analysis results of proportion of participants with disability‐worsening over 24 months in RCT studies. We assumed in both groups that the odds of disability‐worsening in missing participants were 5.95 times the odds in the observed participants with 95% CI from 3 to 7

Network plot of comparisons and network meta‐analysis estimates for the proportion of participants who withdrew from the study because of adverse events in RCT studies. The estimate is located at the intersection of the column‐defining treatment and the row‐defining treatment. In the lower triangle the comparisons should be read from left to right, a OR value less than 1 favours the column‐defining treatment. In the upper triangle the comparisons should be read from right to left, a OR value larger 1 favours the row‐defining treatment. Significant results are in italic

Network plot of comparisons and network meta‐analysis estimates for the time to conversion to CDMS in RCT studies over 24 months. The estimate is located at the intersection of the column‐defining treatment and the row‐defining treatment. In the lower triangle the comparisons should be read from left to right, a HR value less than 1 favours the column‐defining treatment. In the upper triangle the comparisons should be read from right to left, a HR value larger than 1 favours the row‐defining treatment. Significant results are in italic

Network plot of comparisons and network meta‐analysis estimates for the proportion of participants who discontinued treatment and were followed up to the end of the study or who were lost to follow‐up for any reason in RCT studies. The estimate is located at the intersection of the column‐defining treatment and the row‐defining treatment. In the lower triangle the comparisons should be read from left to right, a HR value less than 1 favours the column‐defining treatment. In the upper triangle the comparisons should be read from right to left, a HR value larger 1 favours the row‐defining treatment
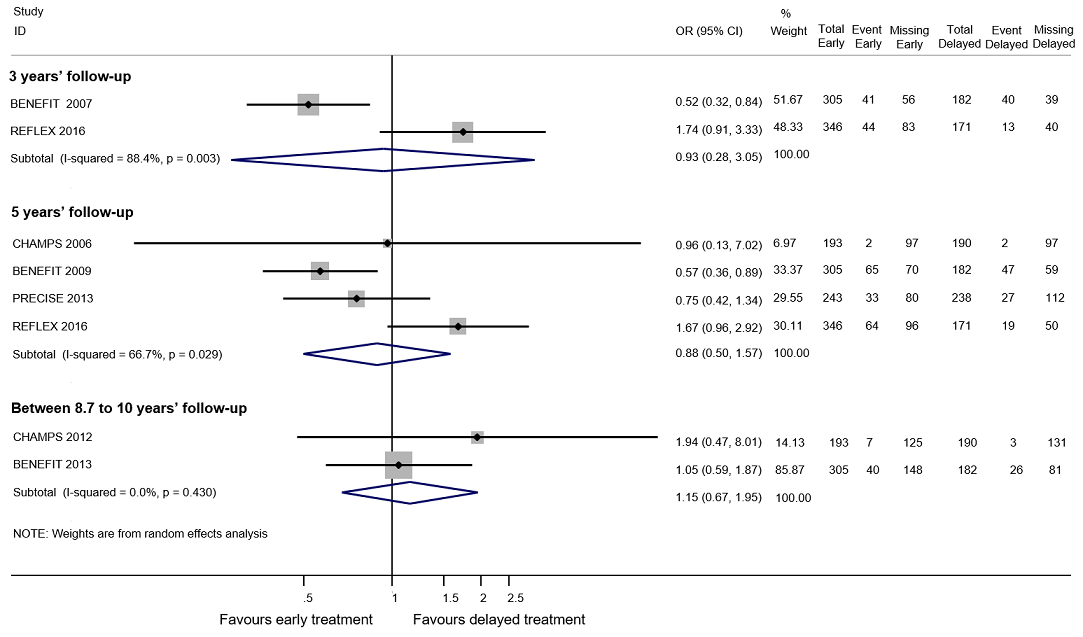
Forest plot of comparison: early treatment compared with delayed treatment with disease‐modifying drugs. Random‐effects meta‐analysis results of proportions of participants with disability‐worsening at a maximum of 3 years, 5 years and 10 years of follow‐up in open‐label extension studies. We assumed in both groups that the odds of disability‐worsening in missing participants were 5.95 times the odds in the observed participants with 95% CI from 3 to 7
Forest plot of comparison: Early treatment compared with delayed treatment with disease‐modifying drugs. Random‐effects meta‐analysis results for proportion of participants with relapse over 5 years follow‐up in OLE studies. We assumed in both groups that the odds of relapses in missing participants were 5.95 times the odds in the observed participants with 95% CI from 3 to 7
Comparison 1 Active intervention versus placebo, Outcome 1 Occurrence of at least one serious adverse event over 24 months.
Comparison 1 Active intervention versus placebo, Outcome 2 Occurrence of at least one serious adverse event over 36 months.
Comparison 1 Active intervention versus placebo, Outcome 3 Withdrawing from the study or discontinuing the drug due to adverse events over 24 months.
Comparison 1 Active intervention versus placebo, Outcome 4 Withdrawing from the study or discontinuing the drug due to adverse events over 12 months.
Comparison 1 Active intervention versus placebo, Outcome 5 Time to conversion to CDMS over 24 months.
Comparison 1 Active intervention versus placebo, Outcome 6 Time to conversion to CDMS over 12 months.
Comparison 1 Active intervention versus placebo, Outcome 7 Withdrawing from the study or discontinuing the drug for any reason over 24 months.
Comparison 1 Active intervention versus placebo, Outcome 8 Withdrawing from the study or discontinuing the drug for any reason over 12 months.
Comparison 2 Early versus delayed treatment, Outcome 1 Time to conversion to CDMS at different follow‐up years.
| Patient: adults with first attack suggestive of MS | |||||||
| Outcomes | Relative effect | Anticipated absolute effects* (95% CI) | Quality of the evidence | What happens | |||
| With placebo | With early disease‐modifying drugs treatment | Difference | |||||
| Disability‐worsening Proportion of participants with disability‐worsening, assessed by EDSS** during 24 months of treatment | OR 0.74 | 34.1% | 27.7% (20.2 to 37.1) | 6.4% fewer (13.9 fewer to 3 more) | ⊕⊝⊝⊝ | The risk of disability‐worsening is less with disease‐modifying drugs than with placebo, but there is a lot of uncertainty in the effect | |
| Relapse Proportion of participants with relapse during 24 months of treatment | OR 0.65 | 41.6% | 31.7% (21.3 to 44.4) | 10.0% fewer (20.3 fewer to 2.8 more) | ⊕⊝⊝⊝ | The risk of relapse is less with disease‐modifying drugs than with placebo, but there is a lot of uncertainty in the effects | |
| Occurrence of at least one serious adverse event Proportion of participants with at least one serious adverse event during 24 months of treatment | OR 0.78 | 8.0% | 6.3% | 1.6% fewer | ⊕⊕⊝⊝ | Compared to placebo, disease‐modifying drugs were associated with less risk of serious adverse events | |
| Withdrawls or drug discontinuation due to adverse events during 24 months of treatment | OR 2.43 | 3.5% | 8.0% | 4.6% more | ⊕⊝⊝⊝ | Compared to placebo interferon beta 1‐b, glatiramer acetate, and cladribine were associated with higher risk of withdrawals due to adverse events | |
| *The risk in the intervention group (and its 95% confidence interval) is based on the assumed risk in the comparison group and the relative effect of the intervention (and its 95% CI). **EDSS: expanded disability status scale | |||||||
| GRADE Working Group grades of evidence | |||||||
| aHigh risk of bias for blinding of participants and outcome assessment and incomplete outcome data. | |||||||
| Patient: adults with first attack suggestive of MS | ||||||
| Outcomes | Relative effect | Anticipated absolute effects* (95% CI) | Quality of the evidence | What happens | ||
| Without early disease‐modifying drug treatment | With early disease‐modifying drug treatment | Difference | ||||
| Disability‐worsening Proportion of participants with disability‐worsening at a maximum of five years' follow‐up (assessed by EDSS**) | OR 0.88 | 40.2% | 37.2% | 3.0% fewer | ⊕⊝⊝⊝ | No significant effect of early treatment compared to delayed treatment during five years' follow‐up; however there is a significant heterogeneity between the studies |
| Relapse Proportion of participants with relapse at a maximum of five years' follow‐up | OR 0.35 | 83.4% | 63.8% | 19.6% fewer | ⊕⊕⊝⊝ | Early treatment reduced the risk of relapses compared to delayed treatment during five years' follow‐up |
| *The risk in the intervention group (and its 95% confidence interval) is based on the assumed risk in the comparison group and the relative effect of the intervention (and its 95% CI). | ||||||
| GRADE Working Group grades of evidence | ||||||
| aHigh risk of bias for allocation concealment, blinding of outcome assessment and incomplete outcome data. | ||||||
| Type of intervention | Route | RCTs N = 10 | OLEs N = 8 | Cohort studies N = 4 |
| Interferon beta‐1b sc (Betaseron®) | sc | 1 | 4 OLEs at a maximum follow‐up of 3, 5, 8.7, and 11 years | 0 |
| Interferon beta‐1a (Avonex®) | im | 2 | 2 OLEs at a maximum follow‐up of 5 and 10 years | 0 |
| Interferon beta‐1a (Rebif®) | sc | 3 | 1 OLE at a maximum follow‐up of 3 and 5 years | 0 |
| Glatiramer acetate sc | sc | 1 | 1 OLE at a maximum follow‐up of 5 years | 0 |
| Cladribine os | os | 1 | 0 | 0 |
| Teriflunomide os | os | 1 | 0 | 0 |
| Immunoglobulins iv | iv | 1 | 0 | 0 |
| disease‐modifying drugs | ‐ | 0 | 0 | follow‐up from 2 to 6 years |
| im: intramuscular; iv: intravenously; OLEs: open‐label extension studies; os: oral; RCTs: randomised controlled studies; sc: subcutaneous | ||||
| Bias | Authors’ judgment | Support for judgement |
| Confounding | Serious | All known important domains were not appropriately controlled for |
| Selection of participants into the study | Low | All participants who would have been eligible for the target trial were likely included in the study and for each participant start of follow up and start of intervention likely coincided |
| Classification of interventions | Low | Intervention status was well defined and intervention definition was based on information collected at the time of intervention |
| Deviations from intended interventions | NI | No information was reported on whether there was deviation from the intended intervention |
| Missing data | Critical | There were critical differences between early, delayed or no treatment in participants with missing data and an appropriate analysis to address missing data was not done |
| Measurement of outcomes | Serious | The outcome measures were subjective and assessed by assessors aware of the intervention received by study participants. This judgment is applicable to all the three outcomes reported in the article |
| Selection of the reported result | Low | There was evidence that reported results corresponded to all intended outcomes and analyses |
| Overall bias | Critical | Study judged to be at critical risk of bias in one domain |
| Bias | Authors’ judgment | Support for judgement |
| Confounding | Moderate | Confounding expected, all known important confounding domains appropriately measured and controlled for, and reliability and validity of measurement of important domains were sufficient, such that we do not expect serious residual confounding |
| Selection of participants into the study | Low | All participants who would have been eligible for the target trial were likely included in the study and for each participant start of follow up and start of intervention likely coincided |
| Classification of interventions | Serious | Intervention status was not well defined |
| Deviations from intended interventions | NI | No information was reported on whether there was deviation from the intended intervention |
| Missing data | Low | Data were reasonably complete |
| Measurement of outcomes | Serious | CDMS was assessed by assessors aware of the intervention received by study participants |
| Selection of the reported result | Low | There was evidence that reported results corresponded to all intended outcomes and analyses |
| Overall bias | Serious | Study judged to be at serious risk of bias in two domains, but not at critical risk of bias in any domain |
| Bias | Authors’ judgment | Support for judgement |
| Confounding | Serious | Important domains were not appropriately controlled for |
| Selection of participants into the study | Critical | Selection into the study was very strongly related to intervention and outcome and this could not be adjusted for in analyses |
| Classification of interventions | Serious | Intervention status was not well defined |
| Deviations from intended interventions | NI | No information was reported on whether there was deviation from the intended intervention |
| Missing data | NI | No information was reported on missing data |
| Measurement of outcomes | Serious | The outcome measures were subjective and they were assessed by assessors aware of the intervention received by study participants. Follow‐up duration not reported |
| Selection of the reported result | Low | There was evidence that reported results corresponded to all intended outcomes and analyses |
| Overall bias | Critical | Study judged to be at critical risk of bias in one domain |
| Bias | Authors’ judgment | Support for judgement |
| Confounding | Serious | Important domains were not appropriately controlled for |
| Selection of participants into the study | Low | All participants who would have been eligible for the target trial were likely included in the study and for each participant start of follow up and start of intervention likely coincided |
| Classification of interventions | Serious | Intervention status was not well defined |
| Deviations from intended interventions | NI | No information was reported on whether there was deviation from the intended intervention |
| Missing data | Serious | Reasons for missing data differed substantially across interventions, and the analysis is unlikely to have removed the risk of bias arising from the missing data |
| Measurement of outcomes | Serious | The outcome measures were subjective and assessed by assessors aware of the intervention received by study participants. This judgment is applicable to all outcomes reported in the article |
| Selection of the reported result | Low | There was evidence that reported results corresponded to all intended outcomes and analyses |
| Overall bias | Serious | Study judged to be at serious risk of bias in four domains, but not at critical risk of bias in any domain |
| ROBINS‐I is a tool to evaluate Risk Of Bias In Non‐randomised Studies ‐ of Interventions (Sterne 2016) | ||
| Study | Did the researchers actively monitor for adverse events or did they simply provide spontaneous reporting of adverse events that arose? | Did the authors define serious adverse events according to an accepted international classification and report the number of serious adverse events? |
| No information | No information | |
| No information | No information | |
| Yes, active monitoring.“Regular visits were scheduled for safety assessments at months 3, 6, 9, 12, 18, and 24”. (page 1243) | No information | |
| No information | No information | |
| No information | No information | |
| No information | No information | |
| No information | No information | |
| No active monitoring. "Each center was instructed to report all adverse events during the first six months of treatment, but thereafter to report only serious adverse events". (page 899) | No information | |
| No information | No information | |
| No information | No information | |
| Yes, active monitoring. "Safety was assessed at 1, 6, 12, 18, 24 months". (page 1577) | Yes to both questions. "Serious adverse events were defined according to the guidelines of the International Conference on Harmonisation". (page 1580) | |
| No information | No information | |
| Yes, active monitoring."Safety assessments were performed at the end of months 1, 2, 3, 9, 15, and 21 by a neurologist". (page 345) | No information | |
| No information | No information | |
| Yes, active monitoring. "Adverse events and laboratory findings were recorded at study visits and at regularly scheduled interim visits" (page 259). "International Conference on Harmonisation of Technical Requirements for Registration of Pharmaceuticals for Human Use". (page 258) | Yes to both questions. "International Conference on Harmonisation of Technical Requirements for Registration of Pharmaceuticals for Human Use". (page 258) | |
| No information | No information | |
| Unclear whether the researchers actively monitored for adverse events or they simply provided spontaneous reporting of adverse events | No information | |
| Unclear whether the researchers actively monitored for adverse events or they simply provided spontaneous reporting of adverse events | No information | |
| Yes, active monitoring. "Active monitoring by personnel was ensured via various testing". (page 34). "Adverse events were coded with the Medical Dictionary for Regulatory Activities (MedDRA) and analysed according to the preferred terms". (page 35) | Yes to both questions."Adverse events were coded with the Medical Dictionary for Regulatory Activities (MedDRA) and analysed according to the preferred terms". (page 35) | |
| Unclear. "Adverse events (adverse events) were monitored at months 25 and 27 and then every 3 months to the study end". (page 2) | No information | |
| No information | No information | |
| Unclear. "Adverse events were reported by study participants or investigators throughout the study; investigators recorded all such events on case report forms". (page 979) | No information |
| Early DMDs treatment (N = 49) | Delayed DMDs treatment (N = 57) | No treatment (N = 52) | |
| EDSS score over 24 months' follow‐up Mean (SD) Median (range) Kruskal–Wallis H‐Test P value <0.001 | 1.2 (0.9) 1.5 (0‐3) | 1.6 (1.2) 1.5 (0‐6) | 0.8 (0.8) 1.0 (0‐3) |
| P value versus no treatment | 0.016 | < 0.001 | NA |
| P value early versus delayed treatment (Wilcoxon matched pair test) | 0.055 | NA | NA |
| Relapses Mean (SD) Median (range) Kruskal–Wallis H‐Test P value < 0.001 | 0.5 (0.8) 0.0 (0‐4) | 1.0 (1.1) 1.0 (0‐4) | 0.2 (0.5) 0.0 (0‐3) |
| P value versus no treatment | 0.059 | < 0.001 | NA |
| P value early versus delayed treatment (Wilcoxon matched pair test) | 0.01 | NA | NA |
| Risk of attaining an EDSS score of 3.0 with early DMDs compared with delayed DMDs treatment. Adjusted hazard ratio: 0.5 (95% CI 0.3 to 0.9) Unadjusted hazard ratio: 1.1 (95% CI 0.7 to 1.9) | |||
| DMDs: disease‐modifying drugs. EDSS: expanded disability status scale; NA: not applicable; SD: standard deviation | |||
| Study | Time until the delayed treatment after randomisation |
| Mean (SD): 1.5 (0.73) years | |
| Median (interquartile range): 30 (24‐35) months | |
| Median (range): 29 (0.5 –38) months | |
| Data not reported |
| Interferon beta‐1b | Intramuscular interferon beta 1‐a (Avonex) | Subcutaneous interferon beta 1‐a (Rebif) | Glatiramer acetate | |
| Participants | 487 | 383 | 517 | 481 |
| Serious adverse events ‐ number of participants | 123 | 65 | 49 | 60 |
| Discontinued treatment for any adverse events | Not reported | Not reported | 20 | 71 |
| Discontinued treatment or were lost to follow‐up for any reason | 204 | Not reported | 146 | 192 |
| Years of follow‐up | 8.7 | 10 | 5 | 5 |
| Outcome or subgroup title | No. of studies | No. of participants | Statistical method | Effect size |
| 1 Occurrence of at least one serious adverse event over 24 months Show forest plot | 7 | 3385 | Odds Ratio (M‐H, Random, 95% CI) | 0.78 [0.60, 1.03] |
| 1.1 Interferon beta‐1b (Betaseron) versus placebo | 1 | 468 | Odds Ratio (M‐H, Random, 95% CI) | 1.00 [0.48, 2.11] |
| 1.2 Interferon beta‐1a (Avonex) versus placebo | 1 | 383 | Odds Ratio (M‐H, Random, 95% CI) | 0.60 [0.28, 1.27] |
| 1.3 Interferon beta‐1a (Rebif) versus placebo | 2 | 823 | Odds Ratio (M‐H, Random, 95% CI) | 0.72 [0.35, 1.46] |
| 1.4 Glatiramer acetate versus placebo | 1 | 481 | Odds Ratio (M‐H, Random, 95% CI) | 0.55 [0.25, 1.17] |
| 1.5 Teriflunomide versus placebo | 1 | 614 | Odds Ratio (M‐H, Random, 95% CI) | 1.06 [0.59, 1.89] |
| 1.6 Cladribine versus placebo | 1 | 616 | Odds Ratio (M‐H, Random, 95% CI) | 0.77 [0.43, 1.37] |
| 2 Occurrence of at least one serious adverse event over 36 months Show forest plot | 1 | Odds Ratio (M‐H, Random, 95% CI) | Subtotals only | |
| 2.1 Interferon beta‐1a (Avonex) versus placebo | 1 | 202 | Odds Ratio (M‐H, Random, 95% CI) | 1.23 [0.44, 3.45] |
| 3 Withdrawing from the study or discontinuing the drug due to adverse events over 24 months Show forest plot | 5 | 2693 | Odds Ratio (M‐H, Random, 95% CI) | 2.43 [0.91, 6.49] |
| 3.1 Interferon beta‐1b (Betaseron) versus placebo | 1 | 468 | Odds Ratio (M‐H, Random, 95% CI) | 21.54 [2.92, 159.08] |
| 3.2 Interferon beta‐1a (Rebif) versus placebo | 1 | 514 | Odds Ratio (M‐H, Random, 95% CI) | 0.73 [0.26, 2.10] |
| 3.3 Glatiramer acetate versus placebo | 1 | 481 | Odds Ratio (M‐H, Random, 95% CI) | 3.58 [1.16, 11.03] |
| 3.4 Teriflunomide versus placebo | 1 | 614 | Odds Ratio (M‐H, Random, 95% CI) | 1.02 [0.58, 1.81] |
| 3.5 Cladribine versus placebo | 1 | 616 | Odds Ratio (M‐H, Random, 95% CI) | 4.13 [1.44, 11.87] |
| 4 Withdrawing from the study or discontinuing the drug due to adverse events over 12 months Show forest plot | 1 | Odds Ratio (M‐H, Random, 95% CI) | Subtotals only | |
| 4.1 Interferon beta‐1a (Avonex) versus placebo | 1 | 383 | Odds Ratio (M‐H, Random, 95% CI) | 0.14 [0.02, 1.12] |
| 5 Time to conversion to CDMS over 24 months Show forest plot | 9 | Hazard Ratio (Random, 95% CI) | 0.53 [0.47, 0.60] | |
| 5.1 Interferon beta‐1b (Betaseron) versus placebo | 1 | Hazard Ratio (Random, 95% CI) | 0.50 [0.36, 0.69] | |
| 5.2 Interferon beta‐1a (Avonex) versus placebo | 1 | Hazard Ratio (Random, 95% CI) | 0.56 [0.38, 0.83] | |
| 5.3 Interferon beta‐1a (Rebif) versus placebo | 2 | Hazard Ratio (Random, 95% CI) | 0.57 [0.43, 0.77] | |
| 5.4 Glatiramer acetate versus placebo | 1 | Hazard Ratio (Random, 95% CI) | 0.55 [0.40, 0.76] | |
| 5.5 Teriflunomide versus placebo | 1 | Hazard Ratio (Random, 95% CI) | 0.57 [0.38, 0.86] | |
| 5.6 Cladribine versus placebo | 1 | Hazard Ratio (Random, 95% CI) | 0.38 [0.25, 0.58] | |
| 5.7 Any DMD vs no treatment | 2 | Hazard Ratio (Random, 95% CI) | 0.48 [0.30, 0.78] | |
| 6 Time to conversion to CDMS over 12 months Show forest plot | 1 | Hazard Ratio (Random, 95% CI) | Subtotals only | |
| 6.1 Immunoglobulins versus placebo | 1 | Hazard Ratio (Random, 95% CI) | 0.36 [0.15, 0.86] | |
| 7 Withdrawing from the study or discontinuing the drug for any reason over 24 months Show forest plot | 6 | 2931 | Odds Ratio (M‐H, Random, 95% CI) | 1.00 [0.61, 1.62] |
| 7.1 Interferon beta‐1b (Betaseron) versus placebo | 1 | 487 | Odds Ratio (M‐H, Random, 95% CI) | 1.50 [0.95, 2.35] |
| 7.2 Interferon beta‐1a (Avonex) versus placebo | 1 | 383 | Odds Ratio (M‐H, Random, 95% CI) | 1.09 [0.65, 1.81] |
| 7.3 Interferon beta‐1a (Rebif) versus placebo | 2 | 826 | Odds Ratio (M‐H, Random, 95% CI) | 0.52 [0.18, 1.44] |
| 7.4 Teriflunomide versus placebo | 1 | 618 | Odds Ratio (M‐H, Random, 95% CI) | 0.87 [0.59, 1.27] |
| 7.5 Cladribine versus placebo | 1 | 617 | Odds Ratio (M‐H, Random, 95% CI) | 2.30 [1.49, 3.56] |
| 8 Withdrawing from the study or discontinuing the drug for any reason over 12 months Show forest plot | 1 | Odds Ratio (M‐H, Random, 95% CI) | Subtotals only | |
| 8.1 Immunoglobulins versus placebo | 1 | 91 | Odds Ratio (M‐H, Random, 95% CI) | 2.15 [0.37, 12.35] |
| Outcome or subgroup title | No. of studies | No. of participants | Statistical method | Effect size |
| 1 Time to conversion to CDMS at different follow‐up years Show forest plot | 10 | Hazard Ratio (Random, 95% CI) | Subtotals only | |
| 1.1 2‐4 years' follow‐up | 5 | Hazard Ratio (Random, 95% CI) | 0.62 [0.48, 0.81] | |
| 1.2 5 years' follow‐up | 4 | Hazard Ratio (Random, 95% CI) | 0.62 [0.53, 0.73] | |
| 1.3 8.7‐10 years' follow‐up | 2 | Hazard Ratio (Random, 95% CI) | 0.65 [0.54, 0.79] | |