Agentes estimulantes de la eritropoyesis de acción corta para el tratamiento de la anemia en pacientes de prediálisis
Appendices
Appendix 1. Electronic search strategies
| Database | Search terms |
| CENTRAL |
|
| MEDLINE |
|
| EMBASE |
|
Appendix 2. Risk of bias assessment tool
| Potential source of bias | Assessment criteria |
| Random sequence generation Selection bias (biased allocation to interventions) due to inadequate generation of a randomised sequence | Low risk of bias: Random number table; computer random number generator; coin tossing; shuffling cards or envelopes; throwing dice; drawing of lots; minimization (minimization may be implemented without a random element, and this is considered to be equivalent to being random). |
| High risk of bias: Sequence generated by odd or even date of birth; date (or day) of admission; sequence generated by hospital or clinic record number; allocation by judgement of the clinician; by preference of the participant; based on the results of a laboratory test or a series of tests; by availability of the intervention. | |
| Unclear: Insufficient information about the sequence generation process to permit judgement. | |
| Allocation concealment Selection bias (biased allocation to interventions) due to inadequate concealment of allocations prior to assignment | Low risk of bias: Randomisation method described that would not allow investigator/participant to know or influence intervention group before eligible participant entered in the study (e.g. central allocation, including telephone, web‐based, and pharmacy‐controlled, randomisation; sequentially numbered drug containers of identical appearance; sequentially numbered, opaque, sealed envelopes). |
| High risk of bias: Using an open random allocation schedule (e.g. a list of random numbers); assignment envelopes were used without appropriate safeguards (e.g. if envelopes were unsealed or non‐opaque or not sequentially numbered); alternation or rotation; date of birth; case record number; any other explicitly unconcealed procedure. | |
| Unclear: Randomisation stated but no information on method used is available. | |
| Blinding of participants and personnel Performance bias due to knowledge of the allocated interventions by participants and personnel during the study | Low risk of bias: No blinding or incomplete blinding, but the review authors judge that the outcome is not likely to be influenced by lack of blinding; blinding of participants and key study personnel ensured, and unlikely that the blinding could have been broken. |
| High risk of bias: No blinding or incomplete blinding, and the outcome is likely to be influenced by lack of blinding; blinding of key study participants and personnel attempted, but likely that the blinding could have been broken, and the outcome is likely to be influenced by lack of blinding. | |
| Unclear: Insufficient information to permit judgement | |
| Blinding of outcome assessment Detection bias due to knowledge of the allocated interventions by outcome assessors. | Low risk of bias: No blinding of outcome assessment, but the review authors judge that the outcome measurement is not likely to be influenced by lack of blinding; blinding of outcome assessment ensured, and unlikely that the blinding could have been broken. |
| High risk of bias: No blinding of outcome assessment, and the outcome measurement is likely to be influenced by lack of blinding; blinding of outcome assessment, but likely that the blinding could have been broken, and the outcome measurement is likely to be influenced by lack of blinding. | |
| Unclear: Insufficient information to permit judgement | |
| Incomplete outcome data Attrition bias due to amount, nature or handling of incomplete outcome data. | Low risk of bias: No missing outcome data; reasons for missing outcome data unlikely to be related to true outcome (for survival data, censoring unlikely to be introducing bias); missing outcome data balanced in numbers across intervention groups, with similar reasons for missing data across groups; for dichotomous outcome data, the proportion of missing outcomes compared with observed event risk not enough to have a clinically relevant impact on the intervention effect estimate; for continuous outcome data, plausible effect size (difference in means or standardized difference in means) among missing outcomes not enough to have a clinically relevant impact on observed effect size; missing data have been imputed using appropriate methods. |
| High risk of bias: Reason for missing outcome data likely to be related to true outcome, with either imbalance in numbers or reasons for missing data across intervention groups; for dichotomous outcome data, the proportion of missing outcomes compared with observed event risk enough to induce clinically relevant bias in intervention effect estimate; for continuous outcome data, plausible effect size (difference in means or standardized difference in means) among missing outcomes enough to induce clinically relevant bias in observed effect size; ‘as‐treated’ analysis done with substantial departure of the intervention received from that assigned at randomisation; potentially inappropriate application of simple imputation. | |
| Unclear: Insufficient information to permit judgement | |
| Selective reporting Reporting bias due to selective outcome reporting | Low risk of bias: The study protocol is available and all of the study’s pre‐specified (primary and secondary) outcomes that are of interest in the review have been reported in the pre‐specified way; the study protocol is not available but it is clear that the published reports include all expected outcomes, including those that were pre‐specified (convincing text of this nature may be uncommon). |
| High risk of bias: Not all of the study’s pre‐specified primary outcomes have been reported; one or more primary outcomes is reported using measurements, analysis methods or subsets of the data (e.g. subscales) that were not pre‐specified; one or more reported primary outcomes were not pre‐specified (unless clear justification for their reporting is provided, such as an unexpected adverse effect); one or more outcomes of interest in the review are reported incompletely so that they cannot be entered in a meta‐analysis; the study report fails to include results for a key outcome that would be expected to have been reported for such a study. | |
| Unclear: Insufficient information to permit judgement | |
| Other bias Bias due to problems not covered elsewhere in the table | Low risk of bias: The study appears to be free of other sources of bias. |
| High risk of bias: Had a potential source of bias related to the specific study design used; stopped early due to some data‐dependent process (including a formal‐stopping rule); had extreme baseline imbalance; has been claimed to have been fraudulent; had some other problem. | |
| Unclear: Insufficient information to assess whether an important risk of bias exists; insufficient rationale or evidence that an identified problem will introduce bias. |


Risk of bias graph: review authors' judgements about each risk of bias item presented as percentages across all included studies.

Risk of bias summary: review authors' judgements about each risk of bias item for each included study.

Comparison 1 Epoetin alpha every 2 weeks versus weekly, Outcome 1 Change in haemoglobin level.
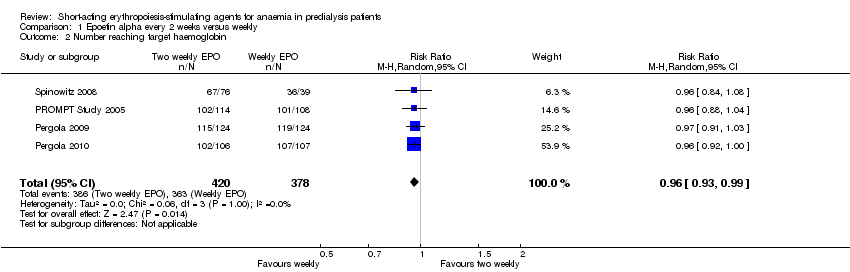
Comparison 1 Epoetin alpha every 2 weeks versus weekly, Outcome 2 Number reaching target haemoglobin.
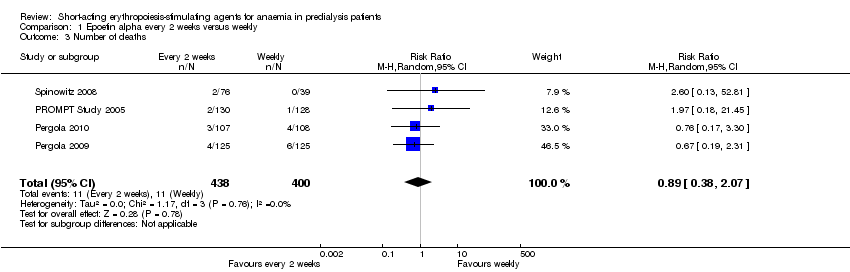
Comparison 1 Epoetin alpha every 2 weeks versus weekly, Outcome 3 Number of deaths.

Comparison 1 Epoetin alpha every 2 weeks versus weekly, Outcome 4 Adverse events.
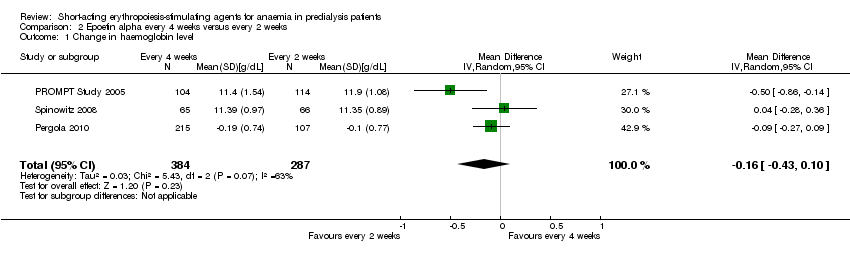
Comparison 2 Epoetin alpha every 4 weeks versus every 2 weeks, Outcome 1 Change in haemoglobin level.
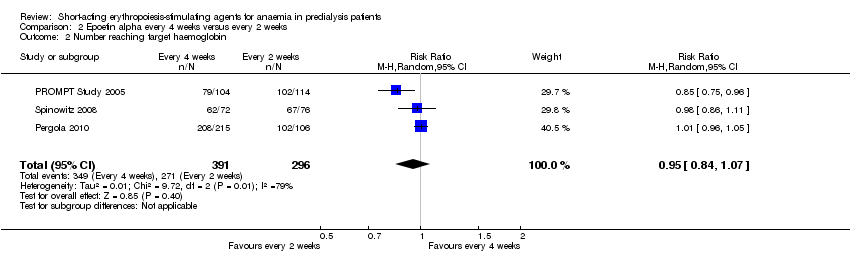
Comparison 2 Epoetin alpha every 4 weeks versus every 2 weeks, Outcome 2 Number reaching target haemoglobin.
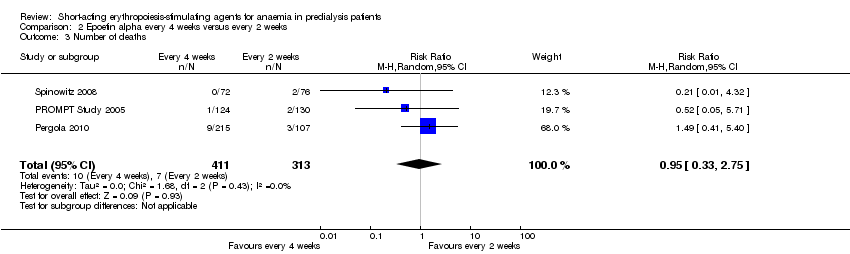
Comparison 2 Epoetin alpha every 4 weeks versus every 2 weeks, Outcome 3 Number of deaths.

Comparison 2 Epoetin alpha every 4 weeks versus every 2 weeks, Outcome 4 Adverse events.

Comparison 3 Epoetin alpha different doses given three times weekly, Outcome 1 Final haemoglobin.
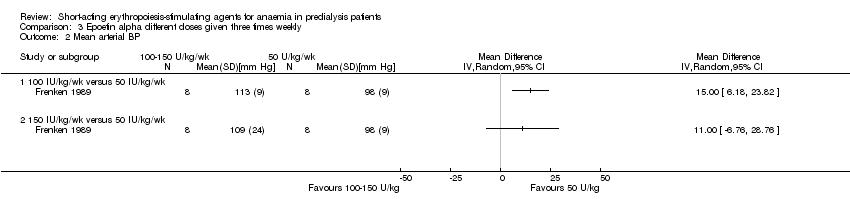
Comparison 3 Epoetin alpha different doses given three times weekly, Outcome 2 Mean arterial BP.

Comparison 3 Epoetin alpha different doses given three times weekly, Outcome 3 Final creatinine levels.

Comparison 4 Epoetin alpha different doses given every four weeks, Outcome 1 Final haemoglobin.

Comparison 4 Epoetin alpha different doses given every four weeks, Outcome 2 Number reaching target haemoglobin.

Comparison 4 Epoetin alpha different doses given every four weeks, Outcome 3 Number of deaths.

Comparison 4 Epoetin alpha different doses given every four weeks, Outcome 4 Adverse events.

Comparison 5 Epoetin alpha IV versus subcutaneous administration, Outcome 1 Final haemoglobin.
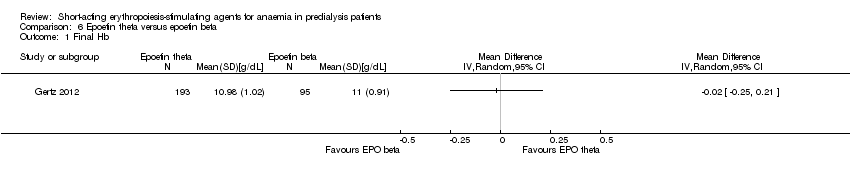
Comparison 6 Epoetin theta versus epoetin beta, Outcome 1 Final Hb.
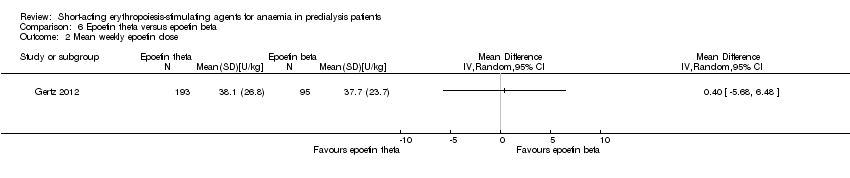
Comparison 6 Epoetin theta versus epoetin beta, Outcome 2 Mean weekly epoetin dose.
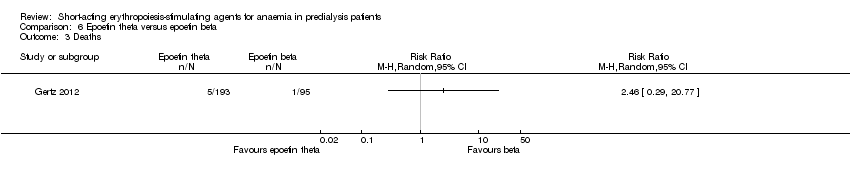
Comparison 6 Epoetin theta versus epoetin beta, Outcome 3 Deaths.

Comparison 6 Epoetin theta versus epoetin beta, Outcome 4 Adverse events.
| Epoetin alpha every 2 weeks versus to weekly for anaemia in CKD patients not receiving dialysis | ||||||
| Patient or population: anaemia in predialysis patients | ||||||
| Outcomes | Anticipated absolute effects* (95% CI) | Relative effect | No. of participants | Quality of the evidence | Comments | |
| Risk with weekly | Risk with Epoetin alpha every 2 weeks | |||||
| Change in Hb level | The mean change in Hb level was 0 g/dL | The mean change in Hb level in the intervention group was 0.19 g/dL lower (0.32 g/dL lower to 0.06 g/dL lower) | ‐ | 798 (4) | ⊕⊕⊝⊝ | downgraded for study limitations and indirectness |
| Number reaching target Hb | Study population | RR 0.96 | 798 (4) | ⊕⊕⊝⊝ | downgraded for study limitations and indirectness | |
| 960 per 1000 | 922 per 1000 | |||||
| Moderate | ||||||
| 947 per 1000 | 910 per 1000 | |||||
| Number of deaths | Study population | RR 0.89 | 838 (4) | ⊕⊕⊝⊝ | downgraded for study limitations and imprecision | |
| 28 per 1000 | 24 per 1000 | |||||
| Moderate | ||||||
| 22 per 1000 | 20 per 1000 | |||||
| Adverse events: RBC transfusions | Study population | RR 1.56 | 580 (3) | ⊕⊕⊝⊝ | downgraded for imprecision and study limitations | |
| 33 per 1000 | 52 per 1000 | |||||
| Moderate | ||||||
| 37 per 1000 | 58 per 1000 | |||||
| Adverse events: hypertension | Study population | RR 0.85 | 838 (4) | ⊕⊕⊕⊝ | downgraded for study limitations | |
| 100 per 1000 | 85 per 1000 | |||||
| Moderate | ||||||
| 95 per 1000 | 81 per 1000 | |||||
| Adverse events: thrombovascular events | Study population | RR 1.41 | 838 (4) | ⊕⊕⊝⊝ | downgraded for study limitations and imprecision | |
| 28 per 1000 | 39 per 1000 | |||||
| Moderate | ||||||
| 27 per 1000 | 38 per 1000 | |||||
| *The risk in the intervention group (and its 95% confidence interval) is based on the assumed risk in the comparison group and the relative effect of the intervention (and its 95% CI). | ||||||
| GRADE Working Group grades of evidence | ||||||
| 1 allocation concealment unclear in 3 of 4 studies 2 surrogate outcome 3 few studies with low numbers and wide confidence 4 allocation concealment unclear in 2 of 3 studies | ||||||
| Epoetin alfa every four weeks versus with every two weeks in CKD patients not receiving dialysis | ||||||
| Patient or population: anaemia in predialysis patients | ||||||
| Outcomes | Anticipated absolute effects* (95% CI) | Relative effect | No. of participants | Quality of the evidence | Comments | |
| Risk with every 2 weeks | Risk with Epoetin alpha every 4 weeks | |||||
| Change in Hb level | The mean change in Hb level was 0 | The mean change in Hb level in the intervention group was 0.15g/dL lower (0.41 g/dL lower to 0.1g/dL more) | ‐ | 671 (3) | ⊕⊝⊝⊝ | downgraded for study limitations, heterogeneity and indirectness |
| Number reaching target Hb | Study population | RR 0.95 | 687 (3) | ⊕⊝⊝⊝ | downgraded for study limitations, heterogeneity and indirectness | |
| 916 per 1000 | 870 per 1000 | |||||
| Moderate | ||||||
| 895 per 1000 | 850 per 1000 | |||||
| Number of deaths | Study population | RR 0.95 | 724 (3) | ⊕⊕⊝⊝ | downgraded for study limitations, imprecision | |
| 22 per 1000 | 21 per 1000 | |||||
| Moderate | ||||||
| 26 per 1000 | 25 per 1000 | |||||
| Adverse events: RBC transfusions | Study population | RR 1.26 | 470 (2) | ⊕⊕⊝⊝ | downgraded for study limitations, imprecision | |
| 38 per 1000 | 48 per 1000 | |||||
| Moderate | ||||||
| 35 per 1000 | 44 per 1000 | |||||
| Adverse events: hypertension | Study population | RR 1.02 | 724 (3) | ⊕⊕⊕⊝ | downgraded for study limitations | |
| 70 per 1000 | 72 per 1000 | |||||
| Moderate | ||||||
| 62 per 1000 | 63 per 1000 | |||||
| Adverse events: arteriovenous complications | Study population | RR 1.02 | 724 (3) | ⊕⊕⊝⊝ | downgraded for study limitations, imprecision | |
| 26 per 1000 | 26 per 1000 | |||||
| Moderate | ||||||
| 23 per 1000 | 24 per 1000 | |||||
| *The risk in the intervention group (and its 95% confidence interval) is based on the assumed risk in the comparison group and the relative effect of the intervention (and its 95% CI). | ||||||
| GRADE Working Group grades of evidence | ||||||
| 1 two of the three studies had unclear allocation concealment 2 surrogate outcome 3 unexplained heterogeneity 4 small numbers with wide confidence intervals | ||||||
| Epoetin theta versus epoetin beta in CKD patients not receiving dialysis | ||||||
| Patient or population: anaemia in predialysis patients | ||||||
| Outcomes | Anticipated absolute effects* (95% CI) | Relative effect | No. of participants | Quality of the evidence | Comments | |
| Risk with epoetin beta | Risk with Epoetin theta | |||||
| Final Hb | The mean final Hb was 0 g/dL | The mean final Hb in the intervention group was 0.02 g/dL lower (0.25 g/dL lower to 0.21 g/dL higher) | ‐ | 288 (1) | ⊕⊕⊕⊝ | downgraded for indirectness ‐ surrogate outcomes |
| Mean weekly epoetin dose | The mean weekly epoetin dose was 0 units/week | The mean weekly epoetin dose in the intervention group was 0.4 units per week higher (5.68 units per week lower 6.48 units/week higher) | ‐ | 288 (1) | ⊕⊕⊝⊝ | downgraded for indirectness ‐ surrogate outcomes and imprecision |
| Deaths | Study population | RR 2.46 | 288 (1) | ⊕⊕⊝⊝ | downgraded for imprecision | |
| 11 per 1000 | 26 per 1000 | |||||
| Moderate | ||||||
| 11 per 1000 | 26 per 1000 | |||||
| Adverse events: hypertension | Study population | RR 0.35 | 288 (1) | ⊕⊕⊕⊝ | downgraded for imprecision | |
| 74 per 1000 | 26 per 1000 | |||||
| Moderate | ||||||
| 74 per 1000 | 26 per 1000 | |||||
| Adverse events: RBC transfusions | Study population | RR 1.48 | 288 (1) | ⊕⊕⊝⊝ | downgraded for imprecision | |
| 0 per 1000 | 0 per 1000 | |||||
| Adverse events: discontinuation of therapy | Study population | RR 1.77 | 288 (1) | ⊕⊕⊝⊝ | downgraded for imprecision | |
| 53 per 1000 | 93 per 1000 | |||||
| Moderate | ||||||
| 53 per 1000 | 93 per 1000 | |||||
| *The risk in the intervention group (and its 95% confidence interval) is based on the assumed risk in the comparison group and the relative effect of the intervention (and its 95% CI). | ||||||
| GRADE Working Group grades of evidence | ||||||
| 1 Surrogate outcome, not a patient‐centred outcome 2 Small numbers, wide confidence intervals | ||||||
| Outcome or subgroup title | No. of studies | No. of participants | Statistical method | Effect size |
| 1 Change in haemoglobin level Show forest plot | 4 | 785 | Mean Difference (IV, Random, 95% CI) | ‐0.20 [‐0.33, ‐0.07] |
| 2 Number reaching target haemoglobin Show forest plot | 4 | 798 | Risk Ratio (M‐H, Random, 95% CI) | 0.96 [0.93, 0.99] |
| 3 Number of deaths Show forest plot | 4 | 838 | Risk Ratio (M‐H, Random, 95% CI) | 0.89 [0.38, 2.07] |
| 4 Adverse events Show forest plot | 4 | Risk Ratio (M‐H, Random, 95% CI) | Subtotals only | |
| 4.1 RBC transfusions | 3 | 580 | Risk Ratio (M‐H, Random, 95% CI) | 1.56 [0.71, 3.45] |
| 4.2 Hypertension | 4 | 838 | Risk Ratio (M‐H, Random, 95% CI) | 0.85 [0.55, 1.32] |
| 4.3 Thrombovascular events | 4 | 838 | Risk Ratio (M‐H, Random, 95% CI) | 1.41 [0.67, 3.00] |
| 4.4 Adverse events leading to discontinuation of therapy | 1 | 258 | Risk Ratio (M‐H, Random, 95% CI) | 0.98 [0.20, 4.79] |
| Outcome or subgroup title | No. of studies | No. of participants | Statistical method | Effect size |
| 1 Change in haemoglobin level Show forest plot | 3 | 671 | Mean Difference (IV, Random, 95% CI) | ‐0.16 [‐0.43, 0.10] |
| 2 Number reaching target haemoglobin Show forest plot | 3 | 687 | Risk Ratio (M‐H, Random, 95% CI) | 0.95 [0.84, 1.07] |
| 3 Number of deaths Show forest plot | 3 | 724 | Risk Ratio (M‐H, Random, 95% CI) | 0.95 [0.33, 2.75] |
| 4 Adverse events Show forest plot | 3 | Risk Ratio (M‐H, Random, 95% CI) | Subtotals only | |
| 4.1 RBC transfusions | 2 | 470 | Risk Ratio (M‐H, Random, 95% CI) | 1.26 [0.53, 2.98] |
| 4.2 Hypertension | 3 | 724 | Risk Ratio (M‐H, Random, 95% CI) | 1.02 [0.62, 1.69] |
| 4.3 Arteriovenous complications | 3 | 724 | Risk Ratio (M‐H, Random, 95% CI) | 1.02 [0.39, 2.68] |
| Outcome or subgroup title | No. of studies | No. of participants | Statistical method | Effect size |
| 1 Final haemoglobin Show forest plot | 1 | Mean Difference (IV, Random, 95% CI) | Totals not selected | |
| 1.1 100 U/kg versus 50 U/kg | 1 | Mean Difference (IV, Random, 95% CI) | 0.0 [0.0, 0.0] | |
| 1.2 150 U/kg versus 50 U/kg | 1 | Mean Difference (IV, Random, 95% CI) | 0.0 [0.0, 0.0] | |
| 2 Mean arterial BP Show forest plot | 1 | Mean Difference (IV, Random, 95% CI) | Totals not selected | |
| 2.1 100 IU/kg/wk versus 50 IU/kg/wk | 1 | Mean Difference (IV, Random, 95% CI) | 0.0 [0.0, 0.0] | |
| 2.2 150 IU/kg/wk versus 50 IU/kg/wk | 1 | Mean Difference (IV, Random, 95% CI) | 0.0 [0.0, 0.0] | |
| 3 Final creatinine levels Show forest plot | 1 | Mean Difference (IV, Random, 95% CI) | Totals not selected | |
| 3.1 100 IU/kg/wk versus 50 IU/kg/wk | 1 | Mean Difference (IV, Random, 95% CI) | 0.0 [0.0, 0.0] | |
| 3.2 150 IU/kg/wk versus 50 IU/kg/wk | 1 | Mean Difference (IV, Random, 95% CI) | 0.0 [0.0, 0.0] | |
| Outcome or subgroup title | No. of studies | No. of participants | Statistical method | Effect size |
| 1 Final haemoglobin Show forest plot | 1 | Mean Difference (IV, Random, 95% CI) | Totals not selected | |
| 2 Number reaching target haemoglobin Show forest plot | 1 | Risk Ratio (M‐H, Random, 95% CI) | Totals not selected | |
| 3 Number of deaths Show forest plot | 1 | Risk Ratio (M‐H, Random, 95% CI) | Totals not selected | |
| 4 Adverse events Show forest plot | 1 | Risk Ratio (M‐H, Random, 95% CI) | Totals not selected | |
| 4.1 Hypertension | 1 | Risk Ratio (M‐H, Random, 95% CI) | 0.0 [0.0, 0.0] | |
| 4.2 Thrombovascular events | 1 | Risk Ratio (M‐H, Random, 95% CI) | 0.0 [0.0, 0.0] | |
| 4.3 RBC transfusions | 1 | Risk Ratio (M‐H, Random, 95% CI) | 0.0 [0.0, 0.0] | |
| Outcome or subgroup title | No. of studies | No. of participants | Statistical method | Effect size |
| 1 Final haemoglobin Show forest plot | 1 | Mean Difference (IV, Random, 95% CI) | Totals not selected | |
| Outcome or subgroup title | No. of studies | No. of participants | Statistical method | Effect size |
| 1 Final Hb Show forest plot | 1 | Mean Difference (IV, Random, 95% CI) | Totals not selected | |
| 2 Mean weekly epoetin dose Show forest plot | 1 | Mean Difference (IV, Random, 95% CI) | Totals not selected | |
| 3 Deaths Show forest plot | 1 | Risk Ratio (M‐H, Random, 95% CI) | Totals not selected | |
| 4 Adverse events Show forest plot | 1 | Risk Ratio (M‐H, Random, 95% CI) | Totals not selected | |
| 4.1 Hypertension | 1 | Risk Ratio (M‐H, Random, 95% CI) | 0.0 [0.0, 0.0] | |
| 4.2 RBC transfusions | 1 | Risk Ratio (M‐H, Random, 95% CI) | 0.0 [0.0, 0.0] | |
| 4.3 Discontinuation of therapy | 1 | Risk Ratio (M‐H, Random, 95% CI) | 0.0 [0.0, 0.0] | |