Resonancia magnética de perfusión para diferenciar gliomas de bajo y alto grado en la primera consulta
Appendices
Appendix 1. Two‐by‐two contingency table for extraction of data
| Histologic diagnosis | ||
| MR Perfusion result | LGG (Disease positive) | HGG (Disease negative) |
| rCBV < 1.75 (Test positive) | True positive | False negative |
| rCBV > 1.75 (Test negative) | False positive | True negative |
Abbreviations: HGG: high‐grade glioma;LGG: low‐grade glioma; rCBV: relative cerebral blood volume
Appendix 2. MEDLINE search strategy
Medline (OvidSP Epub Ahead of Print, Medline R In‐Process & Other Non‐Indexed Citations and Ovid Medline R 1946 to present) (searched 10 November 2016)
1. Glioma/
2. Glioma, Subependymal/
3. Astrocytoma/
4. Oligodendroglioma/
5. (glioma*1 or astrocytoma* or astrocytic or subependym* or oligodendroglioma* or oligoastrocytoma* or oligo‐astrocytoma* or oligo‐dendroglioma* or oligodendroglial* or oligo‐dendroglial* or LGG or LGGs).ti,ab.
6. Neoplasms, Neuroepithelial/
7. or/1‐6
8. exp Infratentorial Neoplasms/
9. Supratentorial Neoplasms/
10. ((supratentorial or supra‐tentorial or infratentorial or infra‐tentorial or glial cell*1 or neuroepithelial or neuro‐epithelial) adj3 (tumo?r* or neoplas* or anaplas* or cancer* or malignan*)).ti,ab.
11. or/8‐10
12. Neoplasm Staging/
13. Neoplasm Grading/
14. Disease Progression/
15. Neoplasm Invasiveness/
16. (grading or grade or grades or staging or stageing or differentiat* or delineat* or distinguish* or correlat* or distinct* or characteri* or diagnos* or detect* or predict* or sensitivit* or specificit*).ti,ab.
17. or/12‐16
18. 11 and 17
19. Magnetic Resonance Imaging/ or Magnetic Resonance Angiography/
20. Perfusion Imaging/
21. *Diagnostic Imaging/
22. (perfusion adj3 (MR or MRI or magnetic resonance or imaging)).ti,ab.
23. ("dynamic contrast enhanced" or "dynamic susceptibility" or DCE or DSC).ti,ab.
24. or/19‐23
25. (7 or 18) and 24
26. exp animals/ not humans.sh.
27. (veterinary or animal or animals or feline or canine or tierheilkunde).jw.
28. (cat or cats or dog or dogs or beagle or beagles or rat or rats or rodent or rodents or mouse or mice or murine or rabbit or rabbits or pig or pigs or bitch or bitches or feline or canine or swine or porcine or sheep or hamster or hamsters or cattle or bovine or monkey or monkeys or macaque or macaques).ti.
29. or/26‐28
30. 25 not 29
Appendix 3. Embase search strategy
Embase (OvidSP 1980 to 2016 Week 45) (searched 10 November 2016)
1. Glioma/ or Oligodendroglioma/ or Subependymoma/
2. exp Astrocytoma/
3. (glioma*1 or astrocytoma* or astrocytic or subependym* or oligodendroglioma* or oligoastrocytoma* or oligo‐astrocytoma* or oligo‐dendroglioma* or oligodendroglial* or oligo‐dendroglial* or LGG or LGGs).ti,ab.
4. or/1‐3
5. brain tumor/
6. ((supratentorial or supra‐tentorial or infratentorial or infra‐tentorial or glial cell*1 or neuroepithelial or neuro‐epithelial) adj3 (tumo?r* or neoplas* or anaplas* or cancer* or malignan*)).ti,ab.
7. or/5‐6
8. Cancer Staging/ or Cancer Grading/
9. Tumor Invasion/
10. (grading or grade or grades or staging or stageing or differentiat* or delineat* or distinguish* or correlat* or distinct* or characteri* or diagnos* or detect* or predict* or sensitivit* or specificit*).ti,ab.
11. or/8‐10
12. 7 and 11
13. Magnetic Resonance Angiography/
14. Nuclear Magnetic Resonance Imaging/
15. Perfusion Weighted Imaging/
16. Susceptibility Weighted Imaging/
17. *Diagnostic Imaging/
18. (perfusion adj3 (MR or MRI or magnetic resonance or imaging)).ti,ab.
19. ("dynamic contrast enhanced" or "dynamic susceptibility" or DCE or DSC).ti,ab.
20. or/13‐19
21. (4 or 12) and 20
22. (animal.hw. or nonhuman/) not human/
23. (veterinary or animal or animals or feline or canine or tierheilkunde).jw.
24. (cat or cats or dog or dogs or beagle or beagles or rat or rats or rodent or rodents or mouse or mice or murine or rabbit or rabbits or pig or pigs or bitch or bitches or feline or canine or swine or porcine or sheep or hamster or hamsters or cattle or bovine or monkey or monkeys or macaque or macaques).ti.
25. or/22‐24
26. 21 not 25
Appendix 4. Web of Science Core Collection
Web of Science Core Collection (Thomson Reuters: Science Citation Index Expanded and Conference Proceedings Citation Index – Science) (1990 to 2016) (searched 09 November 2016)
#1 TOPIC: (glioma* OR astrocytoma* OR subependym* OR astrocytic OR oligodendroglioma* OR oligoastrocytoma* OR oligodendroglial* OR LGG OR LGGs)
Indexes=SCI‐EXPANDED, CPCI‐S Timespan=1990‐2016
#2 TOPIC: ((supratentorial OR infratentorial OR “glial cell*” OR neuroepithelial) NEAR/3 (tumo?r* OR neoplas* OR anaplas* OR cancer* OR malignan*))
Indexes=SCI‐EXPANDED, CPCI‐S Timespan=1990‐2016
#3 TOPIC: (grading OR grade* OR stageing OR staging OR differentiat* OR delineat* OR distinguish* OR correlat* OR distinct* OR characteri* OR diagnos* OR detect* OR predict* OR sensitivit* OR specificit*)
Indexes=SCI‐EXPANDED, CPCI‐S Timespan=1990‐2016
#4 #3 AND #2
Indexes=SCI‐EXPANDED, CPCI‐S Timespan=1990‐2016
#5 #4 OR #1
Indexes=SCI‐EXPANDED, CPCI‐S Timespan=1990‐2016
#6 TOPIC: ((perfusion NEAR/3 MR) OR (perfusion NEAR/3 “magnetic resonance”) OR (perfusion NEAR/3 imaging) OR “dynamic contrast enhanced” OR “dynamic susceptibility” OR DCE OR DSC OR “magnetic resonance imaging” OR “magnetic resonance angiography”)
Indexes=SCI‐EXPANDED, CPCI‐S Timespan=1990‐2016
#7 #6 and #5
Indexes=SCI‐EXPANDED, CPCI‐S Timespan=1990‐2016
Appendix 5. The QUADAS 2 Tool for assessing methodological quality of included studies
| Domain 1: PARTICIPANT SELECTION | |
| SQ1. Was a consecutive or random sample of patients enrolled? | Yes: The study states that a consecutive or random sample of patients was enrolled. No: The study states that patient sampling was not consecutive or not random. Unclear: This was not clear from the report. |
| SQ2. Was a case‐control design avoided? | Yes: Case control design was avoided. No: Case‐control design was not avoided. The study will be excluded. Unclear: This was not clear from the report. |
| SQ3. Did the study avoid inappropriate inclusions? | Yes: The study avoided inappropriate inclusions, i.e. the study only included patients with suspected infiltrative gliomas that appear solid and non‐enhancing on a standard contrast‐enhanced MRI, which were histologically confirmed to be either low‐ or high‐grade glioma. No: The study included patients with suspected infiltrative gliomas regardless of their appearance on a standard contrast‐enhanced MRI; i.e. tumours may be solid or necrotic, non‐enhancing or enhancing; or tumours were histologically confirmed to be non‐LGG or non‐HGG (e.g. indeterminate grade or non‐glioma); or the study enrolled patients based on histological results and not based on the findings on the standard MRI. Unclear: This was not clear from the report. |
| SQ4. Did the study avoid inappropriate exclusions? | Yes: The study avoided inappropriate exclusions such as difficult‐to‐diagnose cases (e.g. small tumour size), presence or absence of symptoms, additional features on other MRI sequences (e.g. calcification, diffusion restriction) or other imaging modalities (e.g. hyperdensity on a computerised tomography scan). No: The study excluded patients inappropriately. Unclear: This was not clear from the report. |
| RISK OF BIAS Could the selection of patients have introduced bias? | Low risk: 'Yes' for all signalling questions. High risk: 'No' or 'unclear' for at least one signalling question. |
| CONCERNS FOR APPLICABILITY Are there concerns that the included patients and setting do not match the review question? | Low concern: The patient cohort is mainly comprised of subjects with the target condition. High concern: The patient cohort is comprised of a small number or none with the target condition, i.e. patients were initially suspected to have infiltrative gliomas but later confirmed to have a different type of brain tumour. |
| Domain 2: INDEX TEST | |
| SQ1. Were the index test results interpreted without knowledge of the results of the reference standard? In this review, MR perfusion must be performed before the reference standard, however it may be retrospectively analysed in studies. | Yes: Index test results were interpreted without knowledge of the results of the reference standard. No: Index test results were interpreted with knowledge of the results of the reference standard. Unclear: This was not clear from the report. |
| SQ2. If a numerical threshold was used, was it pre‐specified? (Studies must report quantitative results of rCBV or Ktrans, or they will be excluded from the analysis). | Yes: If a quantitative cut off value was pre‐specified. No: If a quantitative cut off value was not pre‐specified. Unclear: This was not clear from the report. |
| RISK OF BIAS Could the conduct or interpretation of the index test have introduced bias? |
Low risk: 'Yes' for all signalling questions. High risk: 'No' or 'unclear' for at least one of the three signalling questions. |
| CONCERNS FOR APPLICABILITY Are there concerns that the index test, its conduct or its interpretation differ from the review question? |
Low concern: MR perfusion was performed in a way that it is commonly done in clinical practice. High concern: MR perfusion was performed in a way that differs from clinical practice (e.g. using an MRI with higher field magnet (greater than 3 Tesla). |
| Domain 3: REFERENCE STANDARD | |
| SQ1. Is the reference standard likely to correctly classify the target condition? (i.e. Is histological diagnosis made from appropriately sampled tissue?) | Yes: All patients underwent surgical resection which allows appropriate sampling of tumour tissue for diagnosis. No: All patients underwent biopsy. (Biopsy for histological diagnosis is an acceptable reference standard but with high potential for sampling error.) Unclear: It is not stated if the patients underwent biopsy or resection for histological diagnosis. |
| SQ2. Were the reference standard results interpreted without knowledge of the results of the index test? | Yes: Reference standard results were interpreted without knowledge of the results of the index test. No: Reference standard results were interpreted with the knowledge of the results of the index test. Unclear: This was not clear from the report. |
| SQ3. Was tumour grading based on histopathological assessment or WHO criteria only (i.e., direct observation on tissue sections)? | Yes: Tumour grading was based on histopathological assessment or WHO criteria only. No: Results from cellular proliferation markers and genetic profiling tests were considered in assigning the tumour grade. Unclear: This was not clear from the report. |
| RISK OF BIAS Could the reference standard, its conduct, or its interpretation have introduced bias? | Low risk: 'Yes' for all signalling questions. High risk: 'No' or 'unclear' for at least one of the signalling questions. |
| CONCERNS FOR APPLICABILITY Are there concerns that the target condition as defined by the reference standard does not match the review question? | Low concern: All patients underwent resection for histological diagnosis. High concern: All patients underwent biopsy. |
| Domain 4: FLOW AND TIMING | |
| SQ1. Was there an appropriate interval between index test and reference standard? | Yes: The interval between index test and reference standard was shorter than or equal to two months. No: The interval between index test and reference standard was longer than two months. Unclear: This was not clear from the report. |
| SQ2. Did all patients receive the same reference standard? | Yes: All patients underwent histologic examination (through biopsy or resection) irrespective of the index test results. No: Patients underwent histologic examination based on the results of the index test. Unclear: This was not clear from the report. |
| SQ3. Were all patients included in the analysis? | Yes: All patients meeting the selection criteria (selected patients) were included in the analysis, or data on all the selected patients were available so that a 2 x 2 table including all selected patients could be constructed. No: Not all patients meeting the selection criteria were included in the analysis or the 2 x 2 table could not be constructed using data on all selected patients. Unclear: This was not clear from the report. |
| RISK OF BIAS Could the patient flow have introduced bias? | Low risk: 'Yes' for all signalling questions. High risk: 'No' or 'unclear' for at least one signalling question. |
HGG: high‐grade glioma;LGG: low‐grade glioma; MRI: magnetic resonance imaging
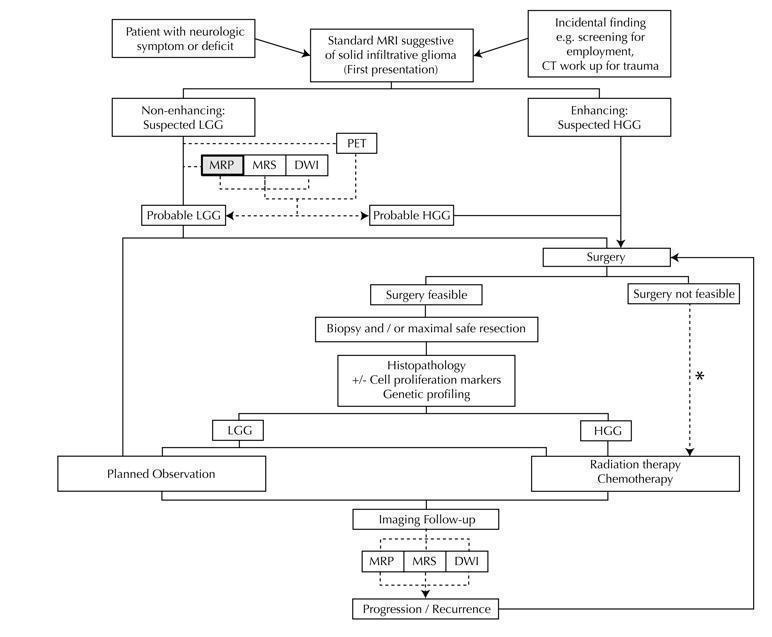
Diagram shows the clinical management algorithm for patients with infiltrative glioma. The role of the index test (MRP) for differentiating LGGs and HGGs at first presentation is shown with alternative tests (MRS, DWI, PET). These advanced MRI techniques are also used to identify progression or recurrence during interval scanning and are included, although they are outside the scope of this review. *May or may not be offered, depending on institutional/regional practice.
Abbreviations: LGG: Low‐grade glioma, HGG: High‐grade glioma,MRP: Magnetic resonance perfusion, MRS: magnetic resonance spectroscopy, DWI: Diffusion‐weighted imaging, PET: Positron emission tomography

Risk of bias and applicability concerns summary: review authors' judgements about each domain for each included study using QUADAS 2 tool, applied on study design and included patient data
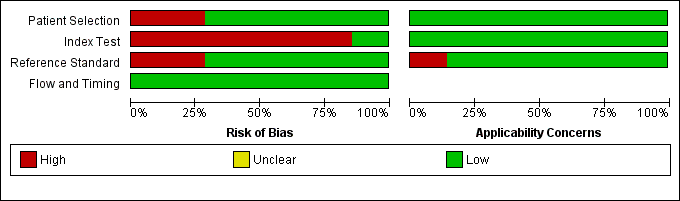
Risk of bias and applicability concerns graph: review authors' judgements about each domain presented as percentages across included studies
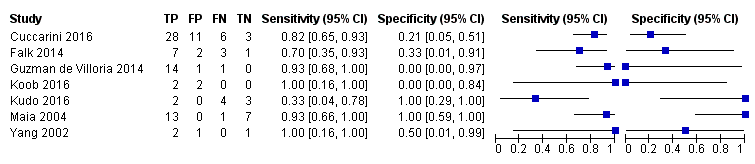
Coupled forest plots of included studies using rCBV threshold of < 1.75 for differentiating low grade gliomas from high‐grade gliomas.

Summary ROC Plot of DSC MR perfusion using rCBV threshold of 1.75 for differentiating low grade gliomas from high‐grade gliomas. In this review, a positive test or rCBV < 1.75 implied an LGG diagnosis, while a negative test or rCBV > 1.75 suggested an HGG diagnosis. In the SROC plot, each study is represented by an open circle with emanating lines, representing the sensitivity and specificity with their confidence intervals. The size of the open circle is proportional to the study sample size. The shaded circle represents the pooled sensitivity and specificity surrounded by a 95% confidence ellipse (dotted line), which in this case is 0.830 (95% CI 0.657, 0.926) and 0.479 (95% CI 0.086, 0.900), respectively.

| Population | Almost all adults | |||||
| Setting | Mostly university hospitals, employing exclusively 1.5T or 3T MRI scanners | |||||
| Index test | Dynamic susceptibility contrast MR perfusion (commonly gradient echo rather than spin echo sequence acquisition), usually without contrast preload, typically using arterial input function or gamma variate function post‐processing algorithms, and preferentially using region‐of‐interest method to obtain Max rCBV values (CBV ratio of tumour: contralateral normal appearing white matter) | |||||
| Importance | For solid and non‐enhancing brain tumours with low rCBV, patients with no or little neurologic deficit may opt for conservative management over surgery to avoid early neurologic disability. Meanwhile, patients with high rCBV could favour early treatment for better tumour control. | |||||
| Reference standard | All with histologic examinations, majority with resection. | |||||
| Studies | Mostly prospective cross sectional studies (no case‐control studies) | |||||
| Positive Test | Summary accuracy | No. of study participants / selected patients | Prevalence | Implications | Quality of studies | Comments |
| rCBV threshold <1.75 indicates LGG | Sensitivity (proportion of LGG detected by MR perfusion) 0.83 (0.66, 0.93) (proportion of HGG detected by MR perfusion) 0.48 (0.09 to 0.90) | 392 patients / 115 with solid non‐enhancing Grade II‐IV gliomas who underwent tissue sampling within 2 months of MR perfusion (7 studies) | In a hypothetical population of solid and non‐enhancing Grade II‐IV gliomas, the prevalence of LGGs and HGGs is 72% and 28%, respectively. | Given 100 patients with solid and non‐enhancing infiltrative gliomas, 72 will have LGG and 28 with HGG. Of 72 patients with LGG, it is expected 12 patients will be misclassified to have HGG (but this could potentially be between 5 to 24 patients) and may undergo surgery, thus risking early neurologic deterioration. Meanwhile, of 28 patients with HGG, 15 will be misclassified to have LGG (but this could be between 3 to 25 patients), which may lead to a delay in treatment that can potentially adversely affect outcomes. | Generally low risk of bias in the patient selection domain, excepting 2 out of 7 studies with unclear patient sampling and inappropriate exclusion of small tumours. High risk of bias in the index test domain, mainly because 6 out of 7 studies did not use a pre‐specified threshold. However this did not affect meta‐analysis as we used a common rCBV threshold of 1.75. Low concerns of applicability for the patient selection, index test and reference standard domains by using patient‐level data. | Low numbers (4 to 48) with target and alternative conditions per study and only 2 studies had >20 patients. In general, individual studies had heterogeneous sensitivity and specificity, both with wide confidence intervals. Only 1 study had low risk of bias and low concern of applicability across all domains. Five studies were considered good quality (i.e., with low risk of bias in the domains of reference standard and flow & timing). Their sensitivity analysis yielded sensitivity 0.80 (95% CI 0.61 to 0.91) and specificity 0.67 (95% CI 0.07 to 0.98). Subgroup analysis showed sensitivity/specificity of [0.92 (95% CI 0.55 to 0.99)/ 0.42 (95% CI 0.02 to 0.95) in astrocytomas and 0.77 (95% CI 0.46 to 0.93)/0.53 (95% CI 0.14 to 0.88) in oligodendrogliomas + oligoastrocytomas. Data were too sparse to investigate any differences across subgroups. |
| HGG: high‐grade glioma, LGG: low‐grade glioma, rCBV: relative cerebral blood volume | ||||||
| WHO Grade | Tumour histology |
| I** | Pilocytic astrocytoma Subependymal giant cell astrocytoma Pleomorphic xanthoastrocytoma Ganglioglioma Ependymoma |
| II | Diffuse astrocytoma Oligodendroglioma Oligoastrocytoma |
| III | Anaplastic astrocytoma Anaplastic oligodendroglioma Anaplastic oligoastrocytoma |
| IV | Glioblastoma multiforme Gliomatosis cerebri |
| * Partial listing and specific to the tumour histology types relevant to this review. **These tumours are included in this table for reference only and are not part of the review. | |
| Included studies | LGG (Grade II) | HGG (Grade III+IV) | DA | OA | OG | AA | AOA | AOG |
| 1.15 ± 0.95 | 1.18 + 0.8 | 1.19 ± 0.76 | 1.12 ± 1.13 | 1.22 ± 0.57 | 1.15 ± 0.53 | 1.33 ± 0.98 | ||
| 1.30 + 0.48 | 1.76 + 0.93 | 1.48 + 0.69 | 1.20 + 0.21 | 1.19 + 0.32 | 2.22 + 1.18 | 0.86 | 1.76 | |
| 1.07 + 0.79 | 0.75 | 0.98 + 0.29 | 1.24 ±1.33 | 0.75 | ||||
| 0.8 + 0.04 | 0.8 + 0.6 | [0.77] | 0.82 | [0.41] | 1.28 | |||
| 3.1 ± 1.19 | 3.83 ± 2.34 | 2.31 ±1.23 | 3.88 ±.46 | 3.8 + 2.3 | ||||
| 1.16 ± 0.63 | 3.2 ± 0.35 | 0.9 ±.43 | 1.98 ± 0.57 | 1.27 | 3.24 ± 0.37 | 2.99 | ||
| 1.29 ± 0.17 | 1.76 ± 0.08 | 1.29 ± 0.17 | 1.81 | 1.7 | ||||
| LGG: Low‐grade glioma, HGG: high‐grade glioma, DA: diffuse astrocytoma, OA: oligoastrocytoma, OG: oligodendroglioma, AA: anaplastic astrocytoma, AOA: Anaplastic oligoastrocytoma, AOG: anaplastic oligodendroglioma. Nearly all HGGs are Grade III, except for one case of Grade IV/glioblastoma from Cuccarini 2016, with rCBV of 0.3. Bracketed values in Koob 2016 are included for completion but represent unspecified gliomas, with no reported histology. | ||||||||
| Test | No. of studies | No. of participants |
| 1 rCBV ‐ Law Threshold Show forest plot | 7 | 115 |