Evaluación y apoyo durante el trabajo de parto temprano para mejorar los resultados del parto
References
References to studies included in this review
References to studies excluded from this review
Additional references
References to other published versions of this review
Characteristics of studies
Characteristics of included studies [ordered by study ID]
Jump to:
| Methods | Cluster randomised trial. Maternity units in Scotland with at least 800 annual births were randomised.14 units participated in this study; each of seven units were allocated the experimental and control group. | |
| Participants | 2183 women included. Inclusion criteria: Primiparous women presenting for admission in spontaneous labour with singleton pregnancy, cephalic presentation, 37‐42 weeks’ gestation and uncomplicated pregnancy. Exclusion criteria: girls under the age of 16, women with learning difficulties, severe illness or important medical problems, or mental health problems or drug or alcohol abuse. Women with essential hypertension, cardiac, renal or endocrine disease, epilepsy or a history of thromboembolism or asthma or women with complications in the current pregnancy including ante[partum haemorrhage, pregnancy induced hypertension, anaemia or low maternal weight at booking. | |
| Interventions | All women: Maternity units encouraged women to contact their maternity unit, by telephone, for advice when they thought that they were in labour and if appropriate to attend the maternity unit for admission assessment. Labour assessment was done in either the labour ward or a designated assessment area. During the trial, women in both groups contacted the hospital and then attended for assessment in a similar way. i.e. telephone advice before attending INTERVENTION: Algorithm for labour diagnosis 7 Maternity units (1029 women, median cluster size 162 women at baseline; 896 women followed up after the intervention with data for 892 included in the analysis) In the experimental group, midwives who admitted women in labour were invited to attend workshops on the intervention and received a training manual on how to use the algorithm for labour diagnosis. The admitting midwife identified eligible women on admission to the labour suite and provided written and verbal explanations of the study and asked for consent. Women received a physical examination and midwives then used a strict process for diagnosing labour. Active labour was diagnosed when women were having regular, painful moderate or strong uterine contractions, spontaneous rupture of membranes or “show”, cervix effacing and at least 3cm dilated. After admission assessment women in both groups received standard care. Women identified as not yet in active labour were encouraged to return home if appropriate or were admitted to an antenatal area, depending on local maternity unit policy. Control Group: 7 maternity units (1291 women, median cluster size 199 at baseline; 1287 women followed up with data for 1297) No special intervention. Women phoned for advice when they thought they were in labour. Once they presented at the study hospital they were assessed by midwives (without using the labour diagnosis algorithm) and then women were managed according to local maternity unit policy. Women in the control group were asked for consent in the postnatal wards. | |
| Outcomes | Primary outcome: oxytocin for labour augmentation. Secondary outcomes were interventions in labour (artificial rupture of membranes, vaginal examination, continuous electronic fetal monitoring, and use of analgesia), admission management (number of admissions before labour, time spent in labour ward, and duration of active labour), and labour outcomes (mode of delivery, intrapartum complications, neonatal outcome, and unplanned out of hospital births). | |
| Notes | The trial took place between April 2005 and June 2007 with a 10 month data collection period in each maternity hospital. Funding: This work was supported by the Scottish Executive Chief Scientist Office Health Service Research Committee (CZH/4/245). The research was independent of the funders. Competing interests: None declared The unit of randomisation in this study was the maternity hospital, midwives were participants at the level of the intervention, and outcomes were measured for women receiving maternity care. Maternity units in Scotland UK with at least 800 births were eligible for randomisation. All hospitals had facilities for labour augmentation.The trial authors kindly provided the original data for this study. Pending further analysis we have included data from this trial in additional tables; the trial statistician carried out appropriate analysis for this cluster randomised trials which accounted for cluster effect within maternity units. Data were collected before the intervention period (baseline) and after the intervention had been introduced. "The primary analysis used multiple regression of maternity unit level data adjusted for baseline". | |
| Risk of bias | ||
| Bias | Authors' judgement | Support for judgement |
| Random sequence generation (selection bias) | Low risk | The trialists used minimisation to allocate maternity units to experimental or control groups. The first unit, was randomly allocated then clusters were allocated to maximise balance between groups. Presence or absence of an on‐site midwife managed birth unit was the balancing variable, as these units had a policy of lower intervention in labour. |
| Allocation concealment (selection bias) | Low risk | Randomisation was carried out by the trial statistician. |
| Blinding of participants and personnel (performance bias) | High risk | Midwives were not blind to the intervention and women in the intervention group would be aware of the intervention. Although the cluster design effect may have reduced contamination the staff in all units may have been aware of study allocation. Trialists reported that staff in the control units received minimal information about the study algorithm. |
| Blinding of outcome assessment (detection bias) | Unclear risk | A clinical midwife in each unit was responsible for facilitating study implementation and collecting trial outcome data from case records. It was not clear whether this midwife was also involved in providing care or obtaining consent. |
| Incomplete outcome data (attrition bias) | Low risk | 14 units participated in this study; seven units were allocated the experimental and control groups. 896 women were in the intervention group and 1287 women were in the control group. Lost to follow‐up: experimental group (n=4), control group (n=8). No loss of clusters from the analysis. It was not clear if there were missing data for any outcomes. |
| Selective reporting (reporting bias) | Low risk | Trial registration and appropriate power calculation. Pre‐specified outcomes reported the paper. Reported adjusting results for cluster design effect. |
| Other bias | Low risk | There were baseline differences between maternity units randomised but baseline differences between clusters were accounted for in the analyses. We did not enter raw data from this trial in our data and analysis tables. Rather, we have presented results from the period following the intervention and reported the difference between groups and the P value; the results take account of baseline differences between maternity units. |
| Methods | Multicentre, randomized controlled trial | |
| Participants | Enrolled 5002 nulliparous women experiencing contractions but not in active labour arriving at hospital. Women who were of less than 34 weeks' gestation were excluded. Immediately after randomisation the appropriate form of care was provided to 2412 women (96.6%) in the structured care group (intervention group) and to 2497 women (99.8%) in the usual care group (control group). The women were nulliparous, had a live singleton fetus in the cephalic position, and had no contraindications to labour. The study was conducted with pregnant women from 20 North American and UK hospitals. | |
| Interventions | Both groups received care in hospital. Experimental group (structured care): immediately after randomisation, women received structured care from a nurse or midwife trained in this type of care for a minimum of 1 hour. Components of structured care: palpate to assess fetal position; encourage maternal positions that promote fetal head rotation or relieve pain; assess labour pain, both contraction pain and backache; demonstrate cognitive, behavioural, and sensory interventions to manage labour pain; assess maternal emotional status; use interventions to reduce emotional distress Control group: usual care was provided by a nurse or midwife who had not been trained in structured care. Each nurse or midwife often provided care to more than 1 woman. Usual care depended on many factors. | |
| Outcomes | Primary outcome Spontaneous vaginal birth Secondary outcomes Number of women:
Other immediate outcomes Labour onset Oxytocin started after active labour Analgesia or anaesthesia Continuous electronic fetal heart rate monitoring Method of delivery Maternal death Neonatal outcomes Alive at birth Birthweight Apgar score Neonatal death High level of care | |
| Notes | Funding source: Canadian Institutes of Health Research (grant No MCT59614) Study dates: women were enrolled between 1 May 2003 and 6 March 2007. Declarations of interest of trial authors: none declared | |
| Risk of bias | ||
| Bias | Authors' judgement | Support for judgement |
| Random sequence generation (selection bias) | Low risk | Described as follows: "Randomisation was centrally controlled and concealed, using an Internet based service". |
| Allocation concealment (selection bias) | Low risk | Randomisation was centrally controlled and concealed, using an internet‐based service. The nurse or midwife accessed the trial website to obtain the participants' study group allocation. Used the central allocation system. |
| Blinding of participants and personnel (performance bias) | Low risk | Nurses' and midwives' study allocation was not blinded. Incomplete blinding, but the outcome was not likely to be influenced by lack of blinding. |
| Blinding of outcome assessment (detection bias) | Low risk | Incomplete blinding, but the outcome was not likely to be influenced by lack of blinding. |
| Incomplete outcome data (attrition bias) | Low risk | Sample attrition was low and balanced between the groups (lost to follow‐up: intervention group 4; control group 2; major congenital anomaly: intervention group 3; control group 4). There was increased loss to follow up for the questionnaire survey at 6‐8 weeks postpartum (intervention 82.7% response rate versus control 82.6%). |
| Selective reporting (reporting bias) | Low risk | Most outcomes specified in the review were reported. |
| Other bias | Low risk | No apparent source of other bias. |
| Methods | A multi‐centre, randomized controlled trial | |
| Participants | 3514 pregnant women were randomly allocated between the 2 arms of the trial: home group = 1759; hospital group = 1755. | |
| Interventions | Experimental (home) group: community midwives supported and assessed nulliparous women at home in early labour. Women received assessment of maternal and fetal condition and labour progress, according to midwives' existing responsibilities when providing care during labour. They supported women with coping strategies, including breathing and relaxation techniques, advice on keeping upright and mobile, guidance on when to go to the hospital, advice on hydration, nutrition and bladder care, the involvement of the woman's birth companion in providing support. Control (hospital) group: standard care was given directly, which usually included telephone advice to attend the hospital delivery suite to determine whether labour was established. | |
| Outcomes | Primary outcomes The proportion of women delivered by:
Secondary outcomes Labour: interventions, duration and complications:
Maternal complications:
Improving care at the primary/secondary interface:
Neonatal complications:
Breastfeeding rates:
| |
| Notes | Funding source: NHS Service Delivery and Organisation R&D Programme. Ref: SDO/40/2003/UK Study dates: recruitment commenced 16 August 2004 and closed 26 June 2006 Declarations of interest of trial authors: no declaration found in trial reports | |
| Risk of bias | ||
| Bias | Authors' judgement | Support for judgement |
| Random sequence generation (selection bias) | Low risk | The trial computing staff at an external unit produced the randomisation code and they were the only people with access to this code. |
| Allocation concealment (selection bias) | Low risk | The unit of randomisation was the individual woman (p35). |
| Blinding of participants and personnel (performance bias) | High risk | Midwives were expected at all times to follow the policies, guidelines and group protocols of their employer, the NHS Trust. Participants and investigators were not blinded. |
| Blinding of outcome assessment (detection bias) | Low risk | No blinding, and the outcome was likely to be influenced by lack of blinding because most participants knew the group to which they were allocated. However, most caregivers may not have been aware of a woman's group allocation from informal discussion and so on. |
| Incomplete outcome data (attrition bias) | Low risk | 4263 women were assigned a study number. 789 women (18.5%) were excluded from the study. 1737 women were allocated to the home visit care group and 1737 women were allocated to the hospital group. All participants were included in the analysis of primary outcomes in this study. |
| Selective reporting (reporting bias) | Low risk | The study protocol is not available but the published reports include expected outcomes in tables. |
| Other bias | High risk | Compliance in the intervention group was very low (447/1759). |
| Methods | Non‐blinded, multicentre, randomized trial | |
| Participants | A total of 237 eligible women who had completed 37 to 41 weeks of gestation, and were aged between 15 and 42 years old, participated in this study. 117 participants were randomized to receive home care and 120 to receive telephone triage. 1 person in each group withdrew from the study, but outcomes for both women were retained and analyzed according to intention‐to‐treat. The study took place at the BC Women's Hospital in Canada. | |
| Interventions | Experimental group (home visit): the time spent by nurses at participants' homes ranged between 60 and 90 minutes. The nursing assessment at home was identical to a routine admission to hospital and included a brief history, assessment of maternal vital signs etc. The women were instructed in comfort measures such as positioning, relaxation techniques, and standard advice about when to proceed to the hospital. Control group (telephone triage): women in the telephone triage group made their own decision about when to come to hospital, based on their telephone conversation with a nurse from the triage or assessment unit. The decision to come to hospital was made without a clinical assessment. | |
| Outcomes | Primary outcome Epidural analgesia Caesarean delivery Secondary outcomes Labour augmentation Use of electronic fetal monitoring Use of analgesia Cervical dilatation on admission Time from admission to delivery Admission to the neonatal care nursery | |
| Notes | Funding source: British Columbia (BC) Health Research Foundation, the BC Medical Services Foundation, the BC Women's Foundation, and BC Women's Hospital Study dates: not reported in trial report Declarations of interest of trial authors: none declared | |
| Risk of bias | ||
| Bias | Authors' judgement | Support for judgement |
| Random sequence generation (selection bias) | Low risk | Quote: "Randomisation was accomplished by means of opening consecutively numbered opaque envelopes containing treatment allocation." |
| Allocation concealment (selection bias) | Low risk | Quote: "Randomisation was accomplished by means of opening consecutively numbered opaque envelopes containing treatment allocation." |
| Blinding of participants and personnel (performance bias) | High risk | Blinding of nurses and physicians caring for participants after hospital admission was not feasible, as women were likely to discuss their early labour experience with their caregivers. |
| Blinding of outcome assessment (detection bias) | High risk | No blinding of outcome assessment, and some outcome measurements such as 'use of electronic fetal monitoring' and 'use of analgesia' were likely to be influenced by lack of blinding. |
| Incomplete outcome data (attrition bias) | Low risk | A total of 237 eligible women participated in this study, 117 of whom were randomized to receive home care and 120 to receive telephone triage. 1 person in each group withdrew from the study, but outcomes for both women were retained and analyzed according to intention‐to‐treat. |
| Selective reporting (reporting bias) | Unclear risk | Not enough information provided to enable us to make this judgement. |
| Other bias | Low risk | No apparent source of other bias. |
| Methods | Multicentre, randomized trial | |
| Participants | This study took place at 7 hospitals in the City of Vancouver, Canada. 2347 eligible women were assessed in this study, 1459 women were randomized (home visit n = 728; telephone support n = 731). No loss to follow‐up in either group. Inclusion criteria of this study were that women lived within a 30‐minute drive of the hospital, were between the ages of 16 and 42 years, had completed 37–41 weeks of gestation, were nulliparous, and were carrying a singleton fetus in the vertex position. | |
| Interventions | Experimental (home visit) group: the nursing assessment at home was identical to that over the telephone, but also included maternal vital signs, abdominal palpation, auscultation of the fetal heart rate, assessment of contractions and examination of the cervix. After the assessment, nurses contacted the primary physician by telephone. Control (telephone support/triage) group: study nurses asked women about their contractions (frequency, duration, and strength), and their own assessment of how they were coping over the phone. Both groups of women were given the same advice. | |
| Outcomes | Primary outcome Rate of caesarean delivery Secondary outcomes Rates of admission to hospital in the latent phase of labour (≤ 3 cm cervical dilatation) Number of visits to hospital that did not result in admission Ability to cope with pain on arrival as assessed by the admitting nurse Rates of intrapartum interventions including:
Newborn outcomes:
| |
| Notes | Funding source: Canadian Institute of Health Research Study dates: women were enrolled between 14 August 2001 to 30 October 2004 Declarations of interest of trial authors: not reported in trial report | |
| Risk of bias | ||
| Bias | Authors' judgement | Support for judgement |
| Random sequence generation (selection bias) | Low risk | Computer‐generated randomisation was achieved using a centralised randomisation service. Randomisation was stratified within participating hospitals, with randomly generated block sizes of 6, 8, and 10. |
| Allocation concealment (selection bias) | Low risk | The computer‐generated randomisation was achieved using a centralised randomisation service. |
| Blinding of participants and personnel (performance bias) | High risk | Nurses and physicians were not blinded to study allocation. |
| Blinding of outcome assessment (detection bias) | Low risk | Outcomes were ascertained from study data collected prospectively and from reviews of hospital charts within 24 hours of discharge. Charts were reviewed by trained nursing research assistants. |
| Incomplete outcome data (attrition bias) | Low risk | 1459 women participated in this study; 728 women were allocated to the home visit group and 731 women were allocated to the telephone support group. Lost to follow‐up: 0, received allocated intervention: home visit 654 (89.8%), telephone 725 (99.2%). |
| Selective reporting (reporting bias) | Unclear risk | Not enough information provided for us to make this judgement. |
| Other bias | Low risk | No apparent source of other bias. |
| Methods | Randomised control, parallel trial | |
| Participants | 209 low‐risk nulliparous women at 37 weeks' or more gestation recruited from a large teaching hospital in Ontario, Canada. Pregnant women who were booked for induction of labour or caesarean section were excluded. | |
| Interventions | Experimental (early labour assessment) group: women received the usual assessments of fetal and maternal well‐being, such as fetal heart rate, blood pressure, and urine tests. They were also instructed when to return to the hospital. The assessment area nurse transferred women in the experimental group to the labour and delivery unit when they had progressed to the active phase of labour. Control group: direct admission to the labour and delivery unit. No instructions or advice were given regarding labour before admission to the labour ward. | |
| Outcomes | Oxytocin Amniotomy Anaesthesia Percentage of caesarean deliveries percentage of instrumental deliveries Labor Agentry Scale (LAS) Length of labour Apgar at 1 min < 7 Apgar at 5 min < 7 Expectations | |
| Notes | Funding source: a grant from the Perinatal Nursing Research Unit, University of Toronto, Ontario, Canada Study dates: recruitment took place from February 1994 to January 1995. Declarations of interest of trial authors: Patricia McNiven was a faculty member of the McMaster University Midwifery Education Programme and had a part‐time midwifery practice in Hamiltion; Jack Williams was a Professor at the University of Toronto and the Deputy Director‐Research, Institute for Clinical Evaluative Sciences, Toronto; Ellen Hodnett was a Professor at the University of Toronto and Heather Reisman Chair in Perinatal Nursing Research, Toronto; Karyn Kaufman was Professor and Chair of the McMaster Midwifery Education Programme, Hamilton; Mary Hannah was the Director of the University of Toronto Maternal, Infant and Reproductive Health Research Unit, Toronto, Ontario, Canada. | |
| Risk of bias | ||
| Bias | Authors' judgement | Support for judgement |
| Random sequence generation (selection bias) | Low risk | A random component in the sequence generation process to open numbered, sealed, and opaque envelopes sequentially. |
| Allocation concealment (selection bias) | Low risk | Using sealed opaque envelopes. |
| Blinding of participants and personnel (performance bias) | High risk | Incomplete blinding. Investigators knew the outcome, so it was influenced. |
| Blinding of outcome assessment (detection bias) | High risk | No blinding, and the outcome was likely to be influenced by lack of blinding. |
| Incomplete outcome data (attrition bias) | Low risk | 209 low‐risk nulliparous women were recruited from a large teaching hospital. 105 women were randomly allocated to the early labour assessment group and 104 to the direct admission group. |
| Selective reporting (reporting bias) | Unclear risk | Not enough information provided for us to make this judgement. |
| Other bias | Low risk | No apparent source of other bias. |
Abbreviations
GA: general anaesthetic
NHS: National Health Service
SCBU: special care baby unit
Characteristics of excluded studies [ordered by study ID]
Jump to:
| Study | Reason for exclusion |
| This trial examined an intervention in the antenatal period. | |
| This study focused on the design and evaluation of an algorithm for the diagnosis of labour. Not a psychosocial or educational intervention. Not a randomized control trial. | |
| This intervention aimed is to reduce women's fear of birth. The scope of this review is specifically about teaching women how to recognise and cope with the latent phase of labour. This study did not match those criteria. | |
| Not a randomized control trial. | |
| This study focused on the development of the Early Labour Experience Questionnarie (ELEQ). No investigation effect of psychosocial and educational interventions. | |
| This study used the cognitive behavioral interventions to reduce risk of antepartum depression. | |
| This study assessed breastfeeding initiation. | |
| This trial examined an intervention in the antenatal period. | |
| Not a randomized control trial. The study design was a quasi‐randomised trial. Participants were selected by their date of attendance according to weekly scheduled visits. | |
| This study assessed the effects of pregnancy and postpartum weight trajectories. Women completed interventions at 4 time points: during pregnancy in the second and third trimester as well as postpartum at 6 months and 12 months. | |
| Not a randomized control trial. The study followed an exploratory quasi‐experimental design. The overall population of 283,324 comprising 35,641 households located in the study was allocated to intervention and control areas based on geographical proximity. | |
| The intervention aimed to review women's current expectations and feelings around fear of childbirth, and to encourage women to express their feelings. This program focused explicitly on the fear of childbirth. This study did not match the criteria or outcomes for this review. | |
| The goal of this study was to examine the effectiveness of a new protocol to prevent postpartum depression. This intervention did not help women during the latent phase of labour. The participants received assessments and interventions between 18 and 36 hours after giving birth, at 2 weeks, 6 weeks, 10 weeks and 16 weeks postpartum. | |
| This study assessed the obstetric triage system. The intervention was to assign women to the triage room, and did not include any support intervention. |
Data and analyses
| Outcome or subgroup title | No. of studies | No. of participants | Statistical method | Effect size |
| 1 Length of labour (hours) Show forest plot | 1 | 209 | Mean Difference (IV, Fixed, 95% CI) | ‐5.20 [‐7.06, ‐3.34] |
| Analysis 1.1  Comparison 1 Assessment vs direct admission in early labour, Outcome 1 Length of labour (hours). | ||||
| 2 Rate of caesarean section Show forest plot | 1 | 209 | Risk Ratio (M‐H, Fixed, 95% CI) | 0.72 [0.30, 1.72] |
| Analysis 1.2 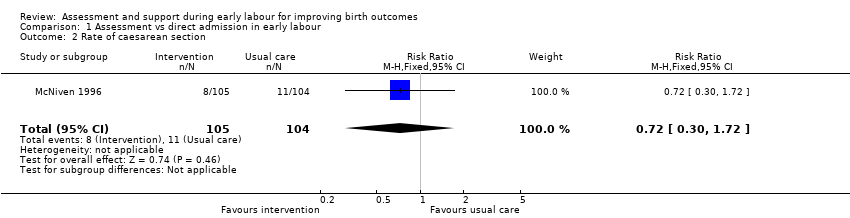 Comparison 1 Assessment vs direct admission in early labour, Outcome 2 Rate of caesarean section. | ||||
| 3 Rate of instrumental vaginal birth Show forest plot | 1 | 209 | Risk Ratio (M‐H, Fixed, 95% CI) | 0.86 [0.58, 1.26] |
| Analysis 1.3 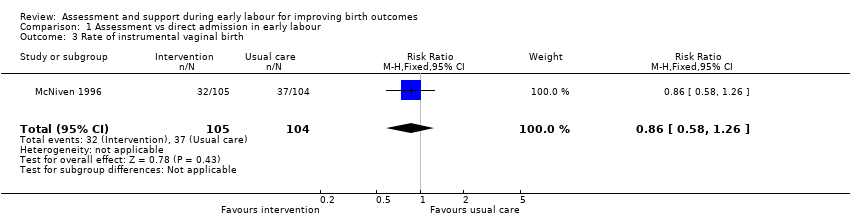 Comparison 1 Assessment vs direct admission in early labour, Outcome 3 Rate of instrumental vaginal birth. | ||||
| 4 Baby born before arrival at hospital or unplanned home birth Show forest plot | 1 | 209 | Risk Ratio (M‐H, Fixed, 95% CI) | 0.0 [0.0, 0.0] |
| Analysis 1.4  Comparison 1 Assessment vs direct admission in early labour, Outcome 4 Baby born before arrival at hospital or unplanned home birth. | ||||
| 5 Augmentation of labour Show forest plot | 1 | 209 | Risk Ratio (M‐H, Fixed, 95% CI) | 0.57 [0.37, 0.86] |
| Analysis 1.5 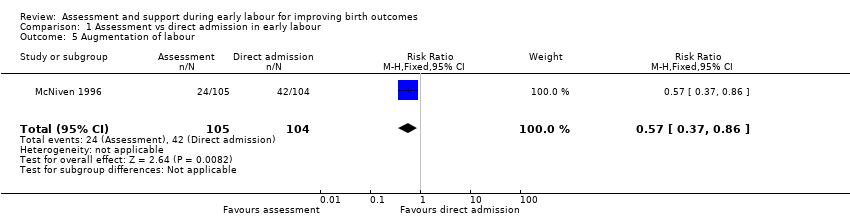 Comparison 1 Assessment vs direct admission in early labour, Outcome 5 Augmentation of labour. | ||||
| 6 Use of epidural or any regional anaesthesia Show forest plot | 1 | 209 | Risk Ratio (M‐H, Fixed, 95% CI) | 0.87 [0.78, 0.98] |
| Analysis 1.6  Comparison 1 Assessment vs direct admission in early labour, Outcome 6 Use of epidural or any regional anaesthesia. | ||||
| 7 Maternal satisfaction (score) Show forest plot | 1 | 201 | Mean Difference (IV, Fixed, 95% CI) | 16.0 [7.53, 24.47] |
| Analysis 1.7 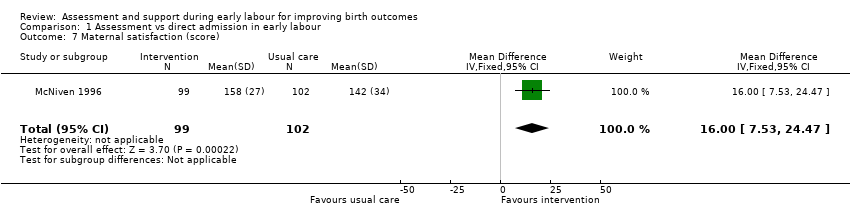 Comparison 1 Assessment vs direct admission in early labour, Outcome 7 Maternal satisfaction (score). | ||||
| 8 Apgar score < 7 at 5 minutes Show forest plot | 1 | 209 | Risk Ratio (M‐H, Fixed, 95% CI) | 2.97 [0.12, 72.12] |
| Analysis 1.8 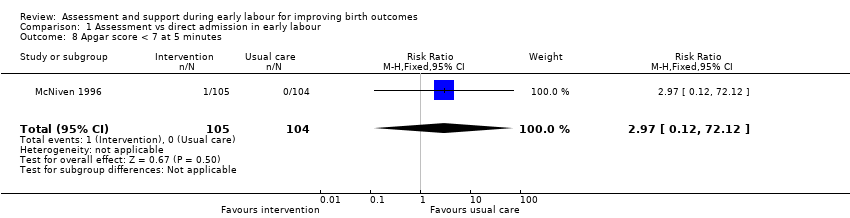 Comparison 1 Assessment vs direct admission in early labour, Outcome 8 Apgar score < 7 at 5 minutes. | ||||
| Outcome or subgroup title | No. of studies | No. of participants | Statistical method | Effect size |
| 1 Length of labour (hours) Show forest plot | 1 | 3474 | Mean Difference (IV, Fixed, 95% CI) | 0.29 [‐0.14, 0.72] |
| Analysis 2.1 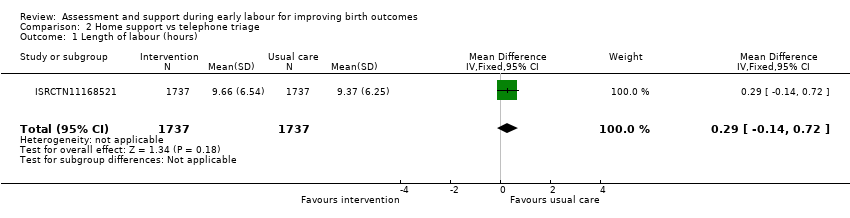 Comparison 2 Home support vs telephone triage, Outcome 1 Length of labour (hours). | ||||
| 2 Rate of caesarean section Show forest plot | 3 | 5170 | Risk Ratio (M‐H, Fixed, 95% CI) | 1.05 [0.95, 1.17] |
| Analysis 2.2  Comparison 2 Home support vs telephone triage, Outcome 2 Rate of caesarean section. | ||||
| 3 Rate of instrumental vaginal birth Show forest plot | 2 | 4933 | Risk Ratio (M‐H, Random, 95% CI) | 0.95 [0.79, 1.15] |
| Analysis 2.3 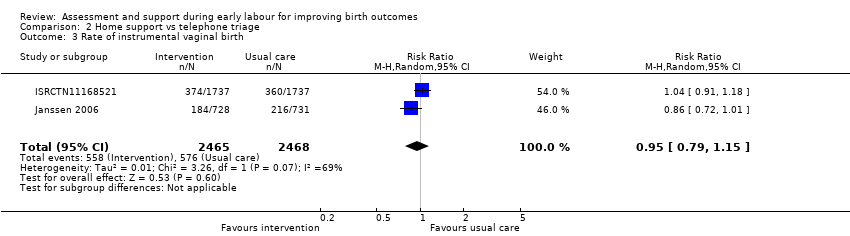 Comparison 2 Home support vs telephone triage, Outcome 3 Rate of instrumental vaginal birth. | ||||
| 4 Baby born before arrival at hospital or unplanned home birth Show forest plot | 1 | 3474 | Risk Ratio (M‐H, Fixed, 95% CI) | 1.33 [0.30, 5.95] |
| Analysis 2.4  Comparison 2 Home support vs telephone triage, Outcome 4 Baby born before arrival at hospital or unplanned home birth. | ||||
| 5 Serious maternal morbidity Show forest plot | 1 | 3474 | Risk Ratio (M‐H, Fixed, 95% CI) | 0.93 [0.61, 1.42] |
| Analysis 2.5  Comparison 2 Home support vs telephone triage, Outcome 5 Serious maternal morbidity. | ||||
| 6 Augmentation of labour Show forest plot | 2 | 1694 | Risk Ratio (M‐H, Fixed, 95% CI) | 0.96 [0.88, 1.04] |
| Analysis 2.6  Comparison 2 Home support vs telephone triage, Outcome 6 Augmentation of labour. | ||||
| 7 Use of epidural or any regional anaesthesia Show forest plot | 3 | 5168 | Risk Ratio (M‐H, Random, 95% CI) | 0.95 [0.87, 1.05] |
| Analysis 2.7  Comparison 2 Home support vs telephone triage, Outcome 7 Use of epidural or any regional anaesthesia. | ||||
| 8 Duration of hospital stay (prolonged postpartum stay in hospital > 5 days) Show forest plot | 1 | 3474 | Risk Ratio (M‐H, Fixed, 95% CI) | 1.15 [0.83, 1.60] |
| Analysis 2.8  Comparison 2 Home support vs telephone triage, Outcome 8 Duration of hospital stay (prolonged postpartum stay in hospital > 5 days). | ||||
| 9 Maternal satisfaction (score) Show forest plot | 1 | 423 | Mean Difference (IV, Fixed, 95% CI) | 3.47 [1.00, 5.94] |
| Analysis 2.9  Comparison 2 Home support vs telephone triage, Outcome 9 Maternal satisfaction (score). | ||||
| 10 Postpartum depression (EPDS score ≥ 13) Show forest plot | 1 | 2584 | Risk Ratio (M‐H, Fixed, 95% CI) | 1.08 [0.82, 1.42] |
| Analysis 2.10  Comparison 2 Home support vs telephone triage, Outcome 10 Postpartum depression (EPDS score ≥ 13). | ||||
| 11 Perinatal death Show forest plot | 1 | 3474 | Risk Ratio (M‐H, Fixed, 95% CI) | 1.0 [0.42, 2.40] |
| Analysis 2.11  Comparison 2 Home support vs telephone triage, Outcome 11 Perinatal death. | ||||
| 12 Neonatal admission to special care Show forest plot | 3 | 5170 | Risk Ratio (M‐H, Random, 95% CI) | 0.84 [0.50, 1.42] |
| Analysis 2.12  Comparison 2 Home support vs telephone triage, Outcome 12 Neonatal admission to special care. | ||||
| 13 Apgar score < 7 at 5 minutes Show forest plot | 3 | 5170 | Risk Ratio (M‐H, Fixed, 95% CI) | 1.19 [0.71, 1.99] |
| Analysis 2.13  Comparison 2 Home support vs telephone triage, Outcome 13 Apgar score < 7 at 5 minutes. | ||||
| 14 Exclusive breastfeeding at discharge Show forest plot | 1 | 3474 | Risk Ratio (M‐H, Fixed, 95% CI) | 1.0 [0.96, 1.04] |
| Analysis 2.14 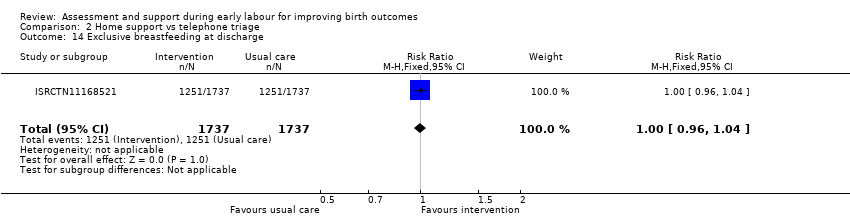 Comparison 2 Home support vs telephone triage, Outcome 14 Exclusive breastfeeding at discharge. | ||||
| 15 Exclusive breastfeeding at six weeks Show forest plot | 1 | 3474 | Risk Ratio (M‐H, Fixed, 95% CI) | 1.05 [0.97, 1.14] |
| Analysis 2.15 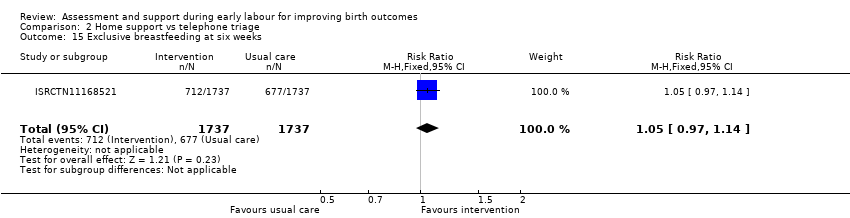 Comparison 2 Home support vs telephone triage, Outcome 15 Exclusive breastfeeding at six weeks. | ||||
| Outcome or subgroup title | No. of studies | No. of participants | Statistical method | Effect size |
| 1 Rate of caesarean section Show forest plot | 1 | 4996 | Risk Ratio (M‐H, Fixed, 95% CI) | 0.93 [0.84, 1.02] |
| Analysis 3.1  Comparison 3 One‐to‐one structured care vs usual care, Outcome 1 Rate of caesarean section. | ||||
| 2 Rate of instrumental vaginal birth Show forest plot | 1 | 4996 | Risk Ratio (M‐H, Fixed, 95% CI) | 0.94 [0.82, 1.08] |
| Analysis 3.2  Comparison 3 One‐to‐one structured care vs usual care, Outcome 2 Rate of instrumental vaginal birth. | ||||
| 3 Serious maternal morbidity Show forest plot | 1 | 4996 | Risk Ratio (M‐H, Fixed, 95% CI) | 1.13 [0.84, 1.52] |
| Analysis 3.3 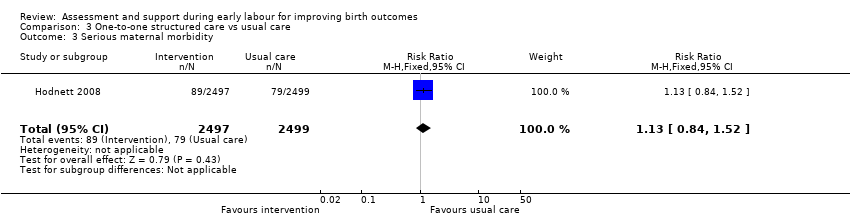 Comparison 3 One‐to‐one structured care vs usual care, Outcome 3 Serious maternal morbidity. | ||||
| 4 Use of epidural or any regional anaesthesia Show forest plot | 1 | 4996 | Risk Ratio (M‐H, Fixed, 95% CI) | 1.00 [0.99, 1.01] |
| Analysis 3.4 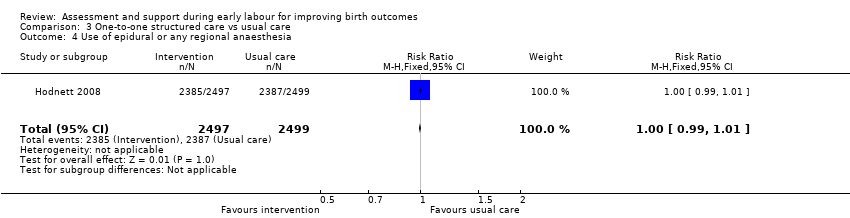 Comparison 3 One‐to‐one structured care vs usual care, Outcome 4 Use of epidural or any regional anaesthesia. | ||||
| 5 Perinatal death Show forest plot | 1 | 4989 | Risk Ratio (M‐H, Fixed, 95% CI) | 0.0 [0.0, 0.0] |
| Analysis 3.5 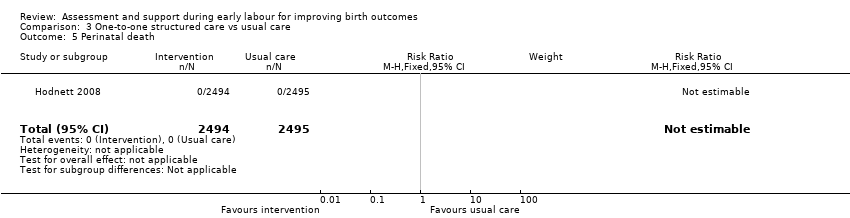 Comparison 3 One‐to‐one structured care vs usual care, Outcome 5 Perinatal death. | ||||
| 6 Neonatal admission to special care Show forest plot | 1 | 4989 | Risk Ratio (M‐H, Fixed, 95% CI) | 0.98 [0.80, 1.21] |
| Analysis 3.6  Comparison 3 One‐to‐one structured care vs usual care, Outcome 6 Neonatal admission to special care. | ||||
| 7 Apgar score < 7 at 5 minutes Show forest plot | 1 | 4989 | Risk Ratio (M‐H, Fixed, 95% CI) | 1.07 [0.64, 1.79] |
| Analysis 3.7  Comparison 3 One‐to‐one structured care vs usual care, Outcome 7 Apgar score < 7 at 5 minutes. | ||||

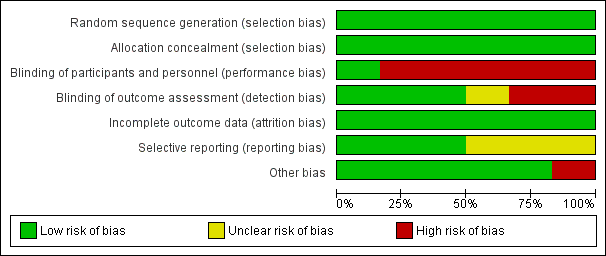
Risk of bias graph: review authors' judgements about each risk of bias item presented as percentages across all included studies

Risk of bias summary: review authors' judgements about each risk of bias item for each included study
Comparison 1 Assessment vs direct admission in early labour, Outcome 1 Length of labour (hours).
Comparison 1 Assessment vs direct admission in early labour, Outcome 2 Rate of caesarean section.
Comparison 1 Assessment vs direct admission in early labour, Outcome 3 Rate of instrumental vaginal birth.
Comparison 1 Assessment vs direct admission in early labour, Outcome 4 Baby born before arrival at hospital or unplanned home birth.
Comparison 1 Assessment vs direct admission in early labour, Outcome 5 Augmentation of labour.
Comparison 1 Assessment vs direct admission in early labour, Outcome 6 Use of epidural or any regional anaesthesia.
Comparison 1 Assessment vs direct admission in early labour, Outcome 7 Maternal satisfaction (score).
Comparison 1 Assessment vs direct admission in early labour, Outcome 8 Apgar score < 7 at 5 minutes.
Comparison 2 Home support vs telephone triage, Outcome 1 Length of labour (hours).
Comparison 2 Home support vs telephone triage, Outcome 2 Rate of caesarean section.
Comparison 2 Home support vs telephone triage, Outcome 3 Rate of instrumental vaginal birth.
Comparison 2 Home support vs telephone triage, Outcome 4 Baby born before arrival at hospital or unplanned home birth.
Comparison 2 Home support vs telephone triage, Outcome 5 Serious maternal morbidity.
Comparison 2 Home support vs telephone triage, Outcome 6 Augmentation of labour.
Comparison 2 Home support vs telephone triage, Outcome 7 Use of epidural or any regional anaesthesia.
Comparison 2 Home support vs telephone triage, Outcome 8 Duration of hospital stay (prolonged postpartum stay in hospital > 5 days).
Comparison 2 Home support vs telephone triage, Outcome 9 Maternal satisfaction (score).
Comparison 2 Home support vs telephone triage, Outcome 10 Postpartum depression (EPDS score ≥ 13).
Comparison 2 Home support vs telephone triage, Outcome 11 Perinatal death.
Comparison 2 Home support vs telephone triage, Outcome 12 Neonatal admission to special care.
Comparison 2 Home support vs telephone triage, Outcome 13 Apgar score < 7 at 5 minutes.
Comparison 2 Home support vs telephone triage, Outcome 14 Exclusive breastfeeding at discharge.
Comparison 2 Home support vs telephone triage, Outcome 15 Exclusive breastfeeding at six weeks.
Comparison 3 One‐to‐one structured care vs usual care, Outcome 1 Rate of caesarean section.
Comparison 3 One‐to‐one structured care vs usual care, Outcome 2 Rate of instrumental vaginal birth.
Comparison 3 One‐to‐one structured care vs usual care, Outcome 3 Serious maternal morbidity.
Comparison 3 One‐to‐one structured care vs usual care, Outcome 4 Use of epidural or any regional anaesthesia.
Comparison 3 One‐to‐one structured care vs usual care, Outcome 5 Perinatal death.
Comparison 3 One‐to‐one structured care vs usual care, Outcome 6 Neonatal admission to special care.
Comparison 3 One‐to‐one structured care vs usual care, Outcome 7 Apgar score < 7 at 5 minutes.
| Assessment compared with direct admission in early labour for improving birth outcomes | ||||||
| Patient or population: healthy pregnant women | ||||||
| Outcomes | Anticipated absolute effects* (95% CI) | Relative effect | № of participants | Quality of the evidence | Comments | |
| Risk with direct admission in early labour | Risk with assessment | |||||
| Length of labour (hours) | The mean length of labour (hours) was 8.3 hours in the intervention group and 13.5 hours in the control group | MD 5.2 lower | ‐ | 209 | ⊕⊕⊝⊝ | This outcome relates to the length of labour in hospital |
| Rate of caesarean section | Study population | RR 0.72 | 209 | ⊕⊝⊝⊝ | ||
| 106 per 1000 | 76 per 1000 | |||||
| Rate of instrumental vaginal birth | Study population | RR 0.86 | 209 | ⊕⊝⊝⊝ | ||
| 356 per 1000 | 306 per 1000 | |||||
| Serious maternal morbidity | Study population | ‐ | (0 RCTs) | ‐ | Serious maternal morbidity was not reported | |
| see comment | See comment | |||||
| Use of epidural or any regional anaesthesia | Study population | RR 0.87 | 209 | ⊕⊕⊝⊝ | ||
| 904 per 1000 | 786 per 1000 | |||||
| Neonatal admission to special care | Study population | |||||
| see comment | See comment | |||||
| Apgar score < 7 at 5 minutes | Study population | RR 2.97 | 209 | ⊕⊝⊝⊝ | ||
| 0 per 1000 | 0 per 1000 | |||||
| *The risk in the intervention group (and its 95% confidence interval) is based on the assumed risk in the comparison group and the relative effect of the intervention (and its 95% CI). | ||||||
| GRADE Working Group grades of evidence | ||||||
| 1 Single trial with design limitations (lack of blinding) (‐1) 2 Single trial with small sample size (‐1) 3 Wide 95% CI crossing the line of no effect and small sample size (‐2) 4 Wide 95% CI crossing the line of no effect, small sample size and low event rate (‐2) | ||||||
| Home support compared with telephone triage for improving birth outcomes | ||||||
| Patient or population: healthy pregnant women | ||||||
| Outcomes | Anticipated absolute effects* (95% CI) | Relative effect | № of participants | Quality of the evidence | Comments | |
| Risk with telephone triage | Risk with home support | |||||
| Length of labour (hours) | The mean length of labour (hours) was 9.66 in the intervention group and 9.37 in the control group | MD 0.29 higher | ‐ | 3474 | ⊕⊕⊝⊝ | Criteria for start of labour were not clearly described |
| Rate of caesarean section | Study population | RR 1.05 | 5170 | ⊕⊕⊕⊝ | ||
| 215 per 1000 | 226 per 1000 | |||||
| Rate of instrumental vaginal birth | Study population | RR 0.95 | 4933 | ⊕⊕⊝⊝ | ||
| 233 per 1000 | 222 per 1000 | |||||
| Serious maternal morbidity | Study population | RR 0.93 | 3474 | ⊕⊕⊝⊝ | ||
| 25 per 1000 | 23 per 1000 | |||||
| Use of epidural or any regional anaesthesia | Study population | RR 0.95 | 5168 | ⊕⊕⊝⊝ | ||
| 505 per 1000 | 480 per 1000 | |||||
| Neonatal admission to special care | Study population | RR 0.84 | 5170 | ⊕⊝⊝⊝ | ||
| 58 per 1000 | 49 per 1000 | |||||
| Apgar score < 7 at 5 minutes | Study population | RR 1.19 | 5170 | ⊕⊕⊝⊝ | ||
| 10 per 1000 | 12 per 1000 | |||||
| *The risk in the intervention group (and its 95% confidence interval) is based on the assumed risk in the comparison group and the relative effect of the intervention (and its 95% CI). | ||||||
| GRADE Working Group grades of evidence | ||||||
| 1 Study with design limitations (lack of blinding) (‐1) 2 Wide 95% CI crossing line of no effect (‐1) 3 All studies contributing data had design limitations (lack of blinding) (‐1) 4 High heterogeneity (I2 69%) (‐1) 5 High heterogeneity (I2 60%) (‐1) 6 High heterogeneity (I2 71%) (‐1) | ||||||
| One‐to‐one structured care compared to usual care for improving birth outcomes | ||||||
| Patient or population: healthy pregnant women | ||||||
| Outcomes | Anticipated absolute effects* (95% CI) | Relative effect | № of participants | Quality of the evidence | Comments | |
| Risk with usual care | Risk with one‐to‐one structured care | |||||
| Length of labour (hours) | ‐ | See comment | ‐ | (0 study) | ‐ | Not reported |
| Rate of caesarean section | Study population | RR 0.93 | 4996 | ⊕⊕⊕⊕ | ||
| 242 per 1000 | 225 per 1000 | |||||
| Rate of instrumental vaginal birth | Study population | RR 0.94 | 4996 | ⊕⊕⊕⊕ | ||
| 145 per 1000 | 136 per 1000 | |||||
| Serious maternal morbidity | Study population | RR 1.13 | 4996 | ⊕⊕⊕⊝ | ||
| 32 per 1000 | 36 per 1000 | |||||
| Use of epidural or any regional anaesthesia | Study population | RR 1.00 | 4996 | ⊕⊕⊕⊕ | ||
| 955 per 1000 | 955 per 1000 | |||||
| Neonatal admission to special care | Study population | RR 0.98 | 4989 | ⊕⊕⊕⊕ | ||
| 69 per 1000 | 67 per 1000 | |||||
| Apgar score < 7 at 5 minutes | Study population | RR 1.07 | 4989 | ⊕⊕⊕⊝ | ||
| 11 per 1000 | 12 per 1000 | |||||
| *The risk in the intervention group (and its 95% confidence interval) is based on the assumed risk in the comparison group and the relative effect of the intervention (and its 95% CI). | ||||||
| GRADE Working Group grades of evidence | ||||||
| 1 Wide 95% CI crossing line of no effect (‐1) | ||||||
| OUTCOME | Intervention (after ) n = 892 | Control (after) n = 1279 | Difference between groups adjusted for baseline differences between clusters with 95% CI | P value |
| Spontaneous vertex delivery | 526 | 785 | ‐3.2 (‐15.1 to 8.7) | 0.6 |
| ARM | 401 | 500 | 5.6 (‐2.2 to 13.4) | 0.1 |
| Electronic fetal monitoring | 557 | 820 | ‐0.1 (‐14.2 to 14.1) | 1.0 |
| Assisted vaginal delivery | 241 | 323 | ||
| Caesarean section | 123 | 168 | ||
| 3rd or 4th degree tear | 7 | 8 | ||
| Epidural | 290 | 441 | 2.1 (‐8.0 to 12.2) | 0.7 |
| Additional analgesia required Opiate | 532 | 649 | 1.5 (‐4.6 to 7.6) | 0.6 |
| Additional analgesia required Epidural and opiate | 177 | 225 | 4.4 (‐2.8 to 11.7) | 0.2 |
| Any maternal complication | 439 | 596 | 3.9 (‐9.4 to 17.2) | 0.5 |
| PP haemorrhage (specify) Intrapartum Post partum | 5 10 | 7 20 | ||
| Labour augmentation with oxytocin | 343 | 484 | 0.3 (‐9.2 to 9.8) | 0.9 |
| Unplanned birth out of hospital | 11 | 11 | ||
| Fetal distress | 166 | 242 | 2.4 (‐6.6 to 11.3) | 0.6 |
| Meconium stained liquor | 133 | 211 | ‐0.5 (‐7.2 to 6.3) | 0.9 |
| Neonatal resuscitation | 106 | 145 | ‐0.9 (‐6.4 to 4.7) | 0.7 |
| Admission to special care | 29 | 60 | ‐0.4 (‐2.6 to 1.8) | 0.7 |
| Apgar score < 7 at 5 minutes | 9 | 13 | ||
| Admission to hospital at first presentation (1 admission) One presentations before admission in labour Two presentations before admission in labour Three or more presentations before admission in labour | 398 305 149 35 | 795 366 88 20 | ‐19.2 (‐29.9 to ‐8.6) | 0.002 |
| Failure to progress 1st stage Failure to progress 2nd stage | 42 142 | 59 119 | ‐3.4 (‐15.3 to 8.6) 15.2 (‐4.5 to 34.9) | 0.5 0.1 |
| OUTCOME | Intervention n =892 Mean | SD | Control n=1279 Mean | SD | Difference between groups adjusted for baseline differences between clusters | P value |
| Duration of labour from admission to labour ward to delivery | 9.6 | 11.29 | 8.06 | 5.41 | 0.75 (‐0.55 to 2.05) | 0.2 |
| Mean number of vaginal examinations | 3.67 | Range 0‐11 | 3.46 | Range 0‐11 | 0.2 (‐0.3 to 0.7) | 0.3 |
| Outcome or subgroup title | No. of studies | No. of participants | Statistical method | Effect size |
| 1 Length of labour (hours) Show forest plot | 1 | 209 | Mean Difference (IV, Fixed, 95% CI) | ‐5.20 [‐7.06, ‐3.34] |
| 2 Rate of caesarean section Show forest plot | 1 | 209 | Risk Ratio (M‐H, Fixed, 95% CI) | 0.72 [0.30, 1.72] |
| 3 Rate of instrumental vaginal birth Show forest plot | 1 | 209 | Risk Ratio (M‐H, Fixed, 95% CI) | 0.86 [0.58, 1.26] |
| 4 Baby born before arrival at hospital or unplanned home birth Show forest plot | 1 | 209 | Risk Ratio (M‐H, Fixed, 95% CI) | 0.0 [0.0, 0.0] |
| 5 Augmentation of labour Show forest plot | 1 | 209 | Risk Ratio (M‐H, Fixed, 95% CI) | 0.57 [0.37, 0.86] |
| 6 Use of epidural or any regional anaesthesia Show forest plot | 1 | 209 | Risk Ratio (M‐H, Fixed, 95% CI) | 0.87 [0.78, 0.98] |
| 7 Maternal satisfaction (score) Show forest plot | 1 | 201 | Mean Difference (IV, Fixed, 95% CI) | 16.0 [7.53, 24.47] |
| 8 Apgar score < 7 at 5 minutes Show forest plot | 1 | 209 | Risk Ratio (M‐H, Fixed, 95% CI) | 2.97 [0.12, 72.12] |
| Outcome or subgroup title | No. of studies | No. of participants | Statistical method | Effect size |
| 1 Length of labour (hours) Show forest plot | 1 | 3474 | Mean Difference (IV, Fixed, 95% CI) | 0.29 [‐0.14, 0.72] |
| 2 Rate of caesarean section Show forest plot | 3 | 5170 | Risk Ratio (M‐H, Fixed, 95% CI) | 1.05 [0.95, 1.17] |
| 3 Rate of instrumental vaginal birth Show forest plot | 2 | 4933 | Risk Ratio (M‐H, Random, 95% CI) | 0.95 [0.79, 1.15] |
| 4 Baby born before arrival at hospital or unplanned home birth Show forest plot | 1 | 3474 | Risk Ratio (M‐H, Fixed, 95% CI) | 1.33 [0.30, 5.95] |
| 5 Serious maternal morbidity Show forest plot | 1 | 3474 | Risk Ratio (M‐H, Fixed, 95% CI) | 0.93 [0.61, 1.42] |
| 6 Augmentation of labour Show forest plot | 2 | 1694 | Risk Ratio (M‐H, Fixed, 95% CI) | 0.96 [0.88, 1.04] |
| 7 Use of epidural or any regional anaesthesia Show forest plot | 3 | 5168 | Risk Ratio (M‐H, Random, 95% CI) | 0.95 [0.87, 1.05] |
| 8 Duration of hospital stay (prolonged postpartum stay in hospital > 5 days) Show forest plot | 1 | 3474 | Risk Ratio (M‐H, Fixed, 95% CI) | 1.15 [0.83, 1.60] |
| 9 Maternal satisfaction (score) Show forest plot | 1 | 423 | Mean Difference (IV, Fixed, 95% CI) | 3.47 [1.00, 5.94] |
| 10 Postpartum depression (EPDS score ≥ 13) Show forest plot | 1 | 2584 | Risk Ratio (M‐H, Fixed, 95% CI) | 1.08 [0.82, 1.42] |
| 11 Perinatal death Show forest plot | 1 | 3474 | Risk Ratio (M‐H, Fixed, 95% CI) | 1.0 [0.42, 2.40] |
| 12 Neonatal admission to special care Show forest plot | 3 | 5170 | Risk Ratio (M‐H, Random, 95% CI) | 0.84 [0.50, 1.42] |
| 13 Apgar score < 7 at 5 minutes Show forest plot | 3 | 5170 | Risk Ratio (M‐H, Fixed, 95% CI) | 1.19 [0.71, 1.99] |
| 14 Exclusive breastfeeding at discharge Show forest plot | 1 | 3474 | Risk Ratio (M‐H, Fixed, 95% CI) | 1.0 [0.96, 1.04] |
| 15 Exclusive breastfeeding at six weeks Show forest plot | 1 | 3474 | Risk Ratio (M‐H, Fixed, 95% CI) | 1.05 [0.97, 1.14] |
| Outcome or subgroup title | No. of studies | No. of participants | Statistical method | Effect size |
| 1 Rate of caesarean section Show forest plot | 1 | 4996 | Risk Ratio (M‐H, Fixed, 95% CI) | 0.93 [0.84, 1.02] |
| 2 Rate of instrumental vaginal birth Show forest plot | 1 | 4996 | Risk Ratio (M‐H, Fixed, 95% CI) | 0.94 [0.82, 1.08] |
| 3 Serious maternal morbidity Show forest plot | 1 | 4996 | Risk Ratio (M‐H, Fixed, 95% CI) | 1.13 [0.84, 1.52] |
| 4 Use of epidural or any regional anaesthesia Show forest plot | 1 | 4996 | Risk Ratio (M‐H, Fixed, 95% CI) | 1.00 [0.99, 1.01] |
| 5 Perinatal death Show forest plot | 1 | 4989 | Risk Ratio (M‐H, Fixed, 95% CI) | 0.0 [0.0, 0.0] |
| 6 Neonatal admission to special care Show forest plot | 1 | 4989 | Risk Ratio (M‐H, Fixed, 95% CI) | 0.98 [0.80, 1.21] |
| 7 Apgar score < 7 at 5 minutes Show forest plot | 1 | 4989 | Risk Ratio (M‐H, Fixed, 95% CI) | 1.07 [0.64, 1.79] |