Antenatal dietary supplementation with myo‐inositol for preventing gestational diabetes
Information
- DOI:
- https://doi.org/10.1002/14651858.CD011507.pub3Copy DOI

- Database:
-
- Cochrane Database of Systematic Reviews
- Version published:
-
- 15 February 2023see what's new
- Type:
-
- Intervention
- Stage:
-
- Review
- Cochrane Editorial Group:
-
Cochrane Pregnancy and Childbirth Group
- Copyright:
-
- Copyright © 2023 The Cochrane Collaboration. Published by John Wiley & Sons, Ltd.
Article metrics
Altmetric:
Cited by:
Authors
Contributions of authors
Luling Lin is guarantor for this review.
Soana Motuhifonua and Luling Lin, with support from Jane Alsweiler and Caroline Crowther, screened the search results, retrieved relevant papers, screened retrieved papers against eligibility criteria, appraised quality of papers, extracted data from papers, wrote to authors of papers for additional information, entered data into RevMan, analysed and interpreted data, wrote the first draft of this updated review, and incorporated feedback into subsequent versions of the review.
Jane Alsweiler provided a neonatal clinical perspective, and contributed to all versions of the review.
Tineke Crawford provided feedback on versions of the review.
Caroline Crowther provided a maternal fetal medicine clinical and methodological perspective and contributed to all versions of the review.
Sources of support
Internal sources
-
The Liggins Institute, The University of Auckland, New Zealand
Provision of support for authors preparing reviews in pregnancy, childbirth and neonatal care.
External sources
-
The Australian and New Zealand Satellite of the Cochrane Pregnancy and Childbirth Review Group, Auckland, New Zealand
Provision of support for authors preparing reviews in pregnancy, childbirth and neonatal care within Australia and New Zealand.
-
The Cochrane Pregnancy and Childbirth Review Group editorial team, Liverpool, UK
Providing full editorial support.
Declarations of interest
Soana K Motuhifonua: reports no conflicts of interest.
Jane Alsweiler: reports working as a health professional as a Neonatal Paediatrician, Auckland District Health Board, but no other conflicts of interest.
Tineke J Crawford: reports no conflicts of interest.
Luling Lin: reports no conflicts of interest.
Caroline A Crowther: reports no conflicts of interest.
Acknowledgements
Portions of the methods section of this protocol are based on a standard template used by the Cochrane Pregnancy and Childbirth Review Group. Outcomes may be similar to other Cochrane reviews for preventing gestational diabetes to provide consistent core outcomes for reviews on this condition.
We acknowledge the support from the Cochrane Pregnancy and Childbirth Review Group editorial team in Liverpool, the Australian and New Zealand Satellite of the Cochrane Pregnancy and Childbirth Review Group, and the support from the Liggins Institute, University of Auckland, Auckland, New Zealand.
As part of the pre‐publication editorial process, this review has been commented on by three peers (an editor and two referees who are external to the editorial team), and the Group's Statistical Adviser. The authors are grateful to the following peer reviewers for their time and comments: Diane Farrar, Bradford Institute for Health Research, Bradford, UK; Shanshan Han PhD, Master of Nutrition and Dietetics, Bachelor of Medicine, Adelaide, Australia.
We thank Julie Brown and Susan Kruse for their contribution as authors in previous versions of this review and Dahineswari Rajamanickam who assisted the initial review authors in preparing the first draft of the protocol.
This project was supported by the National Institute for Health Research (NIHR), via Cochrane Infrastructure funding to Cochrane Pregnancy and Childbirth. The views and opinions expressed therein are those of the authors and do not necessarily reflect those of the Evidence Synthesis Programme, the NIHR, National Health Service (NHS) or the Department of Health and Social Care.
We thank Lindsay Robertson for her help in copy editing the final draft of this review.
Version history
| Published | Title | Stage | Authors | Version |
| 2023 Feb 15 | Antenatal dietary supplementation with myo‐inositol for preventing gestational diabetes | Review | Soana K Motuhifonua, Luling Lin, Jane Alsweiler, Tineke J Crawford, Caroline A Crowther | |
| 2015 Dec 17 | Antenatal dietary supplementation with myo‐inositol in women during pregnancy for preventing gestational diabetes | Review | Tineke J Crawford, Caroline A Crowther, Jane Alsweiler, Julie Brown | |
| 2015 Feb 04 | Myo‐inositol for preventing gestational diabetes | Protocol | Julie Brown, Tineke J Crawford, Jane Alsweiler, Caroline A Crowther | |
Differences between protocol and review
This updated review published in 2021 followed the criteria and outcomes used in the review published in 2015.
For the review published in 2015 there were some differences between published protocol (Brown 2015) as detailed below.
The title was listed as Myo‐inositol for preventing gestational diabetes in our published protocol but we have edited this to Antenatal dietary supplementation with myo‐inositol in women during pregnancy for preventing gestational diabetes in order to allow more clarity around the intervention, population and outcome.
Methods/criteria for considering studies for this review
Types of interventions: we have expanded this section to include myo‐inositol in a combination preparation; this is also reflected in our list of planned subgroup analyses.
Types of participants: we have clarified that participants will be pregnant women rather than pregnant women at risk of gestational diabetes.
We have incorporated the use of GRADE to assess the quality of the body of evidence and have included summary of findings tables; this was not pre‐specified in our published protocol.
We have reported on the outcome need for supplementary insulin therapy; whilst this is not listed in our methods and outcomes section (and was not pre‐specified in our published protocol), we report on this outcome for interest.
Following a consultative process with Professor Caroline Crowther, Dr Julie Brown, Dr Philippa Middleton, Emily Bain, and Tineke Crawford, a core set of primary and secondary outcomes for GDM systematic reviews and core outcomes for GRADE assessment for GDM systematic reviews were drawn up. This has resulted in a number of changes detailed below. These core outcomes were agreed upon after this review had been submitted for peer review.
Additionally, as this is a review on the use of a dietary supplement as an intervention, adverse effects of the intervention has been added as an outcome.
Previous maternal primary outcomes listed in protocol
-
Incidence of gestational diabetes (diagnostic criteria as defined in individual studies)
-
Pre‐eclampsia
-
Caesarean section
Updated maternal primary outcomes used in review
-
Gestational diabetes
-
Hypertensive disorders of pregnancy (including pre‐eclampsia, eclampsia, pregnancy‐induced hypertension)
Previous neonatal primary outcomes listed in protocol
-
Large‐for‐gestational age (birthweight greater than the 90th centile; or as defined by individual study)
-
Perinatal mortality
-
Death or morbidity composite (variously defined by studies, e.g. infant death, shoulder dystocia, bone fracture or nerve palsy)
Updated neonatal primary outcomes used in review
-
Large‐for‐gestational age (birthweight greater than the 90th centile; or as defined by individual study)
-
Perinatal mortality (stillbirth and neonatal mortality)
-
Mortality or morbidity composite (variously defined by studies, e.g. infant death, shoulder dystocia, bone fracture or nerve palsy)
Previous maternal secondary outcomes listed in protocol
-
Postnatal weight retention
-
Body mass index (BMI)
-
Development of type 1 diabetes mellitus
-
Development of type 2 diabetes mellitus
-
Impaired glucose tolerance (as defined in individual studies)
-
Insulin sensitivity (as defined in individual studies)
-
Incidence of pregnancy hyperglycaemia not meeting gestational diabetes diagnostic criteria (diagnostic criteria as defined in individual studies)
-
Induction of labour
-
Perineal trauma
-
Weight gain during pregnancy
-
Adiponectin levels
-
Gestational age at screening for gestational diabetes
-
Postpartum hemorrhage
-
Postpartum infection
-
Placental abruption
-
Polyhydramnios
-
Compliance with treatment
-
Breastfeeding at discharge, six weeks' postpartum
-
Women’s sense of well‐being and quality of life (as defined in individual studies)
-
Women’s view of intervention
Updated maternal secondary outcomes used in review
-
Caesarean section
-
Placental abruption
-
Induction of labour
-
Perineal trauma
-
Postpartum hemorrhage
-
Postpartum infection
-
Weight gain during pregnancy
-
Adherence to the intervention (as defined by trialists)
-
Behaviour changes associated with the intervention (as defined by trialists)
-
Relevant biomarker changes associated with the intervention (e.g. adiponectin, free fatty acids, triglycerides, high density lipoproteins, low density lipoproteins, insulin)
-
Sense of well‐being and quality of life
-
Views of the intervention
-
Breastfeeding (e.g. at discharge, six weeks postpartum)
-
Adverse effects of intervention
Long‐term maternal outcomes
-
Postnatal depression
-
Postnatal weight retention or return to pre‐pregnancy weight
-
Body mass index (BMI)
-
Gestational diabetes in a subsequent pregnancy
-
Type 1 diabetes mellitus
-
Type 2 diabetes mellitus
-
Impaired glucose tolerance
-
Cardiovascular health (as defined by trialists, including blood pressure (BP), hypertension, cardiovascular disease, metabolic syndrome)
Previous neonatal secondary outcomes listed in protocol
-
Macrosomia (as defined in individual studies)
-
Birthweight and z‐score
-
Head circumference and z‐score
-
Length and z‐score
-
Small‐for‐gestational age (as defined in individual studies)
-
Neonatal hypoglycaemia requiring treatment (as defined in individual studies)
-
Gestational age at birth
-
Preterm birth (less than 37 weeks’ gestational age)
-
Shoulder dystocia
-
Bone fracture
-
Nerve palsy
-
Respiratory distress syndrome
-
Hyperbilirubinaemia requiring treatment (as defined in individual studies)
-
Apgar scores (less than seven at five minutes)
-
Ponderal index
-
Fetal adiposity (as defined in individual studies)
-
Neonatal glucose concentration
-
Infant mortality (fetal, neonatal, perinatal)
Updated secondary outcomes used in review
-
Stillbirth
-
Neonatal mortality
-
Gestational age at birth
-
Preterm birth (less than 37 weeks' gestation and less than 32 weeks' gestation)
-
Apgar score (less than seven at five minutes)
-
Macrosomia
-
Small‐for‐gestational age
-
Birthweight and z‐score
-
Head circumference and z‐score
-
Length and z‐score
-
Ponderal index
-
Adiposity
-
Shoulder dystocia
-
Bone fracture
-
Nerve palsy
-
Respiratory distress syndrome
-
Hypoglycaemia (variously defined)
-
Hyperbilirubinaemia
Previous childhood outcomes listed in protocol
-
Weight
-
Height
-
Head circumference
-
Body mass index
-
Adiposity (fat mass/fat free mass (variously measured))
-
Blood pressure
-
Impaired glucose tolerance (as defined in individual studies)
-
Development of type 1 diabetes mellitus
-
Development of type 2 diabetes mellitus
-
Insulin sensitivity
-
Dyslipidaemia or metabolic syndrome
-
Neurodisability
-
Educational achievement
Updated childhood outcomes used in review
-
Weight and z scores
-
Height and z scores
-
Head circumference and z scores
-
Adiposity (e.g. as measured by BMI, skinfold thickness)
-
Blood pressure
-
Type 1 diabetes mellitus
-
Type 2 diabetes mellitus
-
Impaired glucose tolerance
-
Dyslipidaemia or metabolic syndrome
-
Neurodisability
-
Educational achievement
Previous adulthood outcomes listed in protocol
-
Weight
-
Height
-
BMI
-
Adiposity (fat mass/fat‐free mass (variously measured))
-
Blood pressure
-
Impaired glucose tolerance (as defined in individual studies)
-
Development of type 1 diabetes
-
Development of type 2 diabetes
-
Insulin sensitivity (as defined in individual studies)
-
Dyslipidaemia or metabolic syndrome
-
Educational achievement
Updated adulthood outcomes used in review
-
Weight
-
Height
-
Adiposity (e.g. as measured by BMI, skinfold thickness)
-
Cardiovascular health (as defined by trialists, including BP, hypertension, cardiovascular disease, metabolic syndrome)
-
Type 1 diabetes mellitus
-
Type 2 diabetes mellitus
-
Impaired glucose tolerance
-
Dyslipidaemia or metabolic syndrome
-
Employment, education and social status/achievement
Previous health services cost outcomes listed in protocol
-
Number of hospital visits or health professional visits (e.g. midwife, obstetrician, physician, dietitian)
-
Antenatal visits for mother
-
Direct costs to families in relation to the management provided
-
Length of postnatal stay (mother)
-
Admission to neonatal ward/ neonatal intensive care unit
-
Length of postnatal stay (baby)
-
Cost of maternal care
-
Cost of offspring care
Updated health services cost outcomes used in review
-
Number of hospital or health professional visits (e.g. midwife, obstetrician, physician, dietitian, diabetic nurse)
-
Number of antenatal visits or admissions
-
Length of antenatal stay
-
Neonatal intensive care unit admission
-
Length of postnatal stay (mother)
-
Length of postnatal stay (baby)
-
Costs to families associated with the management provided
-
Costs associated with the intervention
-
Cost of maternal care
-
Cost of offspring care
Previous GRADE outcomes listed in protocol
-
Incidence of gestational diabetes (diagnostic criteria as defined in individual studies)
-
Pre‐eclampsia
-
Mode of birth
-
Large‐for‐gestational age (birthweight greater than the 90th centile; or as defined by individual study)
-
Perinatal mortality
-
Fetal adiposity
-
Impaired glucose tolerance as child/adult
Updated GRADE outcomes used in review
Maternal
-
Diagnosis of gestational diabetes
-
Gestational weight gain
-
Hypertensive disorders of pregnancy (including pre‐eclampsia, eclampsia, pregnancy‐induced hypertension)
-
Caesarean Section
-
Perineal trauma
-
Postnatal depression
-
Development of subsequent type 2 diabetes mellitus
Offspring (infant, child, adult)
-
Large‐for‐gestational age
-
Perinatal mortality (stillbirth and neonatal mortality)
-
Composite of serious neonatal outcomes
-
Neonatal hypoglycaemia (variously defined)
-
Offspring adiposity (e.g. as measured by BMI, skinfold thickness)
-
Offspring diabetes
-
Neurosensory disability
Keywords
MeSH
Medical Subject Headings (MeSH) Keywords
Medical Subject Headings Check Words
Adult; Female; Humans; Pregnancy;
PICOs

Study flow diagram for updated review
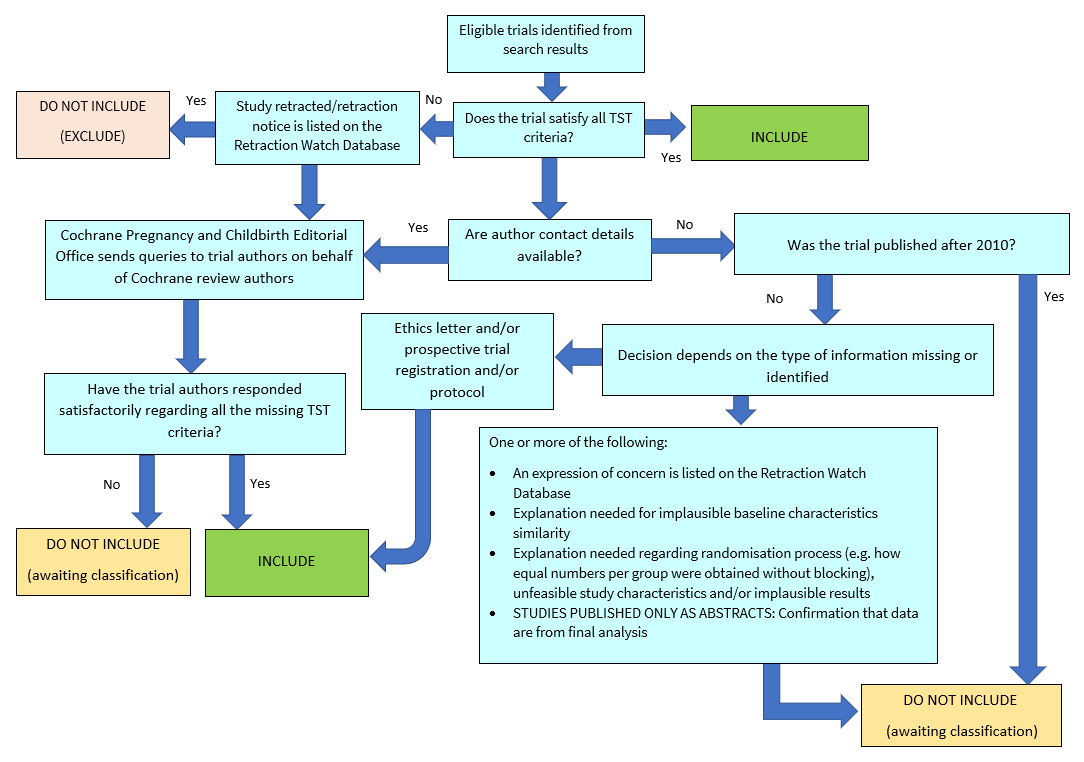
Applying the trustworthiness screening tool criteria. TST: Trustworthiness Screening Tool.

Risk of bias graph: review authors' judgements about each risk of bias item presented as percentages across all included studies

Risk of bias summary: review authors' judgements about each risk of bias item for each included study

Comparison 1: Myo‐inositol versus control, Outcome 1: Gestational diabetes mellitus

Comparison 1: Myo‐inositol versus control, Outcome 2: Fasting OGTT

Comparison 1: Myo‐inositol versus control, Outcome 3: One hour OGTT

Comparison 1: Myo‐inositol versus control, Outcome 4: Two hour OGTT

Comparison 1: Myo‐inositol versus control, Outcome 5: Hypertensive disorders of pregnancy

Comparison 1: Myo‐inositol versus control, Outcome 6: Large‐for‐gestational‐age

Comparison 1: Myo‐inositol versus control, Outcome 7: Caesarean section

Comparison 1: Myo‐inositol versus control, Outcome 8: Weight gain during pregnancy

Comparison 1: Myo‐inositol versus control, Outcome 9: Relevant biomarker changes associated with the intervention

Comparison 1: Myo‐inositol versus control, Outcome 10: Perineal trauma

Comparison 1: Myo‐inositol versus control, Outcome 11: Postpartum haemorrhage

Comparison 1: Myo‐inositol versus control, Outcome 12: Adherence to intervention

Comparison 1: Myo‐inositol versus control, Outcome 13: Supplementary insulin

Comparison 1: Myo‐inositol versus control, Outcome 14: Gestational age at birth

Comparison 1: Myo‐inositol versus control, Outcome 15: Preterm birth (less than 37 weeks' gestation)

Comparison 1: Myo‐inositol versus control, Outcome 16: Macrosomia

Comparison 1: Myo‐inositol versus control, Outcome 17: Birthweight

Comparison 1: Myo‐inositol versus control, Outcome 18: Shoulder dystocia

Comparison 1: Myo‐inositol versus control, Outcome 19: Respiratory distress syndrome

Comparison 1: Myo‐inositol versus control, Outcome 20: Neonatal hypoglycaemia

Comparison 1: Myo‐inositol versus control, Outcome 21: Small‐for‐gestational‐age

Comparison 1: Myo‐inositol versus control, Outcome 22: Neonatal hyperbilirubinaemia

Comparison 1: Myo‐inositol versus control, Outcome 23: Admission to neonatal intensive care unit or special care baby unit
| Antenatal supplementation with myo‐inositol for preventing gestational diabetes | ||||||
| Patient or population: pregnant women (women with pre‐existing type 1 or type 2 diabetes are NOT included) Setting: hospital | ||||||
| Outcomes | Anticipated absolute effects* (95% CI) | Relative effect | № of participants | Certainty of the evidence | Comments | |
|---|---|---|---|---|---|---|
| Risk with control | Risk with myo‐inositol | |||||
| Gestational diabetes mellitus | Study population | RR 0.53 | 1140 | ⊕⊝⊝⊝ Very lowa,b,c | GDM diagnosed using IADPSG 2010 criteria
Random‐effects model | |
| 217 per 1000 | 115 per 1,000 (67 to 196) | |||||
| Weight gain during pregnancy | Comparator | The mean weight gain during pregnancy in the intervention group was 0.25 kg lower (1.26 kg fewer to 0.76 kg more) | ‐ | 831 | ⊕⊝⊝⊝ |
Random‐effects model |
| Hypertensive disorders of pregnancy | Study population | RR 0.34 | 1052 | ⊕⊕⊝⊝ Lowc,f | Random‐effects model | |
| 86 per 1,000 | 29 per 1,000 | |||||
| Caesarean section | Study population | RR 0.91 | 829 | ⊕⊕⊝⊝ |
| |
| 430 per 1,000 | 391 per 1,000 | |||||
| Perineal trauma | Study population | RR 4.00 | 234 (1 RCT) | ⊕⊝⊝⊝ |
| |
| 9 per 1,000 | 34 per 1,000 (4 to 301) | |||||
| Postnatal depression | See comments | Not estimable | (0 studies) |
| No data reported this outcome in any of the included studies | |
|
|
| |||||
| Development of subsequent type 2 diabetes mellitus | See comments | Not estimable | (0 studies) |
| No data reported this outcome in any of the included studies | |
|
|
| |||||
| *The risk in the intervention group (and its 95% confidence interval) is based on the assumed risk in the comparison group and the relative effect of the intervention (and its 95% CI). | ||||||
| GRADE Working Group grades of evidence | ||||||
| a. Downgraded (‐1) for serious limitations in study design: due to unclear risk of selection bias in two of the six included studies; five of the six included studies were at high risk of performance bias; two of the six included studies were at high risk of detection bias; one study was at high risk of attrition bias. b. Downgraded (‐1) for serious inconsistency; considerable heterogeneity, possible due to different study populations. c. Downgraded (‐1) for serious indirectness; only one of the included studies was conducted outside Italy, and the Italian studies only included white women, the generalisability of findings is limited. d. Downgraded (‐1) for serious limitations in study design: all studies were at high risk of performance bias; one study was at high risk of detection bias. e. Downgraded (‐1) for serious imprecision; evidence of imprecision with wide confidence intervals crossing the line of no effect. f. Downgraded (‐1) for serious limitations in study design: all studies were at high risk of performance bias; two studies were at high risk of detection bias. g. Downgraded (‐1) for serious limitations in study design: all studies were at high risk of performance bias. One study was at high risk of detection bias, and insufficient evidence to judge detection bias and subsequent judgement of unclear risk of bias. Due to insufficient evidence to judge allocation concealment in two studies and subsequent judgement of unclear risk of bias. Due to insufficient evidence to judge attrition bias in two studies and subsequent judgement of unclear risk of bias. h. Downgraded (‐1) for serious limitations in study design: the study was at high risk of performance bias and detection bias for lack of blinding. i. Downgraded (‐1) for serious Indirectness: only one study conducted in Ireland reported this outcome. j. Downgraded (‐1) for serious imprecision: wide confidence intervals with very low event rates. | ||||||
| Antenatal supplementation with myo‐inositol for preventing gestational diabetes | ||||||
| Patient or population: infants of pregnant women Setting: hospital | ||||||
| Outcomes | Anticipated absolute effects* (95% CI) | Relative effect | № of participants | Certainty of the evidence | Comments | |
|---|---|---|---|---|---|---|
| Risk with control | Risk with myo‐inositol | |||||
| Large‐for‐gestational age | Study population | RR 1.40 | 234 | ⊕⊕⊝⊝ |
| |
| 85 per 1000 | 120 per 1000 (56 to 258) | |||||
| Perinatal mortality (stillbirth and neonatal mortality) | See comments | Not estimable | (0 studies) |
| No data reported this outcome in any of the included studies | |
|
|
| |||||
| Composite of serious neonatal outcomes | See comments | not estimable | (0 studies) |
| No data reported this outcome in any of the included studies | |
|
|
| |||||
| Neonatal hypoglycaemia | Study population | RR 3.07 | 671 | ⊕⊝⊝⊝ |
| |
| 9 per 1,000 | 27 per 1000 | |||||
| Adiposity | See comments | not estimable | (0 studies) |
| No data reported this outcome in any of the included studies | |
|
|
| |||||
| Diabetes | See comments | not estimable | (0 studies) |
| No data reported this outcome in any of the included studies | |
|
|
| |||||
| Neurosensory disability | See comments | not estimable | (0 studies) |
| No data reported this outcome in any of the included studies | |
|
|
| |||||
| *The risk in the intervention group (and its 95% confidence interval) is based on the assumed risk in the comparison group and the relative effect of the intervention (and its 95% CI). | ||||||
| GRADE Working Group grades of evidence | ||||||
| a. Downgraded (‐1) for serious limitations in study design: the study was at high risk of performance bias and detection bias for lack of blinding. b. Downgraded (‐1) for serious indirectness: only one study conducted in Ireland reported this outcome. c. Downgraded (‐1) for serious limitations in study design: all studies were at high risk of performance bias; one study was at high risk of detection bias. d. Downgraded (‐1) for serious indirectness: only one of the included studies was conducted outside Italy, and the Italian studies only included Caucasian women. Thus, the generalisability of findings is limited. e. Downgraded (‐1) for serious imprecision: evidence of imprecision with wide confidence intervals crossing the line of no effect. | ||||||
| Outcome or subgroup title | No. of studies | No. of participants | Statistical method | Effect size |
| 1.1 Gestational diabetes mellitus Show forest plot | 6 | 1140 | Risk Ratio (M‐H, Random, 95% CI) | 0.53 [0.31, 0.90] |
| 1.2 Fasting OGTT Show forest plot | 5 | 1071 | Mean Difference (IV, Fixed, 95% CI) | ‐0.14 [‐0.21, ‐0.07] |
| 1.3 One hour OGTT Show forest plot | 5 | 1071 | Mean Difference (IV, Fixed, 95% CI) | ‐0.34 [‐0.55, ‐0.14] |
| 1.4 Two hour OGTT Show forest plot | 5 | 1071 | Mean Difference (IV, Random, 95% CI) | ‐0.38 [‐0.77, 0.01] |
| 1.5 Hypertensive disorders of pregnancy Show forest plot | 5 | 1052 | Risk Ratio (M‐H, Random, 95% CI) | 0.34 [0.19, 0.61] |
| 1.6 Large‐for‐gestational‐age Show forest plot | 1 | 234 | Risk Ratio (M‐H, Fixed, 95% CI) | 1.40 [0.65, 3.02] |
| 1.7 Caesarean section Show forest plot | 4 | 829 | Risk Ratio (M‐H, Fixed, 95% CI) | 0.91 [0.77, 1.07] |
| 1.8 Weight gain during pregnancy Show forest plot | 4 | 831 | Mean Difference (IV, Random, 95% CI) | ‐0.25 [‐1.26, 0.76] |
| 1.9 Relevant biomarker changes associated with the intervention Show forest plot | 3 | Mean Difference (IV, Fixed, 95% CI) | Subtotals only | |
| 1.9.1 Total cholesterol | 3 | 340 | Mean Difference (IV, Fixed, 95% CI) | ‐29.57 [‐32.80, ‐26.33] |
| 1.9.2 Low density lipoprotein | 3 | 340 | Mean Difference (IV, Fixed, 95% CI) | ‐22.43 [‐25.86, ‐19.00] |
| 1.9.3 High density lipoprotein | 3 | 340 | Mean Difference (IV, Fixed, 95% CI) | ‐1.46 [‐2.72, ‐0.20] |
| 1.9.4 Triglycerides | 3 | 340 | Mean Difference (IV, Fixed, 95% CI) | ‐24.92 [‐27.82, ‐22.02] |
| 1.10 Perineal trauma Show forest plot | 1 | 234 | Risk Ratio (M‐H, Fixed, 95% CI) | 4.00 [0.45, 35.25] |
| 1.11 Postpartum haemorrhage Show forest plot | 1 | 234 | Risk Ratio (M‐H, Fixed, 95% CI) | 0.67 [0.31, 1.42] |
| 1.12 Adherence to intervention Show forest plot | 1 | 240 | Risk Ratio (M‐H, Fixed, 95% CI) | 0.99 [0.84, 1.16] |
| 1.13 Supplementary insulin Show forest plot | 3 | 595 | Risk Ratio (M‐H, Fixed, 95% CI) | 0.50 [0.17, 1.52] |
| 1.14 Gestational age at birth Show forest plot | 4 | 829 | Mean Difference (IV, Random, 95% CI) | 3.69 [‐1.48, 8.86] |
| 1.15 Preterm birth (less than 37 weeks' gestation) Show forest plot | 4 | 829 | Risk Ratio (M‐H, Fixed, 95% CI) | 0.35 [0.17, 0.70] |
| 1.16 Macrosomia Show forest plot | 4 | 829 | Risk Ratio (M‐H, Random, 95% CI) | 0.55 [0.16, 1.96] |
| 1.17 Birthweight Show forest plot | 4 | 829 | Mean Difference (IV, Random, 95% CI) | ‐8.65 [‐140.36, 123.07] |
| 1.18 Shoulder dystocia Show forest plot | 4 | 829 | Risk Ratio (M‐H, Random, 95% CI) | 1.43 [0.15, 13.54] |
| 1.19 Respiratory distress syndrome Show forest plot | 2 | 431 | Risk Ratio (M‐H, Fixed, 95% CI) | 1.49 [0.25, 8.85] |
| 1.20 Neonatal hypoglycaemia Show forest plot | 4 | 671 | Risk Ratio (M‐H, Fixed, 95% CI) | 3.07 [0.90, 10.52] |
| 1.21 Small‐for‐gestational‐age Show forest plot | 1 | 234 | Risk Ratio (M‐H, Fixed, 95% CI) | 2.33 [0.62, 8.80] |
| 1.22 Neonatal hyperbilirubinaemia Show forest plot | 1 | 234 | Risk Ratio (M‐H, Fixed, 95% CI) | 0.25 [0.05, 1.15] |
| 1.23 Admission to neonatal intensive care unit or special care baby unit Show forest plot | 2 | 435 | Risk Ratio (M‐H, Fixed, 95% CI) | 0.40 [0.14, 1.18] |