Intervensi digital peribadi untuk mengurangkan penggunaan alkohol berbahaya dalam populasi kediaman masyarakat
Appendices
Appendix 1. MEDLINE (Ovid) search strategy
| # | Searches |
| 1 | exp Alcohol‐Related Disorders/ |
| 2 | exp Alcohol Drinking/ |
| 3 | (alcohol$ adj2 (drink$ or intoxicat$ or use$ or abus$ or misus$ or risk$ or consum$ or withdraw$ or detox$ or treat$ or therap$ or excess$ or reduc$ or cessation or intervention$)).tw. |
| 4 | (drink$ adj2 (excess or heavy or heavily or harm or harmful or hazard$ or binge or harmful or problem$)).tw. |
| 5 | ("alcohol use" or alcoholic$).tw. |
| 6 | or/1‐5 |
| 7 | Internet/ |
| 8 | Blogging/ |
| 9 | Social Media/ |
| 10 | Computers/ |
| 11 | exp Microcomputers/ |
| 12 | Minicomputers/ |
| 13 | Therapy, Computer‐Assisted/ |
| 14 | Computer‐Assisted Instruction/ |
| 15 | exp Cellular Phone/ |
| 16 | Electronic Mail/ |
| 17 | ((email$ or e‐mail$ or electronic mail$ or text messag$ or SMS or MMS or phone? or cellphone? or cell‐phone? or smartphone? or smart‐phone? or digital tablet? or pda or personal digital assistant? or social media or social networking or facebook or twitter or skyp$ or app?) adj3 (deliver$ or generat$ or based or provid$ or facilitat$ or support$ or treatment? or therap$ or intervention? or program$ or feedback)).ti,ab. |
| 18 | ((Internet$ or electronic$ or digital$ or technolog$ or online or on‐line or computer$ or laptop? or software or web$ or weblog$ or blog$ or CD? or CD‐ROM?) adj3 (deliver$ or generat$ or based or provid$ or facilitat$ or support$ or treatment? or therap$ or intervention? or program$ or feedback)).ti,ab. |
| 19 | (e‐BI or e‐SBI or ehealth or e‐health or electronic health or mhealth or m‐health or mobile health or virtual health or digital health or technological aid?).ti,ab. |
| 20 | or/7‐19 |
| 21 | 6 and 20 |
Appendix 2. Cochrane Library search strategy
CDSR, DARE, CENTRAL, HTA, NHS‐EED
#1MeSH descriptor: [Alcohol‐Related Disorders] explode all trees
#2MeSH descriptor: [Alcohol Drinking] explode all trees
#3(alcohol* near/2 (drink* or intoxicat* or use* or abus* or misus* or risk* or consum* or withdraw* or detox* or treat* or therap* or excess* or reduc* or cessation or intervention*)):ti,ab
#4(drink* near/2 (excess or heavy or heavily or harm or harmful or hazard* or binge or harmful or problem*)):ti,ab
#5("alcohol use" or alcoholic*):ti,ab
#6#1 or #2 or #3 or #4 or #5
#7MeSH descriptor: [Internet] explode all trees
#8MeSH descriptor: [Computers] this term only
#9MeSH descriptor: [Microcomputers] explode all trees
#10MeSH descriptor: [Minicomputers] this term only
#11MeSH descriptor: [Therapy, Computer‐Assisted] this term only
#12MeSH descriptor: [Computer‐Assisted Instruction] this term only
#13MeSH descriptor: [Cellular Phone] explode all trees
#14MeSH descriptor: [Electronic Mail] this term only
#15((email* or e‐mail* or electronic mail* or text messag* or SMS or MMS or phone? or cellphone? or cell‐phone? or smartphone? or smart‐phone? or digital tablet? or pda or personal digital assistant? or social media or social networking or facebook or twitter or skyp* or app?) near/3 (deliver* or generat* or based or provid* or facilitat* or support* or treatment? or therap* or intervention? or program* or feedback)):ti,ab
#16((Internet* or electronic* or digital* or technolog* or online or on‐line or computer* or laptop? or software or web* or weblog* or blog* or CD? or CD‐ROM?) near/3 (deliver* or generat* or based or provid* or facilitat* or support* or treatment? or therap* or intervention? or program* or feedback)):ti,ab
#17(e‐BI or e‐SBI or ehealth or e‐health or electronic health or mhealth or m‐health or mobile health or virtual health or digital health or technological aid?) .ti,ab.
#18#7 or #8 or #9 or #10 or #11 or #12 or #13 or #14 or #15 or #16 or #17
#19#6 and #18
Appendix 3. PsycINFO (OVID) search strategy
| # | Searches |
| 1 | exp alcohol intoxication/ |
| 2 | exp alcohol abuse/ |
| 3 | alcohol rehabilitation/ |
| 4 | alcohol drinking patterns/ |
| 5 | (alcohol$ adj2 (drink$ or intoxicat$ or use$ or abus$ or misus$ or risk$ or consum$ or withdraw$ or detox$ or treat$ or therap$ or excess$ or reduc$ or cessation or intervention$)).ti,ab. |
| 6 | (drink$ adj2 (excess or heavy or heavily or harm or harmful or hazard$ or binge or harmful or problem$)).ti,ab. |
| 7 | ("alcohol use" or alcoholic$).ti,ab. |
| 8 | or/1‐7 |
| 9 | computer assisted therapy/ |
| 10 | computer assisted instruction/ |
| 11 | websites/ |
| 12 | internet/ |
| 13 | computer mediated communication/ |
| 14 | exp social media/ |
| 15 | exp mobile devices/ |
| 16 | ((email$ or e‐mail$ or electronic mail$ or text messag$ or SMS or MMS or phone? or cellphone? or cell‐phone? or smartphone? or smart‐phone? or digital tablet? or pda or personal digital assistant? or social media or social networking or facebook or twitter or skyp$ or app?) adj3 (deliver$ or generat$ or based or provid$ or facilitat$ or support$ or treatment? or therap$ or intervention? or program$ or feedback)).ti,ab,id. |
| 17 | ((Internet$ or electronic$ or digital$ or technolog$ or online or on‐line or computer$ or laptop? or software or web$ or weblog$ or blog$ or CD? or CD‐ROM?) adj3 (deliver$ or generat$ or based or provid$ or facilitat$ or support$ or treatment? or therap$ or intervention? or program$ or feedback)).ti,ab,id. |
| 18 | (e‐BI or e‐SBI or ehealth or e‐health or electronic health or mhealth or m‐health or mobile health or virtual health or digital health or technological aid?).ti,ab,id. |
| 19 | or/9‐18 |
| 20 | 8 and 19 |
| 21 | (control$ or random$).tw. |
| 22 | exp Treatment/ |
| 23 | 21 or 22 |
| 24 | 20 and 23 |
Appendix 4. CINAHL (EBSCO) search strategy
S18 S13 AND S17
S17 S14 OR S15 OR S16
S16 TX random*
S15 (MH "Experimental Studies")
S14 (MH "Treatment Outcomes+")
S13 S5 AND S12
S12 S6 OR S7 OR S8 OR S9 OR S10 OR S11
S11 TI (e‐BI or e‐SBI or ehealth or e‐health or electronic health or mhealth or m‐health or mobile health or virtual health or digital health or technological aid*) OR AB (e‐BI or e‐SBI or ehealth or e‐health or electronic health or mhealth or m‐health or mobile health or virtual health or digital health or technological aid*)
S10 TI ((Internet* or electronic* or digital* or technolog* or online or on‐line or computer* or laptop# or software or web* or weblog* or blog* or CD# or CD‐ROM#) N3 (deliver* or generat* or based or provid* or facilitat* or support* or treatment# or therap* or intervention# or program* or feedback)) OR AB ((Internet* or electronic* or digital* or technolog* or online or on‐line or computer* or laptop# or software or web* or weblog* or blog* or CD# or CD‐ROM#) N3 (deliver* or generat* or based or provid* or facilitat* or support* or treatment# or therap* or intervention# or program* or feedback))TI ((Internet* or electronic* or digital* or technolog* or online or on‐line or computer* or laptop# or software or web* or weblog* or blog* or CD# or CD‐ROM#) N3 (deliver* or generat* or based or provid* or facilitat* or support* or treatment# or therap* or intervention# or program* or feedback)) OR AB ((Internet* or electronic* or digital* or technolog* or online or on‐line or computer* or laptop# or software or web* or weblog* or blog* or CD# or CD‐ROM#) N3 (deliver* or generat* or based or provid$ or facilitat$ or support$ or treatment? or therap$ or intervention? or program$ or feedback)
S9 TI ((email* or e‐mail* or electronic mail* or text messag* or SMS or MMS or phone# or cellphone# or cell‐phone# or smartphone# or smart‐phone# or digital tablet# or pda or personal digital assistant# or social media or social networking or facebook or twitter or skyp* or app#) N3 (deliver* or generat* or based or provid* or facilitat* or support* or treatment# or therap* or intervention# or program* or feedback)) OR AB ((email* or e‐mail* or electronic mail* or text messag* or SMS or MMS or phone# or cellphone# or cell‐phone# or smartphone# or smart‐phone# or digital tablet# or pda or personal digital assistant# or social media or social networking or facebook or twitter or skyp* or app#) N3 (deliver* or generat* or based or provid* or facilitat* or support* or treatment# or therap* or intervention# or program* or feedback))
S8 (MH "Computers, Portable+")
S7 (MH "Text Messaging") OR (MH "Wireless Communications") OR (MH "Electronic Mail") OR (MH "Instant Messaging") OR (MH "Internet+")
S6 (MH "Computer Assisted Instruction") OR (MH "Therapy, Computer Assisted")
S5 S1 or S2 or S3 or S4
S4 TI ("alcohol use*" OR alcoholic*) OR AB ("alcohol use*" OR alcoholic*)
S3 TI (drink* N2 (excess or heavy or heavily or harm or harmful or hazard* or binge or problem*)) OR AB (drink* N2 (excess or heavy or heavily or harm or harmful or hazard* or binge or problem*))
S2 TI (alcohol* N2 (drink* or intoxicat* or use* or abus* or misus* or risk* or consum* or withdraw* or detox* or treat* or therap* or excess* or reduc* or cessation or intervention*)) OR AB (alcohol* N2 (drink* or intoxicat* or use* or abus* or misus* or risk* or consum* or withdraw* or detox* or treat* or therap* or excess* or reduc* or cessation or intervention*))
S1 (MH "Alcohol‐Related Disorders") OR (MH "Alcohol Abuse") OR (MH "Alcoholic Intoxication") OR (MH "Alcoholism") OR (MH "Alcohol Drinking") OR (MH "Alcohol Rehabilitation Programs")
Appendix 5. ERIC (ProQuest) search strategy
S17 S6 AND S15
S16 S6 AND S15
S15 S7 OR S8 OR S9 OR S12 OR S13 OR S14
S14 AB,TI(e‐BI or e‐SBI or ehealth or e‐health or electronic health or mhealth or m‐health or mobile health or virtual health or digital health or technological aid?)
S13 AB,TI(email* or e‐mail* or electronic mail* or text messag* or SMS or MMS or phone[*2] or cellphone[*2] or cell‐phone[*2] or smartphone[*2] or smart‐phone[*2] or digital tablet[*2] or pda or personal digital assistant[*2] or social media or social networking or facebook or twitter or skyp* or app[*2])
S12 AB,TI((Internet* or electronic* or digital* or technolog* or online or on‐line or computer* or laptop[*2] or software or web* or weblog* or blog* or CD[*2] or CD‐ROM[*2]) NEAR/3 (deliver* or generat* or based or provid* or facilitat* or support* or treatment[*2] or therap* or intervention# or program* or feedback))
S9 SU.EXACT.EXPLODE("Computers") OR SU.EXACT("Computer Assisted Instruction") OR SU.EXACT("Electronic Mail") OR SU.EXACT("Handheld Devices") OR SU.EXACT("Discussion Groups") OR SU.EXACT("Web Based Instruction")
S8 SU.EXACT("Web 2.0 Technologies")
S7 SU.EXACT("Internet") OR SU.EXACT("Web Based Instruction")
S6 S1 OR S2 OR S4 OR S5
S5 AB,TI("alcohol use*" or alcoholic*)
S4 AB,TI(drink* NEAR/2 (excess or heavy or heavily or harm or harmful or hazard* or binge or harmful or problem*))
S2 AB,TI(alcohol* NEAR/2 (drink* or intoxicat* or use* or abus* or misus* or risk* or consum* or withdraw* or detox* or treat* or therap* or excess* or reduc* or cessation or intervention*))
S1 SU.EXACT.EXPLODE("Drinking")
Appendix 6. Web of Knowledge search strategy
Science Citation Index, Social Science Citation Index, Conference Proceedings Citation Index
#13 #12 AND #11
#12 TS=(intervention* or trial* or randomi* or controlled or experiment* or treatment* or outcome* or therap*)
#11 #9 NOT #10
#10 TS=(rat or rats or animal* or mouse or mice)
#9 #8 AND #4
#8 #7 OR #6 OR #5
#7 TS=(e‐BI or e‐SBI or ehealth or e‐health or “electronic health” or mhealth or m‐health or “mobile health” or “virtual health” or “digital health” or “technological aid$”)
#6 TS=((Internet* or electronic* or digital* or technolog* or online or on‐line or computer* or laptop$ or software or web* or weblog* or blog* or CD$ or CD‐ROM$) NEAR/3 (deliver* or generat* or based or provid* or facilitat* or support* or treatment$ or therap* or intervention$ or program* or feedback))
#5 TS=((email* or e‐mail* or “electronic mail*” or “text messag*” or SMS or MMS or phone$ or cellphone$ or cell‐phone$ or smartphone$ or smart‐phone$ or “digital tablet$” or pda or “personal digital assistant$” or “social media” or “social networking” or facebook or twitter or skyp* or app$) NEAR/3 (deliver* or generat* or based or provid* or facilitat* or support* or treatment$ or therap* or intervention$ or program* or feedback))
#4 #3 OR #2 OR #1
#3 TS=("alcohol use*" or alcoholic*)
#2 TS=((drink*) NEAR/2 (excess or heavy or heavily or harm or harmful or hazard* or binge or harmful or problem*))
#1 TS=((alcohol*) NEAR/2 (drink* or intoxicat* or use* or abus* or misus* or risk* or consum* or withdraw* or detox* or treat* or therap* or excess* or reduc* or cessation or intervention*))
Appendix 7. Criteria for 'Risk of bias' assessment in RCTs, CCTs and prospective observational studies
The interventions assessed were automated, and so blinding of providers and outcome assessors was not relevant (since these roles were provided by the computer).
| Item | Judgment | Description |
| 1. Random sequence generation (selection bias) | Low risk | The investigators describe a random component in the sequence generation process such as: random number table, computer random number generator, coin tossing, shuffling cards or envelopes, throwing dice, drawing of lots, minimisation; OR randomisation took place automatically as part of digital screening, allocation and intervention. |
| High risk | The investigators describe a non‐random component in the sequence generation process such as: odd or even date of birth; date (or day) of admission; hospital or clinic record number; alternation; judgement of the clinician; results of a laboratory test or a series of tests; availability of the intervention. | |
| Unclear risk | Insufficient information to permit judgement of low or high risk. | |
| 2. Allocation concealment (selection bias) | Low risk | Investigators enrolling participants could not foresee assignment because one of the following, or an equivalent method, was used to conceal allocation: central allocation (including telephone, web‐based, and pharmacy‐controlled, randomisation); sequentially numbered, opaque, sealed envelopes. Alternatively, allocation took place automatically as part of digital screening, allocation and intervention. |
| High risk | Investigators enrolling participants could possibly foresee assignments because one of the following method was used: open random allocation schedule (e.g. a list of random numbers); assignment envelopes without appropriate safeguards (e.g. if envelopes were unsealed or nonopaque or not sequentially numbered); alternation or rotation; date of birth; case record number; any other explicitly unconcealed procedure. | |
| Unclear risk | Insufficient information to permit judgement of low or high risk. | |
| 3. Blinding of providers (performance bias) Subjective outcomes | Low risk | Blinding of providers and unlikely that the blinding could have been broken. Trials were assigned low risk of bias if the administration of the intervention was automated. |
| High risk | No blinding or incomplete blinding, and the outcome is likely to be influenced by lack of blinding; Blinding of key study participants and personnel attempted, but likely that the blinding could have been broken, and the outcome is likely to be influenced by lack of blinding. | |
| Unclear risk | Insufficient information to permit judgement of low or high risk. | |
| 4. Blinding of participants (performance bias) Subjective outcomes | Low risk | Blinding of participants and unlikely that the blinding could have been broken. |
| High risk | No blinding or incomplete blinding, and the outcome is likely to be influenced by lack of blinding; Blinding of key study participants and personnel attempted, but likely that the blinding could have been broken, and the outcome is likely to be influenced by lack of blinding. Studies received "high risk" as default unless there was an explicit attempt to blind participants. | |
| Unclear risk | Insufficient information to permit judgement of low or high risk. | |
| 5. Blinding of outcome assessors (detection bias) | Low risk | Blinding of outcome assessors and unlikely that the blinding could have been broken. Trials were assigned low risk of bias if outcome collection was automated. |
| High risk | No blinding or incomplete blinding | |
| Unclear risk | Outcome collection was not automated and insufficient information is provided to assess blinding. | |
| 6. Incomplete outcome data (attrition bias) For all outcomes except retention in treatment or drop out | Low risk | No missing outcome data; Reasons for missing outcome data unlikely to be related to true outcome (for survival data, censoring unlikely to be introducing bias); Missing outcome data balanced in numbers across intervention groups, with similar reasons for missing data across groups; For dichotomous outcome data, the proportion of missing outcomes compared with observed event risk not enough to have a clinically relevant impact on the intervention effect estimate; For continuous outcome data, plausible effect size (difference in means or standardised difference in means) among missing outcomes not enough to have a clinically relevant impact on observed effect size; Missing data have been imputed using appropriate methods All randomised patients are reported/analysed in the group they were allocated to by randomisation irrespective of non‐compliance and co‐interventions (intention‐to‐treat). |
| High risk | Reason for missing outcome data likely to be related to true outcome, with either imbalance in numbers or reasons for missing data across intervention groups; For dichotomous outcome data, the proportion of missing outcomes compared with observed event risk enough to induce clinically relevant bias in intervention effect estimate; For continuous outcome data, plausible effect size (difference in means or standardised difference in means) among missing outcomes enough to induce clinically relevant bias in observed effect size; ‘As‐treated’ analysis done with substantial departure of the intervention received from that assigned at randomisation. | |
| Unclear risk | Insufficient information to permit judgement of low or high risk (e.g. number randomised not stated, no reasons for missing data provided; number of drop out not reported for each group). | |
| 7. Selective reporting (reporting bias) | Low risk | The study protocol is available and all of the study’s pre‐specified (primary and secondary) outcomes that are of interest in the review have been reported in the pre‐specified way; The study protocol is not available but it is clear that the published reports include all expected outcomes, including those that were pre‐specified (convincing text of this nature may be uncommon). |
| High risk | Not all of the study’s pre‐specified primary outcomes have been reported; One or more primary outcomes is reported using measurements, analysis methods or subsets of the data (e.g. subscales) that were not pre‐specified; One or more reported primary outcomes were not pre‐specified (unless clear justification for their reporting is provided, such as an unexpected adverse effect); One or more outcomes of interest in the review are reported incompletely so that they cannot be entered in a meta‐analysis; The study report fails to include results for a key outcome that would be expected to have been reported for such a study. | |
| Unclear risk | Insufficient information to permit judgement of low or high risk. |

Risk of bias summary: review authors' judgements about each risk of bias item for each included study

Funnel plot of comparison 1: Digital intervention vs. control, outcome 1.1: Quantity of drinking (g/week), based on longest follow‐up
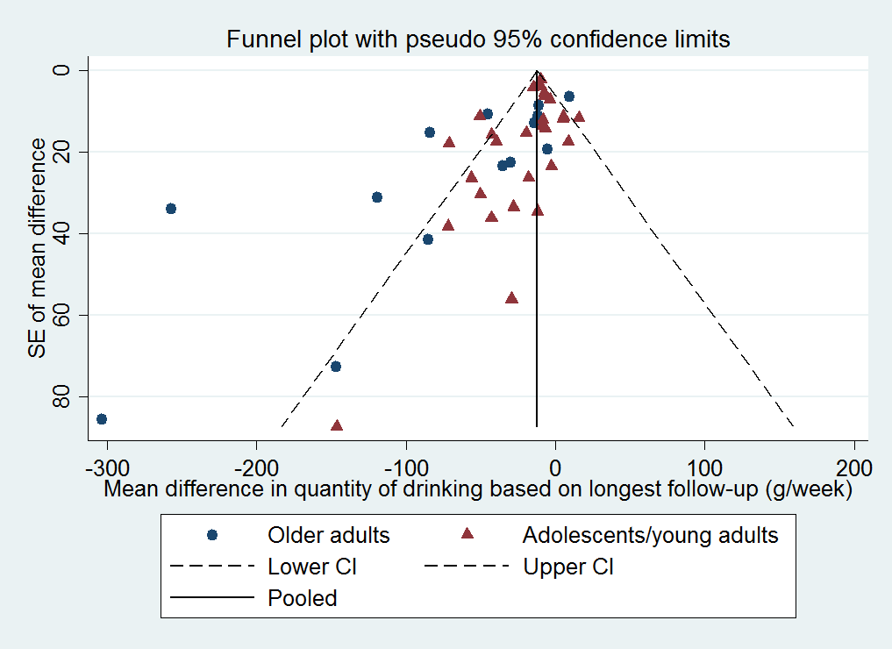
Funnel plot of comparison 1: Digital intervention vs. control, outcome 1.6: Quantity of drinking (g/week), based on longest follow‐up and categorised on whether restricted to adolescents or young adults

Comparison 1 Digital intervention versus no or minimal intervention, Outcome 1 Quantity of drinking (g/week), based on longest follow‐up.
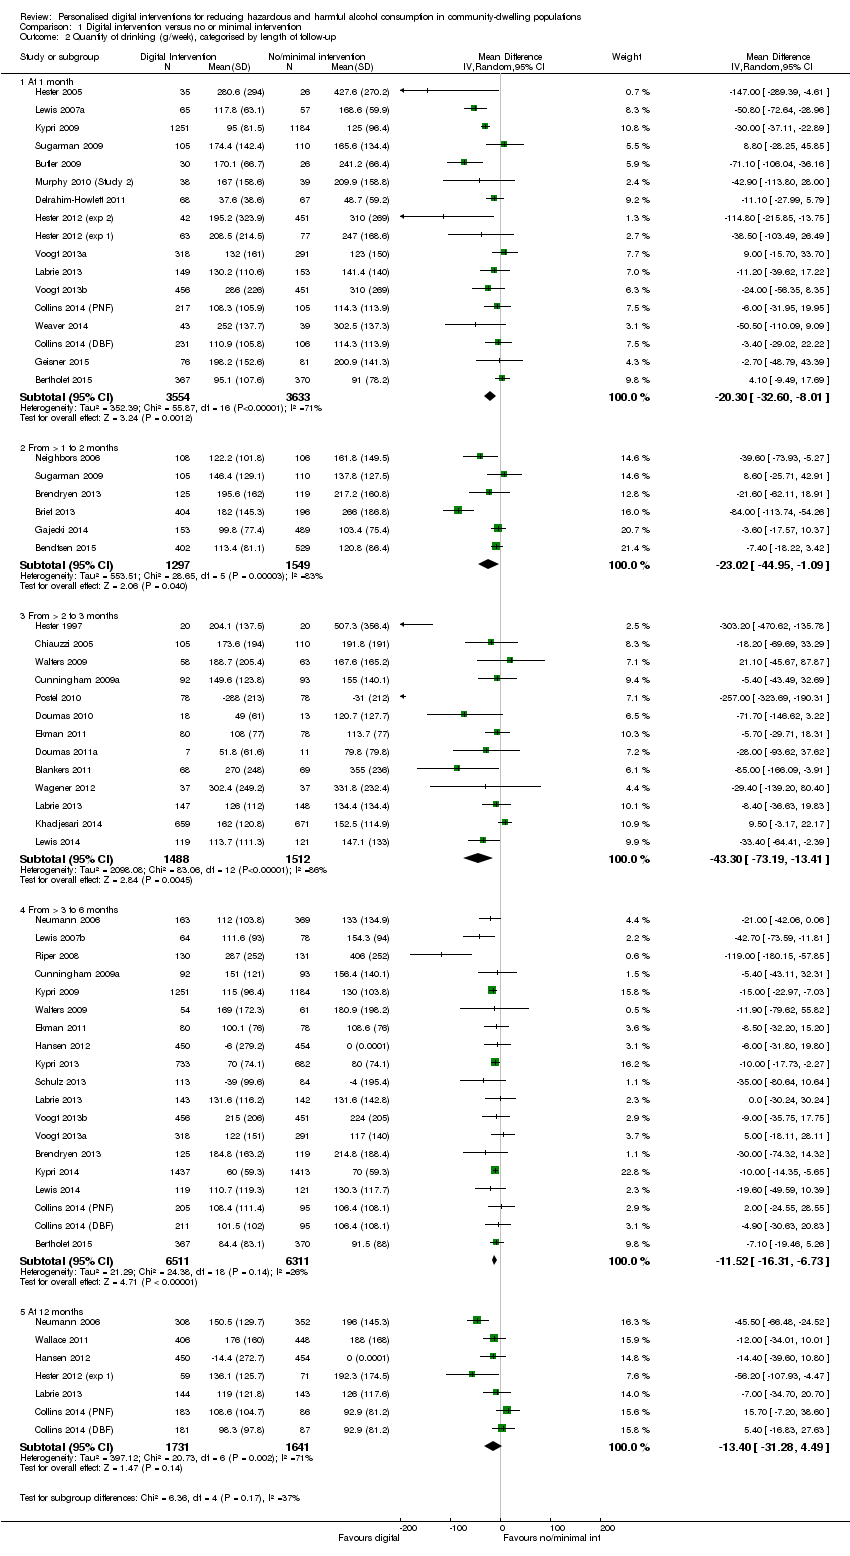
Comparison 1 Digital intervention versus no or minimal intervention, Outcome 2 Quantity of drinking (g/week), categorised by length of follow‐up.

Comparison 1 Digital intervention versus no or minimal intervention, Outcome 3 Quantity of drinking (g/week), based on longest follow‐up and categorised on whether restricted to adolescents or young adults.

Comparison 1 Digital intervention versus no or minimal intervention, Outcome 4 Quantity of drinking (g/week), categorised by length of follow‐up and restricted to trials of adolescents/young adults.

Comparison 1 Digital intervention versus no or minimal intervention, Outcome 5 Quantity of drinking (g/week), based on longest follow‐up and categorised by gender.

Comparison 1 Digital intervention versus no or minimal intervention, Outcome 6 Quantity of drinking (g/week), based on longest follow‐up and omitting trials at high risk of bias owing to incomplete data.

Comparison 1 Digital intervention versus no or minimal intervention, Outcome 7 Quantity of drinking (g/week), based on longest follow‐up and omitting trials at high risk of performance bias.
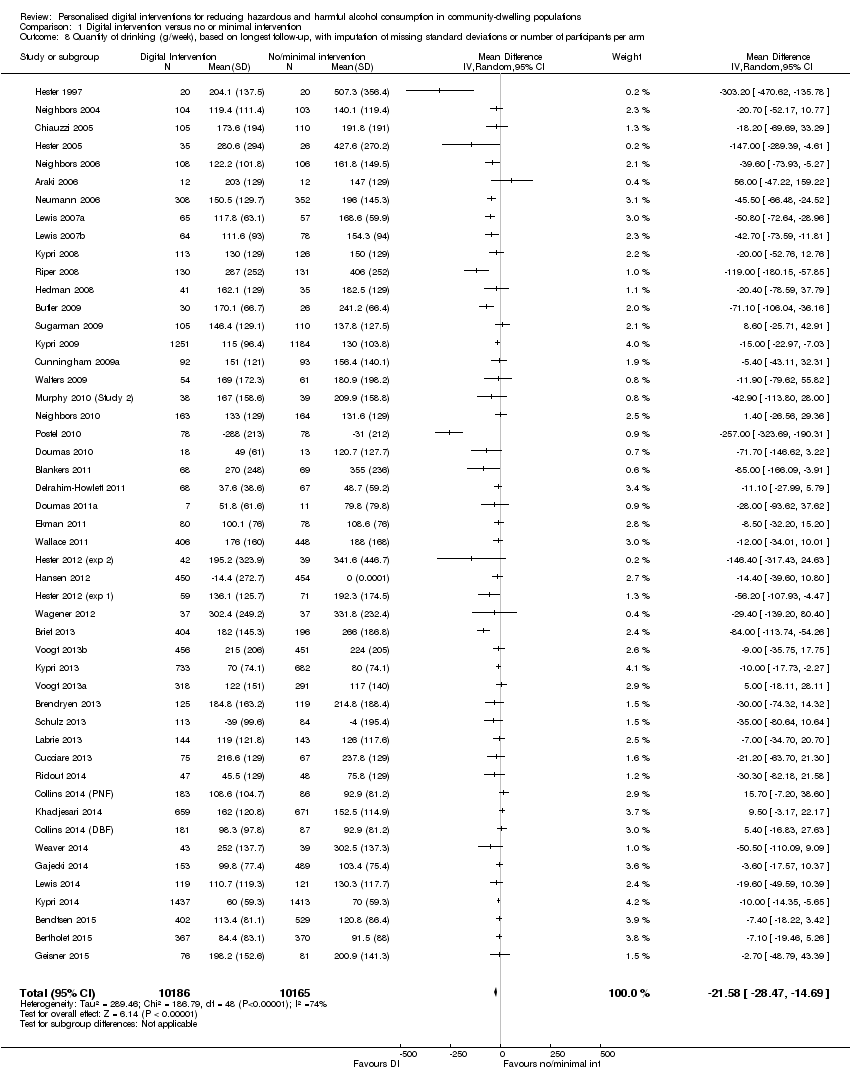
Comparison 1 Digital intervention versus no or minimal intervention, Outcome 8 Quantity of drinking (g/week), based on longest follow‐up, with imputation of missing standard deviations or number of participants per arm.

Comparison 1 Digital intervention versus no or minimal intervention, Outcome 9 Quantity of drinking (g/week), categorised by length of follow‐up, with imputation of missing standard deviations or number of participants per arm.

Comparison 1 Digital intervention versus no or minimal intervention, Outcome 10 Frequency of drinking (no. of days drinking/week), based on longest follow‐up.

Comparison 1 Digital intervention versus no or minimal intervention, Outcome 11 Frequency of binge drinking (no. of binges/week), based on longest follow‐up.
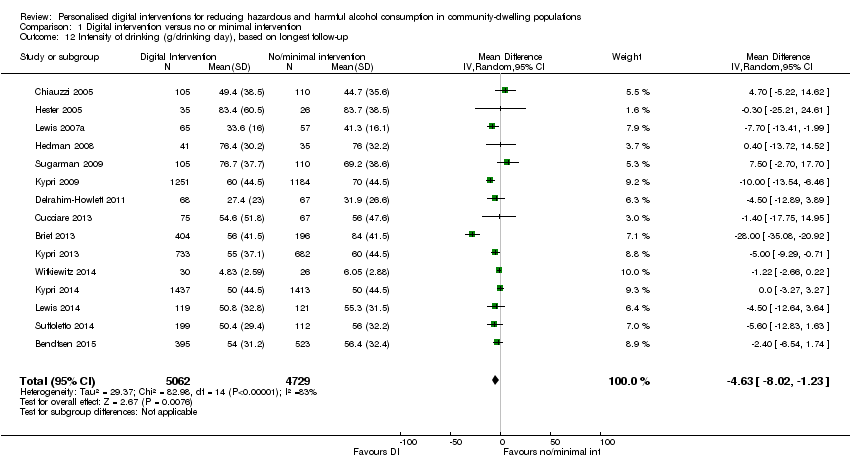
Comparison 1 Digital intervention versus no or minimal intervention, Outcome 12 Intensity of drinking (g/drinking day), based on longest follow‐up.

Comparison 1 Digital intervention versus no or minimal intervention, Outcome 13 Binge drinkers, based on longest period of follow‐up.

Comparison 2 Digital intervention versus face‐to‐face intervention, Outcome 1 Quantity of drinking (g/week), based on longest follow‐up.

Comparison 2 Digital intervention versus face‐to‐face intervention, Outcome 2 Quantity of drinking (g/week), categorised by length of follow‐up.

Comparison 2 Digital intervention versus face‐to‐face intervention, Outcome 3 Frequency of drinking (no. of days drinking/week), based on longest follow‐up.

Comparison 2 Digital intervention versus face‐to‐face intervention, Outcome 4 Frequency of binge drinking (no. of binges/week), based on longest follow‐up.
| Digital intervention compared to no or minimal intervention for reducing hazardous and harmful alcohol consumption in community‐dwelling populations | ||||||
| Patient or population: People living in the community | ||||||
| Outcomes | Anticipated absolute effects* (95% CI) | Relative effect | № of participants | Quality of the evidence | Comments | |
| Risk with no or minimal intervention | Risk with digital intervention | |||||
| Quantity of drinking (g/week), based on longest follow‐up (quantity) | The mean quantity of drinking (g/week), based on longest follow‐up was 176 g/week | MD 23 g/week lower | ‐ | 19,241 | ⊕⊕⊕⊝ | Heterogeneity was substantial (78%) but not unexplained; interventions differed in content and delivery. The direction of effect favoured the intervention in 88% of the studies. |
| Frequency of drinking (number of days drinking/week), based on longest follow‐up (frequency) | The mean frequency of drinking (number of days drinking/week), based on longest follow‐up was 2.5 drinking days/week | MD 0.16 drinking days/week lower | ‐ | 10,862 | ⊕⊕⊕⊝ | |
| Frequency of binge drinking (number of binges/week), based on longest follow‐up | The mean frequency of binge drinking (number of binges/week), based on longest follow‐up was 1.2 binges/week | MD 0.24 binges/week lower | ‐ | 3587 | ⊕⊕⊕⊝ | Heterogeneity was moderate (53%) but not unexplained; interventions differed in content and delivery. The direction of effect favoured the intervention in 93% of the studies. |
| Intensity of drinking (g/drinking day), based on longest follow‐up (intensity) | The mean intensity of drinking (g/drinking day), based on longest follow‐up was 56 g/drinking day | MD 5 g/drinking day lower | ‐ | 9791 | ⊕⊕⊕⊝ | Heterogeneity was substantial (78%) but not unexplained; interventions differed in content and delivery. The direction of effect favoured the intervention in 73% of the studies. |
| Adverse events | Not reported | Not reported | ‐ | ‐ | ‐ | No studies assessed this outcome. |
| *The risk in the intervention group (and its 95% confidence interval) is based on the assumed risk in the comparison group and the relative effect of the intervention (and its 95% CI). | ||||||
| GRADE Working Group grades of evidence | ||||||
| 1 Downgraded due to high risk of attrition or performance bias or both in many studies. A sensitivity analysis based on the primary meta‐analysis, which omitted studies at high risk of performance bias and contained 11 studies, suggested that the intervention led to a reduction of at least 11 g alcohol (7 to 14 g) or 1.5 UK units (Analysis 1.7). | ||||||
| Digital intervention compared to face‐to‐face intervention for reducing hazardous and harmful alcohol consumption in community‐dwelling populations | ||||||
| Patient or population: People living in the community | ||||||
| Outcomes | Anticipated absolute effects* (95% CI) | Relative effect | № of participants | Quality of the evidence | Comments | |
| Risk with face‐to‐face intervention | Risk with digital intervention | |||||
| Quantity of drinking (g/week), based on longest follow‐up (quantity) follow up: range 1 month to 12 months | The mean quantity of drinking (g/week), based on longest follow‐up was 180 g/week | MD 0.52 g/week higher | ‐ | 390 | ⊕⊕⊝⊝ | |
| Frequency of drinking (number of days drinking/week), based on longest follow‐up (frequency) follow up: range 1 months to 12 months | The mean frequency of drinking (no. of days drinking/week), based on longest follow‐up was 1.85 drinking days/week | MD 0.05 drinking days/week higher | ‐ | 58 | ⊕⊕⊝⊝ | |
| Frequency of binge drinking (number of binges/week), based on longest follow‐up | The mean frequency of binge drinking (no. of binges/week), based on longest follow‐up was 0.7 binges/week | MD 0.04 binges/week higher | ‐ | 206 | ⊕⊕⊝⊝ | |
| Intensity of drinking (g/drinking day) | Not reported | Not reported | ‐ | ‐ | ‐ | No studies assessed this outcome. |
| Adverse events | Not reported | Not reported | ‐ | ‐ | ‐ | No studies assessed this outcome. |
| *The risk in the intervention group (and its 95% confidence interval) is based on the assumed risk in the comparison group and the relative effect of the intervention (and its 95% CI). | ||||||
| GRADE Working Group grades of evidence | ||||||
| 1 Downgraded one level due to serious risk of bias (high risk of attrition or performance bias or both). 2 Downgraded one level due to serious imprecision (fewer than 400 participants). | ||||||
| Behaviour change technique | % age (N) |
| 2.2. Feedback on behaviour | 85.7% (36) |
| 6.2. Social comparison | 81.0% (34) |
| 5.3. Information about social and environmental consequences | 71.4% (30) |
| 2.7. Feedback on outcome(s) of behaviour | 69.0% (29) |
| 3.1. Social support (unspecified) | 64.3% (27) |
| 4.1. Instruction on how to perform the behaviour | 52.4% (22) |
| 2.6. Biofeedback | 50.0% (21) |
| 5.2. Salience of consequences | 50.0% (21) |
| 9.2. Pros and cons | 35.7% (15) |
| 1.2. Problem solving | 33.3% (14) |
| 5.1. Information about health consequences | 33.3% (14) |
| 1.4. Action planning | 31.0% (13) |
| 9.1. Credible source | 31.0% (13) |
| 1.1. Goal setting (behaviour) | 28.6% (12) |
| 2.3. Self‐monitoring of behaviour | 26.2% (11) |
| 3.2. Social support (practical) | 16.7% (7) |
| 2.4. Self‐monitoring of outcome(s) of behaviour | 14.3% (6) |
| 4.2. Information about antecedents | 14.3% (6) |
| 1.3. Goal setting (outcome) | 11.9% (5) |
| 1.6. Discrepancy between current behaviour and goal | 11.9% (5) |
| 8.2. Behaviour substitution | 9.5% (4) |
| 12.2. Restructuring the social environment | 9.5% (4) |
| 15.4. Self‐talk | 9.5% (4) |
| 5.6. Information about emotional consequences | 7.1% (3) |
| 7.1. Prompts/cues | 7.1% (3) |
| 11.2. Reduce negative emotions | 7.1% (3) |
| 12.3. Avoidance/reducing exposure to cues for the behaviour | 7.1% (3) |
| 1.5. Review behaviour goal(s) | 4.8% (2) |
| 5.4. Monitoring of emotional consequences | 4.8% (2) |
| 10.3. Non‐specific reward | 4.8% (2) |
| 10.9. Self‐reward | 4.8% (2) |
| 1.7. Review outcome goal(s) | 2.4% (1) |
| 1.8. Behavioural contract | 2.4% (1) |
| 3.3. Social support (emotional) | 2.4% (1) |
| 4.4. Behavioural experiments | 2.4% (1) |
| 8.1. Behavioural practice/rehearsal | 2.4% (1) |
| 8.7. Graded tasks | 2.4% (1) |
| 10.4. Social reward | 2.4% (1) |
| 10.6. Non‐specific incentive | 2.4% (1) |
| 13.2. Framing/reframing | 2.4% (1) |
| 14.2. Punishment | 2.4% (1) |
| 15.1. Verbal persuasion about capability | 2.4% (1) |
| 15.3. Focus on past success | 2.4% (1) |
| The following behaviour change techniques were not used in any digital intervention: 1.9. Commitment, 2.1. Monitoring of behaviour by others without feedback, 2.5. Monitoring of outcome(s) of behaviour without feedback, 4.3. Re‐attribution, 5.5. Anticipated regret, 6.1. Demonstration of the behaviour, 6.3. Information about others’ approval, 7.2. Cue signalling reward, 7.3. Reduce prompts/cues, 7.4. Remove access to the reward, 7.5. Remove aversive stimulus, 7.6. Satiation, 7.7. Exposure, 7.8. Associative learning, 8.3. Habit formation, 8.5. Overcorrection, 8.6. Generalisation of target behaviour, 9.3. Comparative imagining of future outcomes, 10.1. Material incentive (behaviour), 10.2. Material reward (behaviour), 10.5. Social incentive, 10.7. Self‐incentive, 10.8. Incentive (outcome), 10.10. Reward (outcome), 10.11. Future punishment, 11.1. Pharmacological support, 11.3. Conserving mental resources, 11.4. Paradoxical instructions, 12.1. Restructuring the physical environment, 12.4. Distraction, 12.5. Adding objects to the environment, 12.6. Body changes, 13.1. Identification of self as role model, 13.3. Incompatible beliefs, 13.4. Valued self‐identify, 13.5. Identity associated with changed behaviour, 14.1. Behaviour cost, 14.3. Remove reward, 14.4. Reward approximation, 14.5. Rewarding completion, 14.6. Situation‐specific reward, 14.7. Reward incompatible behaviour, 14.8. Reward alternative behaviour, 14.9. Reduce reward frequency, 14.10. Remove punishment, 15.2. Mental rehearsal of successful performance, 16.1. Imaginary punishment, 16.2. Imaginary reward, 16.3. Vicarious consequences. | |
| Behaviour change technique | B (SE) | P | 95% CI | I² | Adj R² | |
| 1.1 | Goal setting (behaviour) | ‐43.94 (17.14) | 0.01 | ‐78.59 to ‐9.30 | 78.05% | 6.64% |
| 1.2 | Problem solving | ‐48.03 (14.72) | < 0.01 | ‐77.79 to ‐18.27 | 74.64% | 25.01% |
| 1.3 | Goal setting (outcome) | ‐14.43 (23.46) | 0.54 | ‐61.85 to 32.99 | 77.71% | ‐2.95% |
| 1.4 | Action planning | ‐26.21 (16.58) | 0.12 | ‐59.73 to 7.30 | 77.57% | 5.45% |
| 1.6 | Discrepancy between current behaviour and goal | ‐33.88 (24.97) | 0.18 | ‐84.35 to 16.58 | 78.24% | 0.15% |
| 2.2 | Feedback on behaviour | 12.97 (21.30) | 0.55 | ‐30.08 to 56.02 | 78.31% | ‐7.13% |
| 2.3 | Self‐monitoring of behaviour | ‐30.39 (17.14) | 0.08 | ‐65.03 to 4.26 | 78.36% | 2.07% |
| 2.4 | Self‐monitoring of outcome(s) of behaviour | ‐8.60 (22.37) | 0.70 | ‐53.81 to 36.61 | 78.52% | ‐4.67% |
| 2.6 | Biofeedback | 10.81 (15.24) | 0.48 | ‐19.99 to 41.62 | 77.85% | 1.55% |
| 2.7 | Feedback on outcome(s) of behaviour | ‐4.62 (16.45) | 0.78 | ‐37.87 to 28.63 | 78.48% | ‐5.63% |
| 3.1 | Social support (unspecified) | ‐19.55 (15.39) | 0.21 | ‐50.65 to 11.55 | 78.53% | ‐0.41% |
| 3.2 | Social support (practical) | ‐26.35 (22.59) | 0.25 | ‐72.01 to 19.31 | 77.18% | 0.29% |
| 4.1 | Instruction on how to perform the behaviour | 4.46 (15.51) | 0.78 | ‐26.89 to 35.80 | 78.55% | ‐5.77% |
| 4.2 | Information about antecedents | ‐74.20 (21.53) | <0.01 | ‐117.72 to ‐30.68 | 74.91% | 32.15% |
| 5.1 | Information about health consequences | 16.75 (15.70) | 0.29 | ‐14.99 to 48.49 | 78.42% | 0.06% |
| 5.2 | Salience of consequences | 21.99 (14.86) | 0.15 | ‐8.05 to 52.02 | 78.17% | 4.92% |
| 5.3 | Information about social and environmental consequences | 28.88 (16.56) | 0.09 | ‐4.59 to 62.34 | 77.59% | 1.01% |
| 6.2 | Social comparison | 24.25 (18.95) | 0.21 | ‐14.06 to 62.56 | 78.53% | ‐4.98% |
| 8.2 | Behaviour substitution | ‐123.71 (30.14) | < 0.001 | ‐184.63 to ‐62.80 | 72.92% | 48.53% |
| 9.1 | Credible source | ‐39.89 (16.22) | 0.02 | ‐72.66 to ‐7.11 | 75.84% | 15.60% |
| 9.2 | Pros and cons | ‐30.10 (15.77) | 0.06 | ‐61.97 to 1.78 | 77.57% | 10.15% |
| 12.2 | Restructuring the social environment | ‐22.91 (31.52) | 0.47 | ‐86.62 to 40.79 | 78.56% | ‐7.66% |
| 15.4 | Self‐talk | ‐41.53 (26.37) | 0.12 | ‐94.84 to 11.77 | 77.93% | 6.04% |
| Abbreviation: B = regression coefficient Rows in italics denote BCTs demonstrating a significant association with effect size in the unadjusted analysis | ||||||
| Behaviour change technique | B (SE) | P | 95% CI | |
| 1.1 | Goal setting (behaviour) | 0.75 (19.60) | 0.97 | ‐39.40 to 40.89 |
| 1.2 | Problem solving | ‐45.92 (21.99) | 0.05 | ‐90.97 to ‐0.87 |
| 1.4 | Action planning | 30.75 (19.50) | 0.13 | ‐9.19 to 70.68 |
| 1.6 | Discrepancy between current behaviour and goal | ‐29.86 (23.97) | 0.22 | ‐78.97 to 19.25 |
| 2.3 | Self‐monitoring of behaviour | ‐6.34 (18.35) | 0.73 | ‐43.91 to 31.24 |
| 3.2 | Social support (practical) | 33.73 (21.85) | 0.13 | ‐11.03 to 78.49 |
| 4.2 | Information about antecedents | ‐43.38 (23.93) | 0.08 | ‐92.39 to 5.63 |
| 5.2 | Salience of consequences | 13.20 (14.96) | 0.39 | ‐17.55 to 43.95 |
| 5.3 | Information about social and environmental consequences | 24.64 (12.17) | 0.05 | ‐0.30 to 49.57 |
| 8.2 | Behaviour substitution | ‐95.12 (33.09) | 0.01 | ‐162.90 to ‐27.34 |
| 9.1 | Credible source | ‐32.09 (13.94) | 0.03 | ‐60.64 to ‐3.55 |
| 9.2 | Pros and cons | 6.68 (13.68) | 0.63 | ‐21.33 to 34.69 |
| 15.4 | Self‐talk | ‐8.41 (26.69) | 0.76 | ‐63.09 to 46.27 |
| Abbreviation: B = regression coefficient Rows in italics denote BCTs demonstrating a significant association with effect size in the adjusted analysis | ||||
| Theory Coding Scheme item description (item number) | N (%) of studies where item = 1 |
| Theory/model of behaviour mentioned (I1) | 21 (50%) |
| Targeted construct mentioned as predictor of behaviour (I2) | 17 (40%) |
| Intervention based on single theory (I3) | 9 (21%) |
| Theory/predictors used to select recipients for the intervention (I4) | 0 (0%) |
| Theory/predictors used to select/develop intervention techniques (I5) | 16 (38%) |
| Theory/predictors used to tailor intervention techniques to recipients (I6) | 3 (7%) |
| All intervention techniques are explicitly linked to at least one theory‐relevant construct/predictor (I7) | 6 (14%) |
| At least one, but not all, of the intervention techniques are explicitly linked to at least one theory‐relevant construct/predictor (I8) | 11 (26%) |
| Group of techniques are linked to a group of constructs/predictors (I9) | 2 (5%) |
| All theory‐relevant constructs/predictors are explicitly linked to at least one intervention technique (I10) | 7 (17%) |
| At least one, but not all, of the theory‐relevant constructs/predictors are explicitly linked to at least one intervention technique (I11) | 10 (24%) |
| Theory‐relevant constructs are measured: post‐intervention (I12a) | 12 (29%) |
| Theory‐relevant constructs are measured: post‐ and pre‐intervention (I12b) | 10 (24%) |
| Changes in measured theory‐relevant constructs/predictor (I13) | 8 (19%) |
| Mediational analysis of constructs/ predictors: mediator predicts the dependent variable (I14a) | 6 (14%) |
| Mediational analysis of constructs/ predictors: mediator predicts dependent variable, controlling for the independent variable (I14b) | 3 (7%) |
| Mediational analysis of constructs/ predictors: intervention does not predict the dependent variable when controlling the independent variable (I14c) | 4 (10%) |
| Mediational analysis of constructs/ predictors: mediated effect is statistically significant (I14d) | 6 (14%) |
| Results discussed in relation to theory (I15) | 12 (29%) |
| Appropriate support for theory (I16) | 7 (17%) |
| Results used to refine theory: adding/ removing constructs to the theory (I17a) | 0 (0%) |
| Results used to refine theory: specifying that the interrelationships between the theoretical constructs should be changed (I17b) | 0 (0%) |
| Study ID | Theories (n) | Total theory use score | TM | SRT | SCT | SLT | DMT | MIT | SNT | TPB | SIT | SCompT | SImpT | SDT | ICM | HBM | TSI | ET | CBT | PBT |
| 3 | 6 | X | X | X | ||||||||||||||||
| 3 | 6 | X | X | X | ||||||||||||||||
| 1 | 6 | X | ||||||||||||||||||
| 1 | 15 | X | ||||||||||||||||||
| 1 | 7 | X | ||||||||||||||||||
| 1 | 8 | X | ||||||||||||||||||
| 1 | 8 | X | ||||||||||||||||||
| 1 | 1 | X | ||||||||||||||||||
| 3 | 12 | X | X | X | ||||||||||||||||
| 4 | 16 | X | X | X | X | |||||||||||||||
| 3 | 14 | X | X | X | ||||||||||||||||
| 2 | 15 | X | X | |||||||||||||||||
| 1 | 12 | X | ||||||||||||||||||
| 1 | 16 | X | ||||||||||||||||||
| 2 | 4 | X | X | |||||||||||||||||
| 5 | 9 | X | X | X | X | X | ||||||||||||||
| 3 | 6 | X | X | X | ||||||||||||||||
| 3 | 5 | X | X | X | ||||||||||||||||
| 5 | 8 | X | X | X | X | X | ||||||||||||||
| 2 | 7 | X | X | |||||||||||||||||
| 2 | 2 | X | X | |||||||||||||||||
| Number of studies: | 6 | 2 | 2 | 2 | 1 | 7 | 6 | 3 | 2 | 3 | 3 | 1 | 3 | 1 | 2 | 1 | 1 | 1 | ||
| Abbreviations: CBT = cognitive‐behavioural theory; DMT = decision‐making theory; ET = expectancy theory; HBM = health belief model; ICM = I‐change model; MIT = motivational interviewing theory; PBT = problem behaviour theory; SCT = social cognitive theory; SCompT = social comparison theory; SDT = social determination theory; SImpT = social impact theory; SIT = social identity theory; SLT = social learning theory; SNT = social norms theory; SRT = self‐regulation theory; TM = transtheoretical model; TPB = theory of planned behaviour; TSI = theory of social influence | ||||||||||||||||||||
| Theory Coding Scheme Categories (category number) | Items included | Maximum score | Mean (SD) | Number of studies scoring ≥ 1 |
| Reference to underpinning theory (C1) | 1, 2, 3 | 3 | 1.1 (1.23) | 20 |
| Targeting of relevant theoretical constructs (C2) | 2, 5, 6, 7, 8, 9, 10, 11 | 8 | 2.0 (2.43) | 17 |
| Using theory to select recipients or tailor interventions (C3) | 4, 6 | 2 | 0.1 (0.26) | 2 |
| Measurement of constructs (C4) | 12a, 12b | 2 | 0.5 (0.86) | 11 |
| Testing of theory: mediation effects (C5) | 12a, 12b, 13, 14a, 14b, 14c, 14d, 15, 16 | 9 | 1.6 (2.83) | 14 |
| Refining theory (C6) | 17a, 17b | 2 | ‐ | ‐ |
| Total use of theory | All items | 22 | 4.4 (5.43) | 20 |
| Theory Coding Scheme covariates (item/category number) | B (SE) | P | 95% CI | Adj. R² | I² | |
| Lower bound | Upper bound | |||||
| Theory/model of behaviour mentioned (I1) | 9.73 (14.63) | 0.510 | ‐19.84 | 39.31 | ‐4.90% | 78.09% |
| Targeted construct mentioned as predictor of behaviour (I2) | 24.17 (14.09) | 0.094 | ‐4.30 | 52.64 | 2.27% | 78.13% |
| Intervention based on single theory (I3) | 12.92 (17.60) | 0.467 | ‐22.64 | 48.49 | ‐4.44% | 78.08% |
| Theory/predictors used to select recipients | Not present in > 10% of studies | |||||
| Theory/predictors used to select/develop | 18.25 (14.57) | 0.218 | ‐11.20 | 47.69 | ‐3.43% | 78.15% |
| Theory/predictors used to tailor intervention techniques | Not present in > 10% of studies | |||||
| All intervention techniques are explicitly linked to at least | ‐3.73 (19.91) | 0.852 | ‐43.98 | 36.51 | ‐4.86% | 76.50% |
| At least one, but not all, of the intervention techniques are | 26.39 (15.34) | 0.093 | ‐4.60 | 57.39 | 10.54% | 77.49% |
| Group of techniques are linked to a group of | Not present in > 10% of studies | |||||
| All theory‐relevant constructs/predictors are explicitly | 8.53 (19.81) | 0.673 | ‐31.60 | 48.46 | ‐5.82% | 78.14% |
| At least one, but not all, of the theory‐relevant | 18.79 (15.99) | 0.247 | ‐13.54 | 51.11 | ‐3.45% | 78.15% |
| Theory‐relevant constructs are measured: | ‐14.67 (15.81) | 0.359 | ‐46.62 | 17.28 | 1.42% | 76.37% |
| Theory‐relevant constructs are measured: | ‐13.78 (16.88) | 0.419 | ‐47.90 | 20.33 | ‐1.67% | 76.94% |
| Changes in measured theory‐relevant | ‐33.04 (17.48) | 0.066 | ‐68.37 | 2.28 | 16.92% | 74.82% |
| Mediational analysis of constructs/ predictors: | ‐7.77 (20.24) | 0.703 | ‐48.68 | 33.15 | ‐3.13% | 76.43% |
| Mediational analysis of constructs/ predictors: | Not present in > 10% of studies | |||||
| Mediational analysis of constructs/ predictors: | ‐21.88 (24.11) | 0.370 | ‐70.61 | 26.86 | 4.48% | 75.41% |
| Mediational analysis of constructs/ predictors: | ‐7.77 (20.24) | 0.703 | ‐48.68 | 33.14 | ‐3.13% | 76.43% |
| Results discussed in relation to theory (I15) | 1.59 (16.08) | 0.922 | ‐30.91 | 34.08 | ‐6.81% | 77.35% |
| Appropriate support for theory (I16) | ‐8.73 (19.43) | 0.656 | ‐48.01 | 30.55 | ‐2.11% | 76.33% |
| Results used to refine theory: | Not present in > 10% of studies | |||||
| Results used to refine theory: | Not present in > 10% of studies | |||||
| Reference to underpinning theory (C1) | 7.19 (5.89) | 0.230 | ‐4.72 | 19.10 | ‐1.55% | 78.08% |
| Targeting of relevant theoretical constructs (C2) | 3.94 (2.97) | 0.192 | ‐2.06 | 9.93 | ‐4.08% | 78.12% |
| Using theory to select recipients or tailor interventions (C3) | 13.30 (27.27) | 0.628 | ‐41.81 | 68.42 | ‐7.21% | 77.67% |
| Measurement of constructs (C4) | ‐7.58 (8.41) | 0.373 | ‐24.58 | 9.42 | 0.19% | 76.61% |
| Testing of theory: mediation effects (C5) | ‐2.09 (2.53) | 0.413 | ‐7.20 | 3.02 | 2.29% | 75.71% |
| Refining theory (C6) | No score > 0 for any studies | |||||
| Total use of theory | 0.39 (1.37) | 0.778 | ‐2.38 | 3.15 | ‐7.46% | 77.58% |
| Theory Coding Scheme covariates (item number) | B (SE) | P | 95% CI | |
| Lower bound | Upper bound | |||
| Targeted construct mentioned as predictor of behaviour (I2) | 50.82 (21.00) | 0.020 | 8.31 | 93.34 |
| At least one, but not all, of the intervention techniques are | ‐12.19 (20.71) | 0.560 | ‐54.12 | 29.74 |
| Changes in measured theory‐relevant constructs/predictor (I13) | ‐61.41 (19.42) | 0.003 | ‐100.71 | ‐22.10 |
| Outcome or subgroup title | No. of studies | No. of participants | Statistical method | Effect size |
| 1 Quantity of drinking (g/week), based on longest follow‐up Show forest plot | 42 | 19241 | Mean Difference (IV, Random, 95% CI) | ‐22.84 [‐30.31, ‐15.36] |
| 2 Quantity of drinking (g/week), categorised by length of follow‐up Show forest plot | 42 | Mean Difference (IV, Random, 95% CI) | Subtotals only | |
| 2.1 At 1 month | 17 | 7187 | Mean Difference (IV, Random, 95% CI) | ‐20.30 [‐32.60, ‐8.01] |
| 2.2 From > 1 to 2 months | 6 | 2846 | Mean Difference (IV, Random, 95% CI) | ‐23.02 [‐44.95, ‐1.09] |
| 2.3 From > 2 to 3 months | 13 | 3000 | Mean Difference (IV, Random, 95% CI) | ‐43.30 [‐73.19, ‐13.41] |
| 2.4 From > 3 to 6 months | 19 | 12822 | Mean Difference (IV, Random, 95% CI) | ‐11.52 [‐16.31, ‐6.73] |
| 2.5 At 12 months | 7 | 3372 | Mean Difference (IV, Random, 95% CI) | ‐13.40 [‐31.28, 4.49] |
| 3 Quantity of drinking (g/week), based on longest follow‐up and categorised on whether restricted to adolescents or young adults Show forest plot | 42 | 19241 | Mean Difference (IV, Random, 95% CI) | ‐22.84 [‐30.31, ‐15.36] |
| 3.1 Trials of adolescents/young adults | 28 | 13477 | Mean Difference (IV, Random, 95% CI) | ‐13.44 [‐19.27, ‐7.61] |
| 3.2 Trials of adults | 14 | 5764 | Mean Difference (IV, Random, 95% CI) | ‐56.05 [‐82.08, ‐30.02] |
| 4 Quantity of drinking (g/week), categorised by length of follow‐up and restricted to trials of adolescents/young adults Show forest plot | 28 | Mean Difference (IV, Random, 95% CI) | Subtotals only | |
| 4.1 At 1 month | 15 | 6579 | Mean Difference (IV, Random, 95% CI) | ‐19.67 [‐32.96, ‐6.37] |
| 4.2 From > 1 to 2 months | 4 | 2002 | Mean Difference (IV, Random, 95% CI) | ‐7.60 [‐18.98, 3.77] |
| 4.3 From > 2 to 3 months | 8 | 1152 | Mean Difference (IV, Random, 95% CI) | ‐15.42 [‐29.39, ‐1.45] |
| 4.4 From > 3 to 6 months | 13 | 10499 | Mean Difference (IV, Random, 95% CI) | ‐10.36 [‐13.47, ‐7.25] |
| 4.5 At 12 months | 4 | 954 | Mean Difference (IV, Random, 95% CI) | ‐2.35 [‐23.57, 18.88] |
| 5 Quantity of drinking (g/week), based on longest follow‐up and categorised by gender Show forest plot | 5 | 2566 | Mean Difference (IV, Random, 95% CI) | ‐9.58 [‐22.24, 3.07] |
| 5.1 Males | 4 | 1923 | Mean Difference (IV, Random, 95% CI) | ‐8.86 [‐31.99, 14.27] |
| 5.2 Females | 4 | 643 | Mean Difference (IV, Random, 95% CI) | ‐9.81 [‐21.87, 2.24] |
| 6 Quantity of drinking (g/week), based on longest follow‐up and omitting trials at high risk of bias owing to incomplete data Show forest plot | 28 | 13559 | Mean Difference (IV, Random, 95% CI) | ‐16.24 [‐23.43, ‐9.05] |
| 7 Quantity of drinking (g/week), based on longest follow‐up and omitting trials at high risk of performance bias Show forest plot | 11 | 10272 | Mean Difference (IV, Random, 95% CI) | ‐10.53 [‐13.70, ‐7.36] |
| 8 Quantity of drinking (g/week), based on longest follow‐up, with imputation of missing standard deviations or number of participants per arm Show forest plot | 49 | 20351 | Mean Difference (IV, Random, 95% CI) | ‐21.58 [‐28.47, ‐14.69] |
| 9 Quantity of drinking (g/week), categorised by length of follow‐up, with imputation of missing standard deviations or number of participants per arm Show forest plot | 49 | Mean Difference (IV, Random, 95% CI) | Subtotals only | |
| 9.1 At 1 month | 18 | 6870 | Mean Difference (IV, Random, 95% CI) | ‐20.07 [‐31.94, ‐8.20] |
| 9.2 From > 1 to 2 months | 8 | 2946 | Mean Difference (IV, Random, 95% CI) | ‐20.18 [‐40.45, 0.09] |
| 9.3 From > 2 to 3 months | 16 | 3443 | Mean Difference (IV, Random, 95% CI) | ‐33.24 [‐57.32, ‐9.16] |
| 9.4 From > 3 to 6 months | 23 | 13736 | Mean Difference (IV, Random, 95% CI) | ‐11.89 [‐16.48, ‐7.30] |
| 9.5 At 12 months | 9 | 3938 | Mean Difference (IV, Random, 95% CI) | ‐11.62 [‐26.42, 3.17] |
| 9.6 At 18 months | 1 | 327 | Mean Difference (IV, Random, 95% CI) | 22.40 [‐5.56, 50.36] |
| 9.7 At 24 months | 1 | 327 | Mean Difference (IV, Random, 95% CI) | 1.40 [‐20.28, 23.08] |
| 10 Frequency of drinking (no. of days drinking/week), based on longest follow‐up Show forest plot | 16 | 10862 | Mean Difference (IV, Random, 95% CI) | ‐0.16 [‐0.24, ‐0.09] |
| 11 Frequency of binge drinking (no. of binges/week), based on longest follow‐up Show forest plot | 15 | 3587 | Mean Difference (IV, Random, 95% CI) | ‐0.24 [‐0.35, ‐0.13] |
| 12 Intensity of drinking (g/drinking day), based on longest follow‐up Show forest plot | 15 | 9791 | Mean Difference (IV, Random, 95% CI) | ‐4.63 [‐8.02, ‐1.23] |
| 13 Binge drinkers, based on longest period of follow‐up Show forest plot | 9 | 9417 | Risk Ratio (M‐H, Random, 95% CI) | 0.98 [0.97, 1.00] |
| Outcome or subgroup title | No. of studies | No. of participants | Statistical method | Effect size |
| 1 Quantity of drinking (g/week), based on longest follow‐up Show forest plot | 5 | 390 | Mean Difference (IV, Random, 95% CI) | 0.52 [‐24.59, 25.63] |
| 2 Quantity of drinking (g/week), categorised by length of follow‐up Show forest plot | 5 | Mean Difference (IV, Random, 95% CI) | Subtotals only | |
| 2.1 At 1 month | 3 | 206 | Mean Difference (IV, Random, 95% CI) | 4.03 [‐36.90, 44.96] |
| 2.2 From > 1 to 2 months | 0 | 0 | Mean Difference (IV, Random, 95% CI) | 0.0 [0.0, 0.0] |
| 2.3 From > 2 to 3 months | 2 | 188 | Mean Difference (IV, Random, 95% CI) | 17.16 [‐42.07, 76.39] |
| 2.4 From > 3 to 6 months | 1 | 113 | Mean Difference (IV, Random, 95% CI) | 6.70 [‐50.53, 63.93] |
| 2.5 At 12 months | 0 | 0 | Mean Difference (IV, Random, 95% CI) | 0.0 [0.0, 0.0] |
| 3 Frequency of drinking (no. of days drinking/week), based on longest follow‐up Show forest plot | 1 | 58 | Mean Difference (IV, Random, 95% CI) | 0.05 [‐0.33, 0.43] |
| 4 Frequency of binge drinking (no. of binges/week), based on longest follow‐up Show forest plot | 3 | 206 | Mean Difference (IV, Random, 95% CI) | 0.04 [‐0.15, 0.22] |