Pruebas diagnósticas rápidas para diagnosticar el paludismo no complicado no falciparum o por Plasmodium vivax en países endémicos
Appendices
Appendix 1. Search strategy
| Search set | MEDLINE | EMBASE |
| 1 | Exp Malaria[MeSH] | Exp Malaria [Emtree] |
| 2 | Exp Plasmodium [MeSH] | Exp Plasmodium [Emtree] |
| 3 | Malaria ti, ab | Malaria ti, ab |
| 4 | 1 or 2 or 3 | 1 or 2 or 3 |
| 5 | Exp Reagent kits, diagnostics [MeSH] | Exp Diagnostic procedures [Emtree] |
| 6 | rapid diagnos* test* ti, ab | rapid diagnos$ test$ ti, ab |
| 7 | RDT ti, ab | RDT ti, ab |
| 8 | Dipstick* ti, ab | Dipstick$ ti, ab |
| 9 | Rapid diagnos* device* ti, ab | Rapid diagnos$ device$ ti, ab |
| 10 | MRDD ti, ab | MRDD ti, ab |
| 11 | OptiMal ti, ab | OptiMal ti, ab |
| 12 | Binax NOW ti, ab | Binax NOW ti, ab |
| 13 | ParaSight ti, ab | ParaSight ti, ab |
| 14 | Immunochromatograph* ti, ab | Immunochromatography [Emtree] |
| 15 | Antigen detection method* | Antigen detection method$ |
| 16 | Rapid malaria antigen test* | Rapid malaria antigen test$ |
| 17 | Combo card test* ti, ab | Combo card test$ ti, ab |
| 18 | Immunoassay [MeSH] | Immunoassay [Emtree] |
| 19 | Chromatography [MeSH] | Chromatography [Emtree] |
| 20 | Enzyme‐linked immunosorbent assay [MeSH] | Enzyme‐linked immunosorbent assay [Emtree] |
| 21 | Rapid test* ti, ab | Rapid test$ ti, ab |
| 22 | Card test* ti, ab | Card test$ ti, ab |
| 23 | Rapid AND (detection* or diagnos*) ti, ab | Rapid AND (detection$ or diagnos$) ti, ab |
| 24 | 5 or 6 or 7 or 8 or 9 or 10 or 11 or 12 or 13 or 14 or 15 or 16 or 17 or 18 or 19 or 20 or 21 or 22 or 23 | 5 or 6 or 7 or 8 or 9 or 10 or 11 or 12 or 13 or 14 or 15 or 16 or 17 or 18 or 19 or 20 or 21 or 22 or 23 |
| 25 | 4 and 19 | 4 and 19 |
| 26 | Limit 20 to Humans | Limit 20 to Human |
Appendix 2. Data extraction: characteristics of included studies
| Study ID | First author, year of publication. |
| Clinical features and settings | Presenting signs and symptoms, previous treatments for malaria, clinical setting. |
| Participants | Sample size, age, sex, comorbidities or pregnancy, country and locality, P. falciparum malaria endemicity, endemic malaria species, average parasite density in microscopy positive cases. |
| Study design | Were consecutive patients enrolled retrospectively or prospectively? |
| Whether the sampling method was consecutive or random, or whether the method was not described but consecutive sampling was most probable. | |
| If the study evaluated more than one RDT, how were tests allocated to individuals, or did each individual receive all the tests? | |
| Target condition | Malaria parasitaemia. |
| Reference standard | The reference standard test(s) used. |
| If microscopy was used, who performed it, and where? | |
| If microscopy was used, how many high power fields were looked at? | |
| If microscopy was used, how many observers or repeats were used? | |
| If microscopy was used, how were discrepancies between observers resolved? | |
| Index tests | The parasite species the test was designed to detect, the commercial name, and the type of test. Batch numbers if provided. Transport and storage conditions. Details of the test operators, including any special training provided. |
| Notes | Source of funding. |
Appendix 3. Data extraction and criteria for judgement: methodological quality
| Quality indicator | Notes |
| Was the spectrum of patients representative of the spectrum of patients who will receive the test in practice? |
|
| Is the reference standard likely to correctly identify the target condition? |
|
| Is partial verification avoided? |
If not all participants received the reference test, we reported how many did not. |
| Is differential verification avoided? |
If any participants received a different reference test, we reported the reasons stated for this, and how many participants were involved. |
| Is incorporation avoided? (the index test does not form part of the reference standard) | This should be 'Yes' for all studies, as the reference standard is defined in the inclusion criteria as microscopy or PCR. |
| Are the reference standard test results blinded? |
|
| Are the index test results blinded? |
|
| Were uninterpretable results reported? |
We reported how many results were uninterpretable (of the total) and how these were handled in the analysis. |
| Were any withdrawals explained? |
We reported how many participants were excluded from the analysis. |
Appendix 4. Direct comparisons between test types
| Study | Sensitivity (true positives/malaria cases) (%) | Difference (95% CI) (%) | P value | Specificity (true negatives/non‐cases) (%) | Difference (95% CI) (%) | P value | ||
| Type 2 versus Type 3 | ||||||||
| Type 2 | Type 3 | Type 2 | Type 3 | |||||
| 85 (209/246) | 85 (209/246) | 0 (‐6.3 to 6.3) | P = 1.00 | 96 (2052/2137) | 96 (2060/2137) | 0 (‐1.5 to 0.8 ) | P = 0.58 | |
| 80 (4/5) | 60 (3/5) | 20.0 (‐35.4 to 75.4) | P = 1.00 | 99 (716/722) | 99 (718/722) | 0 (‐1.1 to 0.6) | P = 0.75 | |
| 68 (39/57) | 77 (44/57) | ‐8.8 (‐25.0 to 7.5) | P = 0.40 | 98 (308/315) | 98 (309/315) | 0 (‐2.5 to 1.9) | P = 1.00 | |
| Type 2 versus Type 4 | ||||||||
| Type 2 | Type 4 | Type 2 | Type 4 | |||||
| 75 (217/291) | 88 (256/292) | ‐13.1 (‐19.4 to ‐6.8) | P < 0.001 | 100 (604/605) | 99 (598/604) | 0.8 (0 to 1.7) | P = 0.07 | |
| Type 3 versus Type 4 | ||||||||
| Type 3 | Type 4 | Type 3 | Type 4 | |||||
| 71 (5/7) | 90 26/29 | ‐18.2 (‐53.5 to 17.0) | P = 0.24 | 100 (23/23) | 100 (111/111) | 0 (Not estimable) | Not estimable | |
| 73 (11/15) | 80 (12/15) | ‐6.7 (‐36.8 to 23.5) | P = 1.0 | 98 (175/179) | 97 (175/180) | 0.50 (‐2.7 to 3.8) | P = 1.0 | |
We presented the difference in sensitivities and specificities between test types compared within each study as percentages. If a study evaluated more than one commercial brand of a test type on the same patients against the same reference standard, we randomly selected one brand for the comparison of test types.
Appendix 5. Comparison of microscopy and PCR reference standards for non‐falciparum infections
| Test type, RDT brand | Microscopy | PCR | ||||||
| Number of studies | Number of participants | Sensitivity (95% CI) (%) | Specificity (95% CI) (%) | Number of studies | Number of participants | Sensitivity (95% CI) (%) | Specificity (95% CI) (%) | |
| Type 3, CareStart Pf/Pan | 4 | 3544 | 74 (45 to 91) | 99 (96 to 100) | 1 | 179 | 91 (81 to 97) | 100 (97 to 100) |
| Type 3, Parascreen | 14 | 5407 | 79 (67 to 88) | 98 (98 to 99) | 2 | 659 | 84 (70 to 92) | 99 (97 to 100) |
| Type 3, One Step Malaria Pf/Pan | 1 | 606 | 70 (58 to 81) | 99 (98 to 100) | 1 | 606 | 72 (60 to 82) | 97 (95 to 98) |
| Type 3, SD Malaria Antigen Bioline | 4 | 3769 | 80 (73 to 85) | 99 (98 to 100) | 1 | 196 | 64 (41 to 83) | 99 (97 to 100) |
| Type 4, OptiMAL | 6 | 1843 | 90 (85 to 93) | 98 (97 to 99) | 1 | 313 | 88 (64 to 99) | 98 (96 to 99) |


Methodological quality graph: review authors' judgements about each methodological quality item presented as percentages across all included studies.

Forest plot of commercial brands of Type 2 tests for detection of non‐falciparum species (verified with microscopy). We ordered studies by continent, age group and study identifier.

Summary ROC plot of Type 2 tests for detection of non‐falciparum species (verified with microscopy). The black solid circle corresponds to the summary estimate of sensitivity and specificity, and is shown with a 95% confidence region.

Forest plot of commercial brands of Type 3 tests for detection of non‐falciparum species (verified with microscopy). We ordered studies by continent, age group and study identifier.
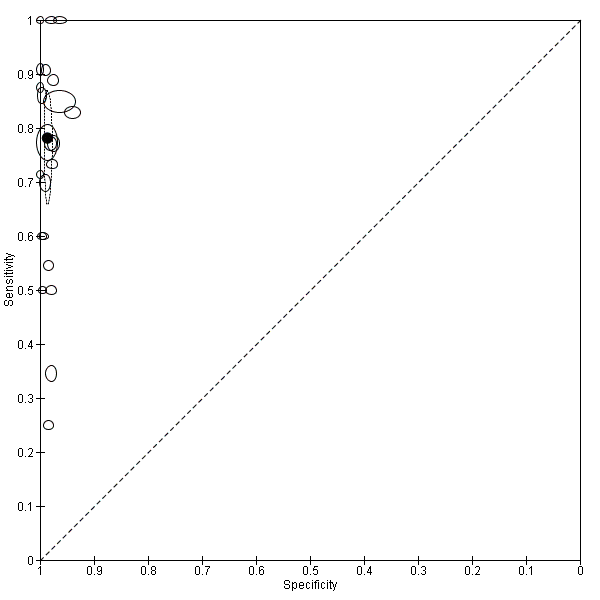
Summary ROC plot of Type 3 tests for detection of non‐falciparum species (verified with microscopy). The black solid circle corresponds to the summary estimate of sensitivity and specificity, and is shown with a 95% confidence region.

Forest plot of commercial brands of Type 4 tests for detection of non‐falciparum species (verified with microscopy). We ordered studies by continent, age group and study identifier.

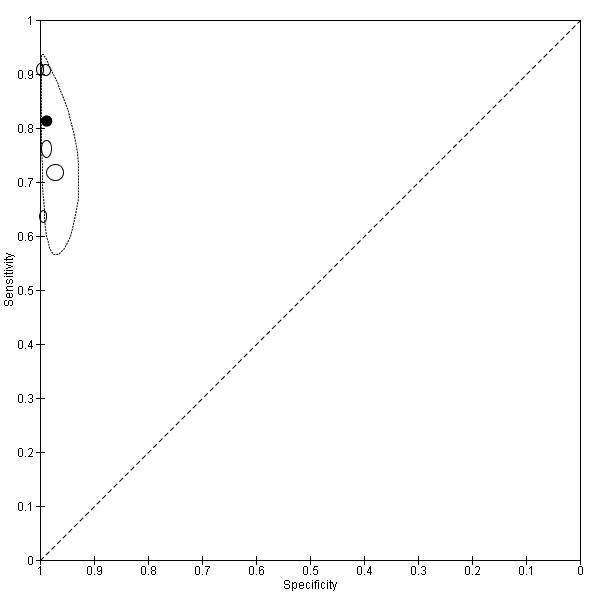
Summary ROC plot of Type 4 tests for detection of non‐falciparum species (verified with microscopy). The black circle corresponds to the summary estimate of sensitivity and specificity, and is shown with a 95% confidence region.

Forest plot of Type 2, Type 3 and Type 4 tests for detection of non‐falciparum species (verified with microscopy). We ordered studies by continent, age group and study identifier.

Summary ROC plot comparing Type 2, Type 3 and Type 4 tests for detection of non‐falciparum species (verified with microscopy). The solid circles correspond to the summary estimates of sensitivity and specificity for each test type, and are shown with 95% confidence regions (dotted lines) and 95% prediction regions (dashed lines). The summary points for Type 2 and Type 3 and their 95% confidence regions are identical but the 95% prediction regions differ. The 95% prediction regions illustrate the extent of between study heterogeneity.
Summary ROC plot of Type 3 tests for detection of non‐falciparum species (verified with PCR). The solid circles correspond to the summary estimate of sensitivity and specificity, and is shown with a 95% confidence region.

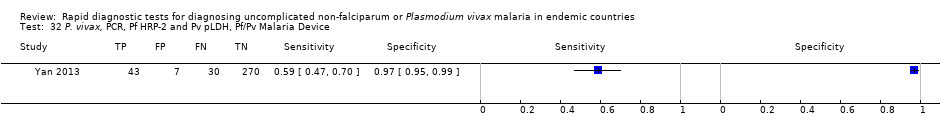
Forest plot of Pf HRP‐2 and Pv pLDH for detection of P. vivax (verified with microscopy). Studies are ordered by continent, age group and study identifier.

Summary ROC plot Pf HRP‐2 and Pv pLDH for detection of P. vivax (verified with microscopy). The black circle corresponds to the summary estimate of sensitivity and specificity, and is shown with a 95% confidence region.
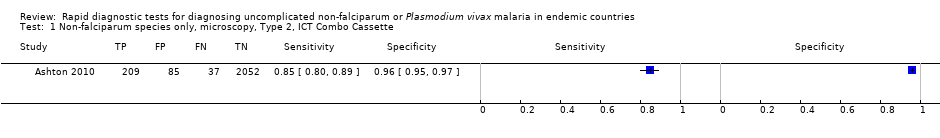
Non‐falciparum species only, microscopy, Type 2, ICT Combo Cassette.

Non‐falciparum species only, microscopy, Type 2, ICT Malaria Pf/Pv.

Non‐falciparum species only, microscopy, Type 2, NOW Malaria ICT.

Non‐falciparum species only, microscopy, Type 2, Malascan.

Non‐falciparum species only, microscopy, Type 2, VIKIA Ag Pf/Pan.

Non‐falciparum species only, microscopy, Type 2 (All).

Non‐falciparum species only, microscopy, Type 3, Parascreen.

Non‐falciparum species only, microscopy, Type 3, CareStart Pf/Pan.

Non‐falciparum species only, microscopy, Type 3, SD Malaria Antigen Bioline.

Non‐falciparum species only, microscopy, Type 3, First Response Malaria Combo.

Non‐falciparum species only, microscopy, Type 3, One Step Malaria Pf/Pan.
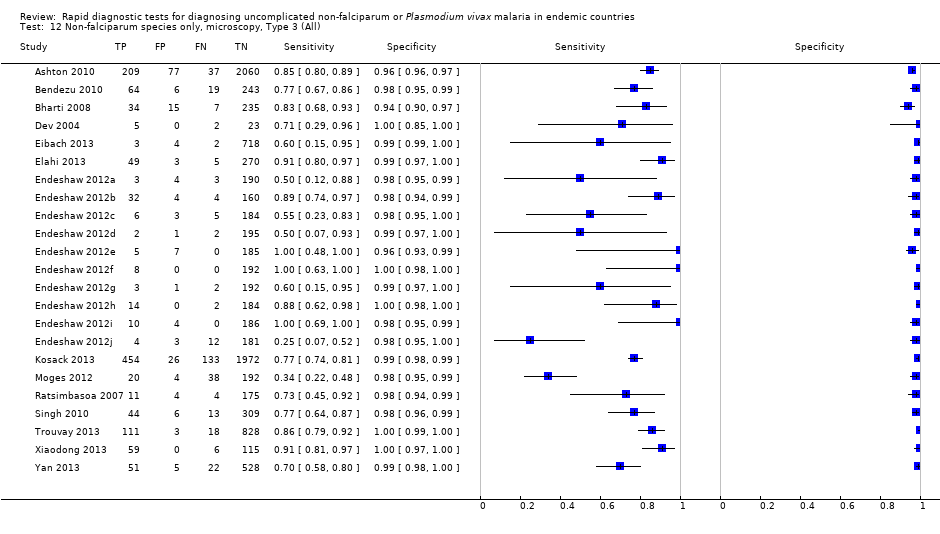
Non‐falciparum species only, microscopy, Type 3 (All).

Non‐falciparum species only, microscopy, Type 4, OptiMAL.

Non‐falciparum species only, microscopy, Type 4, OptiMAL‐IT.

Non‐falciparum species only, microscopy, Type 4, Carestart.

Non‐falciparum species only, microscopy, Type 4 (All).

Non‐falciparum species only, microscopy, Other Type, Malariagen Malaria.

Non‐falciparum species only, PCR, Type 3, CareStart Pf/Pan.

Non‐falciparum species only, PCR, Type 3, Parascreen.

Non‐falciparum species only, PCR, Type 3, One Step Malaria Pf/Pan.

Non‐falciparum species only, PCR, Type 3, SD Malaria Antigen Bioline.

Non‐falciparum species only, PCR, Type 3 (All).

Non‐falciparum species only, PCR, Type 4, OptiMAL (All).
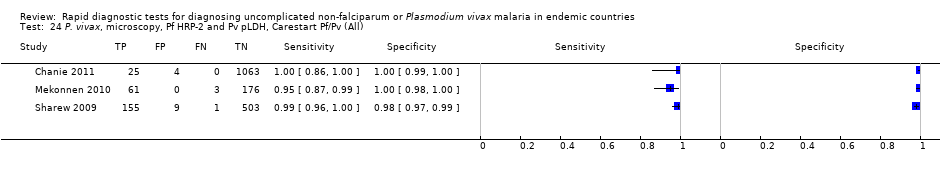
P. vivax, microscopy, Pf HRP‐2 and Pv pLDH, Carestart Pf/Pv (All).
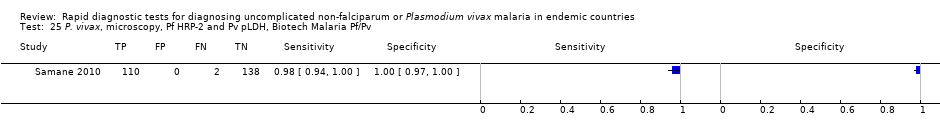
P. vivax, microscopy, Pf HRP‐2 and Pv pLDH, Biotech Malaria Pf/Pv.
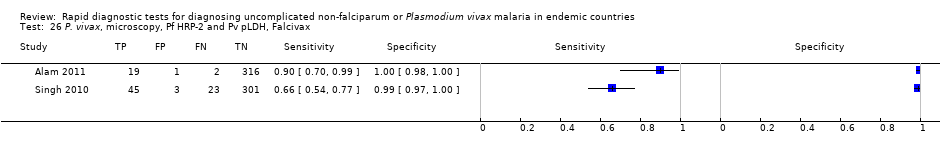
P. vivax, microscopy, Pf HRP‐2 and Pv pLDH, Falcivax.

P. vivax, microscopy, Pf HRp‐2 and Pv pLDH, Onsite Pf/Pv.

P. vivax, microscopy, Pf HRP‐2 and Pv pLDH, Pf/Pv Malaria Device.

P. vivax, microscopy, Pf HRP‐2 and Pv pLDH (All).
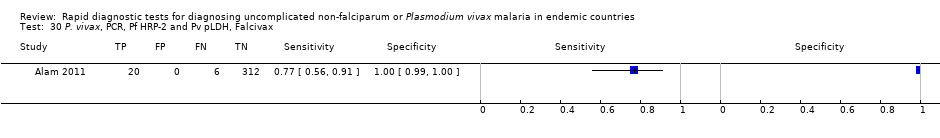
P. vivax, PCR, Pf HRP‐2 and Pv pLDH, Falcivax.

P. vivax, PCR, Pf HRP‐2 and Pv pLDH, OnSite Pf/Pv.
P. vivax, PCR, Pf HRP‐2 and Pv pLDH, Pf/Pv Malaria Device.

P. vivax, PCR, Pf HRP‐2 and Pv pLDH (All).

P. vivax, PCR, Type 6, PALUTOP (All).
| Patients/populations | People presenting with symptoms suggestive of uncomplicated malaria | |||||
| Prior testing | None | |||||
| Settings | Ambulatory healthcare settings in P. vivax,P. malariae or P. ovale malaria endemic areas in Asia, Africa and South America | |||||
| Index tests | Immunochromatography‐based rapid diagnostic tests (RDTs) for non‐falciparum malaria in the absence of P. falciparum co‐infection, or P. vivax malaria with or without other malaria species | |||||
| Reference standard | Conventional microscopy, polymerase chain reaction (PCR) | |||||
| Importance | Accurate and fast diagnosis allows appropriate and quick treatment for malaria to be provided | |||||
| Studies | 37 unique publications reporting 47 studies (22,862 participants) | |||||
| Quality concerns | Poor reporting of patient characteristics, sampling method and reference standard methods were common concerns | |||||
| Test type | Quantity of evidence Number of evaluations (malaria cases/participants) | Average sensitivity (95% CI) | Average specificity (95% CI) | Prevalence (%) | Consequences in a cohort of 1000 | |
| Missed cases | False positives | |||||
| Target condition (reference standard): non‐falciparum malaria (microscopy) | ||||||
| Type 2 HRP‐2 (P. falciparum specific) and aldolase (pan‐specific) | 11 (958/6879) | 78% (73% to 82%) | 99% (97% to 99%) | 5 | 11 | 10 |
| 15 | 33 | 9 | ||||
| 30 | 66 | 7 | ||||
| Type 3 HRP‐2 (P. falciparum specific) and pLDH (pan‐specific) | 23 (1537/11,234) | 78% (69% to 84%) | 99% (98% to 99%) | 5 | 11 | 10 |
| 15 | 33 | 9 | ||||
| 30 | 66 | 7 | ||||
| Type 4 pLDH (P. falciparum specific) and pLDH (pan‐specific) | 10 (986/3831) | 89% (79% to 95%) | 98% (97% to 99%) | 5 | 6 | 19 |
| 15 | 17 | 17 | ||||
| 30 | 33 | 14 | ||||
| Target condition (reference standard): non‐falciparum malaria (PCR) | ||||||
| Type 3 HRP‐2 (P. falciparum specific) and pLDH (pan‐specific) | 5 (300/1639) | 81% (72% to 88%) | 99% (97% to 99%) | 5 | 10 | 10 |
| 15 | 29 | 9 | ||||
| 30 | 57 | 7 | ||||
| Target condition (reference standard): P.vivax with or without other malaria species (microscopy) | ||||||
| HRP‐2 (P. falciparum specific) and pLDH (P. vivax‐specific) | 8 (580/3682) | 95% (86% to 99%) | 99% (99% to 100%) | 5 | 3 | 10 |
| 15 | 8 | 9 | ||||
| 30 | 15 | 7 | ||||
| Conclusions: The majority of studies evaluated RDTs which are designed to differentiate falciparum malaria from non‐falciparum malaria, but cannot differentiate between different non‐falciparum species or identify non‐falciparum malaria species within a mixed infection. In these types of tests, specificity for non‐falciparum malaria in the absence ofP. falciparum infection was high, but sensitivity was low, tests missing between 11% and 22% of non‐falciparum cases. RDTs which are designed to detect P. vivax specifically, whether alone or part of a mixed infection, were more accurate with tests missing less than 5% of P. vivax cases. This review can help decision‐making about which RDT to use, in combination with other published information about in vitro test performance and stability in the field. | ||||||
| Type of test | Antigen combinations | Possible results |
| Type 1 | HRP‐2 (P. falciparum specific) | No Pf; Pf; invalid |
| Type 2 | HRP‐2 (P. falciparum specific) and aldolase (pan‐specific) | No malaria; Pf or mixed; Pv, Pf, or Pm; invalid |
| Type 3 | HRP‐2 (P. falciparum specific) and pLDH (pan‐specific) | No malaria; Pf or mixed; Pv, Pf, or Pm; invalid |
| Type 4 | pLDH (P. falciparum specific) and pLHD (pan‐specific) | No malaria; Pf or mixed; Pv, Pf, or Pm; invalid |
| Type 5 | pLDH (P. falciparum specific) and pLHD (P. vivax‐specific) | No malaria; Pf; Pv; Pf and Pv; invalid |
| Type 6 | HRP‐2 (P. falciparum specific), pLHD (pan‐specific) and pLDH (P. vivax specific) | No malaria; Pf and Pv ± Po and/or Pm; Pf ± Po and/or Pm; Pv ± Po or Pm; Po or Pm; invalid |
| Type 7 | Aldolase (pan‐specific) | No malaria; Pf, Pv, Po,or Pm; invalid |
| Other | HRP‐2 (P. falciparum specific) and pLDH (P. vivax specific) | No malaria; Pf; Pv; Pf and Pv; invalid |
| Zone | Endemic malaria parasites | Geographic area | Appropriate test type |
| 1 | P. falciparum only or other species almost always as a mixed infection | Most of sub‐Saharan Africa; lowland Papua New Guinea | Tests using HRP‐2 to detect P. falciparum only (Type 1) |
| 2 | Both P. falciparum and P. vivax, most commonly as a single species
| Asia and the Americas; Ethiopian highlands
| Combination RDTs which detect all species and distinguish between P. falciparum and P. vivax (Types 2 to 6) |
| 3 | Non‐falciparum only
| Vivax‐only areas of East Asia and Central Asia; some highland areas elsewhere | Pan‐specific or vivax‐specific RDTs (Type 7; Pan‐pLDH only; vivax‐pLDH only) |
| Type of RDT | Number of study cohorts (test evaluations) by reference standard | |
| Microscopy | PCR | |
| Non‐falciparum species in the absence of P. falciparum | ||
| Type 2 | 11 (11) | 0 (0) |
| Type 3 | 23 (25) | 5 (5) |
| Type 4 | 10 (11) | 1 (1) |
| Other type | 1 (1) | 0 (0) |
| P. vivax | ||
| Pf HRP2 and Pv pLDH | 8 (9) | 2 (3) |
| Type 6 | 0 (0) | 1 (1) |
| Study | Test | Number of false negatives | % false negatives indicating 'no malaria' | % false negatives indicating 'P. falciparum' |
| Type 2 tests | ||||
| ICT Combo | 37 | 22 | 78 | |
| ICT Malaria trial 1 | 16 | 13 | 88 | |
| ICT Malaria trial 2 | 6 | 67 | 33 | |
| ICT Malaria Pf/Pv | 29 | 100 | 0 | |
| ICT Malaria Pf/Pv | 3 | 67 | 33 | |
| ICT Malaria Pf/Pv | 13 | 62 | 38 | |
| Malascan | 18 | 67 | 33 | |
| ICT Malaria Pf/Pv | 8 | 75 | 25 | |
| NOW malaria ICT | 72 | 67 | 33 | |
| ICT Malaria Pf/Pv | 9 | 67 | 33 | |
| OptiMAL‐IT | 34 | 74 | 26 | |
| Median (range) | 67 (13 to 100) | 33 (0 to 88) | ||
| Pooled estimate (95% CI)* | 65 (43 to 81) | 35 (19 to 57) | ||
| Type 3 tests | ||||
| Carestart | 37 | 22 | 78 | |
| Parascreen | 43 | 14 | 86 | |
| Parascreen | 19 | 84 | 16 | |
| First response | 7 | 100 | 0 | |
| Diamed OptiMAL | 3 | 100 | 0 | |
| CareStart | 3 | 100 | 0 | |
| Parascreen | 5 | 60 | 40 | |
| SD Bioline | 133 | 89 | 11 | |
| Carestart | 38 | 89 | 11 | |
| SD Malaria Antigen Bioline | 4 | 100 | 0 | |
| Parascreen | 13 | 54 | 46 | |
| First response | 9 | 33 | 67 | |
| ParaHIT Total | 48 | 92 | 8 | |
| SD Malaria Ag Pf/Pan | 18 | 78 | 22 | |
| Pf/Pan Device | 24 | 25 | 75 | |
| Median (range) | 84 (14 to 100) | 16 (0 to 86) | ||
| Pooled estimate (95% CI) | 74 (52 to 88) | 26 (12 to 48) | ||
| Type 4 tests | ||||
| OptiMAL‐IT | 0 | 0 | 0 | |
| OptiMAL | 3 | 100 | 0 | |
| SD Malaria | 2 | 100 | 0 | |
| OptiMAL | 23 | 100 | 0 | |
| OptiMAL‐IT | 30 | 100 | 0 | |
| OptiMAL‐IT | 26 | 65 | 35 | |
| OptiMAL‐IT | 2 | 100 | 0 | |
| Carestart Malaria | 3 | 33 | 67 | |
| OptiMAL (field) | 0 | 0 | 0 | |
| OptiMAL | 3 | 100 | 0 | |
| OptiMAL | 13 | 77 | 23 | |
| Median (range) | 100 (0 to 100) | 0 (0 to 67) | ||
| Pooled estimate (95% CI) | 87 (79 to 92) | 13 (8 to 21) | ||
| *The pooled estimates of the percentage of false negatives indicating 'no malaria' and the percentage of false negatives indicating 'P. falciparum' were computed by using a random effects logistic regression model for Type 2 and Type 3. A fixed effects logistic regression model was used for Type 4. This table shows participants with non‐falciparum malaria monoinfection identified by microscopy who were negative by non‐falciparum monoinfection by RDT, by whether the RDT incorrectly identified the participant as not having malaria, or as having P. falciparum malaria. | ||||
| RDT Type | Study cohort | Participants | Malaria cases | Pooled sensitivity (95% CI) (%) | Pooled specificity (95% CI) (%) | Test1 |
| Type 2 | 11 | 6879 | 958 | 78 (73 to 82) | 99 (97 to 99) | P = 0.008 |
| Type 3 | 23 | 11,234 | 1537 | 78 (69 to 85) | 99 (98 to 99) | |
| Type 4 | 10 | 3831 | 986 | 90 (79 to 95) | 98 (97 to 99) | |
| Other type | 1 | 262 | 12 | 92 (62 to 100) | 95 (92 to 98) | |
| 1Likelihood ratio test for evidence of a difference in sensitivity or specificity, or both, between Types 2, 3, and 4. *Only one test brand (randomly selected) from each cohort is included in the analysis of each type. | ||||||
| Ratio of sensitivity (95% CI), P value for comparison Ratio of specificity (95% CI), P value for comparison |
| Type 2 | Type 3 | |
| Studies (participants) | 11 (6879) | 23 (11,234) | ||
|
| Studies (participants) | Sensitivity (95% CI) Specificity (95% CI) | 78 (73 to 82) 99 (97 to 99) | 78 (69 to 84) 99 (98 to 99) |
| Type 2 | 11 (6879) | 78 (73 to 82) 99 (97 to 99) | ‐ | ‐ |
| Type 3 | 23 (11,234) | 78 (69 to 84) 99 (98 to 99) | 1.00 (0.89 to 1.12), P = 1.00 1.00 (0.99 to 1.01), P = 0.87 | ‐ |
| Type 4 | 10 (3831) | 90 (79 to 95) 98 (97 to 99) | 0.87 (0.78 to 0.96), P = 0.01 1.00 (0.99 to 1.02), P = 0.52 | 0.87 (0.76 to 0.99), P = 0.03 1.01 (1.00 to 1.02), P = 0.29 |
| We computed the ratio of sensitivities and specificities by division of the sensitivity and specificity for the column by the sensitivity and specificity for the row. If the ratio of sensitivities is greater than one, the sensitivity of the test for the column is higher than that for the row; if less than one, the sensitivity of the test in the row is higher than in the column. The same applies to the ratio of specificities. | ||||
| Test | No. of studies | No. of participants |
| 1 Non‐falciparum species only, microscopy, Type 2, ICT Combo Cassette Show forest plot | 1 | 2383 |
| 2 Non‐falciparum species only, microscopy, Type 2, ICT Malaria Pf/Pv Show forest plot | 7 | 3151 |
| 3 Non‐falciparum species only, microscopy, Type 2, NOW Malaria ICT Show forest plot | 1 | 246 |
| 4 Non‐falciparum species only, microscopy, Type 2, Malascan Show forest plot | 1 | 372 |
| 5 Non‐falciparum species only, microscopy, Type 2, VIKIA Ag Pf/Pan Show forest plot | 1 | 727 |
| 6 Non‐falciparum species only, microscopy, Type 2 (All) Show forest plot | 11 | 6879 |
| 7 Non‐falciparum species only, microscopy, Type 3, Parascreen Show forest plot | 14 | 5407 |
| 8 Non‐falciparum species only, microscopy, Type 3, CareStart Pf/Pan Show forest plot | 4 | 3544 |
| 9 Non‐falciparum species only, microscopy, Type 3, SD Malaria Antigen Bioline Show forest plot | 4 | 3769 |
| 10 Non‐falciparum species only, microscopy, Type 3, First Response Malaria Combo Show forest plot | 2 | 663 |
| 11 Non‐falciparum species only, microscopy, Type 3, One Step Malaria Pf/Pan Show forest plot | 1 | 606 |
| 12 Non‐falciparum species only, microscopy, Type 3 (All) Show forest plot | 23 | 11234 |
| 13 Non‐falciparum species only, microscopy, Type 4, OptiMAL Show forest plot | 6 | 1843 |
| 14 Non‐falciparum species only, microscopy, Type 4, OptiMAL‐IT Show forest plot | 4 | 1987 |
| 15 Non‐falciparum species only, microscopy, Type 4, Carestart Show forest plot | 1 | 195 |
| 16 Non‐falciparum species only, microscopy, Type 4 (All) Show forest plot | 10 | 3831 |
| 17 Non‐falciparum species only, microscopy, Other Type, Malariagen Malaria Show forest plot | 1 | 262 |
| 18 Non‐falciparum species only, PCR, Type 3, CareStart Pf/Pan Show forest plot | 1 | 178 |
| 19 Non‐falciparum species only, PCR, Type 3, Parascreen Show forest plot | 2 | 659 |
| 20 Non‐falciparum species only, PCR, Type 3, One Step Malaria Pf/Pan Show forest plot | 1 | 606 |
| 21 Non‐falciparum species only, PCR, Type 3, SD Malaria Antigen Bioline Show forest plot | 1 | 196 |
| 22 Non‐falciparum species only, PCR, Type 3 (All) Show forest plot | 5 | 1639 |
| 23 Non‐falciparum species only, PCR, Type 4, OptiMAL (All) Show forest plot | 1 | 313 |
| 24 P. vivax, microscopy, Pf HRP‐2 and Pv pLDH, Carestart Pf/Pv (All) Show forest plot | 3 | 2000 |
| 25 P. vivax, microscopy, Pf HRP‐2 and Pv pLDH, Biotech Malaria Pf/Pv Show forest plot | 1 | 250 |
| 26 P. vivax, microscopy, Pf HRP‐2 and Pv pLDH, Falcivax Show forest plot | 2 | 710 |
| 27 P. vivax, microscopy, Pf HRp‐2 and Pv pLDH, Onsite Pf/Pv Show forest plot | 2 | 710 |
| 28 P. vivax, microscopy, Pf HRP‐2 and Pv pLDH, Pf/Pv Malaria Device Show forest plot | 1 | 350 |
| 29 P. vivax, microscopy, Pf HRP‐2 and Pv pLDH (All) Show forest plot | 8 | 3682 |
| 30 P. vivax, PCR, Pf HRP‐2 and Pv pLDH, Falcivax Show forest plot | 1 | 338 |
| 31 P. vivax, PCR, Pf HRP‐2 and Pv pLDH, OnSite Pf/Pv Show forest plot | 1 | 338 |
| 32 P. vivax, PCR, Pf HRP‐2 and Pv pLDH, Pf/Pv Malaria Device Show forest plot | 1 | 350 |
| 33 P. vivax, PCR, Pf HRP‐2 and Pv pLDH (All) Show forest plot | 2 | 688 |
| 34 P. vivax, PCR, Type 6, PALUTOP (All) Show forest plot | 1 | 313 |