Long‐acting muscarinic antagonists (LAMA) added to inhaled corticosteroids (ICS) versus the same dose of ICS alone for adults with asthma
Appendices
Appendix 1. Sources and search methods for the Cochrane Airways Group Specialised Register (CAGR)
Electronic searches: core databases
| Database | Frequency of search |
| CENTRAL | Monthly |
| MEDLINE (Ovid) | Weekly |
| EMBASE (Ovid) | Weekly |
| PsycINFO (Ovid) | Monthly |
| CINAHL (EBSCO) | Monthly |
| AMED (EBSCO) | Monthly |
Handsearches: core respiratory conference abstracts
| Conference | Years searched |
| American Academy of Allergy, Asthma and Immunology (AAAAI) | 2001 onwards |
| American Thoracic Society (ATS) | 2001 onwards |
| Asia Pacific Society of Respirology (APSR) | 2004 onwards |
| British Thoracic Society Winter Meeting (BTS) | 2000 onwards |
| Chest Meeting | 2003 onwards |
| European Respiratory Society (ERS) | 1992, 1994, 2000 onwards |
| International Primary Care Respiratory Group Congress (IPCRG) | 2002 onwards |
| Thoracic Society of Australia and New Zealand (TSANZ) | 1999 onwards |
MEDLINE search strategy used to identify trials for the CAGR
Asthma search
1. exp Asthma/
2. asthma$.mp.
3. (antiasthma$ or anti‐asthma$).mp.
4. Respiratory Sounds/
5. wheez$.mp.
6. Bronchial Spasm/
7. bronchospas$.mp.
8. (bronch$ adj3 spasm$).mp.
9. bronchoconstrict$.mp.
10. exp Bronchoconstriction/
11. (bronch$ adj3 constrict$).mp.
12. Bronchial Hyperreactivity/
13. Respiratory Hypersensitivity/
14. ((bronchial$ or respiratory or airway$ or lung$) adj3 (hypersensitiv$ or hyperreactiv$ or allerg$ or insufficiency)).mp.
15. ((dust or mite$) adj3 (allerg$ or hypersensitiv$)).mp.
16. or/1‐15
Filter to identify RCTs
1. exp "clinical trial [publication type]"/
2. (randomised or randomised).ab,ti.
3. placebo.ab,ti.
4. dt.fs.
5. randomly.ab,ti.
6. trial.ab,ti.
7. groups.ab,ti.
8. or/1‐7
9. Animals/
10. Humans/
11. 9 not (9 and 10)
12. 8 not 11
The MEDLINE strategy and RCT filter are adapted to identify trials in other electronic databases.
Appendix 2. Search strategy to identify relevant trials from the CAGR
#1 AST:MISC1
#2 MeSH DESCRIPTOR Asthma Explode All
#3 asthma*:ti,ab
#4 #1 or #2 or #3
#5 MeSH DESCRIPTOR Adrenal Cortex Hormones
#6 inhal* NEAR (corticosteroid* or steroid* or glucocorticoid*)
#7 beclomethasone* or beclometasone* OR triamcinolone* OR fluticasone* OR budesonide* OR betamethasone* OR flunisolide* OR ciclesonide* OR mometasone*
#8 ICS:TI,AB
#9 #5 or #6 or #7 or #8
#10 Muscarinic* NEXT Antagonist*
#11 LAMA:TI,AB
#12 Glycopyrronium*
#13 NVA237
#14 Seebri OR Breezhaler
#15 Aclidinium*
#16 LAS34273
#17 Turdorza or Pressair or Eklira or Genuair
#18 tiotropium*
#19 Spiriva
#20 umeclidinium*
#21 GSK573719
#22 #10 or #11 or #12 or #13 or #14 or #15 or #16 or #17 or #18 or #19 or #20 or #21
#23 #4 and #9 and #22
[Note: In search line #1, MISC1 denotes the field in which the reference has been coded for condition, in this case, asthma.]

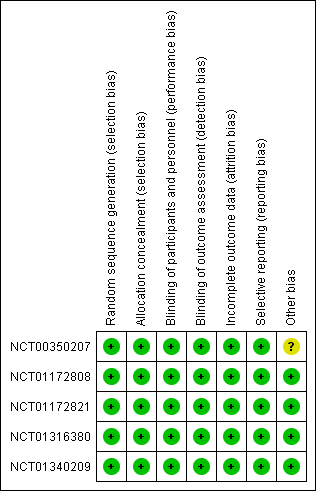
Risk of bias summary: review authors' judgements about each risk of bias item for each included study.

Cates plot showing the absolute effect for the primary outcome.
In the control group (ICS alone), 80 out of 1000 people had exacerbations requiring oral corticosteroids over 21 weeks, compared with 53 out of 1000 people for the intervention group (95% CI 38 to 74)(LAMA add‐on). As such, in this time period, 27 fewer people taking LAMA add‐on would have had an exacerbation requiring oral corticosteroids than if they continued taking ICS alone.
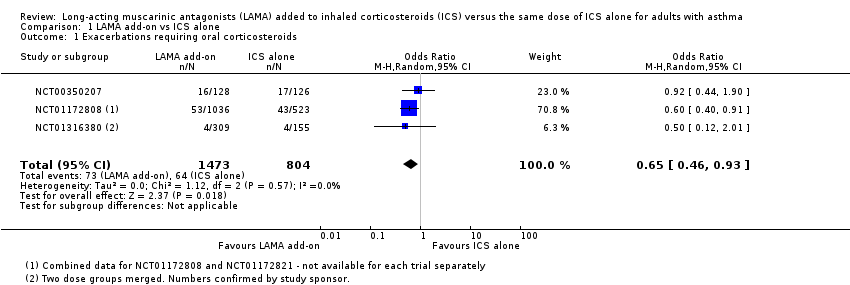
Comparison 1 LAMA add‐on vs ICS alone, Outcome 1 Exacerbations requiring oral corticosteroids.

Comparison 1 LAMA add‐on vs ICS alone, Outcome 2 Quality of life (AQLQ).
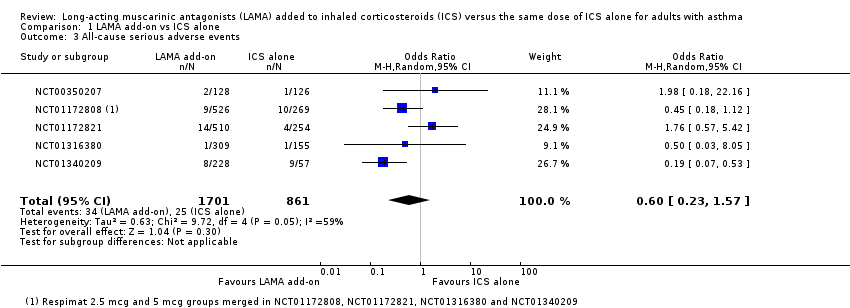
Comparison 1 LAMA add‐on vs ICS alone, Outcome 3 All‐cause serious adverse events.
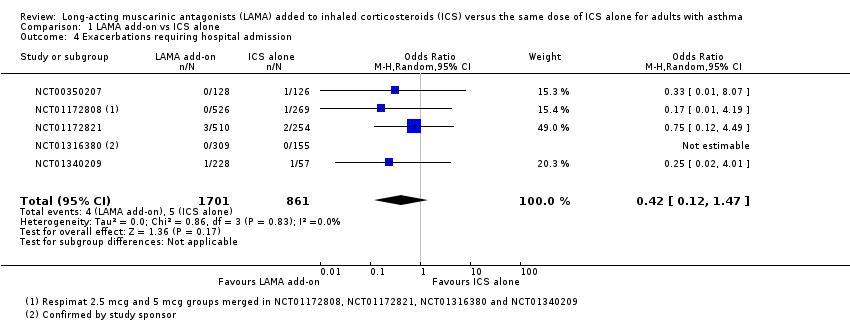
Comparison 1 LAMA add‐on vs ICS alone, Outcome 4 Exacerbations requiring hospital admission.

Comparison 1 LAMA add‐on vs ICS alone, Outcome 5 Trough FEV1 (litres, change from baseline).

Comparison 1 LAMA add‐on vs ICS alone, Outcome 6 Peak FEV1 (litres, change from baseline).

Comparison 1 LAMA add‐on vs ICS alone, Outcome 7 Trough PEF (litres/min, change from baseline).

Comparison 1 LAMA add‐on vs ICS alone, Outcome 8 Trough FVC (litres, change from baseline).

Comparison 1 LAMA add‐on vs ICS alone, Outcome 9 Peak FVC (litres, change from baseline).

Comparison 1 LAMA add‐on vs ICS alone, Outcome 10 Asthma control (ACQ).
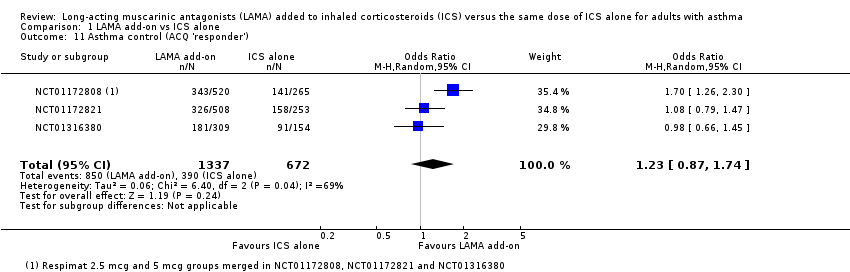
Comparison 1 LAMA add‐on vs ICS alone, Outcome 11 Asthma control (ACQ 'responder').

Comparison 1 LAMA add‐on vs ICS alone, Outcome 12 Any adverse events.

Comparison 1 LAMA add‐on vs ICS alone, Outcome 13 Adverse events classified as asthma.

Comparison 2 Subgroup analyses, Outcome 1 All‐cause serious adverse events ‐ by study duration.

Comparison 2 Subgroup analyses, Outcome 2 Exacerbations requiring oral corticosteroids ‐ by Respimat dose.
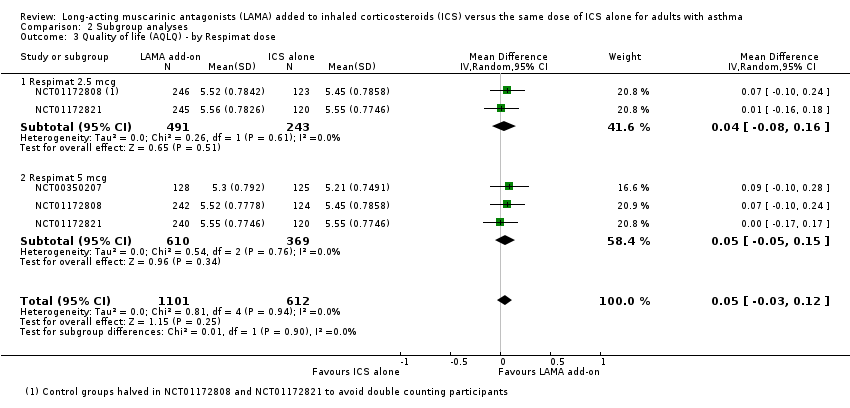
Comparison 2 Subgroup analyses, Outcome 3 Quality of life (AQLQ) ‐ by Respimat dose.

Comparison 2 Subgroup analyses, Outcome 4 All‐cause serious adverse events ‐ by Respimat dose.
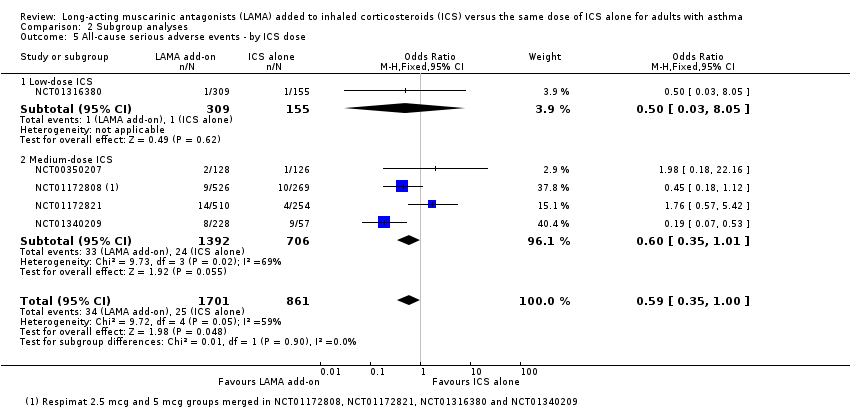
Comparison 2 Subgroup analyses, Outcome 5 All‐cause serious adverse events ‐ by ICS dose.

Comparison 3 Respimat 2.5 mcg vs 5 mcg, Outcome 1 Exacerbations requiring oral corticosteroids.

Comparison 3 Respimat 2.5 mcg vs 5 mcg, Outcome 2 Quality of life (AQLQ).
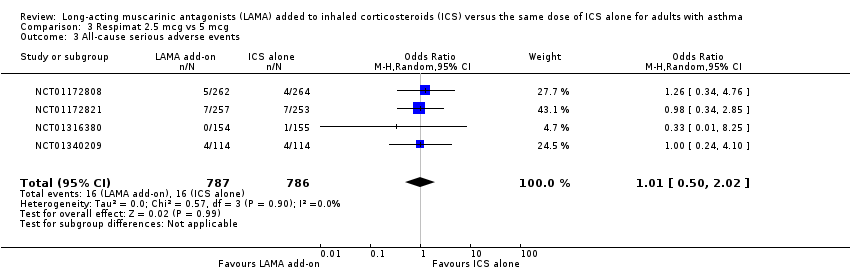
Comparison 3 Respimat 2.5 mcg vs 5 mcg, Outcome 3 All‐cause serious adverse events.
| LAMA add‐on compared with ICS alone for adults with asthma | ||||||
| Patient or population: adults with asthma not well controlled on ICS alone Time point: weighted mean duration of the studies included in each analysis | ||||||
| Outcomes | Illustrative comparative risks* (95% CI) | Relative effect | Number of participants | Quality of the evidence | Comments | |
| Assumed risk | Corresponding risk | |||||
| ICS alone | LAMA add‐on | |||||
| Exacerbations requiring oral corticosteroids (OCS) 21 weeks | 80 per 1000 | 53 per 1000 | OR 0.65 | 2277 | ⊕⊕⊕⊕ | LAMA benefit |
| Quality of life (AQLQ) 1 = severely impaired; 7 = not impaired at all 23 weeks | Mean AQLQ score in the control group was 5.44 | Mean AQLQ score in the intervention group was 0.05 better (0.03 worse to 0.12 better) | ‐ | 1713 | ⊕⊕⊕⊕ | MCID = 0.5 |
| All‐cause serious adverse events 24 weeks | 29 per 1000 | 18 per 1000 | OR 0.60 | 2562 | ⊕⊕⊝⊝ | |
| Exacerbations requiring hospital admission 24 weeks | 6 per 1000 | 2 per 1000 | OR 0.42 | 2562 | ⊕⊕⊕⊝ | |
| Lung function ‐ trough FEV1 (L, change from baseline) 24 weeks | Mean change in trough FEV1 in the control group was ‐0.02 L | Mean trough FEV1 in the intervention group was 0.14 higher (0.10 higher to 0.17 higher) | ‐ | 2459 | ⊕⊕⊕⊕ | |
| Asthma control (ACQ) 0 = no impairment; 21 weeks | Mean ACQ total in the control group was 1.47 | Mean ACQ total in the intervention group was 0.08 better (0.19 better to 0.03 worse) | ‐ | 1916 | ⊕⊕⊕⊝ | MCID = 0.5 |
| Any adverse events 24 weeks | 506 per 1000 | 493 per 1000 | OR 0.95 | 2562 | ⊕⊕⊝⊝ | |
| *The basis for the assumed risk (e.g. median control group risk across studies) is provided in footnotes. The corresponding risk (and its 95% confidence interval) is based on the assumed risk in the comparison group and the relative effect of the intervention (and its 95% CI). †Only pooled data from the twin trials were available for this outcome and had to be entered under one study ID. | ||||||
| GRADE Working Group grades of evidence. | ||||||
| aConfidence interval does not exclude the possibility of benefit from ICS alone, but both confidence limits are well below the established MCID of 0.5 on these scales (no downgrade). bI2 = 59%, P value = 0.05 (‐1 inconsistency). cOne study in this analysis allowed participants to continue taking combination ICS/LABA; therefore, some results were derived from participants who do not meet all inclusion criteria for this review. The study accounted for a maximum of 26.7% of the analysis weight, and mostly less than 20% (‐1 indirectness). dSome statistical heterogeneity but not statistically significant (no downgrade). eI2 = 72%, P value = 0.03 (‐1 inconsistency). fSome studies reported "adverse events (all)" as those not classed as serious; therefore, this figure taken alone may not equal adverse events of all severities. In addition, it was sometimes possible to extract adverse event (AE) data from clinicaltrials.gov only when AEs occurring in > 5% of participants were listed (‐1 indirectness). | ||||||
| Study ID | Country | Total N | Duration (weeks) | Blinding | Randomly assigned groups | Age (mean, y) | % pred FEV1 |
| International | 254 | 16 | DB, DD | 1) Tiotropium Respimat 5 mcg daily 2) Placebo (ICS alone) | 43.5 44.0 | 74.1 75.3 | |
| International | 795 | 24 | DB, DD | 1) Tiotropium Respimat 2.5 mcg daily 2) Tiotropium Respimat 5 mcg daily 3) Placebo (ICS alone) | 43.7 44.4 42.5 | 73.1 72.2 73.0 | |
| International | 764 | 24 | DB, DD | 1) Tiotropium Respimat 2.5 mcg daily 2) Tiotropium Respimat 5 mcg daily 3) Placebo (ICS alone) | 43.0 44.3 43.0 | 72.5 72.2 73.0 | |
| International | 465 | 12 | DB, DD | 1) Tiotropium Respimat 2.5 mcg daily 2) Tiotropium Respimat 5 mcg daily 3) Placebo (ICS alone) | 43.8 41.9 42.8 | 91.3* 93.2 91.5 | |
| Japan | 285 | 52 | DB, DD | 1) Tiotropium Respimat 2.5 mcg daily 2) Tiotropium Respimat 5 mcg daily 3) Placebo (ICS alone) | 44.7 42.6 47.8 | N/R N/R N/R | |
| Total N is the number randomly assigned to the groups of interest for this review. Age and % predicted FEV1 are presented as mean values. DB = double‐blind; DD = double‐dummy; NR = not reported; OL = open label. * Values here are post‐bronchodilator. | |||||||
| Outcome or subgroup title | No. of studies | No. of participants | Statistical method | Effect size |
| 1 Exacerbations requiring oral corticosteroids Show forest plot | 3 | 2277 | Odds Ratio (M‐H, Random, 95% CI) | 0.65 [0.46, 0.93] |
| 2 Quality of life (AQLQ) Show forest plot | 3 | 1713 | Mean Difference (IV, Random, 95% CI) | 0.05 [‐0.03, 0.12] |
| 3 All‐cause serious adverse events Show forest plot | 5 | 2562 | Odds Ratio (M‐H, Random, 95% CI) | 0.60 [0.23, 1.57] |
| 4 Exacerbations requiring hospital admission Show forest plot | 5 | 2562 | Odds Ratio (M‐H, Random, 95% CI) | 0.42 [0.12, 1.47] |
| 5 Trough FEV1 (litres, change from baseline) Show forest plot | 5 | 2459 | Mean Difference (IV, Random, 95% CI) | 0.14 [0.10, 0.17] |
| 6 Peak FEV1 (litres, change from baseline) Show forest plot | 3 | 1923 | Mean Difference (IV, Random, 95% CI) | 0.19 [0.15, 0.23] |
| 7 Trough PEF (litres/min, change from baseline) Show forest plot | 5 | 2456 | Mean Difference (IV, Random, 95% CI) | 28.07 [22.51, 33.64] |
| 8 Trough FVC (litres, change from baseline) Show forest plot | 4 | 2002 | Mean Difference (IV, Random, 95% CI) | 0.09 [0.05, 0.13] |
| 9 Peak FVC (litres, change from baseline) Show forest plot | 3 | 1922 | Mean Difference (IV, Random, 95% CI) | 0.11 [0.08, 0.15] |
| 10 Asthma control (ACQ) Show forest plot | 3 | 1916 | Mean Difference (IV, Random, 95% CI) | ‐0.08 [‐0.19, 0.03] |
| 11 Asthma control (ACQ 'responder') Show forest plot | 3 | 2009 | Odds Ratio (M‐H, Random, 95% CI) | 1.23 [0.87, 1.74] |
| 12 Any adverse events Show forest plot | 5 | 2562 | Odds Ratio (M‐H, Random, 95% CI) | 0.95 [0.80, 1.14] |
| 13 Adverse events classified as asthma Show forest plot | 5 | 2561 | Odds Ratio (M‐H, Random, 95% CI) | 0.85 [0.69, 1.05] |
| Outcome or subgroup title | No. of studies | No. of participants | Statistical method | Effect size |
| 1 All‐cause serious adverse events ‐ by study duration Show forest plot | 5 | 2562 | Odds Ratio (M‐H, Random, 95% CI) | 0.60 [0.23, 1.57] |
| 1.1 ≤ 6 months | 4 | 2277 | Odds Ratio (M‐H, Random, 95% CI) | 0.87 [0.37, 2.05] |
| 1.2 > 6 months | 1 | 285 | Odds Ratio (M‐H, Random, 95% CI) | 0.19 [0.07, 0.53] |
| 2 Exacerbations requiring oral corticosteroids ‐ by Respimat dose Show forest plot | 3 | 2277 | Odds Ratio (M‐H, Random, 95% CI) | 0.66 [0.46, 0.93] |
| 2.1 Respimat 2.5 mcg | 2 | 1012 | Odds Ratio (M‐H, Random, 95% CI) | 0.53 [0.29, 0.95] |
| 2.2 Respimat 5 mcg | 3 | 1265 | Odds Ratio (M‐H, Random, 95% CI) | 0.74 [0.48, 1.15] |
| 3 Quality of life (AQLQ) ‐ by Respimat dose Show forest plot | 3 | 1713 | Mean Difference (IV, Random, 95% CI) | 0.05 [‐0.03, 0.12] |
| 3.1 Respimat 2.5 mcg | 2 | 734 | Mean Difference (IV, Random, 95% CI) | 0.04 [‐0.08, 0.16] |
| 3.2 Respimat 5 mcg | 3 | 979 | Mean Difference (IV, Random, 95% CI) | 0.05 [‐0.05, 0.15] |
| 4 All‐cause serious adverse events ‐ by Respimat dose Show forest plot | 5 | 2717 | Odds Ratio (M‐H, Random, 95% CI) | 0.55 [0.30, 1.03] |
| 4.1 Respimat 2.5 mcg | 5 | 1487 | Odds Ratio (M‐H, Random, 95% CI) | 0.58 [0.22, 1.50] |
| 4.2 Respimat 5 mcg | 4 | 1230 | Odds Ratio (M‐H, Random, 95% CI) | 0.54 [0.21, 1.43] |
| 5 All‐cause serious adverse events ‐ by ICS dose Show forest plot | 5 | 2562 | Odds Ratio (M‐H, Fixed, 95% CI) | 0.59 [0.35, 1.00] |
| 5.1 Low‐dose ICS | 1 | 464 | Odds Ratio (M‐H, Fixed, 95% CI) | 0.5 [0.03, 8.05] |
| 5.2 Medium‐dose ICS | 4 | 2098 | Odds Ratio (M‐H, Fixed, 95% CI) | 0.60 [0.35, 1.01] |
| Outcome or subgroup title | No. of studies | No. of participants | Statistical method | Effect size |
| 1 Exacerbations requiring oral corticosteroids Show forest plot | 2 | 1345 | Odds Ratio (M‐H, Random, 95% CI) | 0.95 [0.29, 3.14] |
| 2 Quality of life (AQLQ) Show forest plot | 2 | 973 | Mean Difference (IV, Random, 95% CI) | 0.00 [‐0.09, 0.10] |
| 3 All‐cause serious adverse events Show forest plot | 4 | 1573 | Odds Ratio (M‐H, Random, 95% CI) | 1.01 [0.50, 2.02] |