Физические упражнения при гемофилии
References
References to studies included in this review
References to studies excluded from this review
References to studies awaiting assessment
Additional references
Characteristics of studies
Characteristics of included studies [ordered by study ID]
Jump to:
| Methods | Randomized controlled study. | |
| Participants | 30 boys with moderate A and B, unilateral knee haemarthrosis, 8 ‐ 12 years of age. Exclusion criteria: acute bleeds, advanced radiologic changes, congenital or acquired skeletal deformities. | |
| Interventions | Both groups: exercise stretching and strengthening, ultrasound for 1 hour, 5 days per week. Exercise group: in addition to the above performed ambulation on treadmill: speed 1.5 km/hr no incline for 5 min as a warm up, 20 minutes of exercise 3 km/hr 10 degree incline, cool down 1.5 km/hr no incline for 30 min. Duration of study: 3 months. | |
| Outcomes | Strength assessment with the Biodex Isokinetic Dynamometer: isokinetic pre‐ and post‐test at 2 different velocities, peak torque of knee flexors and peak torque of knee extensors; knee circumference. | |
| Notes | ||
| Risk of bias | ||
| Bias | Authors' judgement | Support for judgement |
| Random sequence generation (selection bias) | Unclear risk | Quote: "They were divided randomly into two groups of equal numbers." Comment: method of randomization was not reported. |
| Allocation concealment (selection bias) | Unclear risk | Comment: no information was reported re allocation concealment. |
| Blinding of participants and personnel (performance bias) | Unclear risk | Comment: not reported whether personnel or participants were blinded. |
| Blinding of outcome assessment (detection bias) | Unclear risk | Comment: not reported whether assessors of outcome were blinded. |
| Incomplete outcome data (attrition bias) | Unclear risk | Quote: "Isokinetic pre‐test and post‐test measurements....were performed on every child...". Comment: not reported whether joint circumference was measured on every child. |
| Selective reporting (reporting bias) | Unclear risk | Insufficient information provided to make judgement of low or high risk. |
| Other bias | Low risk | No other sources of bias were identified. |
| Methods | Randomized controlled study. | |
| Participants | 18 participants, 14 haemophilia A, 4 haemophilia B; 11 with severe haemophilia, 7 with mild; 9 participants in intervention group, 9 participants in control resulting in 16 elbows in the intervention and 14 elbows in the control. | |
| Interventions | Intervention group: traction and PNF, control group: no intervention. 12 week intervention, 2 times per week, 1 hour session , evaluation pre‐, post‐ and 6‐month follow up. | |
| Outcomes | ROM, strength, pain, circumference. | |
| Notes | Elbows only. | |
| Risk of bias | ||
| Bias | Authors' judgement | Support for judgement |
| Random sequence generation (selection bias) | Unclear risk | Quote: "randomized trial with two groups". Comment: not reported how participants were randomized. |
| Allocation concealment (selection bias) | Unclear risk | Comment: not reported if or how randomization was concealed. |
| Blinding of participants and personnel (performance bias) | Unclear risk | Comment: not reported whether participants were blinded. |
| Blinding of outcome assessment (detection bias) | Low risk | Quote: "Three blind evaluators assessed: ROM, biceps perimeter, biceps strength, pain." |
| Incomplete outcome data (attrition bias) | Unclear risk | Comment: not reported whether all participants completed all measurements. |
| Selective reporting (reporting bias) | Unclear risk | Insufficient information provided to make judgement of low or high risk. |
| Other bias | Low risk | No other sources of bias were identified. |
| Methods | Randomized controlled study. | |
| Participants | 30 boys with moderate haemophilia A, 10 ‐ 14 years. Participants equally divided between intervention and control. | |
| Interventions | Control and experimental group: gentle stretching for tight muscle groups around elbow, knee, ankle for 15 min, isometric contractions knees, ankles, elbows 15 min, aerobic exercise on treadmill 30 min. 1 hr, 3 times per week. In addition to this, the experimental group also received bicycle ergometry 20 min, resistance training with sand bags 20 min. Total time for experimental group was 1 hr 40 min, control group 1 hr. Intervention period: 3 successive months. | |
| Outcomes | BMD, muscle strength and function, Biodex Isokinetic Dynamometer (knee flexor/extensor peak torque) 6MWT, DEXA. | |
| Notes | Lots of detail of intervention protocol. | |
| Risk of bias | ||
| Bias | Authors' judgement | Support for judgement |
| Random sequence generation (selection bias) | Unclear risk | Comment: participants were "assigned randomly" not reported how allocation sequence was generated. |
| Allocation concealment (selection bias) | Unclear risk | Comment: not reported how allocation was concealed. |
| Blinding of participants and personnel (performance bias) | Unclear risk | Comment: not reported whether personnel or participants were blinded. |
| Blinding of outcome assessment (detection bias) | Unclear risk | Comment: not reported whether assessors of outcome were blinded. |
| Incomplete outcome data (attrition bias) | Unclear risk | Comment: not reported whether all participants completed each outcome assessment. |
| Selective reporting (reporting bias) | Unclear risk | Insufficient information provided to make judgement of low or high risk. |
| Other bias | Low risk | No other sources of bias were identified. |
| Methods | Semi‐experimental, 8‐week intervention. | |
| Participants | 20 men (ages not specified, although mean ages are given) with moderate haemophilia. | |
| Interventions | Experimental group: 24 sessions 3x per week, 40 ‐ 60 min, increase time and quality of exercise at each session. Sessions consisted of 3 sections: warm up, main part and cool down. Warm up aerobic activity 50% ‐ 74% of HR predicted. Main part: 10 simple movements (5UE, 5LE) in water: 1 min for each movement maximum power as pain allowed. Cool down: individualized stretching program. Control group: no intervention. Each session (3 times per week) lasted 45 ‐ 60 min. Duration of study: 8 weeks. | |
| Outcomes | Muscle strength (Biodex Isokinetic Dynamometer, knees only), ROM (standard goniometer, inactive range: elbows, knees, ankles), heart rate before and during. | |
| Notes | ||
| Risk of bias | ||
| Bias | Authors' judgement | Support for judgement |
| Random sequence generation (selection bias) | Unclear risk | Comment: not reported how allocation sequence was generated. |
| Allocation concealment (selection bias) | Unclear risk | Comment: not reported how allocation was concealed. |
| Blinding of participants and personnel (performance bias) | Unclear risk | Comment: not reported whether personnel or participants were blinded. |
| Blinding of outcome assessment (detection bias) | Unclear risk | Comment: not reported whether assessors of outcome were blinded. |
| Incomplete outcome data (attrition bias) | Unclear risk | Comment: not reported whether all participants completed each outcome assessment. |
| Selective reporting (reporting bias) | High risk | Comment: reference is made to administration of a questionnaire post‐treatment; results were not reported. |
| Other bias | Low risk | No other sources of bias were identified. |
| Methods | Quasi‐experimental, prospective study design, randomized into 2 groups, with the addition of a non‐randomized control group (data from this arm (n = 13) not used in this review). | |
| Participants | 40 participants, haemophilia A, all severities, < 50 years of age. 13 exercise, 14 hydro, 13 control (not randomized). 43 started in protocol, 3 dropouts. Inclusion criteria: haemophilia, ability to participate, impaired knee ROM. Exclusion criteria: surgery 6 weeks prior, participation in sports or other exercises, severe haemorrhage despite factors, open wounds, sensibility to aquatic therapy. | |
| Interventions | 4 week hydrotherapy program vs exercise vs control. Hydrotherapy: co‐ordinated and rhythmic movement of lower limb in water (warm‐up), hamstring stretches, quad strengthening. Exercise: stretches for muscles around the knee joint (warm up), isometrics progressing to isotonics, hamstring stretches, quad strengthening. Control: regular lifestyle. NOTE: this group was not randomized, therefore data from this arm not used in the review. ** Only difference between intervention groups is the warm up: hydrotherapy and stretches for muscles around the knee joint. Duration of study: 4 weeks. | |
| Outcomes | Pain before and after interventions, ROM knee flexion and extension. | |
| Notes | ||
| Risk of bias | ||
| Bias | Authors' judgement | Support for judgement |
| Random sequence generation (selection bias) | Unclear risk | Comment: not reported how participants were randomized. |
| Allocation concealment (selection bias) | Unclear risk | Comment: not reported how allocation was concealed. |
| Blinding of participants and personnel (performance bias) | Unclear risk | Comment: not reported whether personnel or participants were blinded. |
| Blinding of outcome assessment (detection bias) | Unclear risk | Comment: not reported whether assessors of outcome were blinded. |
| Incomplete outcome data (attrition bias) | Unclear risk | Comment: data for 3 participants who did not complete the intervention were not included in the analysis and were reported by the authors but they did not report from which group the drop outs occurred, therefore characterized as unclear risk. |
| Selective reporting (reporting bias) | Unclear risk | Insufficient information provided to make judgement of low or high risk. |
| Other bias | Low risk | No other sources of bias were identified. |
| Methods | Prospective randomized controlled study, no blinding. | |
| Participants | 30 boys with mild or moderate haemophilia, ages ranged from 10 ‐ 14 years. Participants were randomly assigned to group A (bicycle ergometer + exercise, n = 15) or group B (treadmill training + exercise, n = 15). | |
| Interventions | Group A received exercise program and bicycle ergometry, Group B received exercise program and treadmill training. Both groups received treatment sessions 3 times per week for 3 successive months. | |
| Outcomes | Stability or balance and kinematic gait parameters were evaluated before and after 3 successive months of treatment using the Biodex Stability System and the Biodex Gait trainer 2TM. | |
| Notes | ||
| Risk of bias | ||
| Bias | Authors' judgement | Support for judgement |
| Random sequence generation (selection bias) | Low risk | Comment: randomization was done by having the participants draw an envelope which contained a card indicating either group A or group B |
| Allocation concealment (selection bias) | Low risk | Comment: each participant drew a sealed envelope. |
| Blinding of participants and personnel (performance bias) | Unclear risk | Comment: not reported whether personnel or participants were blinded. |
| Blinding of outcome assessment (detection bias) | Unclear risk | Comment: not reported whether assessors of outcome were blinded. |
| Incomplete outcome data (attrition bias) | Unclear risk | Comment: not reported whether all participants completed each outcome assessment. |
| Selective reporting (reporting bias) | Unclear risk | Insufficient information provided to make judgement of low or high risk. |
| Other bias | Low risk | No other sources of bias were identified. |
| Methods | Randomized controlled study. | |
| Participants | Inclusion criteria: severe haemophilia A, BMI 22 ‐ 29, no inhibitor, t‐score < 2.5, willingness to comply with the design, regular patient at clinic. Age 20 ‐ 35 years. Exclusion criteria: target joint preventing resistance training, hepatitis B or C, thyroid disorder, steroids, regular physical training more than 2x per week in preceding 6 months, hormone therapy, drugs that influence bone metabolism, hypertension, other orthopedic that might limit ability to participate in resistance training. 70 enrolled in study; 22 excluded based on inclusion criteria; 48 remaining and were randomly assigned to 4 groups. 1. RT only: 13 participants. 2. RT with PEMF: 12 participants. 3. PEMF only: 11 participants. 4. Control no resistance and no PEMF: 12 participants. Within random allocation participants with low t‐scores were evenly distributed within the groups. Duration of study: 6 weeks. | |
| Interventions | Resistance training involved 18 sessions over 6 weeks, 3 times a week, 30 ‐ 40 min, resistance was set based on 1 repetition max (started at 50%, increased to 55%, finished at 60%), 10 reps during weeks 1, 3, 5. 15 reps during weeks 2, 4, 6, amount of rest time was specified. RT only: after exercises received 30 min of placebo PEMF, very good description of exercises provided. RT and PEMF group: 5 reps of each exercise in 1, 3, 5 and 10 reps in weeks 2, 4, 6. After the training program participants received 30 min of PEMF, parameters described. PEMF: no exercise training, 6 weeks of PEMF 1 hour per session over 6 weeks. Control group: no intervention. | |
| Outcomes | Body fat percentage. Modified Colorado Scale, Pediatric (ROM, strength, pain, etc). Blood work for bone biomarkers. | |
| Notes | Conclude that pain is improved but unable to find raw data in results. | |
| Risk of bias | ||
| Bias | Authors' judgement | Support for judgement |
| Random sequence generation (selection bias) | Low risk | Quote: "randomization (using computerized blocks) was carried out....". |
| Allocation concealment (selection bias) | Low risk | Comment: randomization was carried out by an independent person, not involved in the research project. |
| Blinding of participants and personnel (performance bias) | Unclear risk | Quote: "all patients were blinded to the groupings but the investigator for the modified Colorado Questionnaire was not masked to the group assignment.". Comment: extent to which this unblinded assessment may have influenced outcomes is unclear. |
| Blinding of outcome assessment (detection bias) | Unclear risk | Quote: "the investigator for the modified Colorado Questionnaire was not masked to the group assignment.". Comment: extent to which this unblinded assessment may have influenced outcomes is unclear. |
| Incomplete outcome data (attrition bias) | Low risk | Quote: "Five patients did not complete the project.". Comment: 10% overall dropout rate. Not reported how incomplete data were handled. |
| Selective reporting (reporting bias) | Unclear risk | Insufficient information provided to make judgement of low or high risk. |
| Other bias | Low risk | No other sources of bias were identified. |
| Methods | Participants were randomly assigned into 2 equal groups. | |
| Participants | 30 boys with moderate haemophilia aged 8 ‐ 12 years; randomly assigned into 2 equal groups. | |
| Interventions | Control group: quadriceps training exercise program. Study duration: 3 time a week for 6 weeks. | |
| Outcomes | Manual muscle strength testing of quadriceps (Lafayette Manual Muscle Test system); 6MWT. | |
| Notes | ||
| Risk of bias | ||
| Bias | Authors' judgement | Support for judgement |
| Random sequence generation (selection bias) | Unclear risk | Comment: not reported how allocation sequence was generated. |
| Allocation concealment (selection bias) | Unclear risk | Comment: not reported how allocation was concealed. |
| Blinding of participants and personnel (performance bias) | Unclear risk | Comment: not reported whether personnel or participants were blinded. |
| Blinding of outcome assessment (detection bias) | Unclear risk | Comment: not reported whether assessors of outcome were blinded. |
| Incomplete outcome data (attrition bias) | Unclear risk | Comment: not reported whether all participants completed each outcome assessment. |
| Selective reporting (reporting bias) | Unclear risk | Insufficient information provided to make judgement of low or high risk. |
| Other bias | Low risk | No other sources of bias were identified. |
PEMF: pulsed electromagnetic fields but no resistance training
PNF: proprioceptive neuromuscular facilitation
ROM: range of movement
RT: resistance training
6MWT: 6‐minute walk test
Characteristics of excluded studies [ordered by study ID]
Jump to:
| Study | Reason for exclusion |
| Not randomized. | |
| No control group. | |
| No control group. | |
| No control group. | |
| No control group. | |
| No control group. | |
| Not randomized. |
Characteristics of studies awaiting assessment [ordered by study ID]
Jump to:
| Methods | Randomized study. |
| Participants | 31 participants with haemophilia A or B and with haemophilic arthropathy in one or both ankles. |
| Interventions | Manual therapy group (articular traction, passive stretching of the gastrocnemius muscles, and exercises for muscle strength and proprioception), an educational group (educational sessions and home exercises) and a control group. |
| Outcomes | Range of motion, gastrocnemius muscle circumference, muscular strength of the gastrocnemius muscles, pain perception, radiological assessment of joint deterioration. |
| Notes |
| Methods | Randomized study. |
| Participants | People with haemophilia. |
| Interventions | Experimental group: received training sessions on the clinical features of haemophilia and the management of musculoskeletal limitations of haemophilic arthropathy, plus home exercises. Control group: no intervention. |
| Outcomes | Physical state (Gilbert score), A36 haemophilia‐QoL and IBQ. |
| Notes |
| Methods | Quasi‐experimental, cross‐sectional study. |
| Participants | 20 participants with haemophilia A from the Isfahan Hemophiliac Center. |
| Interventions | Exercise therapy program versus a "control group". |
| Outcomes | 6MWT; Beck Anxiety Inventory; range of movement measurements were done on 10 joints. |
| Notes |
IBQ: illness behaviour questionnaire
QoL: quality of life
6MWT: 6‐minute walk test
Data and analyses
| Outcome or subgroup title | No. of studies | No. of participants | Statistical method | Effect size |
| 1 Colorado score Show forest plot | 1 | Mean Difference (IV, Fixed, 95% CI) | Totals not selected | |
| Analysis 1.1  Comparison 1 Exercise versus no intervention, Outcome 1 Colorado score. | ||||
| 1.1 elbow | 1 | Mean Difference (IV, Fixed, 95% CI) | 0.0 [0.0, 0.0] | |
| 1.2 knee | 1 | Mean Difference (IV, Fixed, 95% CI) | 0.0 [0.0, 0.0] | |
| 1.3 ankles | 1 | Mean Difference (IV, Fixed, 95% CI) | 0.0 [0.0, 0.0] | |
| Outcome or subgroup title | No. of studies | No. of participants | Statistical method | Effect size |
| 1 Balance (Biodex Stability System) Show forest plot | 1 | Mean Difference (IV, Fixed, 95% CI) | Totals not selected | |
| Analysis 2.1 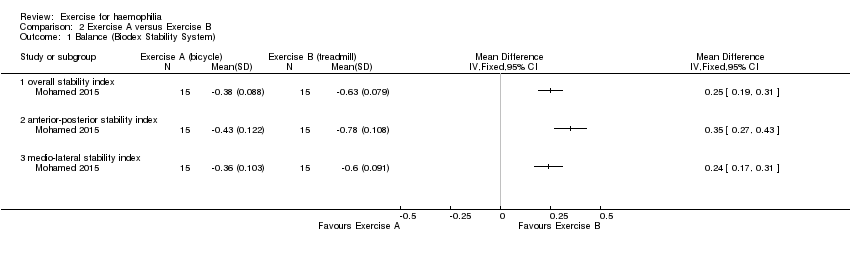 Comparison 2 Exercise A versus Exercise B, Outcome 1 Balance (Biodex Stability System). | ||||
| 1.1 overall stability index | 1 | Mean Difference (IV, Fixed, 95% CI) | 0.0 [0.0, 0.0] | |
| 1.2 anterior‐posterior stability index | 1 | Mean Difference (IV, Fixed, 95% CI) | 0.0 [0.0, 0.0] | |
| 1.3 medio‐lateral stability index | 1 | Mean Difference (IV, Fixed, 95% CI) | 0.0 [0.0, 0.0] | |
| 2 Pain Show forest plot | 1 | Mean Difference (IV, Fixed, 95% CI) | Totals not selected | |
| Analysis 2.2 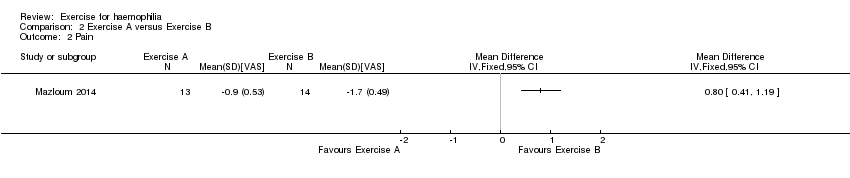 Comparison 2 Exercise A versus Exercise B, Outcome 2 Pain. | ||||
| 3 6‐min walk: distance Show forest plot | 1 | Mean Difference (IV, Fixed, 95% CI) | Totals not selected | |
| Analysis 2.3  Comparison 2 Exercise A versus Exercise B, Outcome 3 6‐min walk: distance. | ||||
| 4 Range of motion: flexion Show forest plot | 1 | Mean Difference (IV, Fixed, 95% CI) | Totals not selected | |
| Analysis 2.4  Comparison 2 Exercise A versus Exercise B, Outcome 4 Range of motion: flexion. | ||||
| 4.1 flexion | 1 | Mean Difference (IV, Fixed, 95% CI) | 0.0 [0.0, 0.0] | |
| 4.2 extension | 1 | Mean Difference (IV, Fixed, 95% CI) | 0.0 [0.0, 0.0] | |
| 5 Muscle strength Show forest plot | 3 | Mean Difference (IV, Random, 95% CI) | Subtotals only | |
| Analysis 2.5  Comparison 2 Exercise A versus Exercise B, Outcome 5 Muscle strength. | ||||
| 5.1 extensors (force in kg) | 1 | 30 | Mean Difference (IV, Random, 95% CI) | 6.40 [4.81, 7.99] |
| 5.2 extensors 60 degrees per second | 1 | 30 | Mean Difference (IV, Random, 95% CI) | 4.31 [2.75, 5.87] |
| 5.3 extensors 120 degrees per second | 2 | 60 | Mean Difference (IV, Random, 95% CI) | 12.75 [1.46, 24.04] |
| 5.4 flexors speed 60 degrees per second | 1 | 30 | Mean Difference (IV, Random, 95% CI) | 4.31 [3.20, 5.42] |
| 5.5 flexors speed 120 degrees per second | 2 | 60 | Mean Difference (IV, Random, 95% CI) | 9.12 [6.74, 11.51] |
| 6 Knee circumference Show forest plot | 1 | Mean Difference (IV, Fixed, 95% CI) | Totals not selected | |
| Analysis 2.6 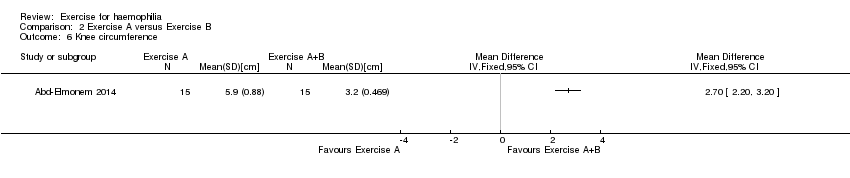 Comparison 2 Exercise A versus Exercise B, Outcome 6 Knee circumference. | ||||
| Outcome or subgroup title | No. of studies | No. of participants | Statistical method | Effect size |
| 1 Colorado score Show forest plot | 1 | Mean Difference (IV, Fixed, 95% CI) | Totals not selected | |
| Analysis 3.1 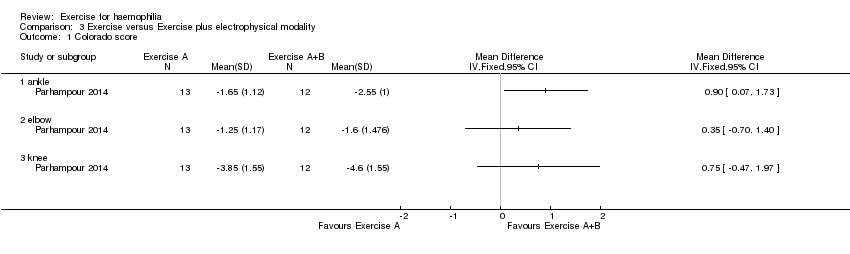 Comparison 3 Exercise versus Exercise plus electrophysical modality, Outcome 1 Colorado score. | ||||
| 1.1 ankle | 1 | Mean Difference (IV, Fixed, 95% CI) | 0.0 [0.0, 0.0] | |
| 1.2 elbow | 1 | Mean Difference (IV, Fixed, 95% CI) | 0.0 [0.0, 0.0] | |
| 1.3 knee | 1 | Mean Difference (IV, Fixed, 95% CI) | 0.0 [0.0, 0.0] | |
| Outcome or subgroup title | No. of studies | No. of participants | Statistical method | Effect size |
| 1 Pain Show forest plot | 1 | Mean Difference (IV, Fixed, 95% CI) | Totals not selected | |
| Analysis 4.1  Comparison 4 Hydrotherapy versus no intervention, Outcome 1 Pain. | ||||
| 2 Range of motion Show forest plot | 1 | Mean Difference (IV, Fixed, 95% CI) | Totals not selected | |
| Analysis 4.2  Comparison 4 Hydrotherapy versus no intervention, Outcome 2 Range of motion. | ||||
| 2.1 flexion | 1 | Mean Difference (IV, Fixed, 95% CI) | 0.0 [0.0, 0.0] | |
| 2.2 extension | 1 | Mean Difference (IV, Fixed, 95% CI) | 0.0 [0.0, 0.0] | |


Risk of bias graph: review authors' judgements about each risk of bias item presented as percentages across all included studies.

Risk of bias summary: review authors' judgements about each risk of bias item for each included study.
Comparison 1 Exercise versus no intervention, Outcome 1 Colorado score.
Comparison 2 Exercise A versus Exercise B, Outcome 1 Balance (Biodex Stability System).
Comparison 2 Exercise A versus Exercise B, Outcome 2 Pain.
Comparison 2 Exercise A versus Exercise B, Outcome 3 6‐min walk: distance.
Comparison 2 Exercise A versus Exercise B, Outcome 4 Range of motion: flexion.
Comparison 2 Exercise A versus Exercise B, Outcome 5 Muscle strength.
Comparison 2 Exercise A versus Exercise B, Outcome 6 Knee circumference.
Comparison 3 Exercise versus Exercise plus electrophysical modality, Outcome 1 Colorado score.
Comparison 4 Hydrotherapy versus no intervention, Outcome 1 Pain.
Comparison 4 Hydrotherapy versus no intervention, Outcome 2 Range of motion.
| Exercise compared with no intervention for haemophilia | ||||||
| Patient or population: participants with haemophilia Settings: outpatients Intervention: exercise Comparison: no intervention | ||||||
| Outcomes | Illustrative comparative risks* (95% CI) | Relative effect | No of Participants | Quality of the evidence | Comments | |
| Assumed risk | Corresponding risk | |||||
| No intervention | Exercise | |||||
| Adverse events | Outcome not reported | NA | ||||
| Quality of life | Outcome not reported | NA | ||||
| Joint health: Modified Colorado Score Follow up: 6 weeks | See comment | See comment | NA | 25 (1 study) | ⊕⊕⊝⊝ | Statistically significant improvements were demonstrated in the exercise group compared to the no intervention group in the joint health status of the elbows, MD ‐1.21 points (95% CI ‐2.14 to ‐0.28 points), knees, MD ‐3.42 points (95% CI ‐4.82 to ‐2.02 points) and ankles, MD ‐1.65 points (95% CI ‐2.51 to ‐0.79). |
| Pain: reduction of pain intensity by visual analogue scale Follow up: 12 weeks | See comment | See comment | NA | 18 (1 study) | ⊕⊝⊝⊝ | Data were presented as number of joints (n = 30) rather than number of participants so could not be entered into the analysis. There was "observed improvement (P < 0.05)" in pain perception of the elbow in exercise group compared to the no intervention group. |
| Functional Status | Outcome not reported | NA | ||||
| Range of Motion: joint flexion and joint extension Follow up: 12 weeks | See comment | See comment | NA | 18 (1 study) | ⊕⊝⊝⊝ | Data were presented as number of joints (n = 30) rather than number of participants so could not be entered into the analysis. There was "observed improvement (P < 0.05)" in flexion of the elbow in exercise group compared to the no intervention group but no statistically significant difference between treatment groups for joint extension. |
| Strength: bicep strength Follow up: 12 weeks | See comment | See comment | NA | 18 (1 study) | ⊕⊝⊝⊝ | Data were presented as number of joints (n = 30) rather than number of participants so could not be entered into the analysis. There was no statistically significant difference between treatment groups. |
| *The basis for the assumed risk is provided in the comments. The corresponding risk (and its 95% confidence interval) is based on the assumed risk in the comparison group and the relative effect of the intervention (and its 95% CI). | ||||||
| GRADE Working Group grades of evidence | ||||||
| 1. Downgraded once due to potential risk of bias: limited details of study design provided making assessment of study quality difficult; presence of bias cannot be ruled out. 2. Downgraded once due to imprecision: evidence available from only a single study recruiting a small sample of participants. 3. Downgraded once due to applicability: the single study contributing evidence recruits only participants with severe haemophilia; results are not applicable to participants with mild or moderate haemophilia | ||||||
| Exercise A compared with Exercise B for haemophilia | ||||||
| Patient or population: participants with haemophilia Settings: outpatients Intervention: Exercise A Comparison: Exercise B | ||||||
| Outcomes | Illustrative comparative risks* (95% CI) | Relative effect | No of Participants | Quality of the evidence | Comments | |
| Assumed risk | Corresponding risk | |||||
| Exercise B | Exercise A | |||||
| Adverse events | Outcome not reported | |||||
| Quality of life | Outcome not reported | |||||
| Balance: Biodex stability parameters Follow up: 12 weeks | See comment | See comment | NA | 30 (1 study) | ⊕⊝⊝⊝ | Exercise B group (treadmill) significantly improved compared to Exercise A group (bicycle) in terms of overall stability index, MD 0.25 points (95% CI 0.19 to 0.31 points), anterior‐posterior stability index, MD 0.35 points (95% CI 0.27 to 0.43 points) and medio‐lateral stability index, MD 0.24 points (CI 95% 0.17 to 0.31 points). |
| Pain: reduction of pain intensity by visual analogue scale Follow up: 4 weeks | The mean reduction in pain from baseline was 1.7 on the VAS scale in the Exercise B group. | The mean reduction in pain from baseline was 0.8 lower (0.41 to 1.19 lower) on the VAS scale in the Exercise A group. | NA | 27 (1 study) | ⊕⊕⊝⊝ | Exercise A is a land‐based exercise program and Excerise B is an aquatic‐based exercise program. |
| Functional Status: 6MWT (metres) Follow up: 6 weeks | The mean 6MWT was 32 metres in Exercise group B. | The mean 6MWT was 2.6 metres greater (0.08 metres to 5.12 metres greater) in Exercise group A. | NA | 30 (1 study) | ⊕⊝⊝⊝ | Exercise A is a partial weight bearing exercise program plus a quadriceps exercise training program and Exercise B is a quadriceps exercise training program alone. |
| Range of Motion: flexion and extension Follow up: 4 weeks | See comment | See comment | NA | 27 (1 study) | ⊕⊕⊝⊝ | Exercise A is a land‐based exercise program and Excerise B is an aquatic‐based exercise program. No significant difference was demonstrated between the treatment groups; flexion, MD 0.20 degrees (95% CI ‐5.61 to 6.01 degrees) and extension MD ‐0.10 (95% CI ‐1.59 to 1.39). |
| Strength: flexors and extensors Follow up: 12 weeks | See comment | See comment | NA | 90 (3 studies) | ⊕⊕⊕⊝ | Strength outcomes demonstrated a significant improvement for the study groups over the control groups in all outcome measures of strength including knee extensor and flexor strength.4 |
| *The basis for the assumed risk is the mean control group risk or provided in the comments. The corresponding risk (and its 95% confidence interval) is based on the assumed risk in the comparison group and the relative effect of the intervention (and its 95% CI). | ||||||
| GRADE Working Group grades of evidence | ||||||
| 1. Downgraded once due to potential risk of bias: limited details of study design provided making assessment of study quality difficult; presence of bias cannot be ruled out. 2. Downgraded once due to imprecision: evidence available from only a single study recruiting a small sample of participants. 3. Downgraded once due to applicability: the single studies contributing evidence recruit only individuals with mild or moderate haemophilia; results are not applicable to participants with severe haemophilia. 4. Comparisons were partial weight bearing exercise program plus a quadriceps exercise training program (study group) compared to quadriceps exercise training program alone (control group), physical therapy program of stretching, strengthening and aerobic activity (control group) compared to the same program with the addition of bicycle ergometry (study group) and weight resistance and exercise therapy program including ultrasound, stretching and strengthening exercises (control group) compared to the same program plus treadmill training (study group). Also see Table 2 for further details of interventions. | ||||||
| Exercise alone compared with exercise plus electrophysical modality for haemophilia | ||||||
| Patient or population: participants with haemophilia Settings: outpatients Intervention: exercise alone Comparison: exercise plus electrophysical modality | ||||||
| Outcomes | Illustrative comparative risks* (95% CI) | Relative effect | No of Participants | Quality of the evidence | Comments | |
| Assumed risk | Corresponding risk | |||||
| Exercise plus electrophysical modality | Exercise alone | |||||
| Adverse events | Outcome not reported | NA | ||||
| Quality of life | Outcome not reported | NA | ||||
| Pain | Outcome not reported | NA | ||||
| Functional Status | Outcome not reported | NA | ||||
| Joint health: Modified Colorado Score Follow up: 12 weeks | See comment | See comment | NA | 25 (1 study) | ⊕⊝⊝⊝ | A statistically significant improvement was noted in the ankle scores, MD 0.90 points (95% CI 0.07 to 1.73 points) favouring the exercise plus electrophysical modality group over exercise alone group. There was no statistically significant difference between groups in elbow scores, MD 0.35 points (95% CI ‐0.70 to 1.40 points) or knee scores, MD 0.75 points (95% CI ‐0.47 to 1.97 points). |
| *The basis for the assumed risk is provided in the comments. The corresponding risk (and its 95% confidence interval) is based on the assumed risk in the comparison group and the relative effect of the intervention (and its 95% CI). | ||||||
| GRADE Working Group grades of evidence | ||||||
| 1. Downgraded once due to potential risk of bias: limited details of study design provided making assessment of study quality difficult; presence of bias cannot be ruled out. 2. Downgraded once due to imprecision: evidence available from only a single study recruiting a small sample of participants. 3. Downgraded once due to applicability: the single study contributing evidence recruits only participants with severe haemophilia; results are not applicable to participants with mild or moderate haemophilia. | ||||||
| Hydrotherapy compared with no exercise for haemophilia | ||||||
| Patient or population: participants with haemophilia Settings: outpatients Intervention: hydrotherapy Comparison: no exercise | ||||||
| Outcomes | Illustrative comparative risks* (95% CI) | Relative effect | No of Participants | Quality of the evidence | Comments | |
| Assumed risk | Corresponding risk | |||||
| No exercise | Hydrotherapy | |||||
| Adverse events | Outcome not reported | NA | ||||
| Quality of life | Outcome not reported | NA | ||||
| Pain | Outcome not reported | NA | ||||
| Functional status | Outcome not reported | NA | ||||
| Range of motion: flexion and extension Follow up: 8 weeks | See comment | See comment | NA | 20 (1 study) | ⊕⊝⊝⊝ | Data were presented via an analysis of covariance (post intervention scores adjusted for differences in pre intervention scores), so data could not be entered into the analysis. There was a statistically significant improvement in range of motion of the hydrotherapy group over the no exercise group. |
| Strength: knee flexor and extensor strength Follow up: 8 weeks | See comment | See comment | NA | 20 (1 study) | ⊕⊝⊝⊝ | Data were presented via an analysis of covariance (post intervention scores adjusted for differences in pre intervention scores), so data could not be entered into analysis. There was a statistically significant improvement in both knee flexor and extensor strength of the hydrotherapy group over the no exercise group. |
| *The basis for the assumed risk is provided in the comments. The corresponding risk (and its 95% confidence interval) is based on the assumed risk in the comparison group and the relative effect of the intervention (and its 95% CI). | ||||||
| GRADE Working Group grades of evidence | ||||||
| 1. Downgraded once due to potential risk of bias: limited details of study design provided making assessment of study quality difficult and suspected selective reporting bias and post‐intervention scores are not presented. 2. Downgraded once due to imprecision: evidence available from only a single study recruiting a small sample of participants. 3. Downgraded once due to applicability: the single study contributing evidence recruits only participants with moderate haemophilia; results are not applicable to participants with mild or severe haemophilia. | ||||||
| Outcome | Assessment | Exercise group: mean (SD) (n = 9 participants, 16 elbows) | Control group: mean (SD) (n = 9 participants, 14 elbows) |
| Flexion | Pre‐treatment: Post‐treatment (12 weeks): | 136.130 (14.818) 140.310 (11.247) | 138.000 (19.958) 138.430 (18.475) |
| Extension | Pre‐treatment: Post‐treatment (12 weeks): | 10.870 (14.207) 11.880 (14.917) | 8.640 (15.310) 8.290 (15.364) |
| Pain (VAS) | Pre‐treatment: Post‐treatment (12 weeks): | 0.719 (0.752) 0.344 (0.436) | 0.143 (0.305) 0.071 (0.267) |
| Biceps perimeter | Pre‐treatment: Post‐treatment (12 weeks): | 31.331 (3.474) 31.725 (3.205) | 32.007 (3.837) 31.857 (3.566) |
| Bicep strength | Pre‐treatment: Post‐treatment (12 weeks): | 0.094 (0.272) 0.000 (0.000) | 0.143 (0.363) 0.071 (0.181) |
| Number of participants in each group = 9. Data relate to 16 elbows in the exercise group and 14 in the control group. VAS: visual analog scale | |||
| Author | "Exercise A" | "Exercise B" |
| Ultrasound, stretching, strengthening 5 days per week | Exercise A plus treadmill training | |
| Stretching, static exercises, treadmill | Exercise A plus bicycle ergometer and resisted isotonic exercises | |
| Static and short‐arc quadriceps, straight leg raises | Exercise A plus partial weight‐bearing exercises in supine | |
| Stretching, isometric and isotonic strengthening | Rhythmic movement in water, isometric and isotonic strengthening | |
| Stretching, isometrics, balance or gait training; bicycle ergometry | Stretching, isometrics, balance or gait training; treadmill |
| Outcome or subgroup title | No. of studies | No. of participants | Statistical method | Effect size |
| 1 Colorado score Show forest plot | 1 | Mean Difference (IV, Fixed, 95% CI) | Totals not selected | |
| 1.1 elbow | 1 | Mean Difference (IV, Fixed, 95% CI) | 0.0 [0.0, 0.0] | |
| 1.2 knee | 1 | Mean Difference (IV, Fixed, 95% CI) | 0.0 [0.0, 0.0] | |
| 1.3 ankles | 1 | Mean Difference (IV, Fixed, 95% CI) | 0.0 [0.0, 0.0] | |
| Outcome or subgroup title | No. of studies | No. of participants | Statistical method | Effect size |
| 1 Balance (Biodex Stability System) Show forest plot | 1 | Mean Difference (IV, Fixed, 95% CI) | Totals not selected | |
| 1.1 overall stability index | 1 | Mean Difference (IV, Fixed, 95% CI) | 0.0 [0.0, 0.0] | |
| 1.2 anterior‐posterior stability index | 1 | Mean Difference (IV, Fixed, 95% CI) | 0.0 [0.0, 0.0] | |
| 1.3 medio‐lateral stability index | 1 | Mean Difference (IV, Fixed, 95% CI) | 0.0 [0.0, 0.0] | |
| 2 Pain Show forest plot | 1 | Mean Difference (IV, Fixed, 95% CI) | Totals not selected | |
| 3 6‐min walk: distance Show forest plot | 1 | Mean Difference (IV, Fixed, 95% CI) | Totals not selected | |
| 4 Range of motion: flexion Show forest plot | 1 | Mean Difference (IV, Fixed, 95% CI) | Totals not selected | |
| 4.1 flexion | 1 | Mean Difference (IV, Fixed, 95% CI) | 0.0 [0.0, 0.0] | |
| 4.2 extension | 1 | Mean Difference (IV, Fixed, 95% CI) | 0.0 [0.0, 0.0] | |
| 5 Muscle strength Show forest plot | 3 | Mean Difference (IV, Random, 95% CI) | Subtotals only | |
| 5.1 extensors (force in kg) | 1 | 30 | Mean Difference (IV, Random, 95% CI) | 6.40 [4.81, 7.99] |
| 5.2 extensors 60 degrees per second | 1 | 30 | Mean Difference (IV, Random, 95% CI) | 4.31 [2.75, 5.87] |
| 5.3 extensors 120 degrees per second | 2 | 60 | Mean Difference (IV, Random, 95% CI) | 12.75 [1.46, 24.04] |
| 5.4 flexors speed 60 degrees per second | 1 | 30 | Mean Difference (IV, Random, 95% CI) | 4.31 [3.20, 5.42] |
| 5.5 flexors speed 120 degrees per second | 2 | 60 | Mean Difference (IV, Random, 95% CI) | 9.12 [6.74, 11.51] |
| 6 Knee circumference Show forest plot | 1 | Mean Difference (IV, Fixed, 95% CI) | Totals not selected | |
| Outcome or subgroup title | No. of studies | No. of participants | Statistical method | Effect size |
| 1 Colorado score Show forest plot | 1 | Mean Difference (IV, Fixed, 95% CI) | Totals not selected | |
| 1.1 ankle | 1 | Mean Difference (IV, Fixed, 95% CI) | 0.0 [0.0, 0.0] | |
| 1.2 elbow | 1 | Mean Difference (IV, Fixed, 95% CI) | 0.0 [0.0, 0.0] | |
| 1.3 knee | 1 | Mean Difference (IV, Fixed, 95% CI) | 0.0 [0.0, 0.0] | |
| Outcome or subgroup title | No. of studies | No. of participants | Statistical method | Effect size |
| 1 Pain Show forest plot | 1 | Mean Difference (IV, Fixed, 95% CI) | Totals not selected | |
| 2 Range of motion Show forest plot | 1 | Mean Difference (IV, Fixed, 95% CI) | Totals not selected | |
| 2.1 flexion | 1 | Mean Difference (IV, Fixed, 95% CI) | 0.0 [0.0, 0.0] | |
| 2.2 extension | 1 | Mean Difference (IV, Fixed, 95% CI) | 0.0 [0.0, 0.0] | |