بررسی روشها و شرایط مختلف پایش گلوکز برای دیابت بارداری در طول دوران بارداری
References
منابع مطالعات واردشده در این مرور
منابع مطالعات خارجشده از این مرور
منابع مطالعات در انتظار ارزیابی
منابع مطالعات در حال انجام
منابع اضافی
منابع دیگر نسخههای منتشرشده این مرور
Characteristics of studies
Characteristics of included studies [ordered by study ID]
| Methods | Quasi‐randomised controlled trial | |
| Participants | 276 pregnant women enrolled – 240 had GDM and 36 had type 1 diabetes. Setting: 12 Italian diabetes clinics Inclusion criteria: 240 women with GDM were included within a week of diagnosis of GDM (Carpenter and Coustan 1982 criteria); mean of 28 weeks’ gestation. Exclusion criteria: not stated. | |
| Interventions | Telemedicine (n = unclear; 88 followed up) Women received standard care plus telemedicine. They were given training on the use of the equipment and were asked to submit their glycaemic data every week, and more often if necessary, and had a medical examination at the diabetes clinic once a month. Women were asked to report their glucose concentrations (as recorded by the glucometer) using an interfacing device that converted the values into audio tones which could be transmitted via a normal telephone receiver. Women dialled the Glucobeep server’s number and identified themselves by a code – the system received their glycaemic data; they could also record a voice message containing any details they deemed useful to help the physician interpret their glycaemic values. Physicians logged in to the server to download the women’s glucose values and any messages; they analysed the data and recorded prescriptions in a message on the server; women then called the server to hear the message containing any new prescriptions. Both women and physicians received a text message immediately when their messages were received by the other party. Standard care (n = not clear; 115 followed up) Women received standard care (see below for details). All women Women were given standard care according to the recommendations of the American Diabetes Association; women with GDM were placed on a diet and trained to monitor their blood glucose using a home monitor. Women were asked to measure their blood glucose 4 times per day. Insulin was provided when glucose exceeded 95 mg/dl (5.3 mmol/L) fasting, or 130 mg/dl (7.2 mmol/L) 1 hour after meals. Women had a medical examination every 2 weeks. All women could contact the physician whenever they wished. | |
| Outcomes | Review outcomes reported: maternal morbidity (including gestational hypertension, pre‐eclampsia, eclampsia, hypoglycaemic episodes); caesarean section; use of additional pharmacotherapy (insulin therapy); glycaemic control (HbA1c in third trimester); maternal hypoglycaemia; gestational weight gain; adherence to intervention; quality of life; views of intervention; neonatal morbidity (including hypoglycaemic, hyperbilirubinaemia, respiratory distress syndrome, shoulder dystocia, malformations); macrosomia; gestational age at birth; birthweight; medical examinations and visits to diabetic clinic | |
| Notes | Funding: not reported Declarations of interest: not reported Dates: not specified | |
| Risk of bias | ||
| Bias | Authors' judgement | Support for judgement |
| Random sequence generation (selection bias) | High risk | Quote: "Women were sequentially assigned to the two groups: one patient was followed up using the telemedicine approach, and the next using the conventional approach (usual care)." |
| Allocation concealment (selection bias) | High risk | As above |
| Blinding of participants and personnel (performance bias) | High risk | Not feasible to blind participants and personnel |
| Blinding of outcome assessment (detection bias) | Unclear risk | No detail provided; unclear how lack of blinding would have affected outcomes |
| Incomplete outcome data (attrition bias) | High risk | 270 pregnant women were enrolled (240 with GDM, 36 with type 1 diabetes); 203/240 women with GDM and 32/36 women with type 1 diabetes were analysed; the others were excluded as they did not complete the questionnaires at the end of the study. While the authors reported "The demographic, clinical and metabolic characteristics of the women excluded from the study were no different from those of the women who completed the study," there were unbalanced numbers of women with GDM included in the analysis (88 in intervention; 115 in control) indicating a higher rate of exclusion from the intervention group. |
| Selective reporting (reporting bias) | Unclear risk | No access to trial protocol to permit confident assessment of selective reporting. Some results (particularly surrounding adherence and views) reported incompletely in text. |
| Other bias | Unclear risk | Lack of methodological detail provided to determine risks of other bias. |
| Methods | Randomised controlled trial | |
| Participants | 66 women randomised Setting: University of California, Irvine and Long Beach Memorial Medical Centre, USA Inclusion criteria: women with GDM who required insulin at or before 30 weeks’ gestation, with a singleton fetus. Women with elevated fasting values at the time of a 3‐hour OGTT received insulin; for others, insulin therapy was initiated if weekly fasting and post‐prandial (1 hour after breakfast) values exceeded 105 mg/dL or 140 mg/dL, respectively. Women were screened for GDM at 24 to 28 weeks' gestation with a 50 g 1‐hour OGCT; if the value was ≥ 140 mg/dL (7.8 mmol/L) but < 190 mg/dL* (10.6 mmol/L) a 3‐hour OGTT was performed, with GDM diagnosed with any 2 of the following abnormal values: fasting > 105 mg/dL (5.9 mmol/L); 1‐hour > 190 mg/dL (10.6 mmol/L); 2‐hour > 165 mg/dL (9.2 mmol/L); or 3‐hour > 145 mg/dL (8.1 mmol/L). (O'Sullivan and Mahan 1964 criteria; O'Sullivan 1964). Exclusion criteria: women with a history of diabetes before pregnancy, with pre‐existing hypertension, renal disease or autoimmune disorders | |
| Interventions | Postprandial monitoring plan (n = 33) Women were required to undertake daily monitoring of blood glucose concentrations before breakfast (fasting), and 1 hour after each meal for the duration of the pregnancy. preprandialmonitoring plan (n = 33) Women were required to undertake daily monitoring of fasting, preprandial and bedtime capillary blood glucose concentrations for the duration of the pregnancy. All women Women were evaluated weekly by the perinatal diabetes team (obstetrician, dietitian, nurse educator, counsellor) unless pregnancy complications (including poor glycaemic control, preterm labour or hypertension) made hospitalisation necessary. Women had a diet prescribed with 30 kcal to 35 kcal per kg of ideal body weight, divided into 3 meals and 1 to 3 snacks (with 40% to 45% of the energy provided by carbohydrates); calorie intake and food choices were adjusted at the weekly visits according to weight gain and blood glucose. All women received split‐dose therapy, with short‐ and intermediate‐acting human insulin, adjusted to achieve fasting blood glucose of 60 mg/dL to 90 mg/dL (3.3 mmol/L to 5 mmol/L) and preprandial values of 60 mg/dL to 105 mg/dL (3.3 mmol/L to 5.9 mmol/L) or post‐prandial values < 140 mg/dL. Women used memory‐based reflectance glucometers to measure their blood glucose; adjustments to insulin doses were made if any of the values were consistently higher than the target concentrations (with efforts made to normalise fasting glucose first). | |
| Outcomes | Review outcomes reported: hypertensive disorders of pregnancy (pre‐eclampsia); caesarean section; perineal trauma (3rd or 4th degree lacerations); gestational weight gain; adherence to intervention (compliance with schedule); use of pharmacotherapy (insulin dose); glycaemic control (change in HbA1c; hospitalisation for glycaemic control; success in glycaemic control); large‐for‐gestational age; stillbirth; gestational age at birth; Apgar score < 7 at 5 minutes; macrosomia; small‐for‐gestational age; birthweight; shoulder dystocia; nerve palsy (Erb’s palsy); bone fracture; hypoglycaemia (requiring glucagon or dextrose infusion); hyperbilirubinaemia | |
| Notes | Funding: not reported Declarations of interest: not reported Dates: not specified | |
| Risk of bias | ||
| Bias | Authors' judgement | Support for judgement |
| Random sequence generation (selection bias) | Unclear risk | Quote: "permuted‐block randomization was used;" no further details provided. |
| Allocation concealment (selection bias) | Unclear risk | No further details provided. |
| Blinding of participants and personnel (performance bias) | High risk | Not feasible to blind participants and personnel. |
| Blinding of outcome assessment (detection bias) | High risk | As above; and described in Discussion as a "non‐blinded study". |
| Incomplete outcome data (attrition bias) | Low risk | No losses to follow up or missing data. |
| Selective reporting (reporting bias) | Unclear risk | Reported all outcomes as per manuscript methods; however no access to trial protocol/registration to assess selective reporting further. |
| Other bias | Low risk | No other obvious risk of bias identified. |
| Methods | Randomised controlled trial | |
| Participants | 50 women randomised. Setting: 2 specialist antenatal diabetes clinics in North Ireland and the Republic of Ireland from January 2012 and May 2013 Inclusion criteria: women with GDM or impaired glucose tolerance following an OGTT (usually at week 24 to 28 weeks); with the ability to use the telemedicine equipment following training, sufficient communication abilities to be fully involved, and willingness to use one of the approved blood glucose meters for the duration of the study (including women who had a previous diagnosis of GDM or impaired glucose tolerance). For GDM or impaired glucose tolerance diagnosis, the report referenced the National Institute of Clinical Excellence: Diabetes in Pregnancy 2008 guidelines. Exclusion criteria: prior diagnosis of type 1 or 2 diabetes; receipt of oral steroid therapy | |
| Interventions | Telemedicine (n = 24) Women received standard care plus telemedicine. Women were reviewed weekly using telemedicine (commercially available facilities from Northern Ireland). They were given a set of scales, a blood pressure monitor, blood glucose meter and telemedicine hub (with a small screen and 3 buttons to collect and transit data from the woman’s home). Once a week the hub would activate and remind the woman it was time for her telemedicine session; she would measure her weight and blood pressure and send 7‐day stored blood glucose values to the hub, and would answer 3 questions (Have you been taking your insulin? Have you had any hypoglycaemic episodes? Have you had any intercurrent illness?) using yes/no buttons; the information was transmitted to the central server where it could be accessed by the women’s healthcare practitioner. A website was available where women could review their data. 1 to 2 days after submission of the data, the healthcare practitioner reviewed the data; if there were any problems, the healthcare practitioner could contact the woman by telephone to discuss any changes needed, or arrange a visit. Standard care (n = 26) Women received standard care (see below for details). All women Standard care followed the National Institute for Health and Care Excellence (NICE) guidelines for the management of GDM or impaired glucose tolerance; women were asked to monitor their blood glucose 7 times per day (before and after each meal and before bed), and to attend a specialist diabetes clinic at least every 2 weeks, where weight and blood pressure were measured, urinalysis was performed and glycaemia was evaluated using self‐monitored blood glucose records and HbA1c. | |
| Outcomes | Review outcomes reported: hypertensive disorders of pregnancy (pre‐eclampsia, pregnancy‐induced hypertension), caesarean section; induction of labour; use of additional pharmacotherapy (diabetes therapy at time of delivery); glycaemic control (HbA1c at 36 weeks; mean self‐monitored blood glucose); maternal hypoglycaemia; gestational weight gain (weight at 36 weeks); adherence (appointments attended; average daily self‐monitored blood glucose frequency (meter memory, diary)); average review length; stillbirth (intrauterine death); preterm birth; macrosomia; shoulder dystocia; respiratory distress syndrome (or transient tachypnoea of the newborn); hypoglycaemia (treated with dextrose); jaundice (no treatment needed; requiring phototherapy); malformations (diabetes‐related); neonatal intensive care unit admission; gestational age at birth; birthweight; head circumference; length | |
| Notes | Funding: "This work constituted part of a PhD for J.E.G., which was funded by the Department for Employment and Learning for Northern Ireland. A small start‐up grant was provided for the study by Derry City Council. The telemedicine service was provided free of charge at one of the trial sites;" "There was no involvement of the funders of this research or the telemedicine service provider in study design, data collection, data analysis, and manuscript preparation or publication decisions." Declarations of interest: "M.J.O’K. has received research funding from Nova Biomedical (a manufacturer of glucose meters). J.E.G., B.P.B., F.D., and V.E.C. declare no competing financial interests exist." Dates: January 2012 and May 2013 | |
| Risk of bias | ||
| Bias | Authors' judgement | Support for judgement |
| Random sequence generation (selection bias) | Low risk | Random allocation software was used to generate a stratified randomisation scheduled with blocks of 4‐6. |
| Allocation concealment (selection bias) | Low risk | An independent research secretary was used to allocate women to a group according to the schedule. |
| Blinding of participants and personnel (performance bias) | High risk | Quote: "Because of the nature of the intervention it was not possible to blind participants or HCPs." |
| Blinding of outcome assessment (detection bias) | Unclear risk | No details provided; unclear how lack of blinding would have affected outcomes. |
| Incomplete outcome data (attrition bias) | Unclear risk | Of the 24 women allocated to the intervention group, 3 were excluded from analyses (2 did not have a landline and mobile network coverage to allow data transfer; 1 withdrew); none of the 26 women in the control group were excluded from analyses. Questionnaires completed by 19/24 women in the intervention group and 22/26 in the control group; unclear impact in already small sample. For a number of outcomes, data are taken from the supplementary tables which indicated missing data for some women/babies, for different outcomes (i.e. separate Ns are reported for each outcome). |
| Selective reporting (reporting bias) | Unclear risk | No access to trial protocol to confidently assess selective reporting. |
| Other bias | Low risk | Very few baseline characteristics reported, though no clear differences; no other obvious sources of bias identified. |
| Methods | Randomised controlled trial | |
| Participants | 61 women randomised Setting: The Diabetes‐in‐Pregnancy Program at Temple University Hospital, Philadelphia, USA and/or its satellite hospitals, from March 1998 to November 1999 Inclusion criteria: women with GDM ≤ 33 weeks' gestation and fasting blood glucose ≤ 95 mg/dL on OGTT. GDM criteria not defined. Exclusion criteria: none stated | |
| Interventions | Self‐monitoring (n = 31) Women were taught to perform self‐monitoring of blood glucose using a reflectance meter with memory (One Touch Profile) and asked to measure the blood glucose 4 times per day (fasting and 1 hour after meals), for a total of 4 times per week. Periodic monitoring (n = 30) Women had their blood glucose concentrations measured (fasting and 1 hour after a meal) at each prenatal visit, or more frequently if clinically indicated. All women The diabetes and obstetric management protocol was identical for both groups, except for glucose surveillance. Individualised teaching/counselling regarding GDM and its management was provided to all women by the diabetes educator. All women were treated to attain the same metabolic goals: fasting blood glucose < 95 mg/dL, and 1‐hour post‐prandial glucose < 120 mg/dL; women who failed to meet the targets at least 90% of the time, were started on insulin. | |
| Outcomes | Review outcomes reported: pre‐eclampsia; caesarean section; perinatal mortality; large‐for‐gestational age; placental abruption; postpartum haemorrhage; gestational weight gain; adherence to the intervention (Dietary Compliance Questionnaire); sense of well‐being and quality of life (Diabetes Empowerment Scale; Appraisal of Diabetes Scale); use of additional pharmacotherapy; glycaemic control (preprandial and post‐prandial glucose); stillbirth; neonatal mortality; gestational age at birth; birthweight; hypoglycaemia; hyperbilirubinaemia; number of antenatal visits or admissions (visits with diabetes team); neonatal intensive care unit admission; 'birth trauma'; 'respiratory complications'. | |
| Notes | Funding: "This work was supported by a grant from the General Clinical Research Center branch of the National Center for Research Resources, Grant No. 2M01‐RR‐349" and "We would also like to thank LifeScan Inc, who generously donated the glucose meters for this study." Declarations of interest: not reported Dates: March 1998 to November 1999 | |
| Risk of bias | ||
| Bias | Authors' judgement | Support for judgement |
| Random sequence generation (selection bias) | Unclear risk | Quote: "A randomized controlled trial was undertaken". |
| Allocation concealment (selection bias) | Unclear risk | As above; no further details provided. |
| Blinding of participants and personnel (performance bias) | High risk | Not feasible to blind participants and personnel. |
| Blinding of outcome assessment (detection bias) | Unclear risk | No detail provided; unclear how lack of blinding would have affected outcomes. |
| Incomplete outcome data (attrition bias) | Unclear risk | 3 women in the periodic monitoring group were lost to follow‐up and were removed, as no outcome data were available; for the Diabetes Empowerment Scale, results were reported for 28/31 (90%) and 19/27 (70%) women in the 2 groups, indicating fewer women in the control group completed the questionnaire, but no reasons were given. It appears that all 31 and 27 women completed the other questionnaires. |
| Selective reporting (reporting bias) | Unclear risk | Not possible to assess confidently; no access to trial protocol. Insulin therapy reported only in Abstract, and not in Results text of manuscript. |
| Other bias | Low risk | No other obvious sources of bias identified. |
| Methods | Randomised controlled trial | |
| Participants | 63 women randomised Setting: prenatal clinics at Temple University Hospital, Philadelphia, USA, or one of its satellites; from September 2004 to May 2006 Inclusion criteria: women with GDM (3‐hour OGTT using Carpenter and Coustan 1982 criteria), between 18 and 45 years, at 33 weeks' gestation or less Exclusion criteria: women with prior history of glucose intolerance, or with multiple gestations | |
| Interventions | Telemedicine (n = 34) Women were asked to transmit information via a diabetes health network at least 3 times per week to their healthcare provider. Women without access to the internet received a refurbished computer with free telephone‐based web access to be used during the study; they received a 1‐hour training session by graduate/undergraduate students on how to use a computer, how to access websites, how to set up an email address and receive/send emails. The intervention used 'ITSMyHealthfile', a web‐based disease management interactive healthcare delivery system, with a secure internet server and database which allowed women to send blood glucose and other health data directly to their care provider (blood glucose; fetal movement counts; insulin doses; episodes of hypoglycaemia; ask questions/messages), and receive information and advice from healthcare providers. It required a log‐on ID and password. Standard care (n = 29) Women were asked to record information in a log‐book, which was reviewed by the medical team at prenatal visits. All women All received standard care in the ‘diabetes‐in‐pregnancy program’: were seen for clinical evaluation every 2 weeks until 36 weeks, after which they were seen weekly. Care was provided by a team of maternal‐fetal medicine specialists, residents, diabetes educator, and nutritionists. All received individualised dietary counselling and diabetes education and were instructed in glucose self‐monitoring with portable reflectance meters – women were asked to monitor 4 times per day (before breakfast; 2 hours after meals), and were treated to maintain: fasting glucose ≤ 95 mg/dL, and 2‐hour ≤ 120 mg/dL; women who failed to meet the targets > 90% of the time were started on glyburide or insulin. Women were also asked to perform fetal movement counting 3 times per day and record insulin doses and episodes of hypoglycaemia. | |
| Outcomes | Review outcomes reported: hypertensive disorders of pregnancy (pre‐eclampsia/gestational hypertension); caesarean section; placental abruption; use of additional pharmacotherapy (glyburide; insulin); glycaemic control (fasting blood sugar; blood glucose 2 hours post breakfast, lunch, dinner; mean; HbA1c at birth); adherence to intervention (frequency of monitoring; appointment adherence); sense of well‐being and quality of life (maternal feelings of diabetes self‐efficacy); large for gestational age; perinatal mortality; neonatal mortality or morbidity composite ('composite outcome'); stillbirth; neonatal mortality; preterm birth; respiratory distress syndrome/respiratory complications; hypoglycaemia; hyperbilirubinaemia/jaundice; neonatal intensive care unit admission; gestational age at birth; birthweight | |
| Notes | Funding: "This study was supported by grant RO3 NR008776‐01 from the National Institute of Nursing Research, National Institutes of Health". Declarations of interest: not reported Dates: September 2004 to May 2006 | |
| Risk of bias | ||
| Bias | Authors' judgement | Support for judgement |
| Random sequence generation (selection bias) | Unclear risk | Quote: "Women were randomized into one of two groups." |
| Allocation concealment (selection bias) | Unclear risk | As above; no further details provided. |
| Blinding of participants and personnel (performance bias) | High risk | Not feasible to blind participants and personnel. |
| Blinding of outcome assessment (detection bias) | Unclear risk | No detail provided; unclear how lack of blinding would have affected outcomes. |
| Incomplete outcome data (attrition bias) | Low risk | 29 women randomised to control group; 2 lost to follow‐up, 1 excluded (twin pregnancy), 1 did not meet criteria for GDM; therefore 25 included in analyses; 34 women randomised to intervention group, 2 formally withdrew; therefore 32 included in analyses. |
| Selective reporting (reporting bias) | Unclear risk | No access to trial protocol to enable confident assessment of selective reporting. |
| Other bias | Low risk | Comparable groups at baseline; no other obvious sources of bias apparent. |
| Methods | Randomised controlled trial | |
| Participants | 80 women randomised Setting: prenatal clinics at Temple University Hospital, Philadelphia, and Diabetes Education Program at Tallahassee Memorial Hospital, Tallahassee, USA; from September 2007 to November 2009 Inclusion criteria: women with GDM (on 3‐hour OGTT using the Carpenter and Coustan 1982 criteria), between 18 and 45 years, at 33 weeks' gestation or less Exclusion criteria: women with a prior history of glucose intolerance outside of pregnancy, or multiple gestations (twins, triplets) | |
| Interventions | Telemedicine (n = 40) Women were trained in the use of a computer and the internet, instructed on the details of the Internet program, and introduced to the website on a demonstration terminal at the clinic; automated telephone communication option and instructions were also offered for women with no Internet access. Women were provided with a password and log‐in name to gain access to the website, and an identification number to gain access to the telephone communication system. Women were prompted to input clinical data (blood glucose readings, changes in medications, episodes of hypoglycaemia) and identify the day or time. Women were provided with feedback, emotional support and reinforcement regarding self‐management with each transmission. Women received brief education message or suggestion each time they accessed the system. Women were asked to transmit information via phone/internet weekly to healthcare providers. The telemedicine system used was 'ITSMy Healthrecord', a web‐based, nurse‐co‐ordinated communication system, composed of a secure Internet server, a phone system and database, allowing data transfer (messages or clinical information) from patient to practice, and practice to patient in an asynchronous manner. Women dialled a toll‐free number or logged on through the internet using a unique log‐in and password – and could send messages or ask a question (45 seconds, or unlimited text input); nurses could then listen/review and respond (by typing a response that could be read or listened to); the system also provided reminders for women to record and transmit their data when required (3 phone call reminders, a day apart). Standard care (n = 40) Women were asked to record information in a logbook which was reviewed by the medical team at prenatal visits. All women Women were asked to monitor blood glucose daily (4 times per day: before breakfast and 2 hours after each meal). Women were treated to obtain metabolic goals: fasting glucose ≤ 95 mg/dL, 2‐hour: ≤ 120 mg/dL; women who did not meet these targets > 90% of the time were started on glyburide/insulin. Women were asked to perform fetal movement counting 3 times a day, and record insulin doses and episodes of hypoglycaemia. All women received standard care, and were seen for clinical evaluation every 2 weeks until 36 weeks, after which they were seen weekly (car provided by team: maternal‐fetal specialists, residents, diabetes educators, nutritionists); all women received individualised dietary counselling and diabetes education, and were instructed in glucose self‐monitoring. | |
| Outcomes | Review outcomes reported: hypertensive disorders of pregnancy (pre‐eclampsia/gestational hypertension); caesarean section; use of additional pharmacotherapy (oral agents; insulin); glycaemic control (fasting blood sugar; blood glucose 2‐hour post breakfast, lunch, dinner; mean); adherence to intervention (frequency of monitoring); large‐for‐gestational age; perinatal mortality; stillbirth; neonatal mortality; preterm birth; respiratory distress syndrome/respiratory complications; hypoglycaemia; hyperbilirubinaemia/jaundice; neonatal intensive care unit admission; gestational age at birth; birthweight; length of stay in neonatal intensive care unit | |
| Notes | Funding: "This study was supported by grant R21‐DK‐071694 from the National Institute of Diabetes and Digestive and Kidney Diseases, National Institutes of Health". Declarations of interest: "C.J.H., L.D., K.R., W.M., D.M., and J.G. have nothing to disclose. W.P.S. has stock ownership in Insight Telehealth Systems. A.A.B. is a consultant for Insight Telehealth Systems". Dates: September 2007 to November 2009 | |
| Risk of bias | ||
| Bias | Authors' judgement | Support for judgement |
| Random sequence generation (selection bias) | Unclear risk | Quote: "Women were randomized into one of two groups." |
| Allocation concealment (selection bias) | Unclear risk | As above; no further details provided. |
| Blinding of participants and personnel (performance bias) | High risk | Not feasible to blind participants and personnel. |
| Blinding of outcome assessment (detection bias) | Unclear risk | No detail provided; unclear how lack of blinding would have affected outcomes. |
| Incomplete outcome data (attrition bias) | Low risk | 3/40 women in the intervention group and 2/40 in the control group were lost to follow‐up; 1 woman in the intervention group experienced a fetal loss at 19 weeks. |
| Selective reporting (reporting bias) | Unclear risk | No access to trial protocol to enable confident assessment of selective reporting. |
| Other bias | Low risk | Comparable groups at baseline; no other obvious sources of bias apparent. |
| Methods | Randomised controlled trial | |
| Participants | 73 women randomised Setting: Finland Inclusion criteria: women with GDM, with singleton pregnancies. All women had a 2‐hour 75 g OGTT performed at 22 to 34 weeks' gestation as they belonged to a high‐risk group according to the evaluation system used in Finland (BMI > 25, > 40 years, previous child over 4500 g, glucosuria during pregnancy, weight gain during pregnancy > 20 kg, previous GDM or suspected fetal macrosomia). GDM was defined as having at least 2 abnormal high plasma glucose values out of 3 measurements in the 75 g OGTT (fasting > 5.1 mmol/L, 1‐hour > 10 mmol/L, 2‐hour > 8.7 mmol/L). Exclusion criteria: not reported | |
| Interventions | CGMS (n = 36) Women were taught how to use the CGMS equipment (and at least 4 daily plasma glucose calibration values were introduced to the apparatus); the mean duration of the registration period was 47.4 (2.5) hours. Women were asked not to take a shower during the monitoring period. Self‐monitoring (n = 37) All women All women came to the hospital for an interview and dietary counselling for low‐GI, low saturated fat eucaloric diet, and were taught how to measure plasma glucose, with an instruction to measure it 5 times per day (fasting plasma glucose, preprandial values and post‐prandial values 90 minutes after main meals), and asked to keep a dietary diary, and record exercise also. Treatment mode was determined within a week of starting monitoring; diet alone was considered insufficient if fasting plasma glucose was > 5.5 mmol/L twice, or was at least once > 5.5 mmol/L and post‐prandial value > 7.8 mmol/L or fasting plasma glucose ≤ 5.5 mmol/L but post‐prandial was at least twice > 7.8 mmol/L. Insulin was offered if at least 2 post‐prandial measurements were > 8.0 mmol/L; women with elevated fasting plasma glucose only were initially treated with metformin, and later combined with insulin if needed. | |
| Outcomes | Review outcomes reported: hypertensive disorders of pregnancy (pre‐eclampsia, pregnancy‐induced hypertension); caesarean section; perineal trauma; use of additional pharmacotherapy (insulin; metformin); gestational weight gain (total); perinatal mortality; stillbirth; neonatal mortality; gestational age at birth; preterm birth; macrosomia; birthweight; hypoglycaemia; hyperbilirubinaemia (UV treated); neonatal intensive care unit admission; length of stay in neonatal intensive care unit. | |
| Notes | Funding: "Turku University Central Hospital Research Fund, and The Foundation of Gynaecologists and Obstetricians in Finland supported this study". Declarations of interest: not reported Dates: not specified | |
| Risk of bias | ||
| Bias | Authors' judgement | Support for judgement |
| Random sequence generation (selection bias) | Unclear risk | Quote: "Patients were randomly allocated"; no further details provided. |
| Allocation concealment (selection bias) | Unclear risk | No details provided |
| Blinding of participants and personnel (performance bias) | High risk | Not feasible to blind participants and personnel. |
| Blinding of outcome assessment (detection bias) | Unclear risk | No details provided; unclear how lack of blinding would have affected outcomes. |
| Incomplete outcome data (attrition bias) | Unclear risk | It was not clear whether there were any women lost to follow‐up, or missing data for the outcomes reported, as this information was not provided. |
| Selective reporting (reporting bias) | High risk | Some results reported in text but not in tables, e.g. "There were no statistically significant differences between the two groups in… frequency of pre‐eclampsia, pregnancy‐induced hypertension, maternal lacerations… Apgar at… 10 min"; additional outcomes discussed in methods (e.g. shoulder dystocia, and PROM) not reported in results. Ns for hypoglycaemia and NICU admission unclear, as percentages indicate may not be 37 for control group. |
| Other bias | Unclear risk | Limited methodological details provided did not permit thorough assessment of other sources of bias. |
| Methods | Randomised controlled trial | |
| Participants | Setting: the Endocrinology and Metabolism Clinic of a large Midwestern health system; presumed to be in USA Inclusion criteria: pregnant women 18 years or older who sought treatment at the Endocrinology and Metabolism Clinic of a large Midwestern health system and were diagnosed with GDM. GDM diagnostic criteria not reported. Exclusion criteria: women who had been diagnosed with type 1 or 2 diabetes prior to pregnancy, or who were unwilling/unable to follow the protocol | |
| Interventions | Modem transmission (n = unclear; 72 across both groups; 18 analysed for satisfaction outcomes) Women transmitted blood glucose data to the clinic via the Acculink Modem; women were trained on how to use the modem to transmit blood glucose data from the meter to the clinic. Telephone transmission (n = 72 across both groups; 20 analysed for satisfaction outcomes) Women transmitted blood glucose data to the clinic via telephone calls directly to clinic personnel (research assistant/registered nurse). All women In both groups, women self‐tested blood glucose with an Accu‐Chek Complete meter. The duration of participation was from the first clinic visit to birth (thus length of participation was dependent on gestational age at GDM diagnosis; the mean duration was 6 weeks, with a range of 1 week to 22 weeks). At their first clinic visit, healthcare providers trained women about self‐monitoring of blood glucose, nutrition, and overall GDM management through educational literature and videos; if necessary, women received instruction on insulin administration; all women were asked to record the blood glucose results in a diary; all women were instructed to test and record their results 5 times daily, in accordance with standard care (before breakfast; 1 hour after each meal; before bed). Standard care involved reporting blood glucose values daily for the first 2 weeks after the first visit, then weekly thereafter; clinic personnel reviewed the blood glucose data received and provided feedback and guidance to the women via the telephone. Subsequent clinic visits were scheduled for 1 week after the first, and then every 2 weeks until 1 month before birth, then weekly until birth. | |
| Outcomes | Review outcome reported: views of the intervention (percentages were provided and used to calculate group numbers); gestational age at birth | |
| Notes | Funding: "Roche Diagnostics provided the authors with a grant as well as the blood glucose monitor supplies to do this study" Declarations of interest: not reported Dates: not specified | |
| Risk of bias | ||
| Bias | Authors' judgement | Support for judgement |
| Random sequence generation (selection bias) | Unclear risk | Quote: "were randomized by block randomization into two groups". |
| Allocation concealment (selection bias) | Unclear risk | No further details provided |
| Blinding of participants and personnel (performance bias) | High risk | Not feasible to blind participants and personnel. |
| Blinding of outcome assessment (detection bias) | Unclear risk | No details provided; unclear how lack of blinding would have affected outcomes. |
| Incomplete outcome data (attrition bias) | High risk | Results reported incompletely (see below), therefore not possible to determine incomplete outcome data for some outcomes (mean telephone consultation time; length of clinic visit; weeks of gestation); participant satisfaction survey response rate was 52%. |
| Selective reporting (reporting bias) | High risk | No access to published trial protocol/trial registration; few outcomes reported (no clinical outcomes, except weeks of gestation) and focused on consultation time, and satisfaction only. A number of results reported as P values only. |
| Other bias | Unclear risk | No baseline characteristics were reported for the 2 groups (ethnicity and gestational age, and age across the population were reported). |
| Methods | Randomised controlled trial | |
| Participants | 100 women randomised Setting: the Unit of Gestational Diabetes of the Hospital Clinico Universitario San Carlos of Madrid, Spain from June to December 2007 Inclusion criteria: women with GDM (Carpenter‐Coustan criteria) before 28 weeks Exclusion criteria: not detailed | |
| Interventions | Telemedicine (n = 50) Women received a Glucometer (Accu‐Chek Compact Plus) with a cellular phone (which allowed the transmission of glucose values to the central database via a short message service SMS). Women were recommended to send their glucose values to the medical terminal once a week. An endocrinologist and diabetes nurse educator evaluated the data from a PC with Internet connection. Health professionals could then send text messages from their computer to the women, making recommendations for nutritional changes, or adjustments in insulin doses; women could send text messages with questions/answers. Standard care (n = 50) Women were followed according to standard protocol (face‐to‐face outpatient monitoring), and were given the opportunity to attend the outpatient clinic without prior appointment, and bring in their logbook when their glucose values were above the targets, of for any queries re: nutritional recommendations or insulin dose. All women Women were instructed by the nurse educator in nutritional habits and self‐monitoring of blood glucose and informed about the goals of glycaemic control: fasting blood glucose and preprandial blood glucose < 95 mg/dL; 1‐hour post‐prandial blood glucose < 120 mg/dL. At visit 1 (before 28 weeks' gestation), capillary blood glucose values were evaluated (6 measurements a day were recommended during the first week; if more than 4 of 5 fasting and pre‐meal glycaemic values were < 95 mg/dL in the first week, only 1‐hour post‐meal capillary blood glucose measurements were recommended daily or every other day until delivery). During the follow up, 4 face‐to‐face visits (once a month) were scheduled until birth; glucose values recorded by women in their log‐books were evaluated and episodes of mild/severe hypoglycaemia and insulin requirements registered. | |
| Outcomes | Review outcomes reported: hypertensive disorders or pregnancy (pregnancy‐induced hypertension); caesarean section; placental abruption; use of additional pharmacotherapy (insulin treated); glycaemic control (HbA1c at visit 4 (39‐40 weeks); HbA1c < 5.8%); gestational weight gain; view of intervention; total contact hours per‐insulin treated woman; face‐to‐face visits; unscheduled visits; costs; large‐for‐gestational age; preterm birth; small‐for‐gestational age; shoulder dystocia; hypoglycaemia; hypocalcaemia; polycythaemia (poliglobulia); gestational age at birth; birthweight | |
| Notes | Funding: "This work was supported by grants from Fundacion para Estudios Metabolicos". Declarations of interest: "The authors declare that they have no conflicts of interest" The 8 women most likely to require insulin after the evaluation of the first week were allocated to telemedicine group; and the other 92 were randomised to telemedicine or standard monitoring. Dates: June to December 2007 | |
| Risk of bias | ||
| Bias | Authors' judgement | Support for judgement |
| Random sequence generation (selection bias) | High risk | Quote "were randomized;" see below |
| Allocation concealment (selection bias) | High risk | Not detailed; not achieved for 8 women most likely to require insulin who were allocated to telemedicine group. |
| Blinding of participants and personnel (performance bias) | High risk | Not feasible to blind participants and personnel. |
| Blinding of outcome assessment (detection bias) | Unclear risk | No detail provided; unclear how lack of blinding would have affected outcomes. |
| Incomplete outcome data (attrition bias) | Low risk | Of 100 women randomised, 97 (49 in the intervention group and 48 in the control group) completed the study. |
| Selective reporting (reporting bias) | Unclear risk | No access to trial protocol to enable confident assessment of selective reporting. Some data incompletely reported, e.g. "We did not detect differences in clinical and laboratory data during the follow up nor were differences in delivery and neonatal outcomes observed"; while the average total contact per insulin‐treated woman was reported, no variance was reported for this outcome; and the contact for all women was not clearly reported (only "There was a significant 62% reduction in outpatient clinic visits in women from the telemedicine group"). Methods detailed that loss of work days and the number of hospital admissions were regularly recorded, but no results were reported for these outcomes. |
| Other bias | Low risk | Comparable groups at baseline; no other obvious sources of bias apparent. |
| Methods | Randomised controlled trial | |
| Participants | 347 women randomised Setting: Sainte‐Justine Hospital, Montreal, Canada, from 1 June 1993 to 31 May 1994 Inclusion criteria: women with GDM (diagnosed according to institution criteria: 1‐hour 50 g glucose screen ≥ 11.1 mmol/L (200 mg/dL)); or glucose screen between 8.9 (160 mg/dL) and 11.0 mmol/L (198 mg/dL) with 2 or more abnormal values on a 3‐hour 100 g OGTT before 26 weeks (fasting: 5.3 mmol/L (95 mg/dL), 1‐hour: 10 mmol/L (180 mg/dL); 2‐hour: 8.9 mmol/L (160 mg/dL); 3‐hour: 7.8 mmol/L (140 mg/dL)); or during and after 26 weeks (fasting: 5.6 mmol/L (101 mg/dL), 1‐hour: 11.1 mmol/L (200 mg/dL); 2‐hour: 9.2 mmol/L (166 mg/dL); 3‐hour: 8.3 mmol/L (149 mg/dL)). Exclusion criteria: multiple pregnancy, fetus with congential malformation, current diet or insulin therapy, before 22 weeks or later than 38 weeks. Post‐randomisation exclusions: birth in another centre, birth within 2 weeks of randomisation, steroid therapy | |
| Interventions | Self‐monitoring (home) (n = 172; 112 with breakfast result < 7.8 mmol/L; 60 with breakfast result ≥ 7.8 mmol/L) Women took blood glucose measurements 3 times daily (1 hour after each meal) alternating with 4 times a day (before each meal and at bed time) using memory‐based reflectance meters, checked regularly. Periodic monitoring (outpatient follow‐up) (n = 170; 115 with breakfast result < 7.8 mmol/L; 55 with breakfast result ≥ 7.8 mmol/L) Women had outpatient clinic follow‐up, with capillary fasting and/or 1‐hour post‐breakfast glucose assessment by nurse educator every 2 weeks. Women were transferred to home monitoring as soon as 1 of their glucose assessments was higher than the goals. All women After an 8‐hour fast, women ingested standardised breakfast over 10 minutes, at 8am; 1 hour later, blood glucose was sampled: results were divided into those below and at or above 7.8 mmol/L (140 mg/dL). Target glucose concentrations were 5.3 mmol/L (95 mg/dL) fasting; 5.6 mmol/L (101 mg/dL) before dinner and supper and 7.8 mmol/L (140 mg/dL) 1‐hour post‐prandial. Women were started on insulin therapy when 25% or more of their home blood glucose concentrations during the previous 2 weeks were higher than the previously mentioned goals; insulin was adjusted to reach the same target goals. All women were prescribed a diet without refined carbohydrates, with 45% complex carbohydrate, 35% fat, 20% protein, divided into 3 meals and 4 snacks: 35 kcal/kg for non‐obese, 25 kcal/kg for obese women; all women were seen at 2‐week intervals. | |
| Outcomes | Review outcomes reported: caesarean section; gestational weight gain; adherence (poor compliance); use of additional pharmacotherapy (insulin therapy); glycaemic control (preprandial glucose; post‐prandial glucose); perinatal mortality; large‐for‐gestational age; stillbirth; gestational age at birth; macrosomia; small‐for‐gestational age; birthweight; shoulder dystocia; hypoglycaemic; hyperbilirubinaemia; costs associated with the intervention | |
| Notes | Funding: "This study was supported by a grant from Lilly Canada" Declarations of interest: not reported Dates: June 1993 to May 1994 | |
| Risk of bias | ||
| Bias | Authors' judgement | Support for judgement |
| Random sequence generation (selection bias) | Low risk | Quote: "women were randomized with stratification according to their ethnic origin (white and others) to either outpatient clinic follow‐up or self‐monitoring of blood glucose with a meter (home monitoring). A computer‐generated table of random numbers with permuted‐block randomization was used". |
| Allocation concealment (selection bias) | Unclear risk | No details provided |
| Blinding of participants and personnel (performance bias) | High risk | Not feasible to blind participants and personnel. |
| Blinding of outcome assessment (detection bias) | Unclear risk | No detail provided; unclear how lack of blinding would have affected outcomes. |
| Incomplete outcome data (attrition bias) | Low risk | Of 347 women randomised, 5 were excluded (2 delivered preterm within 2 weeks of enrolment; 2 received long‐term high‐dose steroids for preterm labour; 1 delivered in another centre). Although 2.6% and 52.7% of women with a breakfast < 7.8 mmol/L and ≥ 7.8 mmol/L on clinic follow‐up were transferred to home monitoring respectively, "The data from the women included in the statistics were analysed according to their randomization". |
| Selective reporting (reporting bias) | Unclear risk | No access to trial protocol to enable confident assessment of selective reporting. |
| Other bias | Low risk | No other obvious sources of bias identified. |
| Methods | Randomised controlled trial | |
| Participants | 120 women randomised Setting: Department of Endocrinology, Zhongda Hospital, the Affiliated Hospital of Southeast University, China from September 2011 to December 2012 Inclusion criteria: women between 24 and 28 weeks' gestation with a singleton pregnancy, GDM, and written informed consent. All women underwent a 75 g OGTT at 24 to 28 weeks according to the criteria of the American Diabetes Association (ADA). Based on the 1‐step approached recommended by the World Health Organization, ADA and IADPSG, women were defined as having GDM if they had at least 1 abnormally high plasma glucose out of the 3 measurements: fasting > 92 mg/dL (5.1 mmol/L), 1‐hour > 180 mg/dL (10.0 mmol/L), or 2‐hour > 153 mg/dL (8.5 mmol/L). Exclusion criteria: diagnosis of diabetes mellitus, previous treatment for GDM, presence of infection, or other severe metabolic, endocrine, medical or psychological co‐morbidities | |
| Interventions | CGMS (n = 58*) There were 2 groups: CGMS early subgroup (n = 30): during gestational weeks 24 to 28; and CGMS late subgroup (n = 30): during gestational weeks 28 to 36. *There were 3 additional women who withdrew following allocation, it was unclear if they were allocated to the early or late subgroup. The CGMS group was monitoring using CGMS (Gold Medtronic MiniMed, Northbridge, CA, USA), with the sensor inserted into the upper outer buttock of the subjects. While women wore the sensor, glucose concentrations (bedtime, and 1 hour before the beginning of each meal) were also monitored using the Accu‐Chek meters and were input into the CGMS as calibration 4 times per day. Self‐monitoring (n = 62) All women Women were taught to perform self‐monitoring of blood glucose using Accu‐Chek Advantage meters (Roche Diagnostics, Manheim, Germany). Women were instructed to check their level 4 times per day (fasting, and 1 hour after the beginning of each meal) from the first visit at which they received the GDM diagnosis until birth (except during the period where the GGMS group used their device). Women underwent dietary counselling for a eucaloric diet with a low GI and low saturated fat levels (50% to 60% energy from carbohydrates; 25% to 30% from fat; 15% to 20% from protein; with energy intake distributed as equally as possible throughout the day, based on recommendations of the China Diabetic Association). Moderate intensity exercise was encouraged; 35 to 45 minute sessions, three times a week. A physiotherapist motivated the women to continue or start exercising, and provided written instructions, with walking, swimming and cycling recommended as types of exercise. Insulin treatment was administered under conditions of 2 fasting blood glucose values > 105 mg/dL (5.8 mmol/L), 2 1‐hour post‐prandial levels > 155 mg/dL (8.6 mmol/L), a 2‐hour post‐prandial level > 130 mg/dL (7.2 mmol/L), or a fasting blood glucose > 90 mg/dL (5.5 mmol/L) with at least 2 post‐prandial values > 141 mg/dL (7.5 mmol/L) according to ADA guidelines. Women received NPH insulin as an immediate acting insulin with an initial dose of 0.2 units/kg; if fasting levels were high, treatment was given before bed‐time; if post‐prandial levels were high, regular insulin or short acting insulin was given before meals. Follow‐up meetings were every 2 to 4 weeks until 28 weeks, fortnightly until 32 weeks, and weekly thereafter. | |
| Outcomes | Review outcomes reported: caesarean section; use of additional pharmacotherapy (insulin use; dose); glycaemic control (HbA1c); hypoglycaemia; gestational weight gain (and excessive; inadequate; appropriate gain); views of intervention; large‐for‐gestational age; perineal mortality; stillbirth; neonatal death; preterm birth; macrosomia; small‐for‐gestational age; hypoglycaemia; gestational age at birth; birthweight | |
| Notes | Funding: "This work was partially supported by the following foundation: the Social Development Project of JiangSu Province (No. SBE201170735, Wang SH)". Declarations of interest: "The authors declare no competing financial interests". Dates: September 2011 to December 2012 | |
| Risk of bias | ||
| Bias | Authors' judgement | Support for judgement |
| Random sequence generation (selection bias) | Low risk | Quote: "randomly allocated … by a computer generated random number table". |
| Allocation concealment (selection bias) | Unclear risk | No details provided |
| Blinding of participants and personnel (performance bias) | High risk | Not feasible to blind participants and personnel. |
| Blinding of outcome assessment (detection bias) | Unclear risk | No detail provided; unclear how lack of blinding would have affected outcomes. |
| Incomplete outcome data (attrition bias) | Low risk | 120 women were randomised, and 106 were analysed; 58 were randomised to CGMS and 62 to self‐monitoring; overall 51/58 were analysed in the CGMS group and 55/62 in the self‐monitoring group. In the CGMS group, 2 withdrew, 1 had site discomfort, 3 were lost, and 1 discontinued; in the self‐monitoring group, 4 were lost, and 3 discontinued. |
| Selective reporting (reporting bias) | Unclear risk | No access to trial protocol to enable confident assessment of selective reporting. |
| Other bias | Low risk | No other obvious sources of bias identified. |
Abbreviations
BMI: body‐mass index
CGMS: continuous glucose monitoring system
GDM: gestational diabetes mellitus
GI: glycaemic index
HbA1c: glycated haemoglobin
IADPSG: International Association of the Diabetes and Pregnancy Study Groups
NICU: neonatal intensive care unit
OGCT: oral glucose challenge test
OGTT: oral glucose tolerance test
PROM: preterm rupture of membranes
Characteristics of excluded studies [ordered by study ID]
| Study | Reason for exclusion |
| This randomised trial is included in the Alwan 2009 Cochrane Review that assessed treatments for women with GDM. The monitored group were given standard dietary advice, glucose metabolism was monitored by capillary glucose series 5 days a week, HbA1c was measured monthly (insulin was introduced if 5 or more capillary measurements > 7.0 mmol/L in 1 week), serial ultrasound for growth and amniotic fluid, Doppler studies, CTG monitoring. The unmonitored group received dietary advice, and HbA1c monthly, but no capillary glucose measurements. | |
| This was a cross‐over randomised trial, in women with type 2 diabetes or GDM. The trial compared a traditional method of blood sugar reporting using telephone and voicemail and a novel method using cell phone/internet technology. | |
| This was a cross‐over randomised trial, in women with type 2 diabetes or GDM. The trial compared the use of Softsense and Optium (MediSense Products) meters. | |
| This randomised controlled trial assessed a structured pharmaceutical care service (including education and introduction of intensive self‐monitoring) for women with GDM. Women in the pharmaceutical care intervention group received care by a clinical pharmacist at baseline, and reinforced at monthly clinic visits, with education about GDM and its management (including advice on diet, exercise, blood glucose control, self‐monitoring of glucose, and adjustment of treatment if required; a printed educational booklet; and instructions for self‐monitoring of blood glucose). Control women received traditional care (which included monthly clinic visits and self‐monitoring of plasma glucose using diary cards, but did not include patient education or counselling by the clinical pharmacist, or liaison between the clinical pharmacist and the prescribing doctor). This trial is likely to be eligible for the Brown 2017 Cochrane Review. | |
| Participants were pregnant women, not specifically women with GDM. All women received a 50 g 3‐hour and 75 g 2‐hour OGTT in a random order, 7 days apart between 28 and 32 weeks' gestation. Women were compared according to whether they received the 50 g test first or 75 g test first. |
Abbreviations
CTG: cardiotocography
GDM: gestational diabetes mellitus
HbA1c: glycated haemoglobin
OGTT: oral glucose tolerance test
Characteristics of studies awaiting assessment [ordered by study ID]
| Methods | Randomised controlled trial |
| Participants | 128 women with GDM |
| Interventions | Continuous glucose monitoring group (N = 68): women wore continuous glucose monitors for 72 hours. Control group (N = 60): women tested capillary blood glucose with a single spot blood glucose meter 7 times per day. |
| Outcomes | Abstract reported on hypoglycaemia and hyperglycaemia. |
| Notes | Published as an Abstract only; no contact details available for authors as at 19 September 2016. |
| Methods | Randomised controlled trial |
| Participants | 50 women with insulin‐requiring GDM |
| Interventions | Continuous glucose monitoring group (N = 25): women underwent professional continuous glucose monitoring using the iPro2 Enlite 6‐day sensor at 28, 32 and 36 weeks' gestation. Control group (N = 25): no continuous glucose monitoring Women in both groups performed 7 point finger‐stick glucose profiles 3 times per week. |
| Outcomes | Abstract reported on HbA1c; hypoglycaemia, euglycaemia and hyperglycaemia; insulin dose; and birthweight. |
| Notes | Note: 2014 Abstract reported on 24 women; 2015 Abstract reported on 50 women (trial registration originally suggested 80 women were to be randomised, however this was updated to 50 women). Published as 2 Abstracts only; contacted trial author ([email protected]) re availability of full trial report on 19 September 2016. |
| Methods | Randomised controlled trial |
| Participants | Women with GDM |
| Interventions | Telemedicine group (N = not reported): women were managed via the G‐DEMANDE PHS system. Standard protocol group (N = not reported): women were managed by regular clinic visits. |
| Outcomes | Abstract reported on acceptability (satisfaction; at ease with the technology), and blood glucose. |
| Notes | Published as an Abstract only; contacted trial author ([email protected]) re availability of full trial report on 19 September 2016. Received a response on 20 September 2016; as yet, the trial has not been published, or is not available as a full report. |
| Methods | Randomised controlled trial |
| Participants | 69 women with GDM |
| Interventions | Active group (N = not reported): women used the computer‐based smart telemedicine system for automated support; and downloaded blood glucose data every 3 days. Control group (N = not reported): women attended usual weekly visits. |
| Outcomes | Abstract reported on blood glucose downloads; number of changes in diet automatically proposed; blood glucose and % blood glucose > 140 mg/dL; HbA1c; 'perinatal outcomes'; and face‐to‐face visits. |
| Notes | Published as an Abstract only; contacted trial author ([email protected]) re availability of full trial report on 19 September 2016. Received a response on 29 September 2016; as yet, the trial has not been published, or is not available as a full report. |
Abbreviations
GDM: gestational diabetes mellitus
HbA1c: glycated haemoglobin
Characteristics of ongoing studies [ordered by study ID]
| Trial name or title | GlucoMOMS trial |
| Methods | Randomised controlled trial |
| Participants | Pregnant women aged 18 and over with either diabetes mellitus type 1 or 2 on insulin therapy or with GDM requiring insulin therapy before 30 weeks of gestation. |
| Interventions | Intervention group: women will use continuous glucose monitoring for 5 to 7 days every 6 weeks; based on their profiles, they will receive dietary advice and insulin therapy adjustments if necessary. Control group: women will receive usual care. All women will determine their glycaemic control by self‐monitoring of blood glucose levels and HbA1c. |
| Outcomes | Primary outcome: macrosomia (birthweight > 90th centile) Secondary outcomes: maternal: pre‐eclampsia; caesarean section; hypoglycaemia; HbA1c levels; and glucose variability; neonatal: birthweight; preterm birth; perinatal death; birth trauma; hypoglycaemia; respiratory distress syndrome; bronchopulmonary dysplasia; intraventricular haemorrhage; necrotising enterocolitis; and sepsis |
| Starting date | Planned start date: 1 July 2011 |
| Contact information | Daphne N Voormolen: d.p.vanmunster‐[email protected] |
| Notes | Recruitment target: 300 women 2016 Abstract reported that as of Septenber 2015, 300 pregnant women were included (N = 108 with GDM). |
| Trial name or title | Evaluation of the efficacy of self monitoring blood glucose for GDM with 1 point abnormality |
| Methods | Randomised controlled trial |
| Participants |
|
| Interventions | Intervention group: self‐blood glucose monitoring |
| Outcomes | Outcomes: body weight; HbA1c; glycoalbumin plasma glucose; insrinogenic index; continuous glucose monitoring; neonatal complications; and complications of pregnancy |
| Starting date | Anticipated start date: 5 January 2016 |
| Contact information | Toshiaki Hanafusa: [email protected]‐med.ac.jp Department of Internal Medicine, Osaka Medical College, Osaka, Japan |
| Notes | Recruitment target: 60 women |
| Trial name or title | Self‐blood glucose monitoring and real‐time continuous glucose monitoring in patients with GDM |
| Methods | Randomised controlled trial |
| Participants | Women with newly diagnosed GDM who meet 'two‐step' approach (Carpenter and Coustan criteria) at 24‐28 weeks' gestation. |
| Interventions | Intervention group: as per control group, plus real‐time continuous glucose monitoring Control group: women receive education every 1 to 2 weeks, about glucose controlling and diet, according to their self‐monitored glucose levels. |
| Outcomes | Primary outcome: composite maternal and neonatal outcome consisting of: pregnancy‐induced pre‐eclampsia; preterm birth; macrosomia/large‐for‐gestational age/small‐for‐gestational age; and obstetric trauma Secondary outcomes: caesarean birth; eclampsia, gestational hypertension; intrauterine fetal death; gestational age at birth; birthweight, birthweight percentile; neonatal hypoglycaemia; hyperbilirubinaemia; respiratory distress syndrome |
| Starting date | Anticipated date of first enrolment: 29 May 2015 |
| Contact information | Jae Hyeon KIm: [email protected] Samsung Medical Center, Seoul, South Korea |
| Notes | Recruitment target: 178 women |
| Trial name or title | Trial of remote evaluation and treatment of GDM (TREAT‐GDM) |
| Methods | Randomised controlled trial |
| Participants | Women with abnormal glucose tolerance test in this pregnancy (as defined by IADPSG recommendations); not requiring pharmacological treatment at recruitment; started on oral hypoglycaemic therapy at recruitment; with a singleton pregnancy; able to travel to hospital independently |
| Interventions | Intervention group: women will receive the GDM‐health system and half the normal clinic visits. Control group: women will receive normal clinic care. |
| Outcomes | Primary outcome: mean blood glucose from recruitment to delivery calculated, with adjustments made for number of measurements, proportion of preprandial and post‐prandial readings and length of time in study Secondary outcomes: compliance; maternal and neonatal outcomes; glycaemic control using HbA1c and other blood glucose metrics; attitudes to care; resource use |
| Starting date | September 2013 |
| Contact information | Lucy Mackillop; [email protected] Nuffield Department of Obstetrics and Gynaecology, John Radcliffe Hospital, Oxford, UK |
| Notes | Recruitment target: 203 women |
| Trial name or title | Frequency of blood glucose monitoring in patients with GDM (GLIMPSE) |
| Methods | Randomised controlled trial |
| Participants | Women with GDM diagnosed using ACOG criteria; between 20‐32 weeks gestation; singleton pregnancies; not requiring medical therapy after the first weeks of blood glucose monitoring |
| Interventions | Intervention group: blood glucose monitoring every other day as per below Control group: blood glucose monitoring done every day (during a fasting state and 2 hours after breakfast, lunch and dinner) continued throughout gestation. |
| Outcomes | Primary outcome: neonatal weight Secondary outcome: macrosomia |
| Starting date | May 2013 |
| Contact information | Hector Mendez‐Figueroa: [email protected] The University of Texas Health Science Center, Houston, USA |
| Notes | Recruitment target: 286 women |
| Trial name or title | Telemedicine for insulin treated GDM (TeleGDM) |
| Methods | Randomised controlled trial |
| Participants | IADPSG criteria based clinical diagnosis of GDM confirmed by OGTT; 24 to 33 weeks' gestation, or earlier diagnosis if in high risk group; management of hyperglycaemia with insulin; smart phone/tablet with internet access and/or internet connected personal computer; not requiring an interpreter to navigate through the healthcare system |
| Interventions | Intervention group: telemedicine as an add‐on (adjunct) to usual care Control group: usual care |
| Outcomes | Primary outcome: patient service utilisation: assessed as a composite of scheduled face‐to‐face consultations, unscheduled face‐to‐face consultations, and telephone consultations. Secondary outcomes: glycaemic control; diabetes self efficacy; patient satisfaction; clinician satisfaction; service provision costs; technology capability and capacity; insulin adjustments; type of delivery (normal vaginal delivery, caesarean delivery or instrument deliveries); large‐for‐gestational age; macrosomia; and neonate admissions to special care nursery |
| Starting date | Anticipated date of first enrolment: 2 September 2014 |
| Contact information | Tshepo Rasekaba: [email protected] School of Medicine,The University of Melbourne, Australia |
| Notes | Recruitment target: 100 women |
| Trial name or title | Home versus hospital care in glucose monitoring of GDM and mild gestational hyperglycemia |
| Methods | Randomised controlled trial |
| Participants | Women with GDM, pre‐GDM or mild gestational hyperglycaemia |
| Interventions | Intervention group: home care, 'ambulatory care' or 'outpatient' care; blood glucose self‐monitoring by the women at home Control group: hospital care, 'acute care'; control of diabetes at hospitals by admission to hospital |
| Outcomes | Primary outcomes: maternal mortality and morbidity; perinatal mortality and morbidity Secondary outcomes: glucose control; maternal hospitalisation for any cause and prolonged hospitalisation; maternal prenatal and postnatal acute care visits; length of stay for delivery; postpartum repeated hospitalisation; biophysical profile tests; preterm birth; birthweight; infant repeated hospitalisation; infant acute care visits; costs |
| Starting date | May 2010 |
| Contact information | Marilza Rudge |
| Notes | Recruitment target: 80 women |
Abbreviations
ACOG: American Congress of Obstetricians and Gynecologists
GDM: gestational diabetes mellitus
HbA1c: glycated haemoglobin
IADPSG: International Association of the Diabetes and Pregnancy Study Groups
OGTT: oral glucose tolerance test
Data and analyses
| Outcome or subgroup title | No. of studies | No. of participants | Statistical method | Effect size |
| 1 Hypertensive disorders of pregnancy Show forest plot | 4 | 275 | Risk Ratio (M‐H, Fixed, 95% CI) | 1.49 [0.69, 3.20] |
| Analysis 1.1  Comparison 1 Telemedicine versus standard care for glucose monitoring, Outcome 1 Hypertensive disorders of pregnancy. | ||||
| 1.1 Pre‐eclampsia, pregnancy‐induced hypertension | 3 | 178 | Risk Ratio (M‐H, Fixed, 95% CI) | 1.29 [0.58, 2.89] |
| 1.2 Pregnancy‐induced hypertension | 1 | 97 | Risk Ratio (M‐H, Fixed, 95% CI) | 4.9 [0.24, 99.48] |
| 2 Caesarean section Show forest plot | 5 | 478 | Risk Ratio (M‐H, Random, 95% CI) | 1.05 [0.72, 1.53] |
| Analysis 1.2  Comparison 1 Telemedicine versus standard care for glucose monitoring, Outcome 2 Caesarean section. | ||||
| 3 Perinatal mortality Show forest plot | 2 | 131 | Risk Ratio (M‐H, Fixed, 95% CI) | 0.0 [0.0, 0.0] |
| Analysis 1.3  Comparison 1 Telemedicine versus standard care for glucose monitoring, Outcome 3 Perinatal mortality. | ||||
| 4 Large‐for‐gestational age Show forest plot | 3 | 228 | Risk Ratio (M‐H, Fixed, 95% CI) | 1.41 [0.76, 2.64] |
| Analysis 1.4  Comparison 1 Telemedicine versus standard care for glucose monitoring, Outcome 4 Large‐for‐gestational age. | ||||
| 5 Death or serious morbidity composite Show forest plot | 1 | 57 | Risk Ratio (M‐H, Fixed, 95% CI) | 1.06 [0.68, 1.66] |
| Analysis 1.5  Comparison 1 Telemedicine versus standard care for glucose monitoring, Outcome 5 Death or serious morbidity composite. | ||||
| 6 Operative vaginal birth (not a prespecified outcome) Show forest plot | 1 | 47 | Risk Ratio (M‐H, Fixed, 95% CI) | 0.50 [0.11, 2.30] |
| Analysis 1.6  Comparison 1 Telemedicine versus standard care for glucose monitoring, Outcome 6 Operative vaginal birth (not a prespecified outcome). | ||||
| 7 Induction of labour Show forest plot | 1 | 47 | Risk Ratio (M‐H, Fixed, 95% CI) | 1.06 [0.63, 1.77] |
| Analysis 1.7  Comparison 1 Telemedicine versus standard care for glucose monitoring, Outcome 7 Induction of labour. | ||||
| 8 Placental abruption Show forest plot | 2 | 154 | Risk Ratio (M‐H, Fixed, 95% CI) | 0.88 [0.12, 6.42] |
| Analysis 1.8 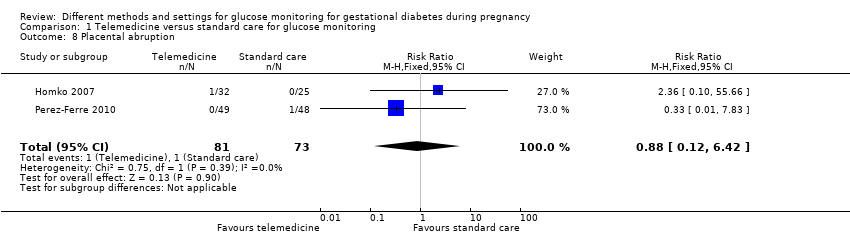 Comparison 1 Telemedicine versus standard care for glucose monitoring, Outcome 8 Placental abruption. | ||||
| 9 Gestational weight gain (kg) Show forest plot | 2 | 300 | Mean Difference (IV, Fixed, 95% CI) | ‐0.47 [‐1.50, 0.55] |
| Analysis 1.9  Comparison 1 Telemedicine versus standard care for glucose monitoring, Outcome 9 Gestational weight gain (kg). | ||||
| 10 Weight at 36 weeks (kg) Show forest plot | 1 | 44 | Mean Difference (IV, Fixed, 95% CI) | 5.5 [‐5.69, 16.69] |
| Analysis 1.10  Comparison 1 Telemedicine versus standard care for glucose monitoring, Outcome 10 Weight at 36 weeks (kg). | ||||
| 11 Adherence to the intervention Show forest plot | 3 | Mean Difference (IV, Fixed, 95% CI) | Subtotals only | |
| Analysis 1.11  Comparison 1 Telemedicine versus standard care for glucose monitoring, Outcome 11 Adherence to the intervention. | ||||
| 11.1 Appointments attended (%) | 1 | 47 | Mean Difference (IV, Fixed, 95% CI) | 5.20 [‐2.27, 12.67] |
| 11.2 Average daily self‐monitoring of blood glucose frequency: meter memory | 1 | 44 | Mean Difference (IV, Fixed, 95% CI) | 0.5 [‐0.42, 1.42] |
| 11.3 Average daily self‐monitoring of blood glucose frequency: diary | 1 | 45 | Mean Difference (IV, Fixed, 95% CI) | 0.10 [‐0.66, 0.86] |
| 11.4 Frequency of monitoring (number of data points) | 1 | 57 | Mean Difference (IV, Fixed, 95% CI) | 21.10 [‐9.33, 51.53] |
| 11.5 Frequency of monitoring (number of data sets) | 1 | 74 | Mean Difference (IV, Fixed, 95% CI) | 1.20 [‐12.32, 14.72] |
| 12 Sense of well‐being and quality of life: DES: Diabetes Empowerment Scale Show forest plot | 1 | Mean Difference (IV, Fixed, 95% CI) | Subtotals only | |
| Analysis 1.12  Comparison 1 Telemedicine versus standard care for glucose monitoring, Outcome 12 Sense of well‐being and quality of life: DES: Diabetes Empowerment Scale. | ||||
| 12.1 Total | 1 | 57 | Mean Difference (IV, Fixed, 95% CI) | 0.40 [0.14, 0.66] |
| 12.2 Subscale 1: managing the psychosocial aspects of diabetes | 1 | 57 | Mean Difference (IV, Fixed, 95% CI) | 0.5 [0.21, 0.79] |
| 12.3 Subscale 2: assessing dissatisfaction and readiness to change | 1 | 57 | Mean Difference (IV, Fixed, 95% CI) | 0.40 [0.14, 0.66] |
| 12.4 Subscale 3: setting and achieving diabetes goals | 1 | 57 | Mean Difference (IV, Fixed, 95% CI) | 0.30 [‐0.04, 0.64] |
| 13 Use of additional pharmacotherapy Show forest plot | 5 | Risk Ratio (M‐H, Fixed, 95% CI) | Subtotals only | |
| Analysis 1.13 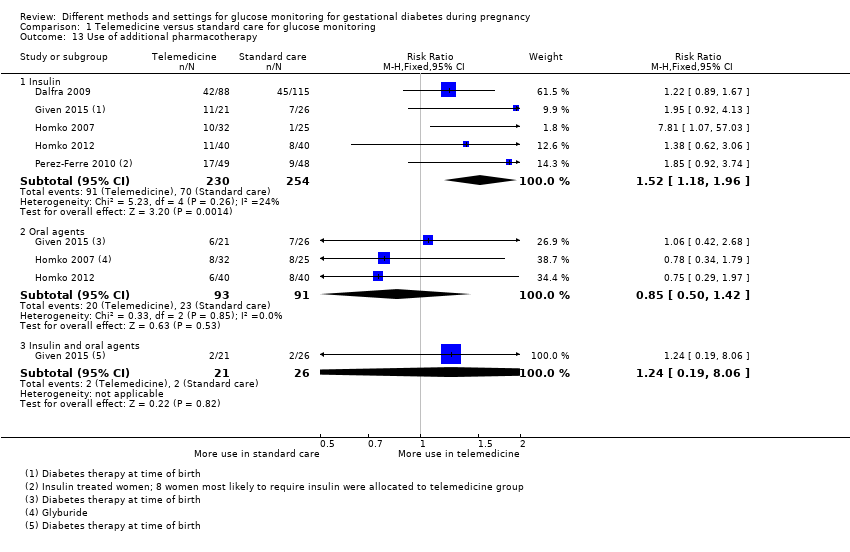 Comparison 1 Telemedicine versus standard care for glucose monitoring, Outcome 13 Use of additional pharmacotherapy. | ||||
| 13.1 Insulin | 5 | 484 | Risk Ratio (M‐H, Fixed, 95% CI) | 1.52 [1.18, 1.96] |
| 13.2 Oral agents | 3 | 184 | Risk Ratio (M‐H, Fixed, 95% CI) | 0.85 [0.50, 1.42] |
| 13.3 Insulin and oral agents | 1 | 47 | Risk Ratio (M‐H, Fixed, 95% CI) | 1.24 [0.19, 8.06] |
| 14 Maternal hypoglycaemia Show forest plot | 1 | 203 | Risk Ratio (M‐H, Fixed, 95% CI) | 0.0 [0.0, 0.0] |
| Analysis 1.14 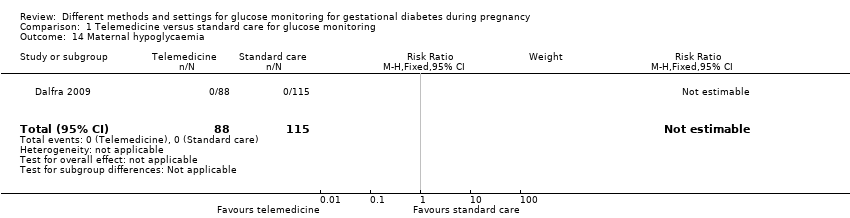 Comparison 1 Telemedicine versus standard care for glucose monitoring, Outcome 14 Maternal hypoglycaemia. | ||||
| 15 Maternal hypoglycaemia: self‐monitored blood glucose episodes hypoglycaemic (< 3.9 mmol/L) (%) Show forest plot | 1 | 44 | Mean Difference (IV, Fixed, 95% CI) | ‐0.10 [‐1.64, 1.44] |
| Analysis 1.15  Comparison 1 Telemedicine versus standard care for glucose monitoring, Outcome 15 Maternal hypoglycaemia: self‐monitored blood glucose episodes hypoglycaemic (< 3.9 mmol/L) (%). | ||||
| 16 Glycaemic control: HbA1c (%) Show forest plot | 3 | 357 | Mean Difference (IV, Fixed, 95% CI) | ‐0.15 [‐0.26, ‐0.04] |
| Analysis 1.16 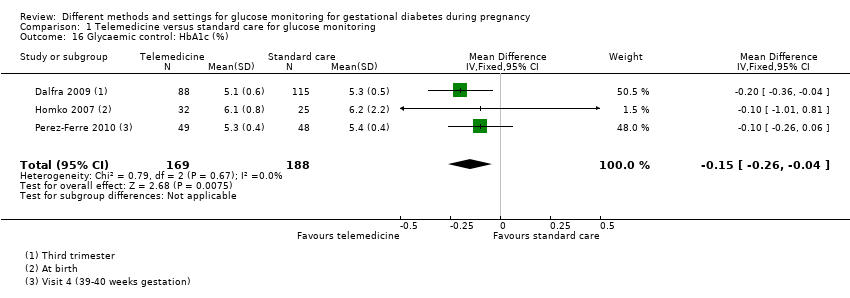 Comparison 1 Telemedicine versus standard care for glucose monitoring, Outcome 16 Glycaemic control: HbA1c (%). | ||||
| 17 Glycaemic control: HbA1c < 5.8% Show forest plot | 1 | 97 | Risk Ratio (M‐H, Fixed, 95% CI) | 1.0 [0.96, 1.04] |
| Analysis 1.17  Comparison 1 Telemedicine versus standard care for glucose monitoring, Outcome 17 Glycaemic control: HbA1c < 5.8%. | ||||
| 18 Glycaemic control: HbA1c at 36 weeks (mmol/mol) Show forest plot | 1 | 30 | Mean Difference (IV, Fixed, 95% CI) | 0.20 [‐2.03, 2.43] |
| Analysis 1.18  Comparison 1 Telemedicine versus standard care for glucose monitoring, Outcome 18 Glycaemic control: HbA1c at 36 weeks (mmol/mol). | ||||
| 19 Glycaemic control: self‐monitored blood glucose (mmol/L) Show forest plot | 1 | 44 | Mean Difference (IV, Fixed, 95% CI) | 0.0 [‐0.30, 0.30] |
| Analysis 1.19  Comparison 1 Telemedicine versus standard care for glucose monitoring, Outcome 19 Glycaemic control: self‐monitored blood glucose (mmol/L). | ||||
| 20 Glycaemic control: fasting and 2‐hour post‐prandial blood glucose (mg/dL) Show forest plot | 2 | Mean Difference (IV, Random, 95% CI) | Subtotals only | |
| Analysis 1.20  Comparison 1 Telemedicine versus standard care for glucose monitoring, Outcome 20 Glycaemic control: fasting and 2‐hour post‐prandial blood glucose (mg/dL). | ||||
| 20.1 Fasting blood glucose (mg/dL) | 2 | 131 | Mean Difference (IV, Random, 95% CI) | ‐0.50 [‐5.38, 4.38] |
| 20.2 2‐hour post‐prandial blood glucose (mg/dL) | 2 | 131 | Mean Difference (IV, Random, 95% CI) | ‐0.21 [‐5.09, 4.67] |
| 21 Stillbirth Show forest plot | 3 | 178 | Risk Ratio (M‐H, Fixed, 95% CI) | 0.41 [0.02, 9.55] |
| Analysis 1.21  Comparison 1 Telemedicine versus standard care for glucose monitoring, Outcome 21 Stillbirth. | ||||
| 22 Neonatal death Show forest plot | 2 | 131 | Risk Ratio (M‐H, Fixed, 95% CI) | 0.0 [0.0, 0.0] |
| Analysis 1.22 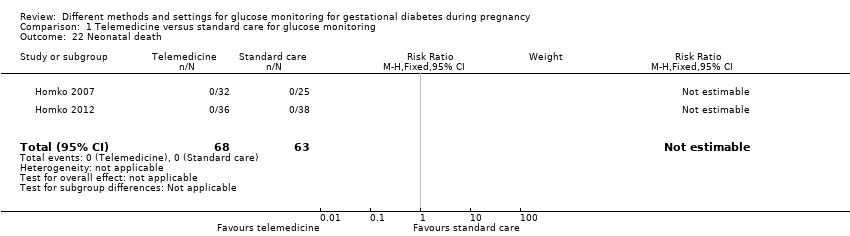 Comparison 1 Telemedicine versus standard care for glucose monitoring, Outcome 22 Neonatal death. | ||||
| 23 Gestational age at birth (weeks) Show forest plot | 5 | 478 | Mean Difference (IV, Fixed, 95% CI) | 0.10 [‐0.18, 0.37] |
| Analysis 1.23  Comparison 1 Telemedicine versus standard care for glucose monitoring, Outcome 23 Gestational age at birth (weeks). | ||||
| 24 Preterm birth < 37 weeks Show forest plot | 4 | 275 | Risk Ratio (M‐H, Fixed, 95% CI) | 0.66 [0.31, 1.39] |
| Analysis 1.24 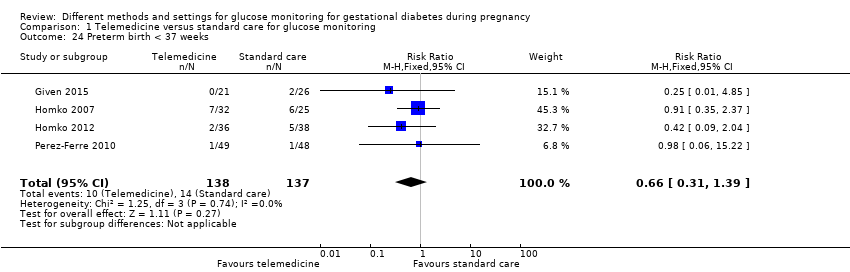 Comparison 1 Telemedicine versus standard care for glucose monitoring, Outcome 24 Preterm birth < 37 weeks. | ||||
| 25 Macrosomia Show forest plot | 2 | 249 | Risk Ratio (M‐H, Random, 95% CI) | 1.43 [0.27, 7.52] |
| Analysis 1.25  Comparison 1 Telemedicine versus standard care for glucose monitoring, Outcome 25 Macrosomia. | ||||
| 26 Small‐for‐gestational age Show forest plot | 1 | 97 | Risk Ratio (M‐H, Fixed, 95% CI) | 0.0 [0.0, 0.0] |
| Analysis 1.26  Comparison 1 Telemedicine versus standard care for glucose monitoring, Outcome 26 Small‐for‐gestational age. | ||||
| 27 Birthweight (g) Show forest plot | 5 | 477 | Mean Difference (IV, Fixed, 95% CI) | 63.13 [‐32.32, 158.59] |
| Analysis 1.27 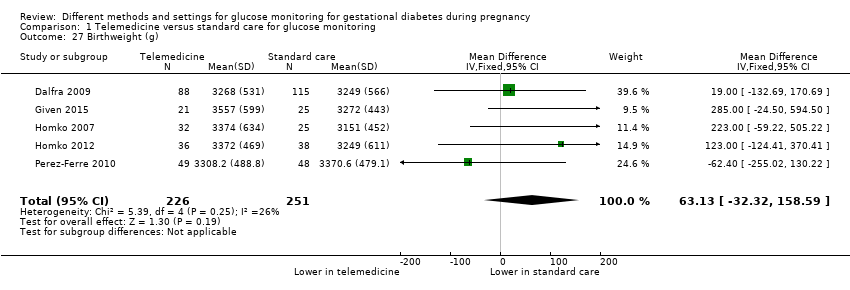 Comparison 1 Telemedicine versus standard care for glucose monitoring, Outcome 27 Birthweight (g). | ||||
| 28 Head circumference (cm) Show forest plot | 1 | 45 | Mean Difference (IV, Fixed, 95% CI) | 0.70 [0.02, 1.38] |
| Analysis 1.28  Comparison 1 Telemedicine versus standard care for glucose monitoring, Outcome 28 Head circumference (cm). | ||||
| 29 Length (cm) Show forest plot | 1 | 42 | Mean Difference (IV, Fixed, 95% CI) | 0.20 [‐1.34, 1.74] |
| Analysis 1.29 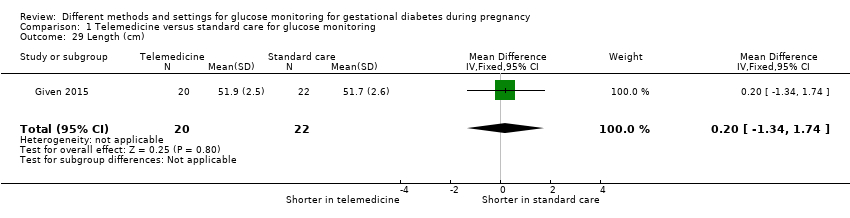 Comparison 1 Telemedicine versus standard care for glucose monitoring, Outcome 29 Length (cm). | ||||
| 30 Shoulder dystocia Show forest plot | 2 | 142 | Risk Ratio (M‐H, Fixed, 95% CI) | 0.33 [0.01, 7.83] |
| Analysis 1.30  Comparison 1 Telemedicine versus standard care for glucose monitoring, Outcome 30 Shoulder dystocia. | ||||
| 31 Respiratory distress syndrome Show forest plot | 3 | 176 | Risk Ratio (M‐H, Fixed, 95% CI) | 0.63 [0.26, 1.49] |
| Analysis 1.31  Comparison 1 Telemedicine versus standard care for glucose monitoring, Outcome 31 Respiratory distress syndrome. | ||||
| 32 Neonatal hypoglycaemia Show forest plot | 3 | 198 | Risk Ratio (M‐H, Fixed, 95% CI) | 1.14 [0.48, 2.72] |
| Analysis 1.32  Comparison 1 Telemedicine versus standard care for glucose monitoring, Outcome 32 Neonatal hypoglycaemia. | ||||
| 33 Hyperbilirubinaemia or jaundice Show forest plot | 3 | 176 | Risk Ratio (M‐H, Fixed, 95% CI) | 1.09 [0.59, 2.01] |
| Analysis 1.33 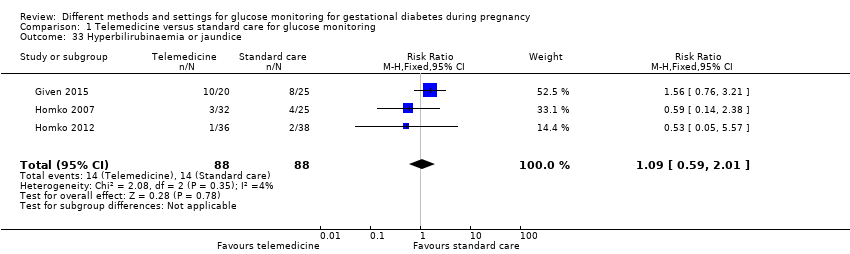 Comparison 1 Telemedicine versus standard care for glucose monitoring, Outcome 33 Hyperbilirubinaemia or jaundice. | ||||
| 34 Hypocalcaemia Show forest plot | 1 | 97 | Risk Ratio (M‐H, Fixed, 95% CI) | 0.0 [0.0, 0.0] |
| Analysis 1.34 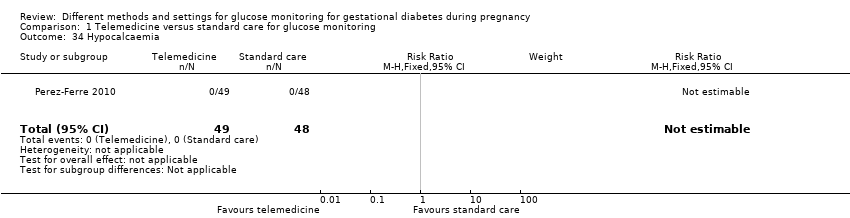 Comparison 1 Telemedicine versus standard care for glucose monitoring, Outcome 34 Hypocalcaemia. | ||||
| 35 Polycythaemia Show forest plot | 1 | 97 | Risk Ratio (M‐H, Fixed, 95% CI) | 0.0 [0.0, 0.0] |
| Analysis 1.35  Comparison 1 Telemedicine versus standard care for glucose monitoring, Outcome 35 Polycythaemia. | ||||
| 36 Number of hospital or health professional visits: face‐to‐face visits Show forest plot | 1 | 97 | Mean Difference (IV, Fixed, 95% CI) | ‐0.36 [‐0.92, 0.20] |
| Analysis 1.36  Comparison 1 Telemedicine versus standard care for glucose monitoring, Outcome 36 Number of hospital or health professional visits: face‐to‐face visits. | ||||
| 37 Number of hospital or health professional visits: unscheduled face‐to‐face visits Show forest plot | 1 | 97 | Mean Difference (IV, Fixed, 95% CI) | ‐0.62 [‐1.05, ‐0.19] |
| Analysis 1.37  Comparison 1 Telemedicine versus standard care for glucose monitoring, Outcome 37 Number of hospital or health professional visits: unscheduled face‐to‐face visits. | ||||
| 38 Neonatal intensive care unit admission Show forest plot | 3 | 176 | Risk Ratio (M‐H, Fixed, 95% CI) | 1.05 [0.62, 1.79] |
| Analysis 1.38  Comparison 1 Telemedicine versus standard care for glucose monitoring, Outcome 38 Neonatal intensive care unit admission. | ||||
| 39 'Neonatal morbidity' (neonatal complications: e.g. hypoglycaemia, hyperbilirubinaemia, respiratory distress syndrome, shoulder dystocia, malformations) (not a prespecified outcome) Show forest plot | 1 | 203 | Risk Ratio (M‐H, Fixed, 95% CI) | 1.52 [0.53, 4.38] |
| Analysis 1.39  Comparison 1 Telemedicine versus standard care for glucose monitoring, Outcome 39 'Neonatal morbidity' (neonatal complications: e.g. hypoglycaemia, hyperbilirubinaemia, respiratory distress syndrome, shoulder dystocia, malformations) (not a prespecified outcome). | ||||
| 40 'Maternal morbidity' (maternal complications: gestational hypertension, pre‐eclampsia, eclampsia, hypoglycaemic episodes) (not a prespecified outcome) Show forest plot | 1 | 203 | Risk Ratio (M‐H, Fixed, 95% CI) | 0.49 [0.13, 1.79] |
| Analysis 1.40 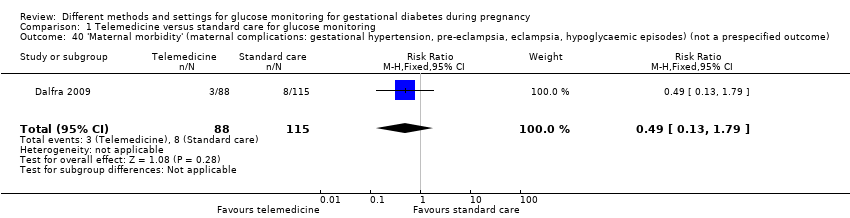 Comparison 1 Telemedicine versus standard care for glucose monitoring, Outcome 40 'Maternal morbidity' (maternal complications: gestational hypertension, pre‐eclampsia, eclampsia, hypoglycaemic episodes) (not a prespecified outcome). | ||||
| Outcome or subgroup title | No. of studies | No. of participants | Statistical method | Effect size |
| 1 Hypertensive disorders of pregnancy: pre‐eclampsia Show forest plot | 1 | 58 | Risk Ratio (M‐H, Fixed, 95% CI) | 0.18 [0.01, 3.49] |
| Analysis 2.1  Comparison 2 Self‐monitoring versus periodic glucose monitoring, Outcome 1 Hypertensive disorders of pregnancy: pre‐eclampsia. | ||||
| 2 Caesarean section Show forest plot | 2 | 400 | Risk Ratio (M‐H, Random, 95% CI) | 1.18 [0.61, 2.27] |
| Analysis 2.2  Comparison 2 Self‐monitoring versus periodic glucose monitoring, Outcome 2 Caesarean section. | ||||
| 3 Perinatal mortality Show forest plot | 2 | 400 | Risk Ratio (M‐H, Fixed, 95% CI) | 1.54 [0.21, 11.24] |
| Analysis 2.3  Comparison 2 Self‐monitoring versus periodic glucose monitoring, Outcome 3 Perinatal mortality. | ||||
| 4 Large‐for‐gestational age Show forest plot | 2 | 400 | Risk Ratio (M‐H, Fixed, 95% CI) | 0.82 [0.50, 1.37] |
| Analysis 2.4  Comparison 2 Self‐monitoring versus periodic glucose monitoring, Outcome 4 Large‐for‐gestational age. | ||||
| 5 Placental abruption Show forest plot | 1 | 58 | Risk Ratio (M‐H, Fixed, 95% CI) | 2.63 [0.11, 61.88] |
| Analysis 2.5  Comparison 2 Self‐monitoring versus periodic glucose monitoring, Outcome 5 Placental abruption. | ||||
| 6 Postpartum haemorrhage Show forest plot | 1 | 58 | Risk Ratio (M‐H, Fixed, 95% CI) | 2.63 [0.11, 61.88] |
| Analysis 2.6 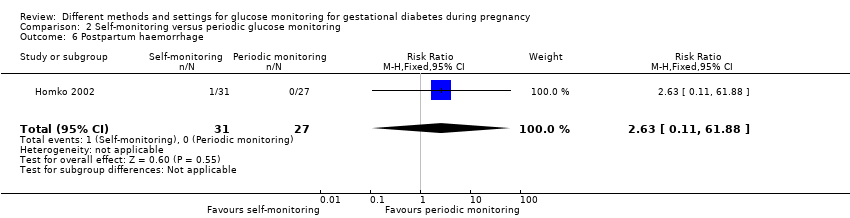 Comparison 2 Self‐monitoring versus periodic glucose monitoring, Outcome 6 Postpartum haemorrhage. | ||||
| 7 Gestational weight gain (kg/week) Show forest plot | 1 | 342 | Mean Difference (IV, Fixed, 95% CI) | ‐0.1 [‐0.15, ‐0.05] |
| Analysis 2.7  Comparison 2 Self‐monitoring versus periodic glucose monitoring, Outcome 7 Gestational weight gain (kg/week). | ||||
| 7.1 1‐hour post‐breakfast glucose < 7.8 mmol/L | 1 | 227 | Mean Difference (IV, Fixed, 95% CI) | ‐0.10 [‐0.17, ‐0.03] |
| 7.2 1‐hour post‐breakfast glucose ≥ 7.8 mmol/L | 1 | 115 | Mean Difference (IV, Fixed, 95% CI) | ‐0.10 [‐0.17, ‐0.03] |
| 8 Gestational weight gain (lb) Show forest plot | 1 | 58 | Mean Difference (IV, Fixed, 95% CI) | ‐5.5 [‐13.57, 2.57] |
| Analysis 2.8 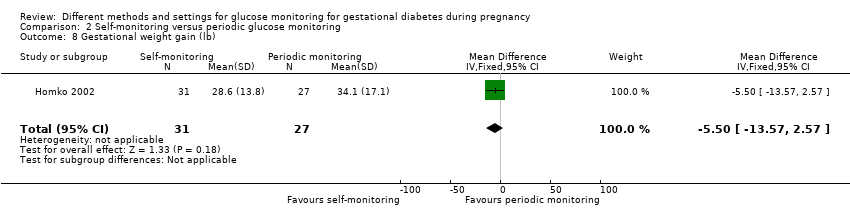 Comparison 2 Self‐monitoring versus periodic glucose monitoring, Outcome 8 Gestational weight gain (lb). | ||||
| 9 Adherence to the intervention: < 70% adherence to home blood glucose measurements or diabetes outpatient clinic appointments Show forest plot | 1 | 342 | Risk Ratio (M‐H, Fixed, 95% CI) | 0.74 [0.32, 1.71] |
| Analysis 2.9 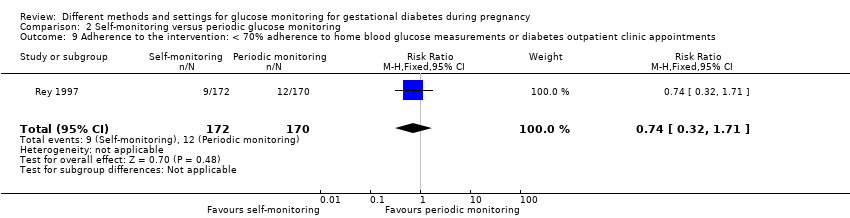 Comparison 2 Self‐monitoring versus periodic glucose monitoring, Outcome 9 Adherence to the intervention: < 70% adherence to home blood glucose measurements or diabetes outpatient clinic appointments. | ||||
| 10 Adherence to the intervention: Dietary Compliance Questionnaire Show forest plot | 1 | Mean Difference (IV, Fixed, 95% CI) | Subtotals only | |
| Analysis 2.10  Comparison 2 Self‐monitoring versus periodic glucose monitoring, Outcome 10 Adherence to the intervention: Dietary Compliance Questionnaire. | ||||
| 10.1 Total compliance score | 1 | 58 | Mean Difference (IV, Fixed, 95% CI) | 1.5 [‐0.47, 3.47] |
| 10.2 Mean compliance score | 1 | 58 | Mean Difference (IV, Fixed, 95% CI) | 0.0 [‐0.40, 0.40] |
| 11 Sense of well‐being and quality of life: Diabetes Empowerment Scale delta scores Show forest plot | 1 | Mean Difference (IV, Fixed, 95% CI) | Subtotals only | |
| Analysis 2.11  Comparison 2 Self‐monitoring versus periodic glucose monitoring, Outcome 11 Sense of well‐being and quality of life: Diabetes Empowerment Scale delta scores. | ||||
| 11.1 Overall | 1 | 47 | Mean Difference (IV, Fixed, 95% CI) | 3.70 [‐2.08, 9.48] |
| 11.2 Setting goals | 1 | 47 | Mean Difference (IV, Fixed, 95% CI) | 0.65 [‐1.10, 2.40] |
| 11.3 Solving problems | 1 | 47 | Mean Difference (IV, Fixed, 95% CI) | 1.35 [‐0.37, 3.07] |
| 11.4 Motivating oneself | 1 | 47 | Mean Difference (IV, Fixed, 95% CI) | 0.63 [‐0.89, 2.15] |
| 11.5 Obtaining support | 1 | 47 | Mean Difference (IV, Fixed, 95% CI) | 0.94 [‐0.09, 1.97] |
| 11.6 Making decisions | 1 | 47 | Mean Difference (IV, Fixed, 95% CI) | 0.01 [‐1.39, 1.41] |
| 12 Sense of well‐being and quality of life: emotional adjustment: Appraisal of Diabetes Scale delta scores Show forest plot | 1 | 47 | Mean Difference (IV, Fixed, 95% CI) | 1.20 [‐0.88, 3.28] |
| Analysis 2.12  Comparison 2 Self‐monitoring versus periodic glucose monitoring, Outcome 12 Sense of well‐being and quality of life: emotional adjustment: Appraisal of Diabetes Scale delta scores. | ||||
| 13 Use of additional pharmacotherapy: insulin Show forest plot | 2 | 400 | Risk Ratio (M‐H, Fixed, 95% CI) | 1.31 [0.69, 2.48] |
| Analysis 2.13  Comparison 2 Self‐monitoring versus periodic glucose monitoring, Outcome 13 Use of additional pharmacotherapy: insulin. | ||||
| 14 Glycaemic control: pre‐prandial blood glucose (mmol/L) Show forest plot | 2 | 360 | Mean Difference (IV, Random, 95% CI) | 0.06 [‐0.08, 0.19] |
| Analysis 2.14  Comparison 2 Self‐monitoring versus periodic glucose monitoring, Outcome 14 Glycaemic control: pre‐prandial blood glucose (mmol/L). | ||||
| 14.1 Breakfast glucose < 7.8 mmol/L | 1 | 192 | Mean Difference (IV, Random, 95% CI) | 0.10 [‐0.03, 0.23] |
| 14.2 Breakfast glucose ≥ 7.8 mmol/L | 1 | 110 | Mean Difference (IV, Random, 95% CI) | 0.10 [‐0.07, 0.27] |
| 14.3 All women | 1 | 58 | Mean Difference (IV, Random, 95% CI) | ‐0.21 [‐0.54, 0.12] |
| 15 Glycaemic control: 1‐hour post‐prandial blood glucose (mmol/L) Show forest plot | 2 | 395 | Mean Difference (IV, Random, 95% CI) | ‐0.09 [‐0.60, 0.42] |
| Analysis 2.15  Comparison 2 Self‐monitoring versus periodic glucose monitoring, Outcome 15 Glycaemic control: 1‐hour post‐prandial blood glucose (mmol/L). | ||||
| 15.1 1‐hour post‐breakfast glucose > 7.8 mmol/L | 1 | 222 | Mean Difference (IV, Random, 95% CI) | 0.0 [‐0.19, 0.19] |
| 15.2 1‐hour post‐breakfast glucose ≥ 7.8 mmol/L | 1 | 115 | Mean Difference (IV, Random, 95% CI) | ‐0.60 [‐0.90, ‐0.30] |
| 15.3 All women | 1 | 58 | Mean Difference (IV, Random, 95% CI) | 0.47 [‐0.12, 1.06] |
| 16 Stillbirth Show forest plot | 2 | 400 | Risk Ratio (M‐H, Fixed, 95% CI) | 1.54 [0.21, 11.24] |
| Analysis 2.16  Comparison 2 Self‐monitoring versus periodic glucose monitoring, Outcome 16 Stillbirth. | ||||
| 17 Neonatal death Show forest plot | 1 | 58 | Risk Ratio (M‐H, Fixed, 95% CI) | 0.0 [0.0, 0.0] |
| Analysis 2.17  Comparison 2 Self‐monitoring versus periodic glucose monitoring, Outcome 17 Neonatal death. | ||||
| 18 Gestational age at birth (weeks) Show forest plot | 2 | 400 | Mean Difference (IV, Fixed, 95% CI) | ‐0.03 [‐0.32, 0.27] |
| Analysis 2.18  Comparison 2 Self‐monitoring versus periodic glucose monitoring, Outcome 18 Gestational age at birth (weeks). | ||||
| 18.1 1‐hour post‐breakfast glucose < 7.8 mmol/L | 1 | 227 | Mean Difference (IV, Fixed, 95% CI) | ‐0.20 [‐0.59, 0.19] |
| 18.2 1‐hour post‐breakfast glucose ≥ 7.8 mmol/L | 1 | 115 | Mean Difference (IV, Fixed, 95% CI) | 0.20 [‐0.31, 0.71] |
| 18.3 All neonates | 1 | 58 | Mean Difference (IV, Fixed, 95% CI) | 0.30 [‐0.78, 1.38] |
| 19 Macrosomia Show forest plot | 1 | 342 | Risk Ratio (M‐H, Fixed, 95% CI) | 0.94 [0.53, 1.67] |
| Analysis 2.19  Comparison 2 Self‐monitoring versus periodic glucose monitoring, Outcome 19 Macrosomia. | ||||
| 20 Small‐for‐gestational age Show forest plot | 1 | 342 | Risk Ratio (M‐H, Fixed, 95% CI) | 1.19 [0.53, 2.67] |
| Analysis 2.20  Comparison 2 Self‐monitoring versus periodic glucose monitoring, Outcome 20 Small‐for‐gestational age. | ||||
| 21 Birthweight (kg) Show forest plot | 2 | 400 | Mean Difference (IV, Fixed, 95% CI) | ‐40.22 [‐148.37, 67.93] |
| Analysis 2.21  Comparison 2 Self‐monitoring versus periodic glucose monitoring, Outcome 21 Birthweight (kg). | ||||
| 21.1 1‐hour post‐breakfast glucose < 7.8 mmol/L | 1 | 227 | Mean Difference (IV, Fixed, 95% CI) | ‐10.0 [‐145.47, 125.47] |
| 21.2 1‐hour post‐breakfast glucose ≥ 7.8 mmol/L | 1 | 115 | Mean Difference (IV, Fixed, 95% CI) | ‐70.0 [‐283.34, 143.34] |
| 21.3 All neonates | 1 | 58 | Mean Difference (IV, Fixed, 95% CI) | ‐150.0 [‐482.61, 182.61] |
| 22 Birthweight (percentile) Show forest plot | 1 | 342 | Mean Difference (IV, Fixed, 95% CI) | ‐0.67 [‐6.75, 5.42] |
| Analysis 2.22  Comparison 2 Self‐monitoring versus periodic glucose monitoring, Outcome 22 Birthweight (percentile). | ||||
| 22.1 1‐hour post‐breakfast glucose < 7.8 mmol/L | 1 | 227 | Mean Difference (IV, Fixed, 95% CI) | 1.5 [‐5.71, 8.71] |
| 22.2 1‐hour post‐breakfast glucose ≥ 7.8 mmol/L | 1 | 115 | Mean Difference (IV, Fixed, 95% CI) | ‐6.00 [‐17.32, 5.32] |
| 23 Shoulder dystocia Show forest plot | 1 | 342 | Risk Ratio (M‐H, Fixed, 95% CI) | 0.25 [0.03, 2.19] |
| Analysis 2.23  Comparison 2 Self‐monitoring versus periodic glucose monitoring, Outcome 23 Shoulder dystocia. | ||||
| 24 Neonatal hypoglycaemia Show forest plot | 2 | 391 | Risk Ratio (M‐H, Fixed, 95% CI) | 0.64 [0.39, 1.06] |
| Analysis 2.24  Comparison 2 Self‐monitoring versus periodic glucose monitoring, Outcome 24 Neonatal hypoglycaemia. | ||||
| 25 Hyperbilirubinaemia or jaundice Show forest plot | 2 | 370 | Risk Ratio (M‐H, Fixed, 95% CI) | 0.63 [0.39, 1.04] |
| Analysis 2.25  Comparison 2 Self‐monitoring versus periodic glucose monitoring, Outcome 25 Hyperbilirubinaemia or jaundice. | ||||
| 26 Number of antenatal visits or admissions: prenatal visits with the diabetes team Show forest plot | 1 | 58 | Mean Difference (IV, Fixed, 95% CI) | 0.20 [‐1.09, 1.49] |
| Analysis 2.26  Comparison 2 Self‐monitoring versus periodic glucose monitoring, Outcome 26 Number of antenatal visits or admissions: prenatal visits with the diabetes team. | ||||
| 27 Neonatal intensive care unit admission Show forest plot | 1 | 58 | Risk Ratio (M‐H, Fixed, 95% CI) | 0.87 [0.13, 5.77] |
| Analysis 2.27  Comparison 2 Self‐monitoring versus periodic glucose monitoring, Outcome 27 Neonatal intensive care unit admission. | ||||
| 28 'Birth trauma' (not a prespecified outcome) Show forest plot | 1 | 58 | Risk Ratio (M‐H, Fixed, 95% CI) | 0.87 [0.06, 13.27] |
| Analysis 2.28 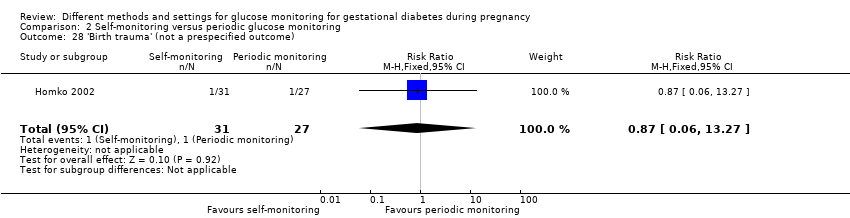 Comparison 2 Self‐monitoring versus periodic glucose monitoring, Outcome 28 'Birth trauma' (not a prespecified outcome). | ||||
| 29 'Respiratory complications' (not a prespecified outcome) Show forest plot | 1 | 58 | Risk Ratio (M‐H, Fixed, 95% CI) | 0.87 [0.06, 13.27] |
| Analysis 2.29  Comparison 2 Self‐monitoring versus periodic glucose monitoring, Outcome 29 'Respiratory complications' (not a prespecified outcome). | ||||
| Outcome or subgroup title | No. of studies | No. of participants | Statistical method | Effect size |
| 1 Caesarean section Show forest plot | 2 | 179 | Risk Ratio (M‐H, Fixed, 95% CI) | 0.91 [0.68, 1.20] |
| Analysis 3.1  Comparison 3 Continuous glucose monitoring system versus self‐monitoring of glucose, Outcome 1 Caesarean section. | ||||
| 2 Perinatal mortality Show forest plot | 2 | 179 | Risk Ratio (M‐H, Fixed, 95% CI) | 0.0 [0.0, 0.0] |
| Analysis 3.2  Comparison 3 Continuous glucose monitoring system versus self‐monitoring of glucose, Outcome 2 Perinatal mortality. | ||||
| 3 Large‐for‐gestational age Show forest plot | 1 | 106 | Risk Ratio (M‐H, Fixed, 95% CI) | 0.67 [0.43, 1.05] |
| Analysis 3.3  Comparison 3 Continuous glucose monitoring system versus self‐monitoring of glucose, Outcome 3 Large‐for‐gestational age. | ||||
| 4 Gestational weight gain (kg) Show forest plot | 2 | 179 | Mean Difference (IV, Fixed, 95% CI) | ‐1.26 [‐2.28, ‐0.24] |
| Analysis 3.4 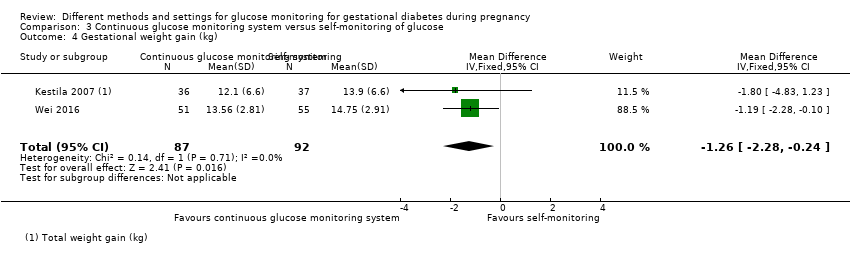 Comparison 3 Continuous glucose monitoring system versus self‐monitoring of glucose, Outcome 4 Gestational weight gain (kg). | ||||
| 5 Use of additional pharmacotherapy Show forest plot | 2 | 179 | Risk Ratio (M‐H, Fixed, 95% CI) | 2.86 [1.47, 5.56] |
| Analysis 3.5  Comparison 3 Continuous glucose monitoring system versus self‐monitoring of glucose, Outcome 5 Use of additional pharmacotherapy. | ||||
| 6 Glycaemic control: HbA1c at 32 to 36 weeks (%) Show forest plot | 1 | 106 | Mean Difference (IV, Fixed, 95% CI) | ‐0.10 [‐0.24, 0.04] |
| Analysis 3.6  Comparison 3 Continuous glucose monitoring system versus self‐monitoring of glucose, Outcome 6 Glycaemic control: HbA1c at 32 to 36 weeks (%). | ||||
| 7 Stillbirth Show forest plot | 2 | 179 | Risk Ratio (M‐H, Fixed, 95% CI) | 0.0 [0.0, 0.0] |
| Analysis 3.7  Comparison 3 Continuous glucose monitoring system versus self‐monitoring of glucose, Outcome 7 Stillbirth. | ||||
| 8 Neonatal death Show forest plot | 2 | 179 | Risk Ratio (M‐H, Fixed, 95% CI) | 0.0 [0.0, 0.0] |
| Analysis 3.8  Comparison 3 Continuous glucose monitoring system versus self‐monitoring of glucose, Outcome 8 Neonatal death. | ||||
| 9 Gestational age at birth (weeks) Show forest plot | 2 | 179 | Mean Difference (IV, Fixed, 95% CI) | ‐0.17 [‐0.52, 0.19] |
| Analysis 3.9  Comparison 3 Continuous glucose monitoring system versus self‐monitoring of glucose, Outcome 9 Gestational age at birth (weeks). | ||||
| 10 Preterm birth < 37 weeks Show forest plot | 1 | Risk Ratio (M‐H, Fixed, 95% CI) | Subtotals only | |
| Analysis 3.10  Comparison 3 Continuous glucose monitoring system versus self‐monitoring of glucose, Outcome 10 Preterm birth < 37 weeks. | ||||
| 11 Macrosomia Show forest plot | 2 | 179 | Risk Ratio (M‐H, Fixed, 95% CI) | 0.85 [0.35, 2.05] |
| Analysis 3.11  Comparison 3 Continuous glucose monitoring system versus self‐monitoring of glucose, Outcome 11 Macrosomia. | ||||
| 12 Small‐for‐gestational age Show forest plot | 1 | 106 | Risk Ratio (M‐H, Fixed, 95% CI) | 1.08 [0.16, 7.37] |
| Analysis 3.12  Comparison 3 Continuous glucose monitoring system versus self‐monitoring of glucose, Outcome 12 Small‐for‐gestational age. | ||||
| 13 Birthweight (g) Show forest plot | 2 | 179 | Mean Difference (IV, Fixed, 95% CI) | ‐110.17 [‐264.73, 44.39] |
| Analysis 3.13 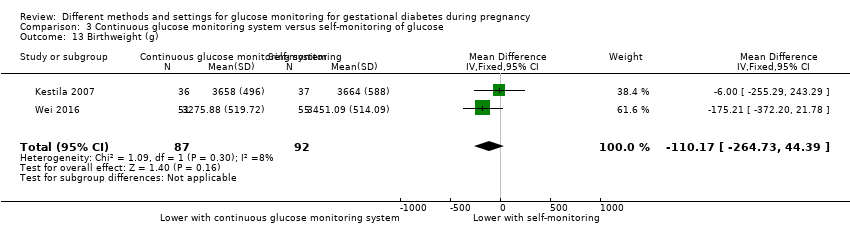 Comparison 3 Continuous glucose monitoring system versus self‐monitoring of glucose, Outcome 13 Birthweight (g). | ||||
| 14 Neonatal hypoglycaemia Show forest plot | 2 | 179 | Risk Ratio (M‐H, Fixed, 95% CI) | 0.79 [0.35, 1.78] |
| Analysis 3.14  Comparison 3 Continuous glucose monitoring system versus self‐monitoring of glucose, Outcome 14 Neonatal hypoglycaemia. | ||||
| 15 Hyperbilirubinaemia or jaundice Show forest plot | 1 | 73 | Risk Ratio (M‐H, Fixed, 95% CI) | 1.03 [0.28, 3.80] |
| Analysis 3.15  Comparison 3 Continuous glucose monitoring system versus self‐monitoring of glucose, Outcome 15 Hyperbilirubinaemia or jaundice. | ||||
| 16 Neonatal intensive care unit admission Show forest plot | 1 | 73 | Risk Ratio (M‐H, Fixed, 95% CI) | 0.65 [0.29, 1.50] |
| Analysis 3.16  Comparison 3 Continuous glucose monitoring system versus self‐monitoring of glucose, Outcome 16 Neonatal intensive care unit admission. | ||||
| 17 Length of postnatal stay (baby): length of stay in neonatal intensive care unit (days) Show forest plot | 1 | 18 | Mean Difference (IV, Fixed, 95% CI) | ‐0.83 [‐2.35, 0.69] |
| Analysis 3.17  Comparison 3 Continuous glucose monitoring system versus self‐monitoring of glucose, Outcome 17 Length of postnatal stay (baby): length of stay in neonatal intensive care unit (days). | ||||
| Outcome or subgroup title | No. of studies | No. of participants | Statistical method | Effect size |
| 1 Views of the intervention Show forest plot | 1 | Risk Ratio (M‐H, Fixed, 95% CI) | Subtotals only | |
| Analysis 4.1  Comparison 4 Modem versus telephone transmission for glucose monitoring, Outcome 1 Views of the intervention. | ||||
| 1.1 Overall, I am satisfied with how easy it is to use Accu‐Chek Complete, Acculink | 1 | 38 | Risk Ratio (M‐H, Fixed, 95% CI) | 1.11 [0.90, 1.38] |
| 1.2 I feel comfortable using the Accu‐Chek Complete, Acculink | 1 | 38 | Risk Ratio (M‐H, Fixed, 95% CI) | 0.96 [0.66, 1.41] |
| 1.3 Whenever I made a mistake using the Accu‐Chek Complete, Acculink, I could recover easily and quickly | 1 | 38 | Risk Ratio (M‐H, Fixed, 95% CI) | 0.92 [0.67, 1.25] |
| 1.4 It was easy to learn to use the Accu‐Chek Complete, Acculink | 1 | 38 | Risk Ratio (M‐H, Fixed, 95% CI) | 1.05 [0.82, 1.34] |
| 1.5 The written material provided for the Accu‐Chek Complete was easy to understand | 1 | 38 | Risk Ratio (M‐H, Fixed, 95% CI) | 1.18 [0.92, 1.51] |
| Outcome or subgroup title | No. of studies | No. of participants | Statistical method | Effect size |
| 1 Hypertensive disorders of pregnancy: pre‐eclampsia Show forest plot | 1 | 66 | Risk Ratio (M‐H, Fixed, 95% CI) | 1.0 [0.15, 6.68] |
| Analysis 5.1  Comparison 5 Postprandial versus preprandial glucose monitoring, Outcome 1 Hypertensive disorders of pregnancy: pre‐eclampsia. | ||||
| 2 Caesarean section Show forest plot | 1 | 66 | Risk Ratio (M‐H, Fixed, 95% CI) | 0.62 [0.29, 1.29] |
| Analysis 5.2  Comparison 5 Postprandial versus preprandial glucose monitoring, Outcome 2 Caesarean section. | ||||
| 3 Large‐for‐gestational age Show forest plot | 1 | 66 | Risk Ratio (M‐H, Fixed, 95% CI) | 0.29 [0.11, 0.78] |
| Analysis 5.3  Comparison 5 Postprandial versus preprandial glucose monitoring, Outcome 3 Large‐for‐gestational age. | ||||
| 4 Perineal trauma Show forest plot | 1 | 66 | Risk Ratio (M‐H, Fixed, 95% CI) | 0.38 [0.11, 1.29] |
| Analysis 5.4  Comparison 5 Postprandial versus preprandial glucose monitoring, Outcome 4 Perineal trauma. | ||||
| 5 Gestational weight gain (kg) Show forest plot | 1 | 66 | Mean Difference (IV, Fixed, 95% CI) | ‐0.20 [‐2.81, 2.41] |
| Analysis 5.5 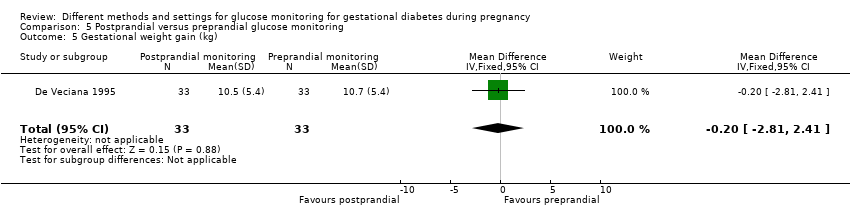 Comparison 5 Postprandial versus preprandial glucose monitoring, Outcome 5 Gestational weight gain (kg). | ||||
| 6 Adherence to the intervention: compliance with schedule (%) Show forest plot | 1 | 66 | Mean Difference (IV, Fixed, 95% CI) | ‐3.0 [‐3.99, ‐2.01] |
| Analysis 5.6  Comparison 5 Postprandial versus preprandial glucose monitoring, Outcome 6 Adherence to the intervention: compliance with schedule (%). | ||||
| 7 Use of additional pharmacotherapy Show forest plot | 1 | Mean Difference (IV, Fixed, 95% CI) | Subtotals only | |
| Analysis 5.7 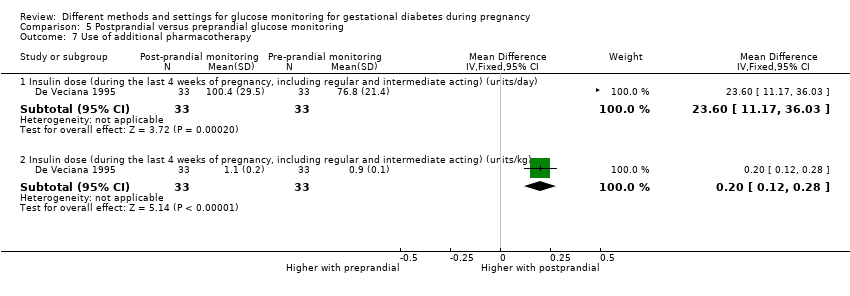 Comparison 5 Postprandial versus preprandial glucose monitoring, Outcome 7 Use of additional pharmacotherapy. | ||||
| 7.1 Insulin dose (during the last 4 weeks of pregnancy, including regular and intermediate acting) (units/day) | 1 | 66 | Mean Difference (IV, Fixed, 95% CI) | 23.60 [11.17, 36.03] |
| 7.2 Insulin dose (during the last 4 weeks of pregnancy, including regular and intermediate acting) (units/kg) | 1 | 66 | Mean Difference (IV, Fixed, 95% CI) | 0.20 [0.12, 0.28] |
| 8 Glycaemic control: change in HbA1c (%) Show forest plot | 1 | 66 | Mean Difference (IV, Fixed, 95% CI) | ‐2.4 [‐3.33, ‐1.47] |
| Analysis 5.8  Comparison 5 Postprandial versus preprandial glucose monitoring, Outcome 8 Glycaemic control: change in HbA1c (%). | ||||
| 9 Glycaemic control: hospitalisation for glycaemic control Show forest plot | 1 | 66 | Risk Ratio (M‐H, Fixed, 95% CI) | 1.33 [0.32, 5.50] |
| Analysis 5.9  Comparison 5 Postprandial versus preprandial glucose monitoring, Outcome 9 Glycaemic control: hospitalisation for glycaemic control. | ||||
| 10 Glycaemic control: success in glycaemic control (%) Show forest plot | 1 | 66 | Mean Difference (IV, Fixed, 95% CI) | 2.0 [‐0.26, 4.26] |
| Analysis 5.10  Comparison 5 Postprandial versus preprandial glucose monitoring, Outcome 10 Glycaemic control: success in glycaemic control (%). | ||||
| 11 Stillbirth Show forest plot | 1 | 66 | Risk Ratio (M‐H, Fixed, 95% CI) | 0.33 [0.01, 7.90] |
| Analysis 5.11  Comparison 5 Postprandial versus preprandial glucose monitoring, Outcome 11 Stillbirth. | ||||
| 12 Gestational age at birth (weeks) Show forest plot | 1 | 66 | Mean Difference (IV, Fixed, 95% CI) | 0.30 [‐1.08, 1.68] |
| Analysis 5.12 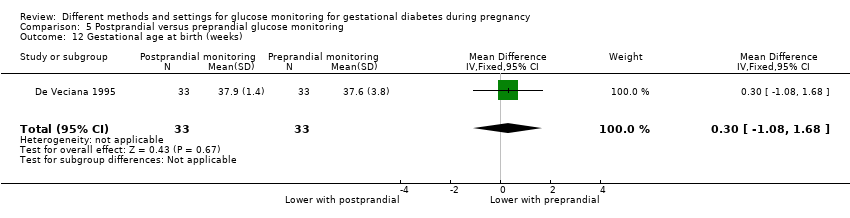 Comparison 5 Postprandial versus preprandial glucose monitoring, Outcome 12 Gestational age at birth (weeks). | ||||
| 13 Apgar score < 7 at 5 minutes Show forest plot | 1 | 66 | Risk Ratio (M‐H, Fixed, 95% CI) | 0.33 [0.04, 3.04] |
| Analysis 5.13  Comparison 5 Postprandial versus preprandial glucose monitoring, Outcome 13 Apgar score < 7 at 5 minutes. | ||||
| 14 Macrosomia Show forest plot | 1 | 66 | Risk Ratio (M‐H, Fixed, 95% CI) | 0.25 [0.08, 0.81] |
| Analysis 5.14  Comparison 5 Postprandial versus preprandial glucose monitoring, Outcome 14 Macrosomia. | ||||
| 15 Small‐for‐gestational age Show forest plot | 1 | 66 | Risk Ratio (M‐H, Fixed, 95% CI) | 3.0 [0.13, 71.07] |
| Analysis 5.15  Comparison 5 Postprandial versus preprandial glucose monitoring, Outcome 15 Small‐for‐gestational age. | ||||
| 16 Birthweight (g) Show forest plot | 1 | 66 | Mean Difference (IV, Fixed, 95% CI) | ‐379.0 [‐650.79, ‐107.21] |
| Analysis 5.16 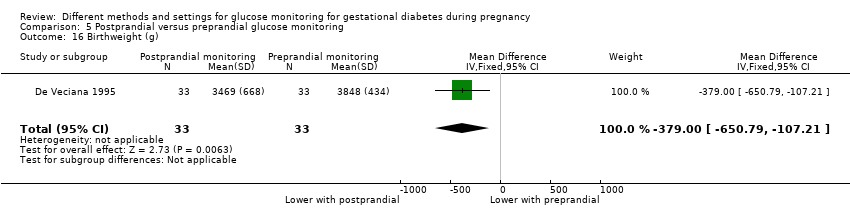 Comparison 5 Postprandial versus preprandial glucose monitoring, Outcome 16 Birthweight (g). | ||||
| 17 Shoulder dystocia Show forest plot | 1 | 66 | Risk Ratio (M‐H, Fixed, 95% CI) | 0.17 [0.02, 1.31] |
| Analysis 5.17  Comparison 5 Postprandial versus preprandial glucose monitoring, Outcome 17 Shoulder dystocia. | ||||
| 18 Nerve palsies Show forest plot | 1 | 66 | Risk Ratio (M‐H, Fixed, 95% CI) | 0.5 [0.05, 5.25] |
| Analysis 5.18  Comparison 5 Postprandial versus preprandial glucose monitoring, Outcome 18 Nerve palsies. | ||||
| 19 Bone fractures Show forest plot | 1 | 66 | Risk Ratio (M‐H, Fixed, 95% CI) | 1.0 [0.07, 15.33] |
| Analysis 5.19 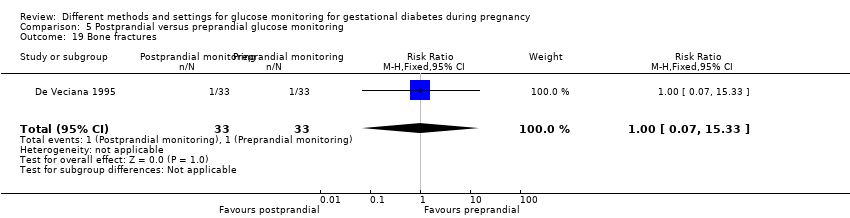 Comparison 5 Postprandial versus preprandial glucose monitoring, Outcome 19 Bone fractures. | ||||
| 20 Neonatal hypoglycaemia Show forest plot | 1 | 66 | Risk Ratio (M‐H, Fixed, 95% CI) | 0.14 [0.02, 1.10] |
| Analysis 5.20 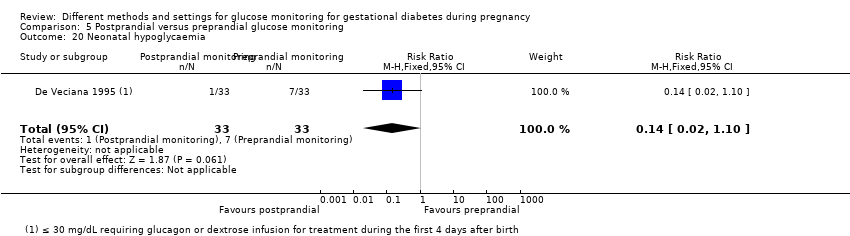 Comparison 5 Postprandial versus preprandial glucose monitoring, Outcome 20 Neonatal hypoglycaemia. | ||||
| 21 Hyperbilirubinaemia or jaundice Show forest plot | 1 | 66 | Risk Ratio (M‐H, Fixed, 95% CI) | 0.75 [0.18, 3.09] |
| Analysis 5.21  Comparison 5 Postprandial versus preprandial glucose monitoring, Outcome 21 Hyperbilirubinaemia or jaundice. | ||||


Risk of bias graph: review authors' judgements about each risk of bias item presented as percentages across all included studies

Risk of bias summary: review authors' judgements about each risk of bias item for each included study
Comparison 1 Telemedicine versus standard care for glucose monitoring, Outcome 1 Hypertensive disorders of pregnancy.
Comparison 1 Telemedicine versus standard care for glucose monitoring, Outcome 2 Caesarean section.
Comparison 1 Telemedicine versus standard care for glucose monitoring, Outcome 3 Perinatal mortality.
Comparison 1 Telemedicine versus standard care for glucose monitoring, Outcome 4 Large‐for‐gestational age.
Comparison 1 Telemedicine versus standard care for glucose monitoring, Outcome 5 Death or serious morbidity composite.
Comparison 1 Telemedicine versus standard care for glucose monitoring, Outcome 6 Operative vaginal birth (not a prespecified outcome).
Comparison 1 Telemedicine versus standard care for glucose monitoring, Outcome 7 Induction of labour.
Comparison 1 Telemedicine versus standard care for glucose monitoring, Outcome 8 Placental abruption.
Comparison 1 Telemedicine versus standard care for glucose monitoring, Outcome 9 Gestational weight gain (kg).
Comparison 1 Telemedicine versus standard care for glucose monitoring, Outcome 10 Weight at 36 weeks (kg).
Comparison 1 Telemedicine versus standard care for glucose monitoring, Outcome 11 Adherence to the intervention.
Comparison 1 Telemedicine versus standard care for glucose monitoring, Outcome 12 Sense of well‐being and quality of life: DES: Diabetes Empowerment Scale.
Comparison 1 Telemedicine versus standard care for glucose monitoring, Outcome 13 Use of additional pharmacotherapy.
Comparison 1 Telemedicine versus standard care for glucose monitoring, Outcome 14 Maternal hypoglycaemia.
Comparison 1 Telemedicine versus standard care for glucose monitoring, Outcome 15 Maternal hypoglycaemia: self‐monitored blood glucose episodes hypoglycaemic (< 3.9 mmol/L) (%).
Comparison 1 Telemedicine versus standard care for glucose monitoring, Outcome 16 Glycaemic control: HbA1c (%).
Comparison 1 Telemedicine versus standard care for glucose monitoring, Outcome 17 Glycaemic control: HbA1c < 5.8%.
Comparison 1 Telemedicine versus standard care for glucose monitoring, Outcome 18 Glycaemic control: HbA1c at 36 weeks (mmol/mol).
Comparison 1 Telemedicine versus standard care for glucose monitoring, Outcome 19 Glycaemic control: self‐monitored blood glucose (mmol/L).
Comparison 1 Telemedicine versus standard care for glucose monitoring, Outcome 20 Glycaemic control: fasting and 2‐hour post‐prandial blood glucose (mg/dL).
Comparison 1 Telemedicine versus standard care for glucose monitoring, Outcome 21 Stillbirth.
Comparison 1 Telemedicine versus standard care for glucose monitoring, Outcome 22 Neonatal death.
Comparison 1 Telemedicine versus standard care for glucose monitoring, Outcome 23 Gestational age at birth (weeks).
Comparison 1 Telemedicine versus standard care for glucose monitoring, Outcome 24 Preterm birth < 37 weeks.
Comparison 1 Telemedicine versus standard care for glucose monitoring, Outcome 25 Macrosomia.
Comparison 1 Telemedicine versus standard care for glucose monitoring, Outcome 26 Small‐for‐gestational age.
Comparison 1 Telemedicine versus standard care for glucose monitoring, Outcome 27 Birthweight (g).
Comparison 1 Telemedicine versus standard care for glucose monitoring, Outcome 28 Head circumference (cm).
Comparison 1 Telemedicine versus standard care for glucose monitoring, Outcome 29 Length (cm).
Comparison 1 Telemedicine versus standard care for glucose monitoring, Outcome 30 Shoulder dystocia.
Comparison 1 Telemedicine versus standard care for glucose monitoring, Outcome 31 Respiratory distress syndrome.
Comparison 1 Telemedicine versus standard care for glucose monitoring, Outcome 32 Neonatal hypoglycaemia.
Comparison 1 Telemedicine versus standard care for glucose monitoring, Outcome 33 Hyperbilirubinaemia or jaundice.
Comparison 1 Telemedicine versus standard care for glucose monitoring, Outcome 34 Hypocalcaemia.
Comparison 1 Telemedicine versus standard care for glucose monitoring, Outcome 35 Polycythaemia.
Comparison 1 Telemedicine versus standard care for glucose monitoring, Outcome 36 Number of hospital or health professional visits: face‐to‐face visits.
Comparison 1 Telemedicine versus standard care for glucose monitoring, Outcome 37 Number of hospital or health professional visits: unscheduled face‐to‐face visits.
Comparison 1 Telemedicine versus standard care for glucose monitoring, Outcome 38 Neonatal intensive care unit admission.
Comparison 1 Telemedicine versus standard care for glucose monitoring, Outcome 39 'Neonatal morbidity' (neonatal complications: e.g. hypoglycaemia, hyperbilirubinaemia, respiratory distress syndrome, shoulder dystocia, malformations) (not a prespecified outcome).
Comparison 1 Telemedicine versus standard care for glucose monitoring, Outcome 40 'Maternal morbidity' (maternal complications: gestational hypertension, pre‐eclampsia, eclampsia, hypoglycaemic episodes) (not a prespecified outcome).
Comparison 2 Self‐monitoring versus periodic glucose monitoring, Outcome 1 Hypertensive disorders of pregnancy: pre‐eclampsia.
Comparison 2 Self‐monitoring versus periodic glucose monitoring, Outcome 2 Caesarean section.
Comparison 2 Self‐monitoring versus periodic glucose monitoring, Outcome 3 Perinatal mortality.
Comparison 2 Self‐monitoring versus periodic glucose monitoring, Outcome 4 Large‐for‐gestational age.
Comparison 2 Self‐monitoring versus periodic glucose monitoring, Outcome 5 Placental abruption.
Comparison 2 Self‐monitoring versus periodic glucose monitoring, Outcome 6 Postpartum haemorrhage.
Comparison 2 Self‐monitoring versus periodic glucose monitoring, Outcome 7 Gestational weight gain (kg/week).
Comparison 2 Self‐monitoring versus periodic glucose monitoring, Outcome 8 Gestational weight gain (lb).
Comparison 2 Self‐monitoring versus periodic glucose monitoring, Outcome 9 Adherence to the intervention: < 70% adherence to home blood glucose measurements or diabetes outpatient clinic appointments.
Comparison 2 Self‐monitoring versus periodic glucose monitoring, Outcome 10 Adherence to the intervention: Dietary Compliance Questionnaire.
Comparison 2 Self‐monitoring versus periodic glucose monitoring, Outcome 11 Sense of well‐being and quality of life: Diabetes Empowerment Scale delta scores.
Comparison 2 Self‐monitoring versus periodic glucose monitoring, Outcome 12 Sense of well‐being and quality of life: emotional adjustment: Appraisal of Diabetes Scale delta scores.
Comparison 2 Self‐monitoring versus periodic glucose monitoring, Outcome 13 Use of additional pharmacotherapy: insulin.
Comparison 2 Self‐monitoring versus periodic glucose monitoring, Outcome 14 Glycaemic control: pre‐prandial blood glucose (mmol/L).
Comparison 2 Self‐monitoring versus periodic glucose monitoring, Outcome 15 Glycaemic control: 1‐hour post‐prandial blood glucose (mmol/L).
Comparison 2 Self‐monitoring versus periodic glucose monitoring, Outcome 16 Stillbirth.
Comparison 2 Self‐monitoring versus periodic glucose monitoring, Outcome 17 Neonatal death.
Comparison 2 Self‐monitoring versus periodic glucose monitoring, Outcome 18 Gestational age at birth (weeks).
Comparison 2 Self‐monitoring versus periodic glucose monitoring, Outcome 19 Macrosomia.
Comparison 2 Self‐monitoring versus periodic glucose monitoring, Outcome 20 Small‐for‐gestational age.
Comparison 2 Self‐monitoring versus periodic glucose monitoring, Outcome 21 Birthweight (kg).
Comparison 2 Self‐monitoring versus periodic glucose monitoring, Outcome 22 Birthweight (percentile).
Comparison 2 Self‐monitoring versus periodic glucose monitoring, Outcome 23 Shoulder dystocia.
Comparison 2 Self‐monitoring versus periodic glucose monitoring, Outcome 24 Neonatal hypoglycaemia.
Comparison 2 Self‐monitoring versus periodic glucose monitoring, Outcome 25 Hyperbilirubinaemia or jaundice.
Comparison 2 Self‐monitoring versus periodic glucose monitoring, Outcome 26 Number of antenatal visits or admissions: prenatal visits with the diabetes team.
Comparison 2 Self‐monitoring versus periodic glucose monitoring, Outcome 27 Neonatal intensive care unit admission.
Comparison 2 Self‐monitoring versus periodic glucose monitoring, Outcome 28 'Birth trauma' (not a prespecified outcome).
Comparison 2 Self‐monitoring versus periodic glucose monitoring, Outcome 29 'Respiratory complications' (not a prespecified outcome).
Comparison 3 Continuous glucose monitoring system versus self‐monitoring of glucose, Outcome 1 Caesarean section.
Comparison 3 Continuous glucose monitoring system versus self‐monitoring of glucose, Outcome 2 Perinatal mortality.
Comparison 3 Continuous glucose monitoring system versus self‐monitoring of glucose, Outcome 3 Large‐for‐gestational age.
Comparison 3 Continuous glucose monitoring system versus self‐monitoring of glucose, Outcome 4 Gestational weight gain (kg).
Comparison 3 Continuous glucose monitoring system versus self‐monitoring of glucose, Outcome 5 Use of additional pharmacotherapy.
Comparison 3 Continuous glucose monitoring system versus self‐monitoring of glucose, Outcome 6 Glycaemic control: HbA1c at 32 to 36 weeks (%).
Comparison 3 Continuous glucose monitoring system versus self‐monitoring of glucose, Outcome 7 Stillbirth.
Comparison 3 Continuous glucose monitoring system versus self‐monitoring of glucose, Outcome 8 Neonatal death.
Comparison 3 Continuous glucose monitoring system versus self‐monitoring of glucose, Outcome 9 Gestational age at birth (weeks).
Comparison 3 Continuous glucose monitoring system versus self‐monitoring of glucose, Outcome 10 Preterm birth < 37 weeks.
Comparison 3 Continuous glucose monitoring system versus self‐monitoring of glucose, Outcome 11 Macrosomia.
Comparison 3 Continuous glucose monitoring system versus self‐monitoring of glucose, Outcome 12 Small‐for‐gestational age.
Comparison 3 Continuous glucose monitoring system versus self‐monitoring of glucose, Outcome 13 Birthweight (g).
Comparison 3 Continuous glucose monitoring system versus self‐monitoring of glucose, Outcome 14 Neonatal hypoglycaemia.
Comparison 3 Continuous glucose monitoring system versus self‐monitoring of glucose, Outcome 15 Hyperbilirubinaemia or jaundice.
Comparison 3 Continuous glucose monitoring system versus self‐monitoring of glucose, Outcome 16 Neonatal intensive care unit admission.
Comparison 3 Continuous glucose monitoring system versus self‐monitoring of glucose, Outcome 17 Length of postnatal stay (baby): length of stay in neonatal intensive care unit (days).
Comparison 4 Modem versus telephone transmission for glucose monitoring, Outcome 1 Views of the intervention.
Comparison 5 Postprandial versus preprandial glucose monitoring, Outcome 1 Hypertensive disorders of pregnancy: pre‐eclampsia.
Comparison 5 Postprandial versus preprandial glucose monitoring, Outcome 2 Caesarean section.
Comparison 5 Postprandial versus preprandial glucose monitoring, Outcome 3 Large‐for‐gestational age.
Comparison 5 Postprandial versus preprandial glucose monitoring, Outcome 4 Perineal trauma.
Comparison 5 Postprandial versus preprandial glucose monitoring, Outcome 5 Gestational weight gain (kg).
Comparison 5 Postprandial versus preprandial glucose monitoring, Outcome 6 Adherence to the intervention: compliance with schedule (%).
Comparison 5 Postprandial versus preprandial glucose monitoring, Outcome 7 Use of additional pharmacotherapy.
Comparison 5 Postprandial versus preprandial glucose monitoring, Outcome 8 Glycaemic control: change in HbA1c (%).
Comparison 5 Postprandial versus preprandial glucose monitoring, Outcome 9 Glycaemic control: hospitalisation for glycaemic control.
Comparison 5 Postprandial versus preprandial glucose monitoring, Outcome 10 Glycaemic control: success in glycaemic control (%).
Comparison 5 Postprandial versus preprandial glucose monitoring, Outcome 11 Stillbirth.
Comparison 5 Postprandial versus preprandial glucose monitoring, Outcome 12 Gestational age at birth (weeks).
Comparison 5 Postprandial versus preprandial glucose monitoring, Outcome 13 Apgar score < 7 at 5 minutes.
Comparison 5 Postprandial versus preprandial glucose monitoring, Outcome 14 Macrosomia.
Comparison 5 Postprandial versus preprandial glucose monitoring, Outcome 15 Small‐for‐gestational age.
Comparison 5 Postprandial versus preprandial glucose monitoring, Outcome 16 Birthweight (g).
Comparison 5 Postprandial versus preprandial glucose monitoring, Outcome 17 Shoulder dystocia.
Comparison 5 Postprandial versus preprandial glucose monitoring, Outcome 18 Nerve palsies.
Comparison 5 Postprandial versus preprandial glucose monitoring, Outcome 19 Bone fractures.
Comparison 5 Postprandial versus preprandial glucose monitoring, Outcome 20 Neonatal hypoglycaemia.
Comparison 5 Postprandial versus preprandial glucose monitoring, Outcome 21 Hyperbilirubinaemia or jaundice.
| Telemedicine versus standard care for glucose monitoring for gestational diabetes during pregnancy (effect on mother) | ||||||
| Patient or population: women with gestational diabetes mellitus | ||||||
| Outcomes | Anticipated absolute effects* (95% CI) | Relative effect | № of participants | Quality of the evidence | Comments | |
| Risk with standard care | Risk with telemedicine | |||||
| Hypertensive disorders of pregnancy including pre‐eclampsia, gestational hypertension and eclampsia | Study population | RR 1.49 | 275 | ⊕⊝⊝⊝ | ||
| 58 per 1000 | 87 per 1000 | |||||
| Caesarean section | Study population | RR 1.05 | 478 | ⊕⊝⊝⊝ | ||
| 444 per 1000 | 467 per 1000 | |||||
| Development of type 2 diabetes | Study population | not estimable | (0 RCTs) | ‐ | None of the included RCTs reported this outcome | |
| 0 per 1000 | 0 per 1000 | |||||
| Induction of labour | Study population | RR 1.06 | 47 | ⊕⊝⊝⊝ | ||
| 538 per 1000 | 571 per 1000 | |||||
| Perineal trauma | Study population | Not estimable | (0 RCTs) | ‐ | None of the included RCTs reported this outcome | |
| 0 per 1000 | 0 per 1000 | |||||
| Postnatal depression | Study population | Not estimable | (0 RCTs) | ‐ | None of the included RCTs reported this outcome | |
| 0 per 1000 | 0 per 1000 | |||||
| Postnatal weight retention or return to pre‐pregnancy weight | Study population | Not estimable | (0 RCTs) | ‐ | None of the included RCTs reported this outcome | |
| 0 per 1000 | 0 per 1000 | |||||
| *The risk in the intervention group (and its 95% confidence interval) is based on the assumed risk in the comparison group and the relative effect of the intervention (and its 95% CI). | ||||||
| GRADE Working Group grades of evidence | ||||||
| 1Study limitations (downgraded 1 level): 4 RCTs with potentially serious or very serious design limitations | ||||||
| Telemedicine versus standard care for glucose monitoring in gestational diabetes during pregnancy (effect on child) | ||||||
| Patient or population: women with gestational diabetes mellitus | ||||||
| Outcomes | Anticipated absolute effects* (95% CI) | Relative effect | № of participants | Quality of the evidence | Comments | |
| Risk with standard care | Risk with telemedicine | |||||
| Perinatal mortality (including stillbirth or neonatal death) | Study population | ‐ | 131 | ⊕⊝⊝⊝ | There were no perinatal deaths in 2 RCTs | |
| See comment | See comment | |||||
| Large‐for‐gestational age | Study population | RR 1.41 | 228 | ⊕⊝⊝⊝ | ||
| 126 per 1000 | 178 per 1000 | |||||
| Death or serious morbidity composite | Study population | RR 1.06 | 57 | ⊕⊝⊝⊝ | ||
| 560 per 1000 | 594 per 1000 | |||||
| Neurosensory disability | Study population | Not estimable | (0 RCTS) | ‐ | None of the included RCTs reported this outcome | |
| 0 per 100 | 0 per 1000 (0 to 0) | |||||
| Hypoglycaemia | Study population | RR 1.14 | 198 | ⊕⊝⊝⊝ | ||
| 82 per 100 | 94 per 1000 | |||||
| Adiposity (e.g. BMI, skinfold thickness, fat mass) | Study population | Not estimable | (0 RCTs) | ‐ | None of the included RCTs reported this outcome | |
| 0 per 1000 | 0 per 1000 | |||||
| Type 2 diabetes | Study population | Not estimable | (0 RCTs) | ‐ | None of the included RCTs reported this outcome | |
| 0 per 1000 | 0 per 1000 | |||||
| *The risk in the intervention group (and its 95% confidence interval) is based on the assumed risk in the comparison group and the relative effect of the intervention (and its 95% CI). | ||||||
| GRADE Working Group grades of evidence | ||||||
| 1Study limitations (downgraded 1 level): 2 RCTs with potentially serious design limitations | ||||||
| Self‐monitoring versus periodic glucose monitoring for gestational diabetes during pregnancy (effect on mother) | ||||||
| Patient or population: women with gestational diabetes mellitus Intervention: self‐monitoring of glucose | ||||||
| Outcomes | Anticipated absolute effects* (95% CI) | Relative effect | № of participants | Quality of the evidence | Comments | |
| Risk with periodic glucose monitoring | Risk with self‐monitoring of glucose | |||||
| Hypertensive disorders of pregnancy: pre‐eclampsia | Study population | RR 0.17 | 58 | ⊕⊝⊝⊝ | ||
| 74 per 1000 | 13 per 1000 | |||||
| Caesarean section | Study population | RR 1.18 | 400 | ⊕⊕⊝⊝ | ||
| 228 per 1000 | 270 per 1000 | |||||
| Development of type 2 diabetes | Study population | Not estimable | (0 RCTs) | ‐ | Neither of the included RCTs reported this outcome | |
| 0 per 1000 | 0 per 1000 | |||||
| Induction of labour | Study population | Not estimable | (0 RCTs) | ‐ | Neither of the RCTs reported this outcome | |
| 0 per 1000 | 0 per 1000 | |||||
| Perineal trauma | Study population | Not estimable | (0 RCTs) | ‐ | Neither of the included RCTs reported this outcome | |
| 0 per 1000 | 0 per 1000 | |||||
| Postnatal depression | Study population | Not estimable | (0 RCTs) | ‐ | Neither of the included RCTs reported this outcome | |
| 0 per 1000 | 0 per 1000 | |||||
| Postnatal weight retention or return to pre‐pregnancy weight | Study population | Not estimable | (0 RCTs) | ‐ | Neither of the included RCTs reported this outcome | |
| 0 per 1000 | 0 per 1000 | |||||
| *The risk in the intervention group (and its 95% confidence interval) is based on the assumed risk in the comparison group and the relative effect of the intervention (and its 95% CI). | ||||||
| GRADE Working Group grades of evidence | ||||||
| 1Study limitations (downgraded 1 level): 1 RCT with potentially serious design limitations | ||||||
| Self‐monitoring versus periodic for glucose monitoring for gestation diabetes during pregnancy (effect on child) | ||||||
| Patient or population: women with gestational diabetes mellitus Intervention: self‐monitoring of glucose | ||||||
| Outcomes | Anticipated absolute effects* (95% CI) | Relative effect | № of participants | Quality of the evidence | Comments | |
| Risk with periodic glucose monitoring | Risk with self‐monitoring of glucose | |||||
| Perinatal mortality (stillbirth or neonatal death) | Study population | RR 1.54 | 400 | ⊕⊝⊝⊝ | ||
| 5 per 1000 | 8 per 1000 | |||||
| Large‐for‐gestational age | Study population | RR 0.82 | 400 | ⊕⊕⊝⊝ | ||
| 142 per 1000 | 117 per 1000 | |||||
| Death or serious morbidity composite | Study population | Not estimable | (0 RCTs) | ‐ | Neither of the included RCTs reported this outcome | |
| 0 per 1000 | 0 per 1000 | |||||
| Neurosensory disability | Study population | Not estimable | (0 RCTs) | ‐ | Neither of the included RCTs reported this outcome | |
| 0 per 1000 | 0 per 1000 | |||||
| Hypoglycaemia | Study population | RR 0.64 | 391 | ⊕⊕⊝⊝ | ||
| 173 per 1000 | 111 per 1000 | |||||
| Adiposity (e.g. BMI, skinfold thickness, fat mass) | Study population | Not estimable | (0 RCTs) | ‐ | Neither of the included RCTs reported this outcome | |
| 0 per 1000 | 0 per 1000 | |||||
| Type 2 diabetes | Study population | Not estimable | (0 RCTs) | ‐ | Neither of the included RCTs reported this outcome | |
| 0 per 1000 | 0 per 1000 | |||||
| *The risk in the intervention group (and its 95% confidence interval) is based on the assumed risk in the comparison group and the relative effect of the intervention (and its 95% CI). | ||||||
| GRADE Working Group grades of evidence | ||||||
| 1Study limitations (downgraded 1 level): 2 RCTs with potentially serious design limitations | ||||||
| Continuous glucose monitoring system versus self‐monitoring of glucose for gestational diabetes during pregnancy (effect on mother) | ||||||
| Patient or population: women with gestational diabetes mellitus Intervention: continuous glucose monitoring system | ||||||
| Outcomes | Anticipated absolute effects* (95% CI) | Relative effect | № of participants | Quality of the evidence | Comments | |
| Risk with self‐monitoring of glucose | Risk with continuous glucose monitoring system | |||||
| Hypertensive disorders of pregnancy | Study population | Not estimable | (0 RCTs) | ‐ | Neither of the included RCTs reported this outcome | |
| 0 per 1000 | 0 per 1000 | |||||
| Caesarean section | Study population | RR 0.91 | 179 | ⊕⊕⊝⊝ | ||
| 500 per 1000 | 455 per 1000 | |||||
| Development of type 2 diabetes | Study population | Not estimable | (0 RCTs) | ‐ | Neither of the included RCTs reported this outcome | |
| 0 per 1000 | 0 per 1000 | |||||
| Induction of labour | Study population | Not estimable | (0 RCTs) | ‐ | Neither of the included RCTs reported this outcome | |
| 0 per 1000 | 0 per 1000 | |||||
| Perineal trauma | Study population | Not estimable | (0 RCTs) | ‐ | Neither of the included RCTs reported this outcome | |
| 0 per 1000 | 0 per 1000 | |||||
| Postnatal depression | Study population | Not estimable | (0 RCTs) | ‐ | Neither of the included RCTs reported this outcome | |
| 0 per 1000 | 0 per 1000 | |||||
| Postnatal weight retention or return to pre‐pregnancy weight | Study population | Not estimable | (0 RCTs) | ‐ | Neither of the included RCTs reported this outcome | |
| 0 per 1000 | 0 per 1000 | |||||
| *The risk in the intervention group (and its 95% confidence interval) is based on the assumed risk in the comparison group and the relative effect of the intervention (and its 95% CI). | ||||||
| GRADE Working Group grades of evidence | ||||||
| 1Study limitations (downgraded 1 level): 2 RCTs with potentially serious design limitations | ||||||
| Continuous glucose monitoring system versus self‐monitoring of glucose for gestational diabetes during pregnancy (effect on child) | ||||||
| Patient or population: women with gestational diabetes mellitus Intervention: continuous glucose monitoring system | ||||||
| Outcomes | Anticipated absolute effects* (95% CI) | Relative effect | № of participants | Quality of the evidence | Comments | |
| Risk with self‐monitoring of glucose | Risk with continuous glucose monitoring system | |||||
| Perinatal mortality (stillbirth or neonatal death) | Study population | ‐ | 179 | ⊕⊕⊝⊝ | There were no perinatal deaths in the 2 RCTs | |
| See comment | See comment | |||||
| Large‐for‐gestational age | Study population | RR 0.67 | 106 | ⊕⊝⊝⊝ | ||
| 527 per 1000 | 353 per 1000 | |||||
| Death or serious morbidity composite | Study population | Not estimable | (0 RCTs) | ‐ | Neither of the included RCTs reported this outcome | |
| 0 per 1000 | 0 per 1000 | |||||
| Neurosensory disability | Study population | Not estimable | (0 RCTs) | ‐ | Neither of the included RCTs reported this outcome | |
| 0 per 1000 | 0 per 1000 | |||||
| Hypoglycaemia | Study population | RR 0.79 | 179 | ⊕⊝⊝⊝ | ||
| 130 per 1000 | 103 per 1000 | |||||
| Adiposity (e.g. BMI, skinfold thickness, fat mass) | Study population | Not estimable | (0 RCTs) | ‐ | Neither of the included RCTs reported this outcome | |
| 0 per 1000 | 0 per 1000 | |||||
| Type 2 diabetes | Study population | Not estimable | (0 RCTs) | ‐ | Neither of the included RCTs reported this outcome | |
| 0 per 1000 | 0 per 1000 | |||||
| *The risk in the intervention group (and its 95% confidence interval) is based on the assumed risk in the comparison group and the relative effect of the intervention (and its 95% CI). | ||||||
| GRADE Working Group grades of evidence | ||||||
| 1Study limitations (downgraded 1 level): 2 RCTs with potentially serious design limitations | ||||||
| Outcome or subgroup title | No. of studies | No. of participants | Statistical method | Effect size |
| 1 Hypertensive disorders of pregnancy Show forest plot | 4 | 275 | Risk Ratio (M‐H, Fixed, 95% CI) | 1.49 [0.69, 3.20] |
| 1.1 Pre‐eclampsia, pregnancy‐induced hypertension | 3 | 178 | Risk Ratio (M‐H, Fixed, 95% CI) | 1.29 [0.58, 2.89] |
| 1.2 Pregnancy‐induced hypertension | 1 | 97 | Risk Ratio (M‐H, Fixed, 95% CI) | 4.9 [0.24, 99.48] |
| 2 Caesarean section Show forest plot | 5 | 478 | Risk Ratio (M‐H, Random, 95% CI) | 1.05 [0.72, 1.53] |
| 3 Perinatal mortality Show forest plot | 2 | 131 | Risk Ratio (M‐H, Fixed, 95% CI) | 0.0 [0.0, 0.0] |
| 4 Large‐for‐gestational age Show forest plot | 3 | 228 | Risk Ratio (M‐H, Fixed, 95% CI) | 1.41 [0.76, 2.64] |
| 5 Death or serious morbidity composite Show forest plot | 1 | 57 | Risk Ratio (M‐H, Fixed, 95% CI) | 1.06 [0.68, 1.66] |
| 6 Operative vaginal birth (not a prespecified outcome) Show forest plot | 1 | 47 | Risk Ratio (M‐H, Fixed, 95% CI) | 0.50 [0.11, 2.30] |
| 7 Induction of labour Show forest plot | 1 | 47 | Risk Ratio (M‐H, Fixed, 95% CI) | 1.06 [0.63, 1.77] |
| 8 Placental abruption Show forest plot | 2 | 154 | Risk Ratio (M‐H, Fixed, 95% CI) | 0.88 [0.12, 6.42] |
| 9 Gestational weight gain (kg) Show forest plot | 2 | 300 | Mean Difference (IV, Fixed, 95% CI) | ‐0.47 [‐1.50, 0.55] |
| 10 Weight at 36 weeks (kg) Show forest plot | 1 | 44 | Mean Difference (IV, Fixed, 95% CI) | 5.5 [‐5.69, 16.69] |
| 11 Adherence to the intervention Show forest plot | 3 | Mean Difference (IV, Fixed, 95% CI) | Subtotals only | |
| 11.1 Appointments attended (%) | 1 | 47 | Mean Difference (IV, Fixed, 95% CI) | 5.20 [‐2.27, 12.67] |
| 11.2 Average daily self‐monitoring of blood glucose frequency: meter memory | 1 | 44 | Mean Difference (IV, Fixed, 95% CI) | 0.5 [‐0.42, 1.42] |
| 11.3 Average daily self‐monitoring of blood glucose frequency: diary | 1 | 45 | Mean Difference (IV, Fixed, 95% CI) | 0.10 [‐0.66, 0.86] |
| 11.4 Frequency of monitoring (number of data points) | 1 | 57 | Mean Difference (IV, Fixed, 95% CI) | 21.10 [‐9.33, 51.53] |
| 11.5 Frequency of monitoring (number of data sets) | 1 | 74 | Mean Difference (IV, Fixed, 95% CI) | 1.20 [‐12.32, 14.72] |
| 12 Sense of well‐being and quality of life: DES: Diabetes Empowerment Scale Show forest plot | 1 | Mean Difference (IV, Fixed, 95% CI) | Subtotals only | |
| 12.1 Total | 1 | 57 | Mean Difference (IV, Fixed, 95% CI) | 0.40 [0.14, 0.66] |
| 12.2 Subscale 1: managing the psychosocial aspects of diabetes | 1 | 57 | Mean Difference (IV, Fixed, 95% CI) | 0.5 [0.21, 0.79] |
| 12.3 Subscale 2: assessing dissatisfaction and readiness to change | 1 | 57 | Mean Difference (IV, Fixed, 95% CI) | 0.40 [0.14, 0.66] |
| 12.4 Subscale 3: setting and achieving diabetes goals | 1 | 57 | Mean Difference (IV, Fixed, 95% CI) | 0.30 [‐0.04, 0.64] |
| 13 Use of additional pharmacotherapy Show forest plot | 5 | Risk Ratio (M‐H, Fixed, 95% CI) | Subtotals only | |
| 13.1 Insulin | 5 | 484 | Risk Ratio (M‐H, Fixed, 95% CI) | 1.52 [1.18, 1.96] |
| 13.2 Oral agents | 3 | 184 | Risk Ratio (M‐H, Fixed, 95% CI) | 0.85 [0.50, 1.42] |
| 13.3 Insulin and oral agents | 1 | 47 | Risk Ratio (M‐H, Fixed, 95% CI) | 1.24 [0.19, 8.06] |
| 14 Maternal hypoglycaemia Show forest plot | 1 | 203 | Risk Ratio (M‐H, Fixed, 95% CI) | 0.0 [0.0, 0.0] |
| 15 Maternal hypoglycaemia: self‐monitored blood glucose episodes hypoglycaemic (< 3.9 mmol/L) (%) Show forest plot | 1 | 44 | Mean Difference (IV, Fixed, 95% CI) | ‐0.10 [‐1.64, 1.44] |
| 16 Glycaemic control: HbA1c (%) Show forest plot | 3 | 357 | Mean Difference (IV, Fixed, 95% CI) | ‐0.15 [‐0.26, ‐0.04] |
| 17 Glycaemic control: HbA1c < 5.8% Show forest plot | 1 | 97 | Risk Ratio (M‐H, Fixed, 95% CI) | 1.0 [0.96, 1.04] |
| 18 Glycaemic control: HbA1c at 36 weeks (mmol/mol) Show forest plot | 1 | 30 | Mean Difference (IV, Fixed, 95% CI) | 0.20 [‐2.03, 2.43] |
| 19 Glycaemic control: self‐monitored blood glucose (mmol/L) Show forest plot | 1 | 44 | Mean Difference (IV, Fixed, 95% CI) | 0.0 [‐0.30, 0.30] |
| 20 Glycaemic control: fasting and 2‐hour post‐prandial blood glucose (mg/dL) Show forest plot | 2 | Mean Difference (IV, Random, 95% CI) | Subtotals only | |
| 20.1 Fasting blood glucose (mg/dL) | 2 | 131 | Mean Difference (IV, Random, 95% CI) | ‐0.50 [‐5.38, 4.38] |
| 20.2 2‐hour post‐prandial blood glucose (mg/dL) | 2 | 131 | Mean Difference (IV, Random, 95% CI) | ‐0.21 [‐5.09, 4.67] |
| 21 Stillbirth Show forest plot | 3 | 178 | Risk Ratio (M‐H, Fixed, 95% CI) | 0.41 [0.02, 9.55] |
| 22 Neonatal death Show forest plot | 2 | 131 | Risk Ratio (M‐H, Fixed, 95% CI) | 0.0 [0.0, 0.0] |
| 23 Gestational age at birth (weeks) Show forest plot | 5 | 478 | Mean Difference (IV, Fixed, 95% CI) | 0.10 [‐0.18, 0.37] |
| 24 Preterm birth < 37 weeks Show forest plot | 4 | 275 | Risk Ratio (M‐H, Fixed, 95% CI) | 0.66 [0.31, 1.39] |
| 25 Macrosomia Show forest plot | 2 | 249 | Risk Ratio (M‐H, Random, 95% CI) | 1.43 [0.27, 7.52] |
| 26 Small‐for‐gestational age Show forest plot | 1 | 97 | Risk Ratio (M‐H, Fixed, 95% CI) | 0.0 [0.0, 0.0] |
| 27 Birthweight (g) Show forest plot | 5 | 477 | Mean Difference (IV, Fixed, 95% CI) | 63.13 [‐32.32, 158.59] |
| 28 Head circumference (cm) Show forest plot | 1 | 45 | Mean Difference (IV, Fixed, 95% CI) | 0.70 [0.02, 1.38] |
| 29 Length (cm) Show forest plot | 1 | 42 | Mean Difference (IV, Fixed, 95% CI) | 0.20 [‐1.34, 1.74] |
| 30 Shoulder dystocia Show forest plot | 2 | 142 | Risk Ratio (M‐H, Fixed, 95% CI) | 0.33 [0.01, 7.83] |
| 31 Respiratory distress syndrome Show forest plot | 3 | 176 | Risk Ratio (M‐H, Fixed, 95% CI) | 0.63 [0.26, 1.49] |
| 32 Neonatal hypoglycaemia Show forest plot | 3 | 198 | Risk Ratio (M‐H, Fixed, 95% CI) | 1.14 [0.48, 2.72] |
| 33 Hyperbilirubinaemia or jaundice Show forest plot | 3 | 176 | Risk Ratio (M‐H, Fixed, 95% CI) | 1.09 [0.59, 2.01] |
| 34 Hypocalcaemia Show forest plot | 1 | 97 | Risk Ratio (M‐H, Fixed, 95% CI) | 0.0 [0.0, 0.0] |
| 35 Polycythaemia Show forest plot | 1 | 97 | Risk Ratio (M‐H, Fixed, 95% CI) | 0.0 [0.0, 0.0] |
| 36 Number of hospital or health professional visits: face‐to‐face visits Show forest plot | 1 | 97 | Mean Difference (IV, Fixed, 95% CI) | ‐0.36 [‐0.92, 0.20] |
| 37 Number of hospital or health professional visits: unscheduled face‐to‐face visits Show forest plot | 1 | 97 | Mean Difference (IV, Fixed, 95% CI) | ‐0.62 [‐1.05, ‐0.19] |
| 38 Neonatal intensive care unit admission Show forest plot | 3 | 176 | Risk Ratio (M‐H, Fixed, 95% CI) | 1.05 [0.62, 1.79] |
| 39 'Neonatal morbidity' (neonatal complications: e.g. hypoglycaemia, hyperbilirubinaemia, respiratory distress syndrome, shoulder dystocia, malformations) (not a prespecified outcome) Show forest plot | 1 | 203 | Risk Ratio (M‐H, Fixed, 95% CI) | 1.52 [0.53, 4.38] |
| 40 'Maternal morbidity' (maternal complications: gestational hypertension, pre‐eclampsia, eclampsia, hypoglycaemic episodes) (not a prespecified outcome) Show forest plot | 1 | 203 | Risk Ratio (M‐H, Fixed, 95% CI) | 0.49 [0.13, 1.79] |
| Outcome or subgroup title | No. of studies | No. of participants | Statistical method | Effect size |
| 1 Hypertensive disorders of pregnancy: pre‐eclampsia Show forest plot | 1 | 58 | Risk Ratio (M‐H, Fixed, 95% CI) | 0.18 [0.01, 3.49] |
| 2 Caesarean section Show forest plot | 2 | 400 | Risk Ratio (M‐H, Random, 95% CI) | 1.18 [0.61, 2.27] |
| 3 Perinatal mortality Show forest plot | 2 | 400 | Risk Ratio (M‐H, Fixed, 95% CI) | 1.54 [0.21, 11.24] |
| 4 Large‐for‐gestational age Show forest plot | 2 | 400 | Risk Ratio (M‐H, Fixed, 95% CI) | 0.82 [0.50, 1.37] |
| 5 Placental abruption Show forest plot | 1 | 58 | Risk Ratio (M‐H, Fixed, 95% CI) | 2.63 [0.11, 61.88] |
| 6 Postpartum haemorrhage Show forest plot | 1 | 58 | Risk Ratio (M‐H, Fixed, 95% CI) | 2.63 [0.11, 61.88] |
| 7 Gestational weight gain (kg/week) Show forest plot | 1 | 342 | Mean Difference (IV, Fixed, 95% CI) | ‐0.1 [‐0.15, ‐0.05] |
| 7.1 1‐hour post‐breakfast glucose < 7.8 mmol/L | 1 | 227 | Mean Difference (IV, Fixed, 95% CI) | ‐0.10 [‐0.17, ‐0.03] |
| 7.2 1‐hour post‐breakfast glucose ≥ 7.8 mmol/L | 1 | 115 | Mean Difference (IV, Fixed, 95% CI) | ‐0.10 [‐0.17, ‐0.03] |
| 8 Gestational weight gain (lb) Show forest plot | 1 | 58 | Mean Difference (IV, Fixed, 95% CI) | ‐5.5 [‐13.57, 2.57] |
| 9 Adherence to the intervention: < 70% adherence to home blood glucose measurements or diabetes outpatient clinic appointments Show forest plot | 1 | 342 | Risk Ratio (M‐H, Fixed, 95% CI) | 0.74 [0.32, 1.71] |
| 10 Adherence to the intervention: Dietary Compliance Questionnaire Show forest plot | 1 | Mean Difference (IV, Fixed, 95% CI) | Subtotals only | |
| 10.1 Total compliance score | 1 | 58 | Mean Difference (IV, Fixed, 95% CI) | 1.5 [‐0.47, 3.47] |
| 10.2 Mean compliance score | 1 | 58 | Mean Difference (IV, Fixed, 95% CI) | 0.0 [‐0.40, 0.40] |
| 11 Sense of well‐being and quality of life: Diabetes Empowerment Scale delta scores Show forest plot | 1 | Mean Difference (IV, Fixed, 95% CI) | Subtotals only | |
| 11.1 Overall | 1 | 47 | Mean Difference (IV, Fixed, 95% CI) | 3.70 [‐2.08, 9.48] |
| 11.2 Setting goals | 1 | 47 | Mean Difference (IV, Fixed, 95% CI) | 0.65 [‐1.10, 2.40] |
| 11.3 Solving problems | 1 | 47 | Mean Difference (IV, Fixed, 95% CI) | 1.35 [‐0.37, 3.07] |
| 11.4 Motivating oneself | 1 | 47 | Mean Difference (IV, Fixed, 95% CI) | 0.63 [‐0.89, 2.15] |
| 11.5 Obtaining support | 1 | 47 | Mean Difference (IV, Fixed, 95% CI) | 0.94 [‐0.09, 1.97] |
| 11.6 Making decisions | 1 | 47 | Mean Difference (IV, Fixed, 95% CI) | 0.01 [‐1.39, 1.41] |
| 12 Sense of well‐being and quality of life: emotional adjustment: Appraisal of Diabetes Scale delta scores Show forest plot | 1 | 47 | Mean Difference (IV, Fixed, 95% CI) | 1.20 [‐0.88, 3.28] |
| 13 Use of additional pharmacotherapy: insulin Show forest plot | 2 | 400 | Risk Ratio (M‐H, Fixed, 95% CI) | 1.31 [0.69, 2.48] |
| 14 Glycaemic control: pre‐prandial blood glucose (mmol/L) Show forest plot | 2 | 360 | Mean Difference (IV, Random, 95% CI) | 0.06 [‐0.08, 0.19] |
| 14.1 Breakfast glucose < 7.8 mmol/L | 1 | 192 | Mean Difference (IV, Random, 95% CI) | 0.10 [‐0.03, 0.23] |
| 14.2 Breakfast glucose ≥ 7.8 mmol/L | 1 | 110 | Mean Difference (IV, Random, 95% CI) | 0.10 [‐0.07, 0.27] |
| 14.3 All women | 1 | 58 | Mean Difference (IV, Random, 95% CI) | ‐0.21 [‐0.54, 0.12] |
| 15 Glycaemic control: 1‐hour post‐prandial blood glucose (mmol/L) Show forest plot | 2 | 395 | Mean Difference (IV, Random, 95% CI) | ‐0.09 [‐0.60, 0.42] |
| 15.1 1‐hour post‐breakfast glucose > 7.8 mmol/L | 1 | 222 | Mean Difference (IV, Random, 95% CI) | 0.0 [‐0.19, 0.19] |
| 15.2 1‐hour post‐breakfast glucose ≥ 7.8 mmol/L | 1 | 115 | Mean Difference (IV, Random, 95% CI) | ‐0.60 [‐0.90, ‐0.30] |
| 15.3 All women | 1 | 58 | Mean Difference (IV, Random, 95% CI) | 0.47 [‐0.12, 1.06] |
| 16 Stillbirth Show forest plot | 2 | 400 | Risk Ratio (M‐H, Fixed, 95% CI) | 1.54 [0.21, 11.24] |
| 17 Neonatal death Show forest plot | 1 | 58 | Risk Ratio (M‐H, Fixed, 95% CI) | 0.0 [0.0, 0.0] |
| 18 Gestational age at birth (weeks) Show forest plot | 2 | 400 | Mean Difference (IV, Fixed, 95% CI) | ‐0.03 [‐0.32, 0.27] |
| 18.1 1‐hour post‐breakfast glucose < 7.8 mmol/L | 1 | 227 | Mean Difference (IV, Fixed, 95% CI) | ‐0.20 [‐0.59, 0.19] |
| 18.2 1‐hour post‐breakfast glucose ≥ 7.8 mmol/L | 1 | 115 | Mean Difference (IV, Fixed, 95% CI) | 0.20 [‐0.31, 0.71] |
| 18.3 All neonates | 1 | 58 | Mean Difference (IV, Fixed, 95% CI) | 0.30 [‐0.78, 1.38] |
| 19 Macrosomia Show forest plot | 1 | 342 | Risk Ratio (M‐H, Fixed, 95% CI) | 0.94 [0.53, 1.67] |
| 20 Small‐for‐gestational age Show forest plot | 1 | 342 | Risk Ratio (M‐H, Fixed, 95% CI) | 1.19 [0.53, 2.67] |
| 21 Birthweight (kg) Show forest plot | 2 | 400 | Mean Difference (IV, Fixed, 95% CI) | ‐40.22 [‐148.37, 67.93] |
| 21.1 1‐hour post‐breakfast glucose < 7.8 mmol/L | 1 | 227 | Mean Difference (IV, Fixed, 95% CI) | ‐10.0 [‐145.47, 125.47] |
| 21.2 1‐hour post‐breakfast glucose ≥ 7.8 mmol/L | 1 | 115 | Mean Difference (IV, Fixed, 95% CI) | ‐70.0 [‐283.34, 143.34] |
| 21.3 All neonates | 1 | 58 | Mean Difference (IV, Fixed, 95% CI) | ‐150.0 [‐482.61, 182.61] |
| 22 Birthweight (percentile) Show forest plot | 1 | 342 | Mean Difference (IV, Fixed, 95% CI) | ‐0.67 [‐6.75, 5.42] |
| 22.1 1‐hour post‐breakfast glucose < 7.8 mmol/L | 1 | 227 | Mean Difference (IV, Fixed, 95% CI) | 1.5 [‐5.71, 8.71] |
| 22.2 1‐hour post‐breakfast glucose ≥ 7.8 mmol/L | 1 | 115 | Mean Difference (IV, Fixed, 95% CI) | ‐6.00 [‐17.32, 5.32] |
| 23 Shoulder dystocia Show forest plot | 1 | 342 | Risk Ratio (M‐H, Fixed, 95% CI) | 0.25 [0.03, 2.19] |
| 24 Neonatal hypoglycaemia Show forest plot | 2 | 391 | Risk Ratio (M‐H, Fixed, 95% CI) | 0.64 [0.39, 1.06] |
| 25 Hyperbilirubinaemia or jaundice Show forest plot | 2 | 370 | Risk Ratio (M‐H, Fixed, 95% CI) | 0.63 [0.39, 1.04] |
| 26 Number of antenatal visits or admissions: prenatal visits with the diabetes team Show forest plot | 1 | 58 | Mean Difference (IV, Fixed, 95% CI) | 0.20 [‐1.09, 1.49] |
| 27 Neonatal intensive care unit admission Show forest plot | 1 | 58 | Risk Ratio (M‐H, Fixed, 95% CI) | 0.87 [0.13, 5.77] |
| 28 'Birth trauma' (not a prespecified outcome) Show forest plot | 1 | 58 | Risk Ratio (M‐H, Fixed, 95% CI) | 0.87 [0.06, 13.27] |
| 29 'Respiratory complications' (not a prespecified outcome) Show forest plot | 1 | 58 | Risk Ratio (M‐H, Fixed, 95% CI) | 0.87 [0.06, 13.27] |
| Outcome or subgroup title | No. of studies | No. of participants | Statistical method | Effect size |
| 1 Caesarean section Show forest plot | 2 | 179 | Risk Ratio (M‐H, Fixed, 95% CI) | 0.91 [0.68, 1.20] |
| 2 Perinatal mortality Show forest plot | 2 | 179 | Risk Ratio (M‐H, Fixed, 95% CI) | 0.0 [0.0, 0.0] |
| 3 Large‐for‐gestational age Show forest plot | 1 | 106 | Risk Ratio (M‐H, Fixed, 95% CI) | 0.67 [0.43, 1.05] |
| 4 Gestational weight gain (kg) Show forest plot | 2 | 179 | Mean Difference (IV, Fixed, 95% CI) | ‐1.26 [‐2.28, ‐0.24] |
| 5 Use of additional pharmacotherapy Show forest plot | 2 | 179 | Risk Ratio (M‐H, Fixed, 95% CI) | 2.86 [1.47, 5.56] |
| 6 Glycaemic control: HbA1c at 32 to 36 weeks (%) Show forest plot | 1 | 106 | Mean Difference (IV, Fixed, 95% CI) | ‐0.10 [‐0.24, 0.04] |
| 7 Stillbirth Show forest plot | 2 | 179 | Risk Ratio (M‐H, Fixed, 95% CI) | 0.0 [0.0, 0.0] |
| 8 Neonatal death Show forest plot | 2 | 179 | Risk Ratio (M‐H, Fixed, 95% CI) | 0.0 [0.0, 0.0] |
| 9 Gestational age at birth (weeks) Show forest plot | 2 | 179 | Mean Difference (IV, Fixed, 95% CI) | ‐0.17 [‐0.52, 0.19] |
| 10 Preterm birth < 37 weeks Show forest plot | 1 | Risk Ratio (M‐H, Fixed, 95% CI) | Subtotals only | |
| 11 Macrosomia Show forest plot | 2 | 179 | Risk Ratio (M‐H, Fixed, 95% CI) | 0.85 [0.35, 2.05] |
| 12 Small‐for‐gestational age Show forest plot | 1 | 106 | Risk Ratio (M‐H, Fixed, 95% CI) | 1.08 [0.16, 7.37] |
| 13 Birthweight (g) Show forest plot | 2 | 179 | Mean Difference (IV, Fixed, 95% CI) | ‐110.17 [‐264.73, 44.39] |
| 14 Neonatal hypoglycaemia Show forest plot | 2 | 179 | Risk Ratio (M‐H, Fixed, 95% CI) | 0.79 [0.35, 1.78] |
| 15 Hyperbilirubinaemia or jaundice Show forest plot | 1 | 73 | Risk Ratio (M‐H, Fixed, 95% CI) | 1.03 [0.28, 3.80] |
| 16 Neonatal intensive care unit admission Show forest plot | 1 | 73 | Risk Ratio (M‐H, Fixed, 95% CI) | 0.65 [0.29, 1.50] |
| 17 Length of postnatal stay (baby): length of stay in neonatal intensive care unit (days) Show forest plot | 1 | 18 | Mean Difference (IV, Fixed, 95% CI) | ‐0.83 [‐2.35, 0.69] |
| Outcome or subgroup title | No. of studies | No. of participants | Statistical method | Effect size |
| 1 Views of the intervention Show forest plot | 1 | Risk Ratio (M‐H, Fixed, 95% CI) | Subtotals only | |
| 1.1 Overall, I am satisfied with how easy it is to use Accu‐Chek Complete, Acculink | 1 | 38 | Risk Ratio (M‐H, Fixed, 95% CI) | 1.11 [0.90, 1.38] |
| 1.2 I feel comfortable using the Accu‐Chek Complete, Acculink | 1 | 38 | Risk Ratio (M‐H, Fixed, 95% CI) | 0.96 [0.66, 1.41] |
| 1.3 Whenever I made a mistake using the Accu‐Chek Complete, Acculink, I could recover easily and quickly | 1 | 38 | Risk Ratio (M‐H, Fixed, 95% CI) | 0.92 [0.67, 1.25] |
| 1.4 It was easy to learn to use the Accu‐Chek Complete, Acculink | 1 | 38 | Risk Ratio (M‐H, Fixed, 95% CI) | 1.05 [0.82, 1.34] |
| 1.5 The written material provided for the Accu‐Chek Complete was easy to understand | 1 | 38 | Risk Ratio (M‐H, Fixed, 95% CI) | 1.18 [0.92, 1.51] |
| Outcome or subgroup title | No. of studies | No. of participants | Statistical method | Effect size |
| 1 Hypertensive disorders of pregnancy: pre‐eclampsia Show forest plot | 1 | 66 | Risk Ratio (M‐H, Fixed, 95% CI) | 1.0 [0.15, 6.68] |
| 2 Caesarean section Show forest plot | 1 | 66 | Risk Ratio (M‐H, Fixed, 95% CI) | 0.62 [0.29, 1.29] |
| 3 Large‐for‐gestational age Show forest plot | 1 | 66 | Risk Ratio (M‐H, Fixed, 95% CI) | 0.29 [0.11, 0.78] |
| 4 Perineal trauma Show forest plot | 1 | 66 | Risk Ratio (M‐H, Fixed, 95% CI) | 0.38 [0.11, 1.29] |
| 5 Gestational weight gain (kg) Show forest plot | 1 | 66 | Mean Difference (IV, Fixed, 95% CI) | ‐0.20 [‐2.81, 2.41] |
| 6 Adherence to the intervention: compliance with schedule (%) Show forest plot | 1 | 66 | Mean Difference (IV, Fixed, 95% CI) | ‐3.0 [‐3.99, ‐2.01] |
| 7 Use of additional pharmacotherapy Show forest plot | 1 | Mean Difference (IV, Fixed, 95% CI) | Subtotals only | |
| 7.1 Insulin dose (during the last 4 weeks of pregnancy, including regular and intermediate acting) (units/day) | 1 | 66 | Mean Difference (IV, Fixed, 95% CI) | 23.60 [11.17, 36.03] |
| 7.2 Insulin dose (during the last 4 weeks of pregnancy, including regular and intermediate acting) (units/kg) | 1 | 66 | Mean Difference (IV, Fixed, 95% CI) | 0.20 [0.12, 0.28] |
| 8 Glycaemic control: change in HbA1c (%) Show forest plot | 1 | 66 | Mean Difference (IV, Fixed, 95% CI) | ‐2.4 [‐3.33, ‐1.47] |
| 9 Glycaemic control: hospitalisation for glycaemic control Show forest plot | 1 | 66 | Risk Ratio (M‐H, Fixed, 95% CI) | 1.33 [0.32, 5.50] |
| 10 Glycaemic control: success in glycaemic control (%) Show forest plot | 1 | 66 | Mean Difference (IV, Fixed, 95% CI) | 2.0 [‐0.26, 4.26] |
| 11 Stillbirth Show forest plot | 1 | 66 | Risk Ratio (M‐H, Fixed, 95% CI) | 0.33 [0.01, 7.90] |
| 12 Gestational age at birth (weeks) Show forest plot | 1 | 66 | Mean Difference (IV, Fixed, 95% CI) | 0.30 [‐1.08, 1.68] |
| 13 Apgar score < 7 at 5 minutes Show forest plot | 1 | 66 | Risk Ratio (M‐H, Fixed, 95% CI) | 0.33 [0.04, 3.04] |
| 14 Macrosomia Show forest plot | 1 | 66 | Risk Ratio (M‐H, Fixed, 95% CI) | 0.25 [0.08, 0.81] |
| 15 Small‐for‐gestational age Show forest plot | 1 | 66 | Risk Ratio (M‐H, Fixed, 95% CI) | 3.0 [0.13, 71.07] |
| 16 Birthweight (g) Show forest plot | 1 | 66 | Mean Difference (IV, Fixed, 95% CI) | ‐379.0 [‐650.79, ‐107.21] |
| 17 Shoulder dystocia Show forest plot | 1 | 66 | Risk Ratio (M‐H, Fixed, 95% CI) | 0.17 [0.02, 1.31] |
| 18 Nerve palsies Show forest plot | 1 | 66 | Risk Ratio (M‐H, Fixed, 95% CI) | 0.5 [0.05, 5.25] |
| 19 Bone fractures Show forest plot | 1 | 66 | Risk Ratio (M‐H, Fixed, 95% CI) | 1.0 [0.07, 15.33] |
| 20 Neonatal hypoglycaemia Show forest plot | 1 | 66 | Risk Ratio (M‐H, Fixed, 95% CI) | 0.14 [0.02, 1.10] |
| 21 Hyperbilirubinaemia or jaundice Show forest plot | 1 | 66 | Risk Ratio (M‐H, Fixed, 95% CI) | 0.75 [0.18, 3.09] |