Riesgo de cáncer endometrial en pacientes tratadas con fármacos estimulantes del ovario para la subfertilidad
Appendices
Appendix 1. CENTRAL search strategy
#1 MeSH descriptor: [Ovulation Induction] explode all trees
#2 (ovar* near/5 (stimulat* or hyperstimulat* or hyper‐stimulat* or enhanced follicular recruitment)
#3 MeSH descriptor: [Fertility Agents] explode all trees
#4 ((fertil* or infertil* or subfertil*) near/5 (drug* or agent*)
#5 MeSH descriptor: [Reproductive Techniques, Assisted] explode all trees
#6 ((assist* near/5 reproduct*) or ART or (in vitro near/5 fertili*) or IVF or ICSI or intracytoplasmic sperminject ion)
#7 MeSH descriptor: [Selective Estrogen Receptor Modulators] explode all trees
#8 (selective next (estrogen or oestrogen) next receptor next modulator*)
#9 (SERM* or tamoxifen or clomiphene or clomifen*)
#10 MeSH descriptor: [Gonadotropins] explode all trees
#11 MeSH descriptor: [Gonadotropin‐Releasing Hormone] explode all trees
#12 (gonadotropin* or luteinizing hormone* or follicle stimulating hormone* or LH or FSH or hMG or hCG or GnRH*)
#13 #1 or #2 or #3 or #4 or #5 or #6 or #7 or #8 or #9 or #10 or #11 or #12
#14 MeSH descriptor: [Uterine Neoplasms] explode all trees
#15 MeSH descriptor: [Endometrial Hyperplasia] explode all trees
#16 (endometr* or uter* or womb) near/5 (cancer* or carcinoma* or malignan* or neoplas* or tumor* or tumour* or adenocarcinoma* or sarcoma* or leiomyosarcoma* or hyperplasia*)
#17 #14 or #15 or #16
#18 #13 and #17
Appendix 2. MEDLINE search strategy
1 exp Ovulation Induction/
2 (ovar* adj5 (stimulat* or hyperstimulat* or hyper‐stimulat* or enhanced follicular recruitment).mp.
3 exp Fertility Agents/
4 ((fertil* or infertil* or subfertil*) adj5 (drug* or agent*).mp.
5 exp Reproductive Techniques, Assisted/
6 ((assist* adj5 reproduct*) or ART or (in vitro adj5 fertili*) or IVF or ICSI or intracytoplasmic sperm injection).mp.
7 exp Selective Estrogen Receptor Modulators/
8 (selective adj (estrogen or oestrogen) adj receptor adj modulator*).mp.
9 (SERM* or tamoxifen or clomiphene or clomifen*).mp.
10 exp Gonadotropins/
11 exp Gonadotropin‐Releasing Hormone/
12 (gonadotropin* or luteinizing hormone* or follicle stimulating hormone* or LH or FSH or hMG or hCG or GnRH*).mp.
13 1 or 2 or 3 or 4 or 5 or 6 or 7 or 8 or 9 or 10 or 11 or 12
14 exp Uterine Neoplasms/
15 Endometrial Hyperplasia/
16 ((endometr* or uter* or womb) adj5 (cancer* or carcinoma* or malignan* or neoplas* or tumor* or tumour* or adenocarcinoma* or sarcoma* or leiomyosarcoma* or hyperplasia*).mp.
17 14 or 15 or 16
18 13 and 17
19 randomized controlled trial.pt.
20 controlled clinical trial.pt.
21 randomized.ab.
22 placebo.ab.
23 drug therapy.fs.
24 randomly.ab.
25 trial.ab.
26 groups.ab.
27 exp Cohort Studies/
28 (cohort* or propsective* or retrospective*).mp.
29 exp case‐control studies/
30 (case* and control*).mp.
31 19 or 20 or 21 or 22 or 23 or 24 or 25 or 26 or 27 or 28 or 29 or 30
32 18 and 31
33 exp animals/ not humans.sh.
34 32 not 33
key:
mp=title, abstract, original title, name of substance word, subject heading word, keyword heading word, protocol supplementary concept word, rare disease supplementary concept word, unique identifier
fs=floating subheading
ab=abstract
Appendix 3. Embase search strategy
1 ovulation induction/
2 (ovar* adj5 (stimulat* or hyperstimulat* or hyper‐stimulat* or enhanced follicular recruitment).mp.
3 exp fertility promoting agent/
4 ((fertil* or infertil* or subfertil*) adj5 (drug* or agent*).mp.
5 exp infertility therapy/
6 ((assist* adj5 reproduct*) or ART or (in vitro adj5 fertili*) or IVF or ICSI or intracytoplasmic sperm injection).mp.
7 selective estrogen receptor modulator/
8 (selective adj (estrogen or oestrogen) adj receptor adj modulator*).mp.
9 (SERM* or tamoxifen or clomiphene or clomifen*).mp.
10 gonadotropin/
11 gonadorelin/
12 (gonadotropin* or luteinizing hormone* or follicle stimulating hormone* or LH or FSH or hMG or hCG or GnRH*).mp.
13 1 or 2 or 3 or 4 or 5 or 6 or 7 or 8 or 9 or 10 or 11 or 12
14 exp uterus tumor/
15 endometrium hyperplasia/
16 ((endometr* or uter* or womb) adj5 (cancer* or carcinoma* or malignan* or neoplas* or tumor* or tumour* or adenocarcinoma* or sarcoma* or leiomyosarcoma* or hyperplasia*).mp.
17 14 or 15 or 16
18 13 and 17
19 controlled clinical trial/
20 crossover procedure/
21 double‐blind procedure/
22 randomized controlled trial/
23 single‐blind procedure/
24 random*.mp.
25 factorial*.mp.
26 (crossover* or cross over* or cross‐over*).mp.
27 placebo*.mp.
28 (double* adj blind*).mp.
29 (singl* adj blind*).mp.
30 assign*.mp.
31 allocat*.mp.
32 volunteer*.mp.
33 cohort analysis/
34 (cohort* or prospective* or retrospective*).mp.
35 exp case control study/
36 (case* and control*).mp.
37 19 or 20 or 21 or 22 or 23 or 24 or 25 or 26 or 27 or 28 or 29 or 30 or 31 or 32 or 33 or 34 or 35 or 36
38 13 and 18 and 37
39 (exp animal/ or nonhuman/ or exp animal experiment/) not human/
40 38 not 39
key:
mp=title, abstract, subject headings, heading word, drug trade name, original title, device manufacturer, drug manufacturer, device trade name, keyword
Appendix 4. Data extraction form
| General information |
| Title |
| Author |
| Year |
| Journal |
| Geographical setting (country, region) |
| Clinical setting |
| Study characteristics |
| Study period |
| Study design |
| Cohort size (for cohort studies only) |
| Cohort characteristics (for cohort studies only) |
| Number of incident cases in the cohort (for cohort studies only) |
| Number of cases (for case‐control studies only) |
| Number of controls (for case‐control studies only) |
| Reference group (general population or subfertile women) |
| Characteristics of participants |
| Inclusion and exclusion criteria |
| Mean age of total cohort (for cohort studies only) |
| Mean age of exposed women (for cohort studies only) |
| Mean age of cases (for case‐control studies only) |
| Mean age of controls (for case‐control studies only) |
| Race |
| Gynaecological and reproductive history |
| Gravidity |
| Parity |
| Definition of infertility |
| Type of infertility |
| Histology |
| Interventions |
| Type and agent of fertility treatment |
| Dosage of fertility treatment |
| Number of fertility treatment cycles |
| Age at time of first fertility treatment |
| Years since time since first fertility treatment |
| Results |
| Effect estimate type |
| Exclusion of first year of follow‐up |
| Subanalyses provided |
| Effect estimate (maximally adjusted) |
| Lower confidence limit |
| Upper confidence limit |
| Data for recalculation or de novo estimation of measures |
| Observed number of exposed cases (for cohort studies only) |
| Observed number of unexposed cases (for cohort studies only) |
| Expected number of exposed cases (for cohort studies only) |
| Expected number of unexposed cases (for cohort studies only) |
| Total number of person‐years among exposed cases (for cohort studies only) |
| Total number of person‐years among unexposed cases (for cohort studies only) |
| Number of exposed cases (for case‐control studies only) |
| Number of exposed controls (for case‐control studies only) |
| Assessment of risk of bias |
| Consecutive series of cases (for case‐control studies) |
| Population‐based or hospital‐based controls (for case‐control studies) |
| Controls derived from the same population as cases (for case‐control studies) |
| Non‐exposed women drawn from the same population as the exposed cohort (for cohort studies) |
| Matching factors |
| Adjusting factors |
| Ascertainment of exposure |
| Ascertainment of cancer |
| Mean follow‐up in total cohort (for cohort studies only) |
| Mean follow‐up in exposed women (for cohort studies only) |
| At least 80% of women in all groups included in the final analysis |


Risk of bias summary: review authors' judgements about each risk of bias item for each included study.

Risk of bias graph: review authors' judgements about each risk of bias item presented as percentages across all included studies.

Forest plot of comparison: 2 Exposure to any drug; comparison group: subfertile; any, outcome: 2.1 Endometrial cancer; subgroup by effect estimate.

Forest plot of comparison: 6 Exposure to any drug; comparison group: general population; any, outcome: 6.1 Endometrial cancer; subgroup by effect estimate.

Funnel plot of comparison: 6 Exposure to any drug; comparison group: general population; any, outcome: 6.1 Endometrial cancer; subgroup by effect estimate.

Comparison 1 Exposure to any drug; comparison group: subfertile; any, Outcome 1 Endometrial cancer; subgroup by effect estimate.

Comparison 2 Exposure to any drug; comparison group: subfertile; parous women, Outcome 1 Endometrial cancer; subgroup by effect estimate.

Comparison 3 Exposure to any drug; comparison group: subfertile; nulliparous women, Outcome 1 Endometrial cancer.

Comparison 4 Exposure to any drug; comparison group: subfertile; low number of cycles, Outcome 1 Endometrial cancer.

Comparison 5 Exposure to any drug; comparison group: subfertile; medium number of cycles, Outcome 1 Endometrial cancer.

Comparison 6 Exposure to any drug; comparison group: general population; any, Outcome 1 Endometrial cancer; subgroup by effect estimate.

Comparison 7 Exposure to any drug; comparison group: general population; low number of cycles, Outcome 1 Endometrial cancer.

Comparison 8 Exposure to any drug; comparison group: general population; medium number of cycles, Outcome 1 Endometrial cancer.

Comparison 9 Exposure to any drug; comparison group: general population; 0‐3 number of oocytes retrieved, Outcome 1 Endometrial cancer.

Comparison 10 Exposure to any drug; comparison group: general population; >10 number of oocytes retrieved, Outcome 1 Endometrial cancer.

Comparison 11 Exposure to clomiphene; comparison group: subfertile: any, Outcome 1 Endometrial cancer; subgroup by effect estimate.

Comparison 12 Exposure to clomiphene; comparison group: subfertile; low dosage, Outcome 1 Endometrial cancer.

Comparison 13 Exposure to clomiphene; comparison group: subfertile; medium dosage, Outcome 1 Endometrial cancer.

Comparison 14 Exposure to clomiphene; comparison group: subfertile; high dosage, Outcome 1 Endometrial cancer.

Comparison 15 Exposure to clomiphene; comparison group: subfertile; medium number of cycles, Outcome 1 Endometrial cancer; subgroup by effect estimate.

Comparison 16 Exposure to clomiphene; comparison group: subfertile; high number of cycles, Outcome 1 Endometrial cancer; subgroup by effect estimate.

Comparison 17 Exposure to clomiphene; comparison group: subfertile: parous women, Outcome 1 Endometrial cancer; subgroup by effect estimate.

Comparison 18 Exposure to clomiphene; comparison group: subfertile; nulliparous women, Outcome 1 Endometrial cancer.

Comparison 19 Exposure to clomiphene; comparison group: general population; any, Outcome 1 Endometrial cancer; subgroup by effect estimate.

Comparison 20 Exposure to clomiphene; comparison group: general population; low dosage, Outcome 1 Endometrial cancer.

Comparison 21 Exposure to clomiphene; comparison group: general population; high dosage, Outcome 1 Endometrial cancer.

Comparison 22 Exposure to clomiphene; comparison group: general population; low number of cycles, Outcome 1 Endometrial cancer.
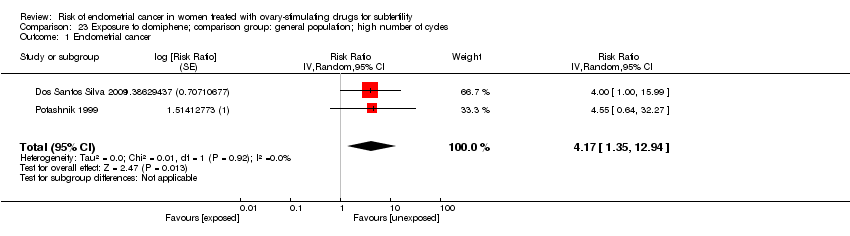
Comparison 23 Exposure to clomiphene; comparison group: general population; high number of cycles, Outcome 1 Endometrial cancer.

Comparison 24 Exposure to gonadotropins; comparison group: subfertile; any, Outcome 1 Endometrial cancer; subgroup by effect estimate.

Comparison 25 Exposure to gonadotropins; comparison group: subfertile; medium number of cycles, Outcome 1 Endometrial cancer.

Comparison 26 Exposure to gonadotropins; comparison group: subfertile; high number of cycles, Outcome 1 Endometrial cancer.

Comparison 27 Exposure to gonadotropins; comparison group: general population; any, Outcome 1 Endometrial cancer.

Comparison 28 Exposure to clomiphene + gonadotropins; comparison group: subfertile; any, Outcome 1 Endometrial cancer.

Comparison 29 Exposure to clomiphene + gonadotropins; comparison group: general population; any, Outcome 1 Endometrial cancer.

Comparison 30 Exposure to GnRH; comparison group: subfertile; any, Outcome 1 Endometrial cancer.

Comparison 31 Exposure to GnRH; comparison group: subfertile; parous women, Outcome 1 Endometrial cancer.

Comparison 32 Exposure to GnRH; comparison group: subfertile; nulliparous women, Outcome 1 Endometrial cancer.

Comparison 33 Exposure to any drug; comparison group: subfertile; any; follow‐up >10 years, Outcome 1 Endometrial cancer; subgroup by effect estimate.

Comparison 34 Exposure to any drug; comparison group: general population; any; follow‐up>10 years, Outcome 1 Endometrial cancer; subgroup by effect estimate.

Comparison 35 Exposure to clomiphene; comparison group: subfertile; any; follow‐up>10 years, Outcome 1 Endometrial cancer; subgroup by effect estimate.

Comparison 36 Exposure to clomiphene; comparison group: general population; any; follow‐up>10 years, Outcome 1 Endometrial cancer; subgroup by effect estimate.

Comparison 37 Exposure to gonadotropins; comparison group: subfertile; any; follow‐up>10 years, Outcome 1 Endometrial cancer; subgroup by effect estimate.

Comparison 38 Exposure to clomiphene + gonadotropins; comparison group: general population; any; follow‐up>10 years, Outcome 1 Endometrial cancer.
| Patient or population: Women treated with ovary‐stimulating drugs for subfertility | ||||||
| Outcomes | Anticipated absolute effects* (95% CI) | Relative effect | № of participants | Quality of the evidence | Comments | |
| Risk with no treatment | Risk with exposure to any ovary‐stimulating drug for subfertility | |||||
| Endometrial cancer | Study population | RR 0.96 | 156,774 | ⊕⊝⊝⊝ | ||
| 111 per 100,000 | 109 per 100,000 | |||||
| *The risk in the intervention group (and its 95% confidence interval) is based on the assumed risk in the comparison group and the relative effect of the intervention (and its 95% CI). | ||||||
| GRADE Working Group grades of evidence | ||||||
| 1 Initial level of evidence was 'low' because of the study design (observational studies). | ||||||
| Patient or population: Women treated with ovary‐stimulating drugs for subfertility | ||||||
| Outcomes | Anticipated absolute effects* (95% CI) | Relative effect | № of participants | Quality of the evidence | Comments | |
| Risk with no treatment | Risk with exposure to any ovary‐stimulating drug for subfertility | |||||
| Endometrial cancer | Study population | RR 1.75 | 1,762,829 | ⊕⊝⊝⊝ | ||
| 53 per 100,000 | 92 per 100,000 | |||||
| *The risk in the intervention group (and its 95% confidence interval) is based on the assumed risk in the comparison group and the relative effect of the intervention (and its 95% CI). | ||||||
| GRADE Working Group grades of evidence | ||||||
| 1 Initial level of evidence was 'low' because of the study design (observational studies). | ||||||
| Patient or population: Women treated with ovary‐stimulating drugs for subfertility | ||||||
| Outcomes | Anticipated absolute effects* (95% CI) | Relative effect | № of participants | Quality of the evidence | Comments | |
| Risk with no treatment | Risk with exposure to clomiphene citrate for subfertility | |||||
| Endometrial cancer | Study population | RR 1.32 | 92,849 | ⊕⊝⊝⊝ | ||
| 524 per 100,000 | 691 per 100,000 | |||||
| *The risk in the intervention group (and its 95% confidence interval) is based on the assumed risk in the comparison group and the relative effect of the intervention (and its 95% CI). | ||||||
| GRADE Working Group grades of evidence | ||||||
| 1 Initial level of evidence was 'low' because of the study design (observational studies). | ||||||
| Patient or population: Women treated with ovary‐stimulating drugs for subfertility | ||||||
| Outcomes | Anticipated absolute effects* (95% CI) | Relative effect | № of participants | Quality of the evidence | Comments | |
| Risk with no treatment | Risk with exposure to clomiphene citrate for subfertility | |||||
| Endometrial cancer | Study population | RR 1.87 | 19,614 | ⊕⊝⊝⊝ | ||
| 284 per 100,000 | 529 per 100,000 | |||||
| *The risk in the intervention group (and its 95% confidence interval) is based on the assumed risk in the comparison group and the relative effect of the intervention (and its 95% CI). | ||||||
| GRADE Working Group grades of evidence | ||||||
| 1 Initial level of evidence was 'low' because of the study design (observational studies). | ||||||
| undefined | ||||||
| Patient or population: Women treated with ovary‐stimulating drugs for subfertility | ||||||
| Outcomes | Anticipated absolute effects* (95% CI) | Relative effect | № of participants | Quality of the evidence | Comments | |
| Risk with no treatment | Risk with exposure to gonadotropins for subfertility | |||||
| Endometrial cancer | Study population | RR 1.55 | 17,769 | ⊕⊝⊝⊝ Very low 1,2,3 | ||
| 1291 per 100,000 | 1987 per 100,000 | |||||
| *The risk in the intervention group (and its 95% confidence interval) is based on the assumed risk in the comparison group and the relative effect of the intervention (and its 95% CI). | ||||||
| GRADE Working Group grades of evidence | ||||||
| 1 Initial level of evidence was 'low' because of the study design (observational studies). | ||||||
| Patient or population: Women treated with ovary‐stimulating drugs for subfertility | ||||||
| Outcomes | Anticipated absolute effects* (95% CI) | Relative effect | № of participants | Quality of the evidence | Comments | |
| Risk with no treatment | Risk with exposure to gonadotropins for subfertility | |||||
| Endometrial cancer | Study population | RR 2.12 | 1595 | ⊕⊝⊝⊝ | ||
| 542 per 100,000 | 1148 per 100,000 | |||||
| *The risk in the intervention group (and its 95% confidence interval) is based on the assumed risk in the comparison group and the relative effect of the intervention (and its 95% CI). | ||||||
| GRADE Working Group grades of evidence | ||||||
| 1 Initial level of evidence was 'low' because of the study design (observational studies). | ||||||
| Patient or population: Women treated with ovary‐stimulating drugs for subfertility | ||||||
| Outcomes | Anticipated absolute effects* (95% CI) | Relative effect | № of participants | Quality of the evidence | Comments | |
| Risk with no treatment | Risk with exposure to clomiphene citrate and gonadotropins for subfertility | |||||
| Endometrial cancer | Study population | RR 1.18 | 6345 | ⊕⊝⊝⊝ | ||
| 490 per 100,000 | 579 per 100,000 | |||||
| *The risk in the intervention group (and its 95% confidence interval) is based on the assumed risk in the comparison group and the relative effect of the intervention (and its 95% CI). | ||||||
| GRADE Working Group grades of evidence | ||||||
| 1 Initial level of evidence was 'low' because of the study design (observational studies). | ||||||
| Patient or population: Women treated with ovary‐stimulating drugs for subfertility | ||||||
| Outcomes | Anticipated absolute effects* (95% CI) | Relative effect | № of participants | Quality of the evidence | Comments | |
| Risk with no treatment | Risk with exposure to clomiphene citrate and gonadotropins for subfertility | |||||
| Endometrial cancer | Study population | RR 2.99 | 7789 | ⊕⊝⊝⊝ | ||
| 76 per 100,000 | 245 per 100,000 | |||||
| *The risk in the intervention group (and its 95% confidence interval) is based on the assumed risk in the comparison group and the relative effect of the intervention (and its 95% CI). | ||||||
| GRADE Working Group grades of evidence | ||||||
| 1 Initial level of evidence was 'low' because of the study design (observational studies). | ||||||
| Patient or population: Women treated with ovary‐stimulating drugs for subfertility | ||||||
| Outcomes | Anticipated absolute effects* (95% CI) | Relative effect | № of participants | Quality of the evidence | Comments | |
| Risk with no treatment | Risk with exposure to GnRH analogs for subfertility | |||||
| Endometrial cancer | Study population | RR 1.21 | 42,558 | ⊕⊝⊝⊝ | ||
| 458 per 100,000 | 554 per 100,000 | |||||
| *The risk in the intervention group (and its 95% confidence interval) is based on the assumed risk in the comparison group and the relative effect of the intervention (and its 95% CI). | ||||||
| GRADE Working Group grades of evidence | ||||||
| 1Initial level of evidence was 'low' because of the study design (observational studies). | ||||||
| Outcome or subgroup title | No. of studies | No. of participants | Statistical method | Effect size |
| 1 Endometrial cancer; subgroup by effect estimate Show forest plot | 6 | 156774 | Risk Ratio (Random, 95% CI) | 0.96 [0.67, 1.37] |
| 1.1 RR | 2 | 12548 | Risk Ratio (Random, 95% CI) | 1.31 [0.61, 2.81] |
| 1.2 IRR | 2 | 32131 | Risk Ratio (Random, 95% CI) | 0.86 [0.46, 1.63] |
| 1.3 HR | 2 | 112095 | Risk Ratio (Random, 95% CI) | 0.90 [0.52, 1.54] |
| Outcome or subgroup title | No. of studies | No. of participants | Statistical method | Effect size |
| 1 Endometrial cancer; subgroup by effect estimate Show forest plot | 2 | Risk Ratio (Random, 95% CI) | 1.00 [0.05, 18.85] | |
| Outcome or subgroup title | No. of studies | No. of participants | Statistical method | Effect size |
| 1 Endometrial cancer Show forest plot | 2 | Risk Ratio (Random, 95% CI) | 0.76 [0.35, 1.67] | |
| Outcome or subgroup title | No. of studies | No. of participants | Statistical method | Effect size |
| 1 Endometrial cancer Show forest plot | 2 | Risk Ratio (Random, 95% CI) | 0.82 [0.11, 6.17] | |
| Outcome or subgroup title | No. of studies | No. of participants | Statistical method | Effect size |
| 1 Endometrial cancer Show forest plot | 2 | Risk Ratio (Random, 95% CI) | 0.86 [0.46, 1.59] | |
| Outcome or subgroup title | No. of studies | No. of participants | Statistical method | Effect size |
| 1 Endometrial cancer; subgroup by effect estimate Show forest plot | 15 | 1.762829E6 | Risk Ratio (Random, 95% CI) | 1.75 [1.18, 2.61] |
| 1.1 SIR | 7 | 165366 | Risk Ratio (Random, 95% CI) | 1.61 [0.92, 2.82] |
| 1.2 OR | 4 | 22450 | Risk Ratio (Random, 95% CI) | 1.87 [0.96, 3.64] |
| 1.3 IRR | 1 | 647704 | Risk Ratio (Random, 95% CI) | 1.71 [0.11, 25.85] |
| 1.4 HR | 2 | 821278 | Risk Ratio (Random, 95% CI) | 1.51 [0.32, 7.19] |
| 1.5 RR | 1 | 106031 | Risk Ratio (Random, 95% CI) | 3.52 [1.67, 7.41] |
| Outcome or subgroup title | No. of studies | No. of participants | Statistical method | Effect size |
| 1 Endometrial cancer Show forest plot | 2 | Risk Ratio (Random, 95% CI) | 2.33 [0.93, 5.87] | |
| Outcome or subgroup title | No. of studies | No. of participants | Statistical method | Effect size |
| 1 Endometrial cancer Show forest plot | 2 | Risk Ratio (Random, 95% CI) | 3.39 [0.77, 14.87] | |
| Outcome or subgroup title | No. of studies | No. of participants | Statistical method | Effect size |
| 1 Endometrial cancer Show forest plot | 2 | Risk Ratio (Random, 95% CI) | 2.95 [0.47, 18.57] | |
| Outcome or subgroup title | No. of studies | No. of participants | Statistical method | Effect size |
| 1 Endometrial cancer Show forest plot | 2 | Risk Ratio (Random, 95% CI) | 6.93 [2.24, 21.50] | |
| Outcome or subgroup title | No. of studies | No. of participants | Statistical method | Effect size |
| 1 Endometrial cancer; subgroup by effect estimate Show forest plot | 5 | 92849 | Risk Ratio (Random, 95% CI) | 1.32 [1.01, 1.71] |
| 1.1 HR | 2 | 82318 | Risk Ratio (Random, 95% CI) | 1.32 [0.94, 1.86] |
| 1.2 RR | 2 | 8259 | Risk Ratio (Random, 95% CI) | 1.38 [0.88, 2.17] |
| 1.3 IRR | 1 | 2272 | Risk Ratio (Random, 95% CI) | 1.0 [0.38, 2.63] |
| Outcome or subgroup title | No. of studies | No. of participants | Statistical method | Effect size |
| 1 Endometrial cancer Show forest plot | 2 | Risk Ratio (Random, 95% CI) | 1.30 [0.78, 2.17] | |
| Outcome or subgroup title | No. of studies | No. of participants | Statistical method | Effect size |
| 1 Endometrial cancer Show forest plot | 2 | Risk Ratio (Random, 95% CI) | 1.27 [0.76, 2.13] | |
| Outcome or subgroup title | No. of studies | No. of participants | Statistical method | Effect size |
| 1 Endometrial cancer Show forest plot | 2 | Risk Ratio (Random, 95% CI) | 1.69 [1.07, 2.68] | |
| Outcome or subgroup title | No. of studies | No. of participants | Statistical method | Effect size |
| 1 Endometrial cancer; subgroup by effect estimate Show forest plot | 3 | Risk Ratio (Random, 95% CI) | 1.22 [0.87, 1.73] | |
| 1.1 RR | 2 | Risk Ratio (Random, 95% CI) | 1.08 [0.61, 1.92] | |
| 1.2 HR | 1 | Risk Ratio (Random, 95% CI) | 1.31 [0.85, 2.01] | |
| Outcome or subgroup title | No. of studies | No. of participants | Statistical method | Effect size |
| 1 Endometrial cancer; subgroup by effect estimate Show forest plot | 3 | Risk Ratio (Random, 95% CI) | 1.69 [1.16, 2.47] | |
| 1.1 RR | 2 | Risk Ratio (Random, 95% CI) | 1.99 [1.08, 3.64] | |
| 1.2 HR | 1 | Risk Ratio (Random, 95% CI) | 1.53 [0.95, 2.48] | |
| Outcome or subgroup title | No. of studies | No. of participants | Statistical method | Effect size |
| 1 Endometrial cancer; subgroup by effect estimate Show forest plot | 2 | Risk Ratio (Random, 95% CI) | 1.68 [0.82, 3.43] | |
| Outcome or subgroup title | No. of studies | No. of participants | Statistical method | Effect size |
| 1 Endometrial cancer Show forest plot | 2 | Risk Ratio (Random, 95% CI) | 1.01 [0.51, 2.01] | |
| Outcome or subgroup title | No. of studies | No. of participants | Statistical method | Effect size |
| 1 Endometrial cancer; subgroup by effect estimate Show forest plot | 4 | 19614 | Risk Ratio (Random, 95% CI) | 1.87 [1.00, 3.48] |
| 1.1 SIR | 2 | 4106 | Risk Ratio (Random, 95% CI) | 1.61 [0.79, 3.29] |
| 1.2 OR | 1 | 683 | Risk Ratio (Random, 95% CI) | 1.00 [0.24, 4.19] |
| 1.3 HR | 1 | 14825 | Risk Ratio (Random, 95% CI) | 4.56 [1.56, 13.33] |
| Outcome or subgroup title | No. of studies | No. of participants | Statistical method | Effect size |
| 1 Endometrial cancer Show forest plot | 2 | Risk Ratio (Random, 95% CI) | 1.52 [0.48, 4.78] | |
| Outcome or subgroup title | No. of studies | No. of participants | Statistical method | Effect size |
| 1 Endometrial cancer Show forest plot | 2 | Risk Ratio (Random, 95% CI) | 5.48 [2.28, 13.17] | |
| Outcome or subgroup title | No. of studies | No. of participants | Statistical method | Effect size |
| 1 Endometrial cancer Show forest plot | 2 | Risk Ratio (Random, 95% CI) | 1.82 [0.56, 5.90] | |
| Outcome or subgroup title | No. of studies | No. of participants | Statistical method | Effect size |
| 1 Endometrial cancer Show forest plot | 2 | Risk Ratio (Random, 95% CI) | 4.17 [1.35, 12.94] | |
| Outcome or subgroup title | No. of studies | No. of participants | Statistical method | Effect size |
| 1 Endometrial cancer; subgroup by effect estimate Show forest plot | 4 | 17769 | Risk Ratio (Random, 95% CI) | 1.55 [1.03, 2.34] |
| 1.1 RR | 2 | 6390 | Risk Ratio (Random, 95% CI) | 2.15 [1.11, 4.17] |
| 1.2 IRR | 1 | 1547 | Risk Ratio (Random, 95% CI) | 1.0 [0.28, 3.51] |
| 1.3 HR | 1 | 9832 | Risk Ratio (Random, 95% CI) | 1.34 [0.76, 2.37] |
| Outcome or subgroup title | No. of studies | No. of participants | Statistical method | Effect size |
| 1 Endometrial cancer Show forest plot | 2 | Risk Ratio (Random, 95% CI) | 1.61 [1.00, 2.60] | |
| Outcome or subgroup title | No. of studies | No. of participants | Statistical method | Effect size |
| 1 Endometrial cancer Show forest plot | 2 | Risk Ratio (Random, 95% CI) | 1.90 [0.80, 4.52] | |
| Outcome or subgroup title | No. of studies | No. of participants | Statistical method | Effect size |
| 1 Endometrial cancer Show forest plot | 2 | 1595 | Risk Ratio (Random, 95% CI) | 2.12 [0.79, 5.64] |
| Outcome or subgroup title | No. of studies | No. of participants | Statistical method | Effect size |
| 1 Endometrial cancer Show forest plot | 2 | 6345 | Risk Ratio (Random, 95% CI) | 1.18 [0.57, 2.44] |
| Outcome or subgroup title | No. of studies | No. of participants | Statistical method | Effect size |
| 1 Endometrial cancer Show forest plot | 3 | 7789 | Risk Ratio (Random, 95% CI) | 2.99 [1.53, 5.86] |
| Outcome or subgroup title | No. of studies | No. of participants | Statistical method | Effect size |
| 1 Endometrial cancer Show forest plot | 2 | 42558 | Risk Ratio (Random, 95% CI) | 1.21 [0.65, 2.27] |
| Outcome or subgroup title | No. of studies | No. of participants | Statistical method | Effect size |
| 1 Endometrial cancer Show forest plot | 2 | Risk Ratio (Random, 95% CI) | 2.88 [0.95, 8.71] | |
| Outcome or subgroup title | No. of studies | No. of participants | Statistical method | Effect size |
| 1 Endometrial cancer Show forest plot | 2 | Risk Ratio (Random, 95% CI) | 0.75 [0.34, 1.63] | |
| Outcome or subgroup title | No. of studies | No. of participants | Statistical method | Effect size |
| 1 Endometrial cancer; subgroup by effect estimate Show forest plot | 4 | 39671 | Risk Ratio (Random, 95% CI) | 0.95 [0.63, 1.44] |
| 1.1 RR | 2 | 12548 | Risk Ratio (Random, 95% CI) | 1.31 [0.61, 2.81] |
| 1.2 IRR | 1 | 2431 | Risk Ratio (Random, 95% CI) | 1.0 [0.49, 2.06] |
| 1.3 HR | 1 | 24692 | Risk Ratio (Random, 95% CI) | 0.71 [0.36, 1.39] |
| Outcome or subgroup title | No. of studies | No. of participants | Statistical method | Effect size |
| 1 Endometrial cancer; subgroup by effect estimate Show forest plot | 5 | 129209 | Risk Ratio (Random, 95% CI) | 2.52 [1.80, 3.53] |
| 1.1 SIR | 3 | 8148 | Risk Ratio (Random, 95% CI) | 2.17 [1.44, 3.26] |
| 1.2 HR | 1 | 15030 | Risk Ratio (Random, 95% CI) | 3.39 [1.28, 8.97] |
| 1.3 RR | 1 | 106031 | Risk Ratio (Random, 95% CI) | 3.52 [1.67, 7.41] |
| Outcome or subgroup title | No. of studies | No. of participants | Statistical method | Effect size |
| 1 Endometrial cancer; subgroup by effect estimate Show forest plot | 4 | 20363 | Risk Ratio (Random, 95% CI) | 1.35 [1.03, 1.78] |
| 1.1 HR | 1 | 9832 | Risk Ratio (Random, 95% CI) | 1.39 [0.96, 2.01] |
| 1.2 RR | 2 | 8259 | Risk Ratio (Random, 95% CI) | 1.38 [0.88, 2.17] |
| 1.3 IRR | 1 | 2272 | Risk Ratio (Random, 95% CI) | 1.0 [0.38, 2.63] |
| Outcome or subgroup title | No. of studies | No. of participants | Statistical method | Effect size |
| 1 Endometrial cancer; subgroup by effect estimate Show forest plot | 3 | 18931 | Risk Ratio (Random, 95% CI) | 2.08 [1.01, 4.28] |
| 1.1 SIR | 2 | 4106 | Risk Ratio (Random, 95% CI) | 1.61 [0.79, 3.29] |
| 1.2 HR | 1 | 14825 | Risk Ratio (Random, 95% CI) | 4.56 [1.56, 13.33] |
| Outcome or subgroup title | No. of studies | No. of participants | Statistical method | Effect size |
| 1 Endometrial cancer; subgroup by effect estimate Show forest plot | 3 | 7937 | Risk Ratio (Random, 95% CI) | 1.82 [1.01, 3.27] |
| 1.1 RR | 2 | 6390 | Risk Ratio (Random, 95% CI) | 2.15 [1.11, 4.17] |
| 1.2 IRR | 1 | 1547 | Risk Ratio (Random, 95% CI) | 1.0 [0.28, 3.51] |
| Outcome or subgroup title | No. of studies | No. of participants | Statistical method | Effect size |
| 1 Endometrial cancer Show forest plot | 2 | 1246 | Risk Ratio (Random, 95% CI) | 3.58 [1.82, 7.06] |