Effect of testing for cancer on cancer‐ and venous thromboembolism (VTE)‐related mortality and morbidity in people with unprovoked VTE
References
References to studies included in this review
Additional references
Jump to:
References to other published versions of this review
Jump to:
Characteristics of studies
Characteristics of included studies [ordered by study ID]
| Methods | Study design: multicentre, open‐label, randomised controlled trial. Source of funding: Heart and Stroke Foundation of Canada. | |
| Participants | Country: Canada. Setting: hospital. Number of centres: 9. Number of participants: 854. Age (mean (SD)): screening + CT group: 53.4 (14.2) years; screening only group: 53.7 (13.8). Sex: screening + CT group: 299 M/124 F; screening only group: 277 M/154 F. Inclusion criteria: people with new diagnosis of first unprovoked VTE (proximal lower‐limb deep vein thrombosis, pulmonary embolism, or both). Unprovoked VTE defined as VTE in absence of known overt active cancer, current pregnancy, thrombophilia (hereditary or acquired), previous unprovoked VTE or a temporary predisposing factor in the previous 3 months, including paralysis, paresis or plaster immobilisation of the legs, confinement to bed for ≥ 3 days or major surgery. Exclusion criteria: aged < 18 years, refusal or inability to provide informed consent, allergy to contrast media, creatinine clearance < 60 mL per minute, claustrophobia or agoraphobia, weight > 130 kg, ulcerative colitis or glaucoma. | |
| Interventions | Screening procedure: complete history and physical examination, measurement of complete blood counts and serum electrolyte and creatinine levels, liver‐function testing and chest radiography. Sex‐specific screening conducted if it had not been performed in previous year. Breast examination, mammography, or both performed in women > 50 years of age and Pap testing and a pelvic examination performed in women 18‐70 years of age who had never been sexually active. Prostate examination, PSA test, or both performed in men aged > 40 years. Also comprehensive CT of abdomen and pelvis (virtual colonoscopy and gastroscopy, biphasic enhanced CT of liver, parenchymal pancreatography, and uniphasic enhanced CT of distended bladder). Control: complete history and physical examination, measurement of complete blood counts and serum electrolyte and creatinine levels, liver‐function testing and chest radiography. Sex‐specific screening conducted if it had not been performed in previous year. Breast examination, mammography, or both performed in women > 50 years of age and Pap testing and a pelvic examination performed in women 18‐70 years of age who had ever been sexually active. Prostate examination, PSA test, or both performed in men aged > 40 years. Duration: 1 year follow‐up. | |
| Outcomes | Primary outcomes: newly diagnosed cancer during the follow‐up period in people who had a negative screening result for occult cancer. Secondary outcomes: total number of occult cancers diagnosed and total number of early cancers (T1‐2, N0, M0 according to the World Health Organization TNM classification system) diagnosed by occult‐cancer screening and during subsequent 1‐year follow‐up, 1‐year cancer‐related mortality, 1‐year overall mortality, time to cancer diagnosis and incidence of recurrent VTE. | |
| Notes | ||
| Risk of bias | ||
| Bias | Authors' judgement | Support for judgement |
| Random sequence generation (selection bias) | Low risk | Quote: "The trial statistician generated the randomisation list using random‐number tables." |
| Allocation concealment (selection bias) | Low risk | Quote: "A central Web‐based randomisation system ensured assignment concealment." |
| Blinding of participants and personnel (performance bias) | Low risk | Comment: blinding of participants and study personnel not done but review authors judged that outcome and outcome measurement not likely to be influenced by lack of blinding. |
| Blinding of outcome assessment (detection bias) | Low risk | Quote: "A central adjudication committee whose members were unaware of the study‐group assignments reviewed all suspected outcome events." Comment: outcome assessors blinded to study allocation. |
| Incomplete outcome data (attrition bias) | Low risk | Comment: all losses to follow‐up accounted for. |
| Selective reporting (reporting bias) | Low risk | Comment: primary and secondary outcomes clearly prespecified and reported. |
| Other bias | Low risk | Comment: study appeared free from other sources of bias. |
| Methods | Study design: randomised multicentre clinical trial. Source of funding: Associazone Italiana per le Ricerca sul Cancro. | |
| Participants | Country: Italy. Setting: hospital. Number of centres: not stated. Number of participants: 201. Age (mean (SD)): screening group: 66.2 (13.1) years; no screening group: 66.6 (13.1) years. Sex: screening group: 54 M/45 F; no screening group: 46 M/56 F. Inclusion criteria: apparently cancer‐free people with a documented unprovoked first episode of symptomatic deep vein thrombosis of the lower extremity or pulmonary embolism. Exclusion criteria: recognised risk factor for VTE (malignant disease, trauma of the leg, surgical procedures or immobilisation within 6 months, confirmed spontaneous VTE in a first‐degree relative, deficiency of antithrombin, protein C or S, presence of circulating lupus anticoagulant, oestrogen use, pregnancy or childbirth), previously documented VTE, malignant disease identified at routine physical examination, history taking, laboratory assessment or chest X‐ray at referral, unable to attend follow‐up due to geographic inaccessibility and aged < 25 years. | |
| Interventions | Screening procedure: combination of ultrasound and CT scan of abdomen and pelvis, gastroscopy or double‐contrast barium swallow, flexible sigmoidoscopy or rectoscopy followed by barium enema or colonoscopy, haemoccult, sputum cytology and tumour markers including carcinoembryonic antigen, α‐fetoprotein and CA125. In addition, women had gynaecological examination, Pap smear and mammography. Men had a transabdominal ultrasound of prostate and total PSA test. Control: tests at physician's discretion. Duration: 2‐year follow‐up. At these visits, special attention paid to recent medical history. To avoid diagnostic suspicion bias, medical history concerning general health, hospital admission, and occurrence of signs and symptoms of cancer obtained on a standardised form by a physician unaware of allocation of participant. If malignant disease had become apparent during follow‐up, information from the attending specialist sought after consent of participant. | |
| Outcomes | Primary outcomes: cancer‐related mortality defined as death due to a malignant disease itself, or death due to complications of diagnostic or surgical procedures performed to diagnose or treat cancer. Secondary outcomes: cluster of cancer‐related mortality and presence of objectively documented residual malignancy or recurrent malignancy at 24 months and sensitivity of the diagnostic work‐up for occult malignancy. | |
| Notes | ||
| Risk of bias | ||
| Bias | Authors' judgement | Support for judgement |
| Random sequence generation (selection bias) | Low risk | Quote: "According to the Zelen design, patients randomised to..." |
| Allocation concealment (selection bias) | Low risk | Quote: "Randomisation was performed centrally." |
| Blinding of participants and personnel (performance bias) | Low risk | Quote: "Patients randomised to extensive screening were informed about the study. As patients allocated to the control group were not informed about the study, patients and their physicians were not discouraged to search for malignant disease." Comment: blinding of participants in extensive screening group and study personnel not done but review authors judged that outcome and outcome measurement not likely to be influenced by lack of blinding. |
| Blinding of outcome assessment (detection bias) | Low risk | Quote: "To avoid diagnostic suspicion bias, the medical history concerning general health, hospital admission and occurrence of signs and symptoms of cancer were obtained on a standardised form by a physician unaware of allocation of the patient." Comment: outcome assessors blinded to study allocation. |
| Incomplete outcome data (attrition bias) | Low risk | Comment: all participants completed the 2‐year follow‐up. No missing data. |
| Selective reporting (reporting bias) | Low risk | Comment: primary and secondary outcomes clearly prespecified and reported. |
| Other bias | High risk | Comment: study terminated early after inclusion of only 201 participants after 5 years for several reasons. First, only 5 of the more than 40 potential participating centres could contribute participants to the study. Second, some medical ethics committees rejected the protocol because of the absence of screening for occult cancer in the control group, other centres could not start because the proposed extensive screening was judged to be unethical. Finally, identification of cancer at an apparent early stage in the extensive screening group led to an increasing tendency among physicians in participating hospitals to initiate screening for cancer in control participants. |
| Methods | Study design: multicentre, randomised controlled trial. | |
| Participants | Country: Italy. Setting: hospital. Number of centres: 5. Number of participants: 195 Age (mean (SD)): extensive screening group: 69.3 (14) years; control group: 69.0 (14) years. Sex: extensive screening group: 54 M/44 F; control group: 47 M/50 F. Inclusion criteria: people with an objectively diagnosed, first episode of unprovoked VTE, in whom a routine initial screening for cancer was normal. Exclusion criteria: history of previous documented episodes of VTE, aged < 18 years, pregnant, unable to attend follow‐up visits because of geographic inaccessibility, had known allergy to contrast medium or had a CT scan of torso for any reasons within 6 months from presentation. | |
| Interventions | Screening procedure: extensive screening with mandatory CT scan of thorax, abdomen and pelvis together with haemoccult test or any test at physician's discretion according to good clinical practice. Control: personalised strategy consisting of additional testing based on physicians' judgements and participants' preferences, including a 'no‐further testing' option. Duration: 3, 6, 12 and 24 months' follow‐up in which participants were asked about general health, history of recent hospital admissions and occurrence of signs and symptoms suggestive of cancer. Cancer outcomes that presented during follow‐up were detected based on clinical features that would prompt diagnostic imaging or cancers that were occasionally detected by screening that was independent of the diagnosis of VTE. | |
| Outcomes | Primary outcomes: cancer‐related mortality (defined as death due to malignancy or death due to the complications of the diagnostic or surgical procedures performed to diagnose or treat cancer) and incidence of newly discovered cancer. Secondary outcomes: cancer stage, using the TNM classification, at which tumours were diagnosed in the 2 study groups; and incidence of cancer‐related mortality in the 2 randomisation groups. | |
| Notes | ||
| Risk of bias | ||
| Bias | Authors' judgement | Support for judgement |
| Random sequence generation (selection bias) | Low risk | Quote: "Concealed allocation was ensured by employing serially numbered, opaque, sealed envelopes. Each participating centre was initially assigned a lot of 20 envelopes, while subsequent allocations were in lots of 10, as needed." |
| Allocation concealment (selection bias) | Low risk | Quote: "Concealed allocation was ensured by employing serially numbered, opaque, sealed envelopes. Each participating centre was initially assigned a lot of 20 envelopes, while subsequent allocations were in lots of 10, as needed." |
| Blinding of participants and personnel (performance bias) | Low risk | Comment: blinding of participants in extensive screening group and study personnel not done but review authors judged that outcome and outcome measurement were not likely to be influenced by lack of blinding. |
| Blinding of outcome assessment (detection bias) | Low risk | Comment: investigators performing the follow‐up visits blinded to participants' randomisation groups'. |
| Incomplete outcome data (attrition bias) | Low risk | Comment: all losses to follow‐up accounted for. |
| Selective reporting (reporting bias) | Low risk | Comment: primary and secondary outcomes clearly prespecified and reported. |
| Other bias | High risk | Comment: interim analysis scheduled after inclusion of approximately half of planned sample size. Based on results of this analysis, study promoters decided to stop study enrolment because of low recruitment rate and of failure to show an appreciable advantage of CT‐based strategy over control strategy for detection of occult cancers. |
| Methods | Study design: open‐label, multicentre, randomised study. Source of funding: Programme Hospitalier de Recherche Clinique (French Department of Health). | |
| Participants | Country: France. Setting: hospital. Number of centres: 4. Number of participants: 394. Age (mean (range)): screening group: 64 (48‐77) years; limited screening group: 62 (50‐75) years. Sex: screening group: 105 M/92 F; limited screening group: 102 M/95 F. Inclusion criteria: aged ≥ 18 years, diagnosed with unprovoked VTE. VTE defined as objectively confirmed proximal deep vein thrombosis or pulmonary embolism. Unprovoked VTE defined as VTE not provoked by major inherited or acquired risk factor including surgery, trauma or fracture during 3 months before VTE event, known antiphospholipid antibody syndrome or known deficiency in antithrombin, protein C or protein S. Exclusion criteria: ongoing pregnancy, active malignant disease (defined as known malignant disease which was active or treated during previous 5 years), not insured under French National Social Security programme, hypersensitivity to 18F‐FDG or any of the excipients according to summary of product characteristics in France, or unable or unwilling to give consent. | |
| Interventions | Screening procedure: screening strategy consisting of limited strategy + 18F‐FDG PET/CT scan of chest, abdomen and pelvis. Control: limited screening strategy (physical examination, usual laboratory tests and basic radiographs). Duration: 2 years. | |
| Outcomes | Primary outcomes: proportion of people with a cancer diagnosis in each group after the initial screening assessment. Secondary outcomes: subsequent cancer diagnosis in people with negative initial screening, proportion of early‐stage versus advanced‐stage tumours at initial screening and during follow‐up, overall mortality and cancer‐related mortality during follow‐up. | |
| Notes | ||
| Risk of bias | ||
| Bias | Authors' judgement | Support for judgement |
| Random sequence generation (selection bias) | Low risk | Quote: "The randomisation list was created centrally using computer‐generated block sizes of six, stratified by centre, and concealed from investigators. We used a secure, dedicated, central web‐based randomisation system (Clinsight)." |
| Allocation concealment (selection bias) | Low risk | Quote: "The randomisation list was created centrally using computer‐generated block sizes of six, stratified by centre, and concealed from investigators. We used a secure, dedicated, central web‐based randomisation system (Clinsight). A unique study participant number and study group allocation was given after patients’ basic information and eligibility criteria were entered by the study personnel." |
| Blinding of participants and personnel (performance bias) | Low risk | Quote: "Participants and physicians giving the intervention, assessing outcomes, and analysing the data were not masked to study group assignment." Comment: blinding of participants and study personnel not done but review authors judged that outcome and outcome measurement not likely to be influenced by lack of blinding. |
| Blinding of outcome assessment (detection bias) | High risk | Quote: "Physicians giving the intervention, assessing outcomes, and analysing the data were not masked to study group assignment." Comment: outcome assessors not blinded to outcome assessment. |
| Incomplete outcome data (attrition bias) | Low risk | Comment: all losses to follow‐up accounted for. |
| Selective reporting (reporting bias) | Low risk | Comment: primary and secondary outcomes clearly prespecified and reported. |
| Other bias | Low risk | Comment: study appeared free from other sources of bias. |
CT: computed tomography; F: female; FDG: fluorodeoxyglucose; M: male; Pap: Papanicolaou; PET: positron emission tomography; PSA: prostate‐specific antigen; SD: standard deviation; TNM: tumour‐node‐metastasis; VTE: venous thromboembolism.
Data and analyses
| Outcome or subgroup title | No. of studies | No. of participants | Statistical method | Effect size |
| 1 Cancer‐related mortality Show forest plot | 2 | 396 | Odds Ratio (M‐H, Random, 95% CI) | 0.49 [0.15, 1.67] |
| Analysis 1.1  Comparison 1 Extensive tests versus tests at the physician's discretion, Outcome 1 Cancer‐related mortality. | ||||
| 2 Characteristics of diagnosed cancer: type of cancer Show forest plot | 1 | Odds Ratio (M‐H, Random, 95% CI) | Subtotals only | |
| Analysis 1.2  Comparison 1 Extensive tests versus tests at the physician's discretion, Outcome 2 Characteristics of diagnosed cancer: type of cancer. | ||||
| 2.1 Lung | 1 | 201 | Odds Ratio (M‐H, Random, 95% CI) | 2.08 [0.19, 23.34] |
| 2.2 Bladder | 1 | 201 | Odds Ratio (M‐H, Random, 95% CI) | 2.08 [0.19, 23.34] |
| 2.3 Stomach | 1 | 201 | Odds Ratio (M‐H, Random, 95% CI) | 1.03 [0.06, 16.71] |
| 2.4 Kidney | 1 | 201 | Odds Ratio (M‐H, Random, 95% CI) | 3.12 [0.13, 77.55] |
| 2.5 Adrenal gland | 1 | 201 | Odds Ratio (M‐H, Random, 95% CI) | 3.12 [0.13, 77.55] |
| 2.6 Liver | 1 | 201 | Odds Ratio (M‐H, Random, 95% CI) | 3.12 [0.13, 77.55] |
| 2.7 Uterus | 1 | 201 | Odds Ratio (M‐H, Random, 95% CI) | 3.12 [0.13, 77.55] |
| 2.8 Breast | 1 | 201 | Odds Ratio (M‐H, Random, 95% CI) | 1.03 [0.06, 16.71] |
| 2.9 Ovary | 1 | 201 | Odds Ratio (M‐H, Random, 95% CI) | 3.12 [0.13, 77.55] |
| 2.10 Colon | 1 | 201 | Odds Ratio (M‐H, Random, 95% CI) | 0.51 [0.05, 5.72] |
| 2.11 Prostate | 1 | 201 | Odds Ratio (M‐H, Random, 95% CI) | 0.51 [0.05, 5.72] |
| 2.12 Pancreas | 1 | 201 | Odds Ratio (M‐H, Random, 95% CI) | 0.20 [0.01, 4.26] |
| 3 Characteristics of diagnosed cancer: stage of cancer Show forest plot | 1 | Odds Ratio (M‐H, Random, 95% CI) | Subtotals only | |
| Analysis 1.3 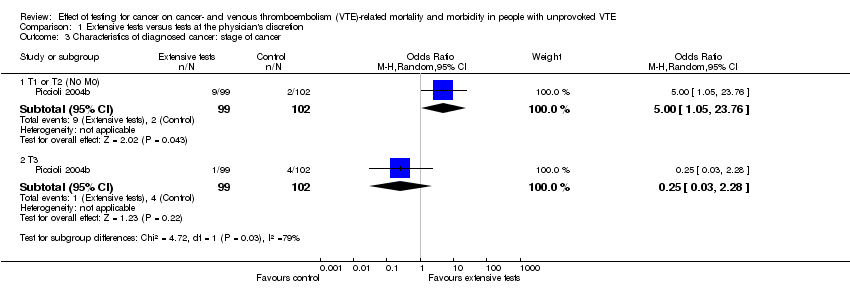 Comparison 1 Extensive tests versus tests at the physician's discretion, Outcome 3 Characteristics of diagnosed cancer: stage of cancer. | ||||
| 3.1 T1 or T2 (N0 M0) | 1 | 201 | Odds Ratio (M‐H, Random, 95% CI) | 5.00 [1.05, 23.76] |
| 3.2 T3 | 1 | 201 | Odds Ratio (M‐H, Random, 95% CI) | 0.25 [0.03, 2.28] |
| 4 Frequency of underlying cancer diagnosis Show forest plot | 2 | 396 | Odds Ratio (M‐H, Random, 95% CI) | 1.32 [0.59, 2.93] |
| Analysis 1.4 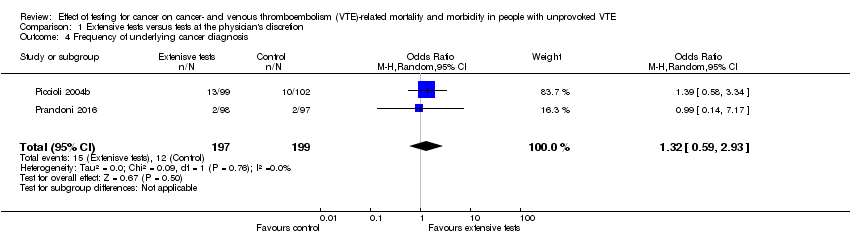 Comparison 1 Extensive tests versus tests at the physician's discretion, Outcome 4 Frequency of underlying cancer diagnosis. | ||||
| Outcome or subgroup title | No. of studies | No. of participants | Statistical method | Effect size |
| 1 All‐cause mortality Show forest plot | 2 | 1248 | Odds Ratio (M‐H, Random, 95% CI) | 1.22 [0.49, 3.04] |
| Analysis 2.1  Comparison 2 Standard testing plus PET/CT scanning versus standard testing alone, Outcome 1 All‐cause mortality. | ||||
| 2 Cancer‐related mortality Show forest plot | 2 | 1248 | Odds Ratio (M‐H, Random, 95% CI) | 0.55 [0.20, 1.52] |
| Analysis 2.2 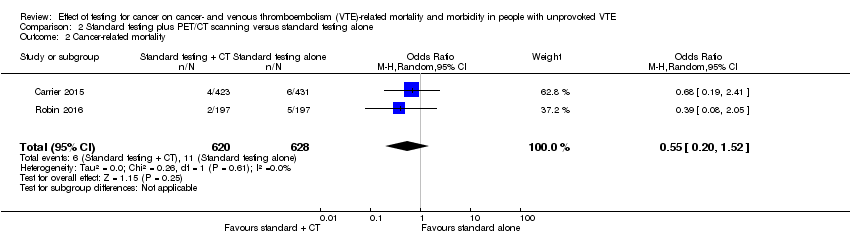 Comparison 2 Standard testing plus PET/CT scanning versus standard testing alone, Outcome 2 Cancer‐related mortality. | ||||
| 3 Venous thromboembolism‐related morbidity Show forest plot | 1 | 854 | Odds Ratio (M‐H, Random, 95% CI) | 1.02 [0.48, 2.17] |
| Analysis 2.3 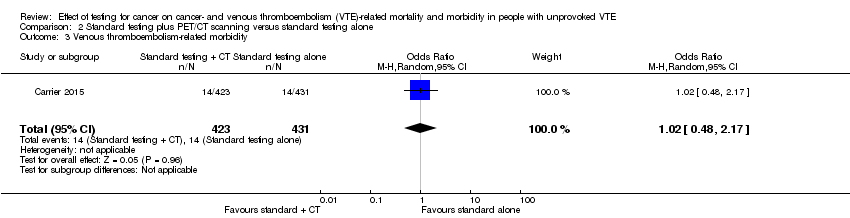 Comparison 2 Standard testing plus PET/CT scanning versus standard testing alone, Outcome 3 Venous thromboembolism‐related morbidity. | ||||
| 4 Characteristics of diagnosed cancer: type of cancer Show forest plot | 2 | Odds Ratio (M‐H, Random, 95% CI) | Subtotals only | |
| Analysis 2.4 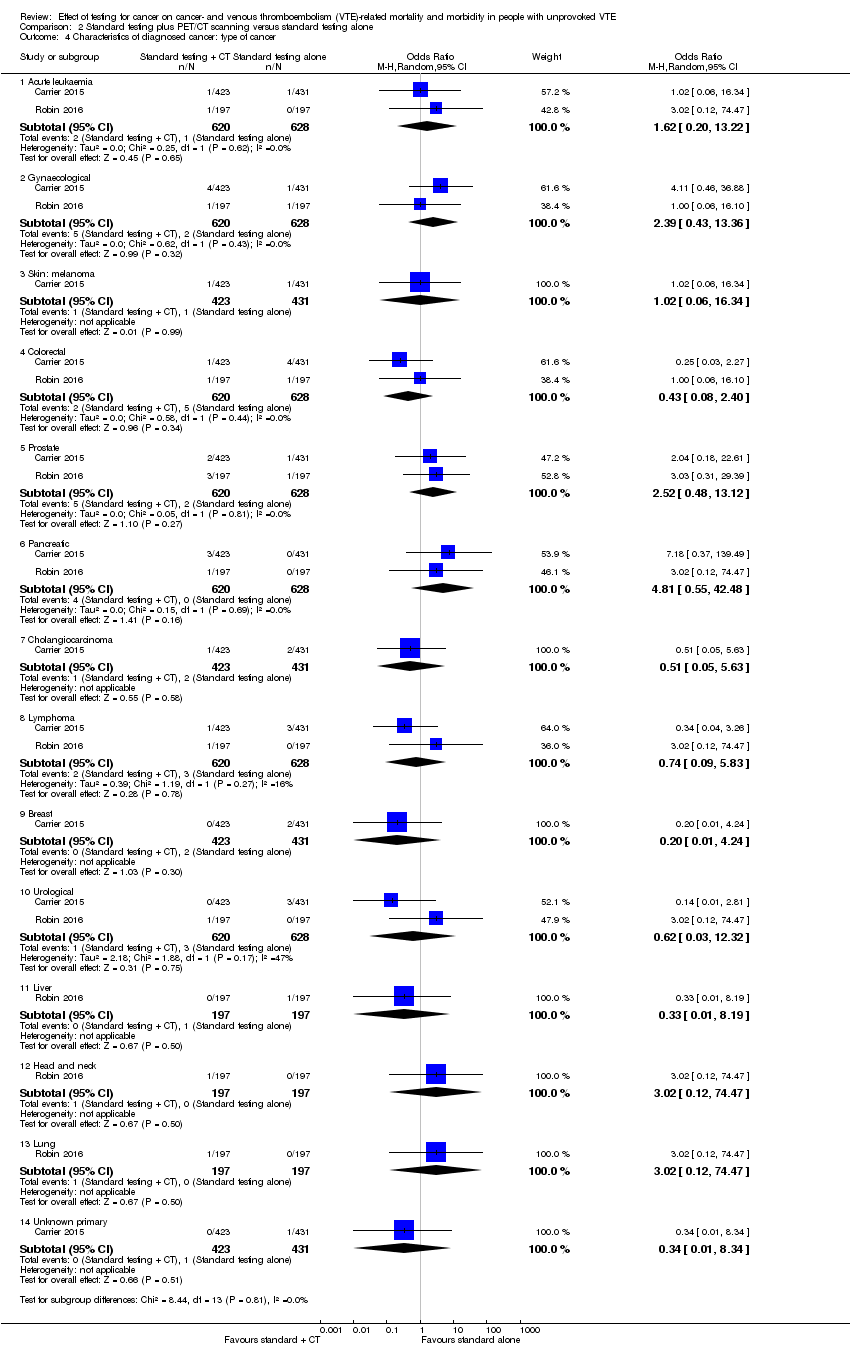 Comparison 2 Standard testing plus PET/CT scanning versus standard testing alone, Outcome 4 Characteristics of diagnosed cancer: type of cancer. | ||||
| 4.1 Acute leukaemia | 2 | 1248 | Odds Ratio (M‐H, Random, 95% CI) | 1.62 [0.20, 13.22] |
| 4.2 Gynaecological | 2 | 1248 | Odds Ratio (M‐H, Random, 95% CI) | 2.39 [0.43, 13.36] |
| 4.3 Skin: melanoma | 1 | 854 | Odds Ratio (M‐H, Random, 95% CI) | 1.02 [0.06, 16.34] |
| 4.4 Colorectal | 2 | 1248 | Odds Ratio (M‐H, Random, 95% CI) | 0.43 [0.08, 2.40] |
| 4.5 Prostate | 2 | 1248 | Odds Ratio (M‐H, Random, 95% CI) | 2.52 [0.48, 13.12] |
| 4.6 Pancreatic | 2 | 1248 | Odds Ratio (M‐H, Random, 95% CI) | 4.81 [0.55, 42.48] |
| 4.7 Cholangiocarcinoma | 1 | 854 | Odds Ratio (M‐H, Random, 95% CI) | 0.51 [0.05, 5.63] |
| 4.8 Lymphoma | 2 | 1248 | Odds Ratio (M‐H, Random, 95% CI) | 0.74 [0.09, 5.83] |
| 4.9 Breast | 1 | 854 | Odds Ratio (M‐H, Random, 95% CI) | 0.20 [0.01, 4.24] |
| 4.10 Urological | 2 | 1248 | Odds Ratio (M‐H, Random, 95% CI) | 0.62 [0.03, 12.32] |
| 4.11 Liver | 1 | 394 | Odds Ratio (M‐H, Random, 95% CI) | 0.33 [0.01, 8.19] |
| 4.12 Head and neck | 1 | 394 | Odds Ratio (M‐H, Random, 95% CI) | 3.02 [0.12, 74.47] |
| 4.13 Lung | 1 | 394 | Odds Ratio (M‐H, Random, 95% CI) | 3.02 [0.12, 74.47] |
| 4.14 Unknown primary | 1 | 854 | Odds Ratio (M‐H, Random, 95% CI) | 0.34 [0.01, 8.34] |
| 5 Characteristics of diagnosed cancer: stage of cancer Show forest plot | 1 | Odds Ratio (M‐H, Random, 95% CI) | Subtotals only | |
| Analysis 2.5 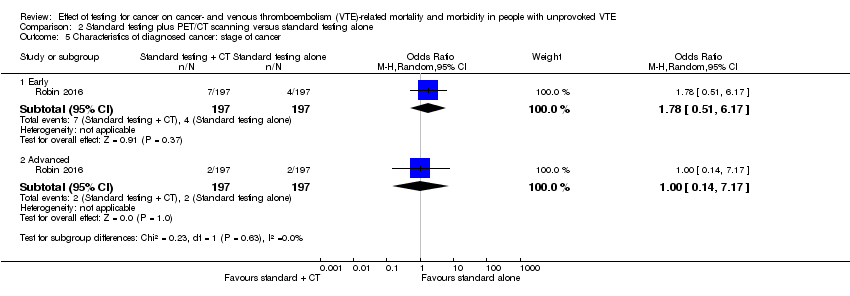 Comparison 2 Standard testing plus PET/CT scanning versus standard testing alone, Outcome 5 Characteristics of diagnosed cancer: stage of cancer. | ||||
| 5.1 Early | 1 | 394 | Odds Ratio (M‐H, Random, 95% CI) | 1.78 [0.51, 6.17] |
| 5.2 Advanced | 1 | 394 | Odds Ratio (M‐H, Random, 95% CI) | 1.0 [0.14, 7.17] |
| 6 Frequency of an underlying cancer diagnosis Show forest plot | 2 | 1248 | Odds Ratio (M‐H, Random, 95% CI) | 1.71 [0.91, 3.20] |
| Analysis 2.6  Comparison 2 Standard testing plus PET/CT scanning versus standard testing alone, Outcome 6 Frequency of an underlying cancer diagnosis. | ||||

Risk of bias graph: review authors' judgements about each risk of bias item presented as percentages across all included studies.

Risk of bias summary: review authors' judgements about each risk of bias item for each included study.
Comparison 1 Extensive tests versus tests at the physician's discretion, Outcome 1 Cancer‐related mortality.
Comparison 1 Extensive tests versus tests at the physician's discretion, Outcome 2 Characteristics of diagnosed cancer: type of cancer.
Comparison 1 Extensive tests versus tests at the physician's discretion, Outcome 3 Characteristics of diagnosed cancer: stage of cancer.
Comparison 1 Extensive tests versus tests at the physician's discretion, Outcome 4 Frequency of underlying cancer diagnosis.
Comparison 2 Standard testing plus PET/CT scanning versus standard testing alone, Outcome 1 All‐cause mortality.
Comparison 2 Standard testing plus PET/CT scanning versus standard testing alone, Outcome 2 Cancer‐related mortality.
Comparison 2 Standard testing plus PET/CT scanning versus standard testing alone, Outcome 3 Venous thromboembolism‐related morbidity.
Comparison 2 Standard testing plus PET/CT scanning versus standard testing alone, Outcome 4 Characteristics of diagnosed cancer: type of cancer.
Comparison 2 Standard testing plus PET/CT scanning versus standard testing alone, Outcome 5 Characteristics of diagnosed cancer: stage of cancer.
Comparison 2 Standard testing plus PET/CT scanning versus standard testing alone, Outcome 6 Frequency of an underlying cancer diagnosis.
| Extensive tests versus tests at the physician's discretion | ||||||
| Patient or population: people with unprovoked VTE Setting: hospital Intervention: extensive tests Comparison: tests at the physician's discretion | ||||||
| Outcomes | Anticipated absolute effects* (95% CI) | Relative effect | No of participants | Quality of the evidence | Comments | |
| Risk with tests at physician's discretion | Risk with extensive tests | |||||
| All‐cause mortality1 | See comment | See comment | See comment | See comment | See comment | No study measured this outcome. |
| Cancer‐related mortality2 | Study population | OR 0.49 | 396 | ⊕⊕⊝⊝ | ‐ | |
| 40 per 1000 | 20 per 1000 | |||||
| VTE‐related mortality4 | See comment | See comment | See comment | See comment | See comment | No study measured this outcome. |
| VTE‐related morbidity5 | See comment | See comment | See comment | See comment | See comment | No study measured this outcome. |
| Stage of cancer ‐ early6 | Study population | OR 5.00 | 201 (1 RCT) | ⊕⊕⊝⊝ | ‐ | |
| 20 per 1000 | 91 per 1000 | |||||
| Stage of cancer ‐ advanced8 | Study population | OR 0.25 | 201 | ⊕⊕⊝⊝ | ‐ | |
| 39 per 1000 | 10 per 1000 | |||||
| Time to cancer diagnosis9 | See comments | See comments | See comments | 201 (1 RCT) | See comments | Time to cancer diagnosis (measured from time of diagnosis of VTE) measured in 1 study (Piccioli 2004b), and reported as a mean of 1 month with extensive tests compared to 11.6 months with tests at physician's discretion (P < 0.001). Standard deviations for these means not given. Attempts to contact author for these data made but no response received. |
| Frequency of underlying cancer diagnosis10 | 60 per 1000 | 78 per 1000 | OR 1.32 | 396 | ⊕⊕⊝⊝ | ‐ |
| *The risk in the intervention group (and its 95% confidence interval) is based on the assumed risk in the comparison group and the relative effect of the intervention (and its 95% CI). CI: confidence interval; OR: odds ratio; RCT: randomised controlled trial; VTE: venous thromboembolism. | ||||||
| GRADE Working Group grades of evidence | ||||||
| 1 Death due to any cause. | ||||||
| Standard testing plus PET/CT scanning versus standard testing alone | ||||||
| Patient or population: people with unprovoked VTE Setting: hospital Intervention: standard testing + PET/CT scanning Comparison: standard testing alone | ||||||
| Outcomes | Anticipated absolute effects* (95% CI) | Relative effect | No of participants | Quality of the evidence | Comments | |
| Risk with standard testing alone | Risk with standard testing + PET/CT scanning | |||||
| All‐cause mortality1 | Study population | OR 1.22 | 1248 | ⊕⊕⊕⊝ | ‐ | |
| 14 per 1000 | 17 per 1000 | |||||
| Cancer‐related mortality3 | Study population | OR 0.55 | 1248 | ⊕⊕⊕⊝ | ‐ | |
| 18 per 1000 | 10 per 1000 | |||||
| VTE‐related mortality4 | See comment | See comment | See comment | See comment | See comment | No study measured this outcome. |
| VTE‐related morbidity5 | Study population | OR 1.02 | 854 | ⊕⊕⊕⊝ | ‐ | |
| 32 per 1000 | 33 per 1000 | |||||
| Stage of cancer ‐ early | Study population | OR 1.78 | 394 | ⊕⊕⊝⊝ | ‐ | |
| 20 per 1000 | 36 per 1000 | |||||
| Stage of cancer ‐ advanced | Study population | OR 1.00 | 394 | ⊕⊕⊝⊝ | ‐ | |
| 10 per 1000 | 10 per 1000 | |||||
| Time to cancer diagnosis7 | See comments | See comments | See comments | 854 (1 RCT) | See comments | Time to cancer diagnosis measured in Carrier 2015 as 4.2 months in standard testing group and 4.0 months in standard testing + PET/CT group (P = 0.88). However, standard deviations for these means not given. Attempts made to contact author for these data but no response received. |
| Frequency of an underlying cancer diagnosis8 | Study population | OR 1.71 | 1248 | ⊕⊕⊕⊝ | ‐ | |
| 29 per 1000 | 48 per 1000 | |||||
| *The risk in the intervention group (and its 95% confidence interval) is based on the assumed risk in the comparison group and the relative effect of the intervention (and its 95% CI). CI: confidence interval; OR: odds ratio; PET/CT: positron emission tomography/computed tomography; RCT: randomised controlled trial; VTE: venous thromboembolism. | ||||||
| GRADE Working Group grades of evidence | ||||||
| 1 Death due to any cause. | ||||||
| Outcome or subgroup title | No. of studies | No. of participants | Statistical method | Effect size |
| 1 Cancer‐related mortality Show forest plot | 2 | 396 | Odds Ratio (M‐H, Random, 95% CI) | 0.49 [0.15, 1.67] |
| 2 Characteristics of diagnosed cancer: type of cancer Show forest plot | 1 | Odds Ratio (M‐H, Random, 95% CI) | Subtotals only | |
| 2.1 Lung | 1 | 201 | Odds Ratio (M‐H, Random, 95% CI) | 2.08 [0.19, 23.34] |
| 2.2 Bladder | 1 | 201 | Odds Ratio (M‐H, Random, 95% CI) | 2.08 [0.19, 23.34] |
| 2.3 Stomach | 1 | 201 | Odds Ratio (M‐H, Random, 95% CI) | 1.03 [0.06, 16.71] |
| 2.4 Kidney | 1 | 201 | Odds Ratio (M‐H, Random, 95% CI) | 3.12 [0.13, 77.55] |
| 2.5 Adrenal gland | 1 | 201 | Odds Ratio (M‐H, Random, 95% CI) | 3.12 [0.13, 77.55] |
| 2.6 Liver | 1 | 201 | Odds Ratio (M‐H, Random, 95% CI) | 3.12 [0.13, 77.55] |
| 2.7 Uterus | 1 | 201 | Odds Ratio (M‐H, Random, 95% CI) | 3.12 [0.13, 77.55] |
| 2.8 Breast | 1 | 201 | Odds Ratio (M‐H, Random, 95% CI) | 1.03 [0.06, 16.71] |
| 2.9 Ovary | 1 | 201 | Odds Ratio (M‐H, Random, 95% CI) | 3.12 [0.13, 77.55] |
| 2.10 Colon | 1 | 201 | Odds Ratio (M‐H, Random, 95% CI) | 0.51 [0.05, 5.72] |
| 2.11 Prostate | 1 | 201 | Odds Ratio (M‐H, Random, 95% CI) | 0.51 [0.05, 5.72] |
| 2.12 Pancreas | 1 | 201 | Odds Ratio (M‐H, Random, 95% CI) | 0.20 [0.01, 4.26] |
| 3 Characteristics of diagnosed cancer: stage of cancer Show forest plot | 1 | Odds Ratio (M‐H, Random, 95% CI) | Subtotals only | |
| 3.1 T1 or T2 (N0 M0) | 1 | 201 | Odds Ratio (M‐H, Random, 95% CI) | 5.00 [1.05, 23.76] |
| 3.2 T3 | 1 | 201 | Odds Ratio (M‐H, Random, 95% CI) | 0.25 [0.03, 2.28] |
| 4 Frequency of underlying cancer diagnosis Show forest plot | 2 | 396 | Odds Ratio (M‐H, Random, 95% CI) | 1.32 [0.59, 2.93] |
| Outcome or subgroup title | No. of studies | No. of participants | Statistical method | Effect size |
| 1 All‐cause mortality Show forest plot | 2 | 1248 | Odds Ratio (M‐H, Random, 95% CI) | 1.22 [0.49, 3.04] |
| 2 Cancer‐related mortality Show forest plot | 2 | 1248 | Odds Ratio (M‐H, Random, 95% CI) | 0.55 [0.20, 1.52] |
| 3 Venous thromboembolism‐related morbidity Show forest plot | 1 | 854 | Odds Ratio (M‐H, Random, 95% CI) | 1.02 [0.48, 2.17] |
| 4 Characteristics of diagnosed cancer: type of cancer Show forest plot | 2 | Odds Ratio (M‐H, Random, 95% CI) | Subtotals only | |
| 4.1 Acute leukaemia | 2 | 1248 | Odds Ratio (M‐H, Random, 95% CI) | 1.62 [0.20, 13.22] |
| 4.2 Gynaecological | 2 | 1248 | Odds Ratio (M‐H, Random, 95% CI) | 2.39 [0.43, 13.36] |
| 4.3 Skin: melanoma | 1 | 854 | Odds Ratio (M‐H, Random, 95% CI) | 1.02 [0.06, 16.34] |
| 4.4 Colorectal | 2 | 1248 | Odds Ratio (M‐H, Random, 95% CI) | 0.43 [0.08, 2.40] |
| 4.5 Prostate | 2 | 1248 | Odds Ratio (M‐H, Random, 95% CI) | 2.52 [0.48, 13.12] |
| 4.6 Pancreatic | 2 | 1248 | Odds Ratio (M‐H, Random, 95% CI) | 4.81 [0.55, 42.48] |
| 4.7 Cholangiocarcinoma | 1 | 854 | Odds Ratio (M‐H, Random, 95% CI) | 0.51 [0.05, 5.63] |
| 4.8 Lymphoma | 2 | 1248 | Odds Ratio (M‐H, Random, 95% CI) | 0.74 [0.09, 5.83] |
| 4.9 Breast | 1 | 854 | Odds Ratio (M‐H, Random, 95% CI) | 0.20 [0.01, 4.24] |
| 4.10 Urological | 2 | 1248 | Odds Ratio (M‐H, Random, 95% CI) | 0.62 [0.03, 12.32] |
| 4.11 Liver | 1 | 394 | Odds Ratio (M‐H, Random, 95% CI) | 0.33 [0.01, 8.19] |
| 4.12 Head and neck | 1 | 394 | Odds Ratio (M‐H, Random, 95% CI) | 3.02 [0.12, 74.47] |
| 4.13 Lung | 1 | 394 | Odds Ratio (M‐H, Random, 95% CI) | 3.02 [0.12, 74.47] |
| 4.14 Unknown primary | 1 | 854 | Odds Ratio (M‐H, Random, 95% CI) | 0.34 [0.01, 8.34] |
| 5 Characteristics of diagnosed cancer: stage of cancer Show forest plot | 1 | Odds Ratio (M‐H, Random, 95% CI) | Subtotals only | |
| 5.1 Early | 1 | 394 | Odds Ratio (M‐H, Random, 95% CI) | 1.78 [0.51, 6.17] |
| 5.2 Advanced | 1 | 394 | Odds Ratio (M‐H, Random, 95% CI) | 1.0 [0.14, 7.17] |
| 6 Frequency of an underlying cancer diagnosis Show forest plot | 2 | 1248 | Odds Ratio (M‐H, Random, 95% CI) | 1.71 [0.91, 3.20] |