Anticonvulsivos para fibromialgia
References
References to studies included in this review
Jump to:
References to studies excluded from this review
Jump to:
Additional references
Jump to:
Characteristics of studies
Characteristics of included studies [ordered by study ID]
Jump to:
| Methods | Study setting: Multicentre study with 3 outpatient research centres in the USA Study design: Parallel Duration therapy: 12 weeks Follow‐up: Not performed Analysis: ITT; LOCF; for the primary analysis of continuous variables collected at more than 2 time points, a longitudinal analysis that compared the rate of change of the outcome during the treatment period between groups was used. The difference in rate of change was estimated by random regression methods, as described elsewhere. A model for the mean of the outcome variable that included terms for treatment, time, treatment‐by‐time interaction and centre was used. Time was modelled as a continuous variable. To account for the correlation of observations among participants, the SAS procedure MIXED (SAS Institute, Cary, NC) with the best fitting of the following covariance structures was used: unstructured, first‐order heterogeneous autoregressive and first‐order autoregressive. The longitudinal analyses used all available observations from all time points from all participants who completed a baseline evaluation. As a secondary analysis, changes from baseline to end point (the LOCF method) were analysed using an analysis of variance model, with a term for centre | |
| Participants | Participants: 150 (90% women, 97% white, mean age 48 years) Inclusion criteria: ACR 1990 criteria; age ≥ 18 years; participants were required to score 4 on the mean pain severity item of the BPI Exclusion criteria: Pain from traumatic injury or structural or regional rheumatic disease; rheumatoid arthritis, inflammatory arthritis or autoimmune disease; unstable medical or psychiatric illness; lifetime history of psychosis, hypomania or mania, epilepsy or dementia; substance abuse in the last 6 months; serious risk of suicide; pregnancy or breastfeeding; unacceptable contraception in those of childbearing potential; participants who, in the opinion of the investigator, were treatment refractory; prior treatment with gabapentin or pregabalin; and treatment with an investigational drug within 30 days of screening. Concomitant medication exclusions consisted of medications or herbal agents with CNS effects, with the exception of episodic use of sedating antihistamines (antidepressants required a 14‐day washout period prior to beginning study medication except for fluoxetine, which required a 30‐day washout period); analgesics, with the exception of paracetamol (acetaminophen) or over‐the‐counter NSAIDs; and unconventional or alternative therapies | |
| Interventions | Active drug: Gabapentin flexible 1200‐2400 mg/d (75 participants): 300 mg once a day at bedtime for 1 week, 300 mg twice a day for 1 week, 300 mg twice a day and 600 mg once a day at bedtime for 2 weeks, 600 mg 3 times a day for 2 weeks, and 600 mg twice a day and 1200 mg once a day at bedtime (2400 mg/d) for the remainder of the study beginning at week 6. If a participant could not tolerate 2400 mg/d, the dosage was reduced to a minimum of 1200 mg/d, administered 3 times a day. The study medication dose was stable for at least the last 4 weeks of the therapy phase. During the tapering phase, the dosage was decreased by 300 mg/d until discontinuation Placebo: 75 participants Rescue or allowed medication, or both: Paracetamol (acetaminophen) or over‐the‐counter NSAIDs (dosage not reported) | |
| Outcomes | Pain: BPI mean pain severity (NRS 0‐10). LOCF analysis reported; 50% pain reduction rates not reported and calculated by imputation method Fatigue: FIQ (VAS 0‐10): Not reported Sleep: BPI sleep interference (NRS 0‐10). Observed cases reported Depression: Montgomery Asberg Depression Rating Scale score (NRS 0‐60). Observed cases reported Anxiety: FIQ (VAS 0‐10): Not reported Disability: BPI interference from pain (NRS 0‐10). Observed cases reported Quality of life: FIQ total score (0‐80). Observed cases reported Patient‐perceived improvement: PGIC: Data extracted from figure AEs: At the randomisation visit, and at each subsequent visit until the end of the therapy phase, AEs were reviewed (no details reported) | |
| Notes | Safety: Gabapentin‐treated participants reported dizziness, sedation, lightheadedness and weight gain significantly more frequently than did placebo‐treated participants. Most treatment‐emergent AEs were mild to moderate in severity. There were no clinically important findings in the laboratory results, physical examinations, or ECGs Funding sources and any declaration of interest of primary investigators: Supported by NIH grant N01‐AR‐2‐2264 from the National Institute of Arthritis and Musculoskeletal and Skin Diseases (Dr. Arnold, principal investigator). Dr. Arnold received consulting fees from Eli Lilly (more than USD10,000) and from Pfizer, Cypress Bioscience, Wyeth Pharmaceuticals, Sanofi‐Aventis, Böehringer Ingelheim, Sepracor, Forest Laboratories, Allergan, and Vivus (< USD10,000 each). She also has received research support from Eli Lilly, Pfizer, Cypress Bioscience, Wyeth Pharmaceuticals, Sanofi‐Aventis and Böehringer Ingelheim. Dr. Keck received consulting fees (< USD10,000) from, or is a member of the scientific advisory boards of, Abbott, AstraZeneca Pharmaceuticals, Bristol‐Myers Squibb, GlaxoSmithKline, Eli Lilly and Pfizer. He is a principal or co‐investigator on research studies sponsored by Abbott, the American Diabetes Association, AstraZeneca Pharmaceuticals, Bristol‐Myers Squibb, GlaxoSmithKline, Eli Lilly, Janssen Pharmaceutica, the National Institute of Mental Health, the National Institute of Drug Abuse, Pfizer, the Stanley Medical Research Institute and UCB | |
| Risk of bias | ||
| Bias | Authors' judgement | Support for judgement |
| Random sequence generation (selection bias) | Low risk | Computer‐generated random sequence stratified by major depression status (details provided on request) |
| Allocation concealment (selection bias) | Low risk | Central independent unit (details reported on request) |
| Blinding of participants and personnel (performance bias) | Low risk | Double blind (number and appearance of placebo capsules similar) |
| Blinding of outcome assessment (detection bias) | Low risk | Independent data imputation and statistical analysis (details reported on request) |
| Incomplete outcome data (attrition bias) | High risk | Observed cases analysis |
| Selective reporting (reporting bias) | High risk | Outcomes anxiety and fatigue not reported |
| Methods | Study setting: Multicentre study with 84 outpatient research centres in the USA Study design: Parallel Duration therapy: 14 weeks Follow‐up: Not performed Analysis: ITT; LOCF; analysis of covariance with treatment centre and baseline scores as covariates | |
| Participants | Participants: 745 (95% women, 91% white, mean age 50 years) Inclusion criteria: ACR 1990 criteria; age ≥ 18 years; pain score of at least 40 on a 100 VAS Exclusion criteria: Inflammatory rheumatic diseases; active infections; untreated endocrine disorder; severe painful disorder (e.g. painful diabetic peripheral neuropathy, postherpetic pain) that might confound the assessment of pain due to FM; unstable medical or psychiatric disorder (e.g. serious hepatic, respiratory, neurological, haematological or immunological illness, unstable cardiovascular disease; or any other severe acute or chronic medical or psychiatric condition or laboratory abnormalities, including creatinine clearance < 50 mL/min; history of illicit alcohol or drug abuse within the past 2 years; pending workers's compensation, current receipt of disability; past or pending litigation for monetary compensation related to FM; other concomitant medication for FM (antidepressants, anticonvulsants) as well as agents used to treat pain or insomnia | |
| Interventions | Active drug: Pregabalin 300 mg/d (183 participants), pregabalin 450 mg/d (190 participants), pregabalin 600 mg/d (188 participants) twice/d, 2 weeks' dose escalation Placebo: 184 participants Rescue or allowed medication: Paracetamol (acetaminophen) < 4 g/d, aspirin < 325 mg/d | |
| Outcomes | Pain: Daily diary mean pain (NRS 0‐10) Fatigue: MAF (NRS 1‐50) Sleep: MOS Sleep Problems Index (NRS 0‐100) Depression: HADS (NRS 0‐21) Anxiety: HADS (NRS 0‐21) Disability: SF‐36, physical functioning (NRS 50‐0) Quality of life: FIQ total score (0‐80) Patient‐perceived improvement: PGIC (1‐7) AEs: Observed or spontaneously reported AEs; laboratory results, physical examinations, ECG | |
| Notes | Safety: Of the 745 participants who received study medication, 614 (82%) had at least 1 AE and 473 (53%) had at least 1 AE that was judged to be related with treatment. The incidence of all‐causality AEs was higher with pregabalin (72%) than with placebo (38%). The severity of the majority of treatment‐related AEs was mild to moderate (89% pregabalin vs. 98% placebo) Dizziness and somnolence were the most common AEs in pregabalin groups leading to discontinuation of treatment. There were no clinically important findings in the laboratory results, physical examinations or ECGs Funding sources and any declaration of interest of primary investigators: Dr. Arnold received consulting fees from Eli Lilly, Pfizer, Cypress Biosciences, Wyeth Pharmaceuticals, Sanofi‐Aventis, Böehringer Ingelheim, Allergan, Forest Laboratories and Vivus. Dr. Arnold received research grant support from Eli Lilly, Pfizer, Cypress Biosciences, Wyeth Pharmaceuticals, Sanofi‐Aventis, Böehringer Ingelheim, Allergan and Forest Laboratories. Dr. Arnold is on the Speakers Bureau for Eli Lilly and Pfizer. Dr. Russell has consulted for conducted research studies for Pfizer, Autoimmune Technologies, LLC, LKB World, Jazz Pharmaceuticals, Gruenethal and Allergan. He is on speaker's panel for Merck, Ortho‐McNeil and Pfizer. Erdal Diri received research grants from Hoffmann‐LaRoche, Pfizer, Pain Therapeutics, Proctor & Gamble Pharmaceutics and Corona. He is a speaker and consultant for Pfizer, Amgen, Centecor and Abbott. Rachel Duan, James Youg, Susan Martin, Jeannette Barreite and George Haig are employees of Pfizer and own Pfizer stocks. Uma Sharma is a consultant for Pfizer, Wyeth, Eisal, Analgesic Research and Amgen. Editorial support was provided by Yilmarie Yanchik, an employee of Pfizer. Statistical support was provided by Ed Whalen, an employee of Pfizer | |
| Risk of bias | ||
| Bias | Authors' judgement | Support for judgement |
| Random sequence generation (selection bias) | Low risk | Computer‐generated random sequence stratified by major depression status (details provided on request) |
| Allocation concealment (selection bias) | Low risk | Central independent unit (details reported on request) |
| Blinding of participants and personnel (performance bias) | Low risk | Double blind (number and appearance of placebo capsules similar) |
| Blinding of outcome assessment (detection bias) | Low risk | Independent data imputation and statistical analysis (details reported on request) |
| Incomplete outcome data (attrition bias) | Low risk | Imputation using LOCF and ITT analysis for efficacy data |
| Selective reporting (reporting bias) | Low risk | All outcomes reported |
| Methods | Study setting: Multicentre study with 40 outpatient research centres in the USA Study design: Parallel Duration therapy: 8 weeks Follow‐up: Not performed Analysis: ITT; LOCF; analysis of covariance, with treatment and centre as the main effects and the baseline value as the covariate | |
| Participants | Participants: 529 (92% women, 93% white, mean age 49 years) Inclusion criteria: ACR 1990 criteria; age ≥ 18 years; score of 40 mm on the 100‐mm VAS of the SF‐MPQ Exclusion criteria: Inflammatory rheumatic disease or other severe painful disorders that might confound assessment of FM pain. People were also excluded if they had clinically significant or unstable medical or psychological conditions that, in the opinion of the investigator, would compromise participation in the study. Participants with a calculated creatinine clearance rate of 60 mL/min (Cockroft‐Gault equation) were specifically excluded. Those who had failed to respond to previous treatment with gabapentin at dosages of 1200 mg/d for pain associated with FM were excluded. Women who were not postmenopausal were tested to confirm that they were not pregnant or breastfeeding during the study, and all women of childbearing potential were advised to use contraception reliably. Participants who were receiving disability, applying for disability, or engaged in litigation related to FM were excluded | |
| Interventions | Active drug: Pregabalin 150 mg/d (132 participants), pregabalin 300 mg/d (134 participants), pregabalin 450 mg/d (132 participants) 3 times/d Placebo: 131 participants Rescue or allowed medication: Paracetamol (acetaminophen) < 4 g/d, aspirin < 325 mg/d | |
| Outcomes | Pain: SF‐MPQ (VAS 0‐100) Fatigue: MAF (NRS 1‐50) Sleep: MOS Sleep Problems Index (NRS 0‐100) Depression: HADS (NRS 0‐21): details provided on request Anxiety: HADS (NRS 0‐21); details provided on request Disability: SF‐36, physical functioning (NRS 50‐0) Quality of life: Not assessed Patient‐perceived improvement: PGIC: not reported AEs: All spontaneously reported or observed treatment‐emergent AEs were recorded at each clinic visit, along with the dates on which they began and ended. The sponsor classified AEs using Coding Symbols for a Thesaurus of Adverse Reaction Terms, 4th Edition (COSTART IV) . A 12‐lead ECG was recorded at screening and end point, and clinical laboratory tests (haematology, urinalysis and chemistry) were performed at screening, week 3, and end point. Serious AE not reported | |
| Notes | Safety: Most AEs were mild or moderate. Dizziness and somnolence were the 2 most frequently reported AEs and tended to be dose‐related across pregabalin groups. Non‐CNS AEs that were more frequent in the pregabalin groups included weight gain and peripheral oedema. There were no clinically important findings in the analyses of haematology, blood chemistry or urinalysis. Similarly, there were no clinically significant findings in the visual function, physical, or neurological examinations or on the ECGs Funding sources and any declaration of interest of primary investigators: Supported by Pfizer Global Research and Development, Ann | |
| Risk of bias | ||
| Bias | Authors' judgement | Support for judgement |
| Random sequence generation (selection bias) | Low risk | Computer‐generated random sequence stratified by major depression status (details provided on request) |
| Allocation concealment (selection bias) | Low risk | Central independent unit (details reported on request) |
| Blinding of participants and personnel (performance bias) | Low risk | Double blind (number and appearance of placebo capsules similar, details reported on request) |
| Blinding of outcome assessment (detection bias) | Low risk | Independent data imputation and statistical analysis (details reported on request) |
| Incomplete outcome data (attrition bias) | Low risk | Imputation using LOCF and ITT analysis for efficacy data |
| Selective reporting (reporting bias) | High risk | Quality of life scores and SAEs not reported and not provided on request |
| Methods | Study setting: Multicentre study with 79 outpatient research centres in the USA Study design: Parallel Duration therapy: 13 weeks Follow‐up: Not performed Analysis: ITT; LOCF; analysis of covariance with treatment centre and baseline scores as covariates | |
| Participants | Participants: 558 (94% women, 91% white, mean age 49 years) Inclusion criteria: ACR 1990 criteria; age ≥ 18 years; pain score of at least 4 on a 0‐10 NRS Exclusion criteria: Inflammatory or rheumatological disease; other severe pain disorders; clinically significant or unstable medical or psychological conditions; creatinine clearance < 60 mL/min, severe depression, receiving or applying for disability benefits | |
| Interventions | Active drug: pregabalin 300 mg/d (185 participants), pregabalin 450 mg/d (183 participants), pregabalin 600 mg/d (190 participants) twice/d, 2 weeks' dose escalation Placebo: 190 participants Rescue or allowed medication: paracetamol (acetaminophen) < 4 g/d | |
| Outcomes | Pain: Daily diary mean pain (NRS 0‐10); 50% pain reduction rates provided on request Fatigue: MAF (NRS 1‐50), details provided on request Sleep: MOS Sleep Problems Index (NRS 0‐100) Depression: HADS (NRS 0‐21): details provided on request Anxiety: HADS (NRS 0‐21): details provided on request Disability: SF‐36, physical functioning (NRS 50‐0): data provided on request Quality of life: FIQ total score (0‐100); standard deviations provided on request Patient‐perceived improvement: PGIC (1‐7) AEs: Volunteered by participants or observed by the clinician at every visit, laboratory results, physical examinations, ECG | |
| Notes | Safety: At least 1 AE was reported by 89.2% of participants with pregabalin 300 mg/d, 91.8% of participants with pregabalin 450 mg/d, 93.7% of participants with pregabalin 600 mg/d and by 76.3% of participants with placebo Dizziness, somnolence and weight gain were more common in pregabalin groups compared with placebo. There were no clinically important findings in the laboratory results, physical examinations, or ECGs Funding sources and any declaration of interest of primary investigators: Supported by Pfizer Global Research and Development, Ann | |
| Risk of bias | ||
| Bias | Authors' judgement | Support for judgement |
| Random sequence generation (selection bias) | Low risk | Computer‐generated random sequence (details provided on request) |
| Allocation concealment (selection bias) | Low risk | Central independent unit (details reported on request) |
| Blinding of participants and personnel (performance bias) | Low risk | Double blind (number and appearance of placebo capsules similar) |
| Blinding of outcome assessment (detection bias) | Low risk | Independent data imputation and statistical analysis (details reported on request) |
| Incomplete outcome data (attrition bias) | Low risk | Imputation using LOCF and ITT analysis for efficacy data |
| Selective reporting (reporting bias) | High risk | Disability not reported |
| Methods | Study setting: Multicentre study with 44 outpatient research centres in Japan Study design: Parallel Duration therapy: 14 weeks Follow‐up: Not performed Analysis: ITT; LOCF; a mixed‐effect model taking baseline value as covariate was used for the analysis, which included participants as the random effect and dose groups, points at time of evaluation, and interaction between a dose group and its point at time of evaluation as the fixed effects | |
| Participants | Participants: 501 (89% women, 10% Japanese, mean age 47 years) Inclusion criteria: ACR 1990 criteria; age ≥ 18 years; pain score of ≥ 40 mm on the 100‐mm VAS at visit 2, and had assessed and documented their pain score on at least 4 Exclusion criteria: Decrease of ≥ 30% on their pain VAS during the placebo run‐in period (at visit 2 compared with visit 1), in order to remove potential placebo‐responders. Participants were also excluded if they were being treated for depression or if they were at risk of suicide or self harm in the opinion of the study investigator; inflammatory or rheumatological disease; other severe pain disorders; clinical significant or unstable medical or psychological conditions; history of malignancy; creatinine clearance < 60 mL/min, severe depression, receiving or applying for disability benefits | |
| Interventions | Active drug: Pregabalin (251 participants): treatment was started at 150 mg/d, escalated to 300 mg/d 1 week later, and to 450 mg/d after another week. The dose was adjusted (increased or decreased) until visit 5 of the study, after which the maintenance dose was either 300 or 450 mg/d Placebo: 250 participants Rescue or allowed medication: Paracetamol (acetaminophen) or NSAIDs for additional pain relief, although for NSAIDs, the participant must have already been on a stable regimen for longer than 30 days | |
| Outcomes | Pain: Daily diary mean pain (NRS 0‐10) Fatigue: FIQ Fatigue single scale (VAS 0‐10) Sleep: MOS Sleep Problems Index (NRS 100‐0) Depression: HADS (NRS 0‐21) Anxiety: HADS (NRS 0‐21) Disability: SF‐36, physical functioning (NRS 50‐0) Quality of life: FIQ total score (0‐100) Patient‐perceived improvement: PGIC (1‐7) AEs: volunteered by participants or observed by the clinician at every visit, laboratory results, physical examinations, ECG | |
| Notes | Safety: The incidence of all‐causality AEs was higher with pregabalin (occurring in 225 of 250 participants, 90.0%) than with placebo (175 of 248 participants, 70.6%). Similarly, the incidence of treatment‐related AEs was higher with pregabalin (206 of 250 participants, 82.4%) than with placebo (128 of 248 participants, 51.6%). The most common AEs in this study were somnolence, dizziness, nasopharyngitis, increased weight and constipation with pregabalin treatment, and somnolence and nasopharyngitis with placebo. A laboratory test result of increased creatine kinase was more frequent with pregabalin (7 of 250 participants, 2.8%) than with placebo (1 of 248 participants, 0.4%), although all cases were of mild severity. Increased weight was reported more frequently with pregabalin (39 of 250 participants, 15.6% (38 mild, 1 moderate)) than with placebo (9 of 248 participants, 3.6% (8 mild, 1 moderate)). There were no clinically significant changes in blood pressure or pulse rate in the pregabalin and placebo group. Funding sources and any declaration of interest of primary investigators: The study was funded by Pfizer Japan Inc. Medical writing support was provided by Joshua Fink PhD, of UBC Scientific Solutions, and funded by Pfizer Inc. HOhta, MO and MS are employees of Pfizer Japan, Inc. KN and HOka received a consultancy fee from Pfizer Japan, Inc. for their participation in this study. CU declares no competing interests. KN, HOka and CU were not compensated for their work on the manuscript. | |
| Risk of bias | ||
| Bias | Authors' judgement | Support for judgement |
| Random sequence generation (selection bias) | Low risk | Computer‐generated random sequence (details provided on request) |
| Allocation concealment (selection bias) | Low risk | Central independent unit (details reported on request) |
| Blinding of participants and personnel (performance bias) | Low risk | Double blind (number and appearance of placebo capsules similar) |
| Blinding of outcome assessment (detection bias) | Low risk | Independent data imputation and statistical analysis (details reported on request) |
| Incomplete outcome data (attrition bias) | Low risk | Imputation using LOCF and ITT analysis for efficacy data |
| Selective reporting (reporting bias) | Low risk | All outcomes reported on request |
| Methods | Study setting: Multicentre study with 73 outpatient research centres in the USA, Middle America, South America, Western Europe, Asia, Australia and India Study design: Parallel Duration therapy: 14 weeks Follow‐up: Not performed Analysis: ITT; LOCF; analysis of covariance with treatment centre, week, treatment by week interaction and baseline scores as covariates | |
| Participants | Participants: 986 (91% women, 76% white, mean age 49 years) Inclusion criteria: ACR 1990 criteria; age ≥ 18 years; pain score of at least 40 on a 100 VAS Exclusion criteria: Participants who demonstrated a high placebo response (≥ 30% decrease on the VAS following the 1‐week run‐in period compared with screening). Provided on request: other severe pain conditions; any widespread inflammatory musculoskeletal disorder, active infections or untreated endocrine disorders; previous participation in a clinical trial with pregabalin, previous exposure to pregabalin or currently pregabalin for any condition; severe depression according to the judgement of the investigator; serious internal diseases or any other acute or chronic medical or psychiatric condition or laboratory abnormality that may increase the risk associated with trial participation; intake of any experimental drug within 30 days prior to screening; use of prohibited pain/sleep medication (including antidepressants, sedatives, hypnotics, NSAIDs, opioids, muscle relaxants) in the absence of appropriate washout period; pending disability claims or currently receiving monetary compensation pertinent to the patient's FM or co‐morbid diseases | |
| Interventions | Active drug: Pregabalin 300 mg/d (184 participants), pregabalin 450 mg/d (182 participants), pregabalin 600 mg/d (186 participants) twice/d, 2 weeks' dose escalation Placebo: 184 participants Rescue or allowed medication: No details reported | |
| Outcomes | Pain: Daily diary mean pain (NRS 0‐10) Fatigue: MAF (NRS 1‐50) Sleep: MOS Sleep Problems Index (NRS 0‐100) Depression: HADS (NRS 0‐21): data available on clinicaltrials.gov/ct2/show/NCT00333866 Anxiety: HADS (NRS 0‐21): data available on clinicaltrials.gov/ct2/show/NCT00333866 Disability: SF‐36, physical functioning (NRS 50‐0): data available on clinicaltrials.gov/ct2/show/NCT00333866 Quality of life: FIQ total score (0‐100) Patient‐perceived improvement: PGIC (1‐7) AEs: AE were recorded at each visit. Investigators rated the severity of each AE and its relationship to study drug. Clinical laboratory evaluations, physical examinations, abbreviated neurological examinations, and 12‐lead ECGs were performed at regular intervals | |
| Notes | Safety: Of the 736 participants receiving study medication, 626 (85%) experienced at least 1 AE. The occurrence of AE increased with dosage (73%, 85%, 90% and 92% for placebo, 300, 450 and 600 mg/d pregabalin‐treated participants, respectively).The AEs most frequently reported by pregabalin‐treated participants were dizziness, somnolence, weight gain, headache, peripheral oedema, fatigue and dry mouth. Most AE were rated by investigators as mild or moderate. 18 participants experienced SAE, 4 participants treated with placebo and 14 pregabalin. Only 1 SAE, an incidence of chest pain in 1 person in the 450 mg/d pregabalin group, was considered by the investigator to be related to treatment and the person was withdrawn from the study. 8 other participants experienced an SAE that led to withdrawal from the study and 1 participant experienced an SAE that led to a dose reduction There were no clinically relevant differences in clinical laboratory evaluations, vital signs, physical examination or ECG findings Funding sources and any declaration of interest of primary investigators: Supported by Pfizer. No declaration of interest of primary investigators included | |
| Risk of bias | ||
| Bias | Authors' judgement | Support for judgement |
| Random sequence generation (selection bias) | Low risk | Computer‐generated random sequence (details provided on request) |
| Allocation concealment (selection bias) | Low risk | Central independent unit (details reported on request) |
| Blinding of participants and personnel (performance bias) | Low risk | Double blind (number and appearance of placebo capsules similar) |
| Blinding of outcome assessment (detection bias) | Low risk | Independent data imputation and statistical analysis (details reported on request) |
| Incomplete outcome data (attrition bias) | Low risk | Imputation using LOCF and ITT analysis for efficacy data |
| Selective reporting (reporting bias) | Low risk | All outcomes reported |
| Methods | Study setting: Single‐centre study in the USA, investigator‐initiated Study design: Parallel Duration therapy: 8 weeks Follow‐up: Not performed Analysis: Completer analysis by mixed effect regressions | |
| Participants | Participants: 60 participants (93% female, 79% white, mean age 49 years) Inclusion criteria: ACR 1990 criteria; age ≥ 18 years; McGill Pain Questionnaire VAS of at least 40mm on 100‐mm scale at screening and mean daily diary pain at least 4 out of 10 during the 7 days prior to study drug initiation Exclusion criteria: Pregnant or lactating women, hypersensitivity to levetiracetam or prior treatment with it; clinically significant liver, kidney or haematological disorders, a Westergen erythrocyte sedimentation rate exceeding 40 mm/min, abnormal elevated antinuclear antibody (1:160) or rheumatoid factor (> 80 IU/mL) levels, another explanation for their pain, illicit drug or alcohol abuse within the last year, involvement in unsettled litigation pertaining to their FM (such as automobile accident, civil lawsuit or worker's compensation), and ongoing monetary compensation as a result of litigation or disability claims with the exception of US social security disability benefits; subjects who are considered unreliable as to medication compliance or adherence to scheduled appointments as determined by the investigators; subjects who have serious or unstable medical or psychological conditions that in the opinion of the investigator(s), would compromise the subject's participation in the study | |
| Interventions | Active drug: 40 participants were titrated to a maximum 3000 mg/d over a 6‐week period and tapered off study medication after 8 weeks of treatment Placebo: 26 participants Rescue or allowed medication: Continuation of stable doses of antidepressants and opiates allowed | |
| Outcomes | Pain: Diary pain (NRS 0‐10); 30% and 50% pain reduction not reported and calculated by imputation method Fatigue: FIQ Fatigue single scale not reported Sleep: Diary sleep interference (NRS 0‐10) Depression: FIQ Depression not reported Anxiety: FIQ Anxiety not reported Disability: FIQ Disability not reported Quality of life: FIQ total score (0‐100) Patient‐perceived improvement: PGIC (1‐7) AEs: Subject‐reported AEs were classified into 1 of 39 categories and a subject was considered positive even if they reported an AE at only 1 visit after beginning treatment | |
| Notes | Safety: There were no SAEs in either group. AEs such as thinking abnormal, restlessness, itching and movement disorder were significantly more frequent in the levetiracetam group Funding sources and any declaration of interest of primary investigators: Supported by an investigator‐initiated grant from UCB Pharma and NIH grant K24 NS02164. No declaration of interest of primary investigator included | |
| Risk of bias | ||
| Bias | Authors' judgement | Support for judgement |
| Random sequence generation (selection bias) | Low risk | Computer‐generated random sequence (details provided on request) |
| Allocation concealment (selection bias) | Low risk | Central independent unit (details reported on request) |
| Blinding of participants and personnel (performance bias) | Low risk | Double blind (number and appearance of placebo capsules similar) |
| Blinding of outcome assessment (detection bias) | Low risk | Independent data imputation and statistical analysis (details reported on request) |
| Incomplete outcome data (attrition bias) | High risk | Only observed cases data available |
| Selective reporting (reporting bias) | High risk | Outcomes FIQ subscales fatigue, anxiety, depression, disability not reported |
| Methods | Study setting: Multicentre study, number of outpatient research centres in the USA not reported Study design: Parallel Duration therapy: 12 weeks Follow‐up: Not performed Analysis: ITT; LOCF; analysis of covariance with treatment centre, week, treatment by week interaction and baseline scores as covariates | |
| Participants | Participants: 159 (93% women, race not reported, mean age 50 years) Inclusion criteria: Not reported Exclusion criteria: Not reported | |
| Interventions | Active drug: Lacosamide 400 mg (81 participants), 4‐week titration from 100 mg/d to 400 mg/d, increasing by 100 mg/d at weekly intervals; 8‐week maintenance Placebo: 78 participants Rescue or allowed medication: No details reported | |
| Outcomes | Pain: Daily diary mean pain (NRS 0‐10) Fatigue: Fatigue score of FIQ (VAS 0‐10) Sleep: Mean daily interference with sleep (NRS 0‐10) Depression: HADS (NRS 0‐21) Anxiety: HADS (NRS 0‐21) Disability: Mean daily interference with activity (NRS 0‐10) Quality of life: FIQ total score (0‐100) Patient‐perceived improvement: PGIC (1‐7) AEs: No details reported | |
| Notes | Safety: No deaths in either group. No further details reported Funding sources and any declaration of interest of primary investigators: Supported by UCB. No declaration of interest of primary investigators included | |
| Risk of bias | ||
| Bias | Authors' judgement | Support for judgement |
| Random sequence generation (selection bias) | Unclear risk | Not reported |
| Allocation concealment (selection bias) | Unclear risk | Not reported |
| Blinding of participants and personnel (performance bias) | Low risk | Double blind (number and appearance of placebo capsules similar) |
| Blinding of outcome assessment (detection bias) | Low risk | Participant reported and participant blinded |
| Incomplete outcome data (attrition bias) | High risk | Imputation using LOCF for continuous data reported, but not used. ITT for PGIC, AEs and withdrawals |
| Selective reporting (reporting bias) | High risk | No details of AEs reported |
ACR: American College of Rheumatology; AE: adverse event; BPI: Brief Pain Inventory; C‐SSRS: Columbia Suicide Severity Rating Scale; CNS: central nervous system; ECG: electrocardiogram; FIQ: Fibromyalgia Impact Questionnaire; FM: fibromyalgia; HADS: Hospital Anxiety and Depression Scale; ITT: intention to treat; LOCF: last observation carried forward; MAF: Multidimensional Assessment of Fatigue; MOS: Medical Outcomes Study; NIH: National Institutes of Health; NRS: numeric rating scale; NSAID: non‐steroidal anti‐inflammatory drug; PGIC: Patient Global Impression of Change; SAE: serious adverse events; SF‐36: Short‐Form Health Survey ‐ 36 items; SF‐MPQ: Short‐Form McGill Pain Questionnaire; VAS: visual analogue scale.
Characteristics of excluded studies [ordered by study ID]
Jump to:
| Study | Reason for exclusion |
| Pregabalin: Study design (enriched enrolment randomised withdrawal design) over 26 weeks cannot be combined with parallel or cross‐over designs for meta‐analysis | |
| Pregabalin: Pregabalin and placebo treatment 4 weeks each within a cross‐over design |
Data and analyses
| Outcome or subgroup title | No. of studies | No. of participants | Statistical method | Effect size |
| 1 Pain Show forest plot | 1 | 119 | Std. Mean Difference (IV, Random, 95% CI) | ‐0.49 [‐0.86, ‐0.13] |
| Analysis 1.1 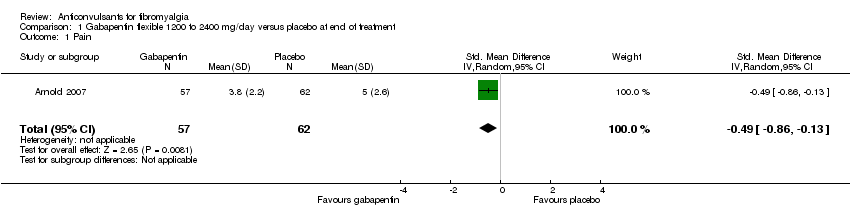 Comparison 1 Gabapentin flexible 1200 to 2400 mg/day versus placebo at end of treatment, Outcome 1 Pain. | ||||
| 2 50% pain reduction Show forest plot | 1 | 150 | Risk Ratio (IV, Random, 95% CI) | 1.6 [1.01, 2.53] |
| Analysis 1.2  Comparison 1 Gabapentin flexible 1200 to 2400 mg/day versus placebo at end of treatment, Outcome 2 50% pain reduction. | ||||
| 3 Sleep problems Show forest plot | 1 | 119 | Std. Mean Difference (IV, Random, 95% CI) | ‐0.71 [‐1.08, ‐0.34] |
| Analysis 1.3  Comparison 1 Gabapentin flexible 1200 to 2400 mg/day versus placebo at end of treatment, Outcome 3 Sleep problems. | ||||
| 4 Health‐related quality of life Show forest plot | 1 | 119 | Std. Mean Difference (IV, Random, 95% CI) | ‐0.66 [‐1.03, ‐0.29] |
| Analysis 1.4 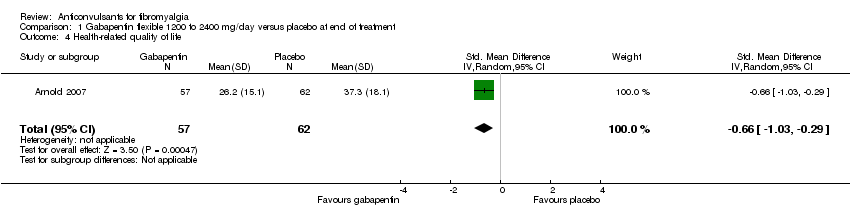 Comparison 1 Gabapentin flexible 1200 to 2400 mg/day versus placebo at end of treatment, Outcome 4 Health‐related quality of life. | ||||
| 5 Withdrawal due to adverse events Show forest plot | 1 | 150 | Risk Ratio (IV, Random, 95% CI) | 1.71 [0.71, 4.11] |
| Analysis 1.5  Comparison 1 Gabapentin flexible 1200 to 2400 mg/day versus placebo at end of treatment, Outcome 5 Withdrawal due to adverse events. | ||||
| 6 Dizziness Show forest plot | 1 | 150 | Risk Ratio (IV, Random, 95% CI) | 2.71 [1.21, 6.07] |
| Analysis 1.6 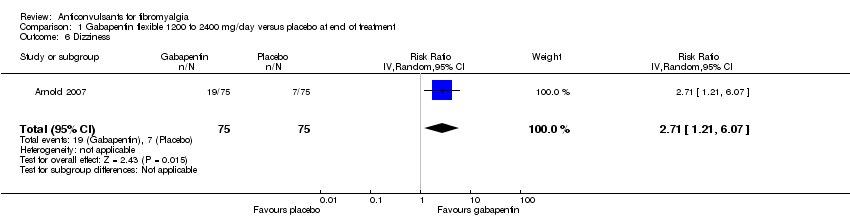 Comparison 1 Gabapentin flexible 1200 to 2400 mg/day versus placebo at end of treatment, Outcome 6 Dizziness. | ||||
| 7 30% pain reduction Show forest plot | 1 | 150 | Risk Ratio (M‐H, Random, 95% CI) | 1.65 [1.10, 2.48] |
| Analysis 1.7  Comparison 1 Gabapentin flexible 1200 to 2400 mg/day versus placebo at end of treatment, Outcome 7 30% pain reduction. | ||||
| 8 Depression Show forest plot | 1 | 119 | Std. Mean Difference (IV, Random, 95% CI) | ‐0.52 [‐0.89, ‐0.16] |
| Analysis 1.8  Comparison 1 Gabapentin flexible 1200 to 2400 mg/day versus placebo at end of treatment, Outcome 8 Depression. | ||||
| 9 Disability Show forest plot | 1 | 119 | Std. Mean Difference (IV, Random, 95% CI) | ‐0.94 [‐1.32, ‐0.56] |
| Analysis 1.9  Comparison 1 Gabapentin flexible 1200 to 2400 mg/day versus placebo at end of treatment, Outcome 9 Disability. | ||||
| Outcome or subgroup title | No. of studies | No. of participants | Statistical method | Effect size |
| 1 Pain Show forest plot | 1 | 158 | Std. Mean Difference (IV, Random, 95% CI) | ‐0.25 [‐0.56, 0.07] |
| Analysis 2.1  Comparison 2 Lacosamide 400 mg/day versus placebo at end of treatment, Outcome 1 Pain. | ||||
| 2 Fatigue Show forest plot | 1 | 121 | Std. Mean Difference (IV, Random, 95% CI) | ‐0.07 [‐0.43, 0.28] |
| Analysis 2.2  Comparison 2 Lacosamide 400 mg/day versus placebo at end of treatment, Outcome 2 Fatigue. | ||||
| 3 Sleep problems Show forest plot | 1 | 158 | Std. Mean Difference (IV, Random, 95% CI) | ‐0.19 [‐0.51, 0.12] |
| Analysis 2.3  Comparison 2 Lacosamide 400 mg/day versus placebo at end of treatment, Outcome 3 Sleep problems. | ||||
| 4 Health‐related quality of life Show forest plot | 1 | 157 | Std. Mean Difference (IV, Random, 95% CI) | ‐0.15 [‐0.47, 0.16] |
| Analysis 2.4 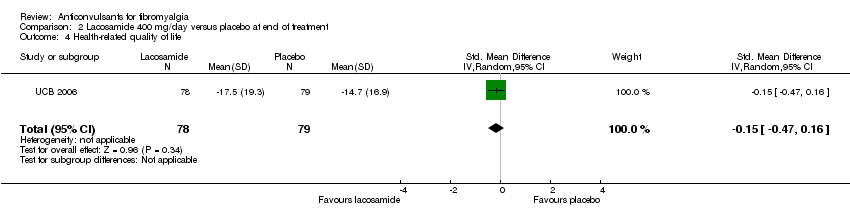 Comparison 2 Lacosamide 400 mg/day versus placebo at end of treatment, Outcome 4 Health‐related quality of life. | ||||
| 5 Serious adverse events Show forest plot | 1 | 159 | Risk Ratio (IV, Random, 95% CI) | 0.15 [0.01, 2.82] |
| Analysis 2.5  Comparison 2 Lacosamide 400 mg/day versus placebo at end of treatment, Outcome 5 Serious adverse events. | ||||
| 6 Dizziness Show forest plot | 1 | 159 | Risk Ratio (IV, Random, 95% CI) | 2.34 [1.08, 5.06] |
| Analysis 2.6  Comparison 2 Lacosamide 400 mg/day versus placebo at end of treatment, Outcome 6 Dizziness. | ||||
| 7 Anxiety Show forest plot | 1 | 133 | Std. Mean Difference (IV, Random, 95% CI) | 0.0 [‐0.34, 0.34] |
| Analysis 2.7  Comparison 2 Lacosamide 400 mg/day versus placebo at end of treatment, Outcome 7 Anxiety. | ||||
| 8 Depression Show forest plot | 1 | 134 | Std. Mean Difference (IV, Random, 95% CI) | 0.11 [‐0.23, 0.45] |
| Analysis 2.8  Comparison 2 Lacosamide 400 mg/day versus placebo at end of treatment, Outcome 8 Depression. | ||||
| 9 Disability Show forest plot | 1 | 158 | Std. Mean Difference (IV, Random, 95% CI) | ‐0.19 [‐0.51, 0.12] |
| Analysis 2.9  Comparison 2 Lacosamide 400 mg/day versus placebo at end of treatment, Outcome 9 Disability. | ||||
| 10 Patient Global Impression of Change 'much' or 'very much' improved Show forest plot | 1 | 134 | Risk Ratio (IV, Random, 95% CI) | 1.32 [0.85, 2.04] |
| Analysis 2.10  Comparison 2 Lacosamide 400 mg/day versus placebo at end of treatment, Outcome 10 Patient Global Impression of Change 'much' or 'very much' improved. | ||||
| Outcome or subgroup title | No. of studies | No. of participants | Statistical method | Effect size |
| 1 Pain Show forest plot | 1 | 50 | Std. Mean Difference (IV, Random, 95% CI) | ‐0.21 [‐0.77, 0.36] |
| Analysis 3.1  Comparison 3 Levetiracetam up to 3000 mg/day versus placebo at end of treatment, Outcome 1 Pain. | ||||
| 2 50% pain reduction Show forest plot | 1 | 66 | Risk Ratio (IV, Random, 95% CI) | 1.52 [0.43, 5.34] |
| Analysis 3.2  Comparison 3 Levetiracetam up to 3000 mg/day versus placebo at end of treatment, Outcome 2 50% pain reduction. | ||||
| 3 Sleep problems Show forest plot | 1 | 50 | Std. Mean Difference (IV, Random, 95% CI) | ‐0.16 [‐0.72, 0.40] |
| Analysis 3.3 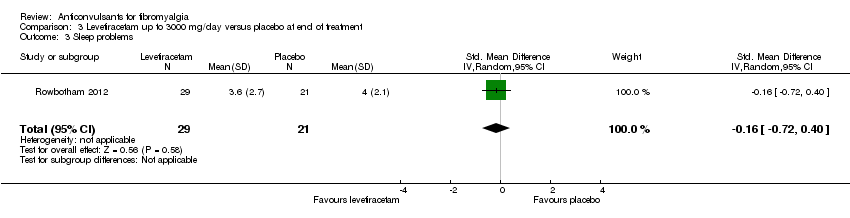 Comparison 3 Levetiracetam up to 3000 mg/day versus placebo at end of treatment, Outcome 3 Sleep problems. | ||||
| 4 Health‐related quality of life Show forest plot | 1 | 50 | Std. Mean Difference (IV, Random, 95% CI) | 0.14 [‐0.42, 0.70] |
| Analysis 3.4  Comparison 3 Levetiracetam up to 3000 mg/day versus placebo at end of treatment, Outcome 4 Health‐related quality of life. | ||||
| 5 Withdrawal due to adverse events Show forest plot | 1 | 66 | Risk Ratio (IV, Random, 95% CI) | 0.87 [0.21, 3.56] |
| Analysis 3.5  Comparison 3 Levetiracetam up to 3000 mg/day versus placebo at end of treatment, Outcome 5 Withdrawal due to adverse events. | ||||
| 6 Dizziness Show forest plot | 1 | 66 | Risk Ratio (IV, Random, 95% CI) | 1.3 [1.02, 1.66] |
| Analysis 3.6  Comparison 3 Levetiracetam up to 3000 mg/day versus placebo at end of treatment, Outcome 6 Dizziness. | ||||
| 7 30% pain reduction Show forest plot | 1 | 66 | Risk Ratio (IV, Random, 95% CI) | 1.23 [0.65, 2.33] |
| Analysis 3.7  Comparison 3 Levetiracetam up to 3000 mg/day versus placebo at end of treatment, Outcome 7 30% pain reduction. | ||||
| Outcome or subgroup title | No. of studies | No. of participants | Statistical method | Effect size |
| 1 Pain Show forest plot | 5 | 3252 | Std. Mean Difference (IV, Random, 95% CI) | ‐0.28 [‐0.35, ‐0.20] |
| Analysis 4.1  Comparison 4 Pregabalin versus placebo at end of treatment, Outcome 1 Pain. | ||||
| 1.1 Pregabalin 150 mg/d | 1 | 175 | Std. Mean Difference (IV, Random, 95% CI) | ‐0.10 [‐0.45, 0.24] |
| 1.2 Pregabalin 300 mg/d | 4 | 913 | Std. Mean Difference (IV, Random, 95% CI) | ‐0.24 [‐0.39, ‐0.09] |
| 1.3 Pregabalin 450 mg/d | 4 | 915 | Std. Mean Difference (IV, Random, 95% CI) | ‐0.36 [‐0.51, ‐0.20] |
| 1.4 Pregabalin 600 mg/d | 3 | 751 | Std. Mean Difference (IV, Random, 95% CI) | ‐0.30 [‐0.51, ‐0.09] |
| 1.5 Pregabalin flexible 300 or 450 mg/d | 1 | 498 | Std. Mean Difference (IV, Random, 95% CI) | ‐0.24 [‐0.41, ‐0.06] |
| 2 50% pain reduction Show forest plot | 5 | 3256 | Risk Ratio (IV, Random, 95% CI) | 1.59 [1.33, 1.90] |
| Analysis 4.2  Comparison 4 Pregabalin versus placebo at end of treatment, Outcome 2 50% pain reduction. | ||||
| 2.1 Pregabalin 150 mg/d | 1 | 175 | Risk Ratio (IV, Random, 95% CI) | 0.92 [0.39, 2.19] |
| 2.2 Pregabalin 300 mg/d | 4 | 915 | Risk Ratio (IV, Random, 95% CI) | 1.45 [1.03, 2.05] |
| 2.3 Pregabalin 450 mg/d | 4 | 916 | Risk Ratio (IV, Random, 95% CI) | 1.75 [1.23, 2.49] |
| 2.4 Pregabalin 600 mg/d | 3 | 752 | Risk Ratio (IV, Random, 95% CI) | 1.51 [1.04, 2.20] |
| 2.5 Pregabalin flexible 300 mg/d or 450 mg/d | 1 | 498 | Risk Ratio (IV, Random, 95% CI) | 1.88 [1.26, 2.83] |
| 3 Fatigue Show forest plot | 5 | 3195 | Std. Mean Difference (IV, Random, 95% CI) | ‐0.17 [‐0.25, ‐0.09] |
| Analysis 4.3  Comparison 4 Pregabalin versus placebo at end of treatment, Outcome 3 Fatigue. | ||||
| 3.1 Pregabalin 150 mg/d | 1 | 165 | Std. Mean Difference (IV, Random, 95% CI) | ‐0.20 [‐0.56, 0.15] |
| 3.2 Pregabalin 300 mg/d | 4 | 892 | Std. Mean Difference (IV, Random, 95% CI) | ‐0.16 [‐0.31, ‐0.01] |
| 3.3 Pregabalin 450 mg/d | 4 | 897 | Std. Mean Difference (IV, Random, 95% CI) | ‐0.15 [‐0.30, 0.01] |
| 3.4 Pregabalin 600 mg/d | 3 | 743 | Std. Mean Difference (IV, Random, 95% CI) | ‐0.08 [‐0.25, 0.09] |
| 3.5 Pregabalin flexible 300 or 450 mg/d | 1 | 498 | Std. Mean Difference (IV, Random, 95% CI) | ‐0.31 [‐0.49, ‐0.14] |
| 4 Sleep problems Show forest plot | 5 | 3193 | Std. Mean Difference (IV, Random, 95% CI) | ‐0.35 [‐0.43, ‐0.27] |
| Analysis 4.4  Comparison 4 Pregabalin versus placebo at end of treatment, Outcome 4 Sleep problems. | ||||
| 4.1 Pregabalin 150 mg/d | 1 | 163 | Std. Mean Difference (IV, Random, 95% CI) | ‐0.44 [‐0.80, ‐0.08] |
| 4.2 Pregabalin 300 mg/d | 4 | 897 | Std. Mean Difference (IV, Random, 95% CI) | ‐0.29 [‐0.44, ‐0.14] |
| 4.3 Pregabalin 450 mg/d | 4 | 893 | Std. Mean Difference (IV, Random, 95% CI) | ‐0.45 [‐0.63, ‐0.27] |
| 4.4 Pregabalin 600 mg/d | 3 | 744 | Std. Mean Difference (IV, Random, 95% CI) | ‐0.40 [‐0.57, ‐0.23] |
| 4.5 Pregabalin flexible 300 or 450 mg/d | 1 | 496 | Std. Mean Difference (IV, Random, 95% CI) | ‐0.20 [‐0.37, ‐0.02] |
| 5 Health‐related quality of life Show forest plot | 4 | 2724 | Std. Mean Difference (IV, Random, 95% CI) | ‐0.17 [‐0.26, ‐0.09] |
| Analysis 4.5 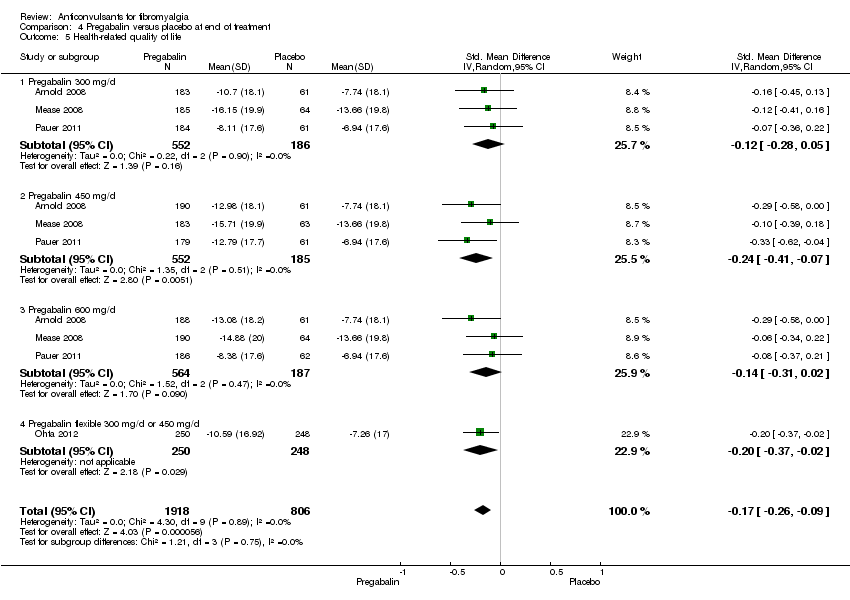 Comparison 4 Pregabalin versus placebo at end of treatment, Outcome 5 Health‐related quality of life. | ||||
| 5.1 Pregabalin 300 mg/d | 3 | 738 | Std. Mean Difference (IV, Random, 95% CI) | ‐0.12 [‐0.28, 0.05] |
| 5.2 Pregabalin 450 mg/d | 3 | 737 | Std. Mean Difference (IV, Random, 95% CI) | ‐0.24 [‐0.41, ‐0.07] |
| 5.3 Pregabalin 600 mg/d | 3 | 751 | Std. Mean Difference (IV, Random, 95% CI) | ‐0.14 [‐0.31, 0.02] |
| 5.4 Pregabalin flexible 300 mg/d or 450 mg/d | 1 | 498 | Std. Mean Difference (IV, Random, 95% CI) | ‐0.20 [‐0.37, ‐0.02] |
| 6 Withdrawal due to adverse events Show forest plot | 5 | 3259 | Risk Ratio (IV, Random, 95% CI) | 1.68 [1.36, 2.07] |
| Analysis 4.6  Comparison 4 Pregabalin versus placebo at end of treatment, Outcome 6 Withdrawal due to adverse events. | ||||
| 6.1 Pregabalin 150 mg/d | 1 | 175 | Risk Ratio (IV, Random, 95% CI) | 1.19 [0.35, 4.08] |
| 6.2 Pregabalin 300 mg/d | 4 | 917 | Risk Ratio (IV, Random, 95% CI) | 1.54 [1.02, 2.34] |
| 6.3 Pregabalin 450 mg/d | 4 | 917 | Risk Ratio (IV, Random, 95% CI) | 2.02 [1.32, 3.09] |
| 6.4 Pregabalin 600 mg/d | 3 | 752 | Risk Ratio (IV, Random, 95% CI) | 2.53 [1.65, 3.86] |
| 6.5 Pregabalin flexible 300 mg/d or 450 mg/d | 1 | 498 | Risk Ratio (IV, Random, 95% CI) | 1.01 [0.65, 1.57] |
| 7 Serious adverse events Show forest plot | 4 | 2729 | Risk Ratio (IV, Random, 95% CI) | 1.03 [0.71, 1.49] |
| Analysis 4.7  Comparison 4 Pregabalin versus placebo at end of treatment, Outcome 7 Serious adverse events. | ||||
| 7.1 Pregabalin 300 mg/d | 3 | 738 | Risk Ratio (IV, Random, 95% CI) | 0.96 [0.50, 1.86] |
| 7.2 Pregabalin 450 mg/d | 3 | 741 | Risk Ratio (IV, Random, 95% CI) | 1.03 [0.52, 2.03] |
| 7.3 Pregabalin 600 mg/d | 3 | 752 | Risk Ratio (IV, Random, 95% CI) | 1.01 [0.55, 1.87] |
| 7.4 Pregabalin flexible 300 mg/d or 450 mg/d | 1 | 498 | Risk Ratio (IV, Random, 95% CI) | 2.98 [0.31, 28.42] |
| 8 Dizziness Show forest plot | 5 | 3257 | Risk Ratio (IV, Random, 95% CI) | 3.77 [3.06, 4.63] |
| Analysis 4.8  Comparison 4 Pregabalin versus placebo at end of treatment, Outcome 8 Dizziness. | ||||
| 8.1 Pregabalin 150 mg/d | 1 | 175 | Risk Ratio (IV, Random, 95% CI) | 2.44 [0.91, 6.54] |
| 8.2 Pregabalin 300 mg/d | 4 | 916 | Risk Ratio (IV, Random, 95% CI) | 3.11 [2.09, 4.65] |
| 8.3 Pregabalin 450 mg/d | 4 | 917 | Risk Ratio (IV, Random, 95% CI) | 3.95 [2.68, 5.82] |
| 8.4 Pregabalin 600 mg/d | 3 | 751 | Risk Ratio (IV, Random, 95% CI) | 4.00 [2.65, 6.03] |
| 8.5 Pregabalin flexible 300 mg/d or 450 mg/d | 1 | 498 | Risk Ratio (IV, Random, 95% CI) | 4.89 [2.89, 8.28] |
| 9 30% pain reduction Show forest plot | 5 | 3259 | Risk Ratio (IV, Random, 95% CI) | 1.37 [1.22, 1.53] |
| Analysis 4.9 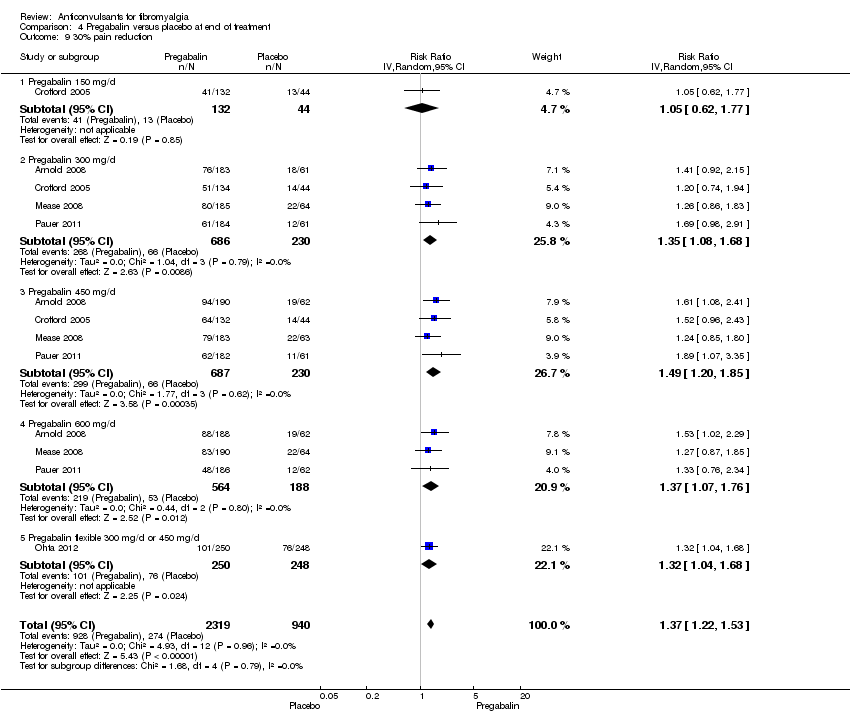 Comparison 4 Pregabalin versus placebo at end of treatment, Outcome 9 30% pain reduction. | ||||
| 9.1 Pregabalin 150 mg/d | 1 | 176 | Risk Ratio (IV, Random, 95% CI) | 1.05 [0.62, 1.77] |
| 9.2 Pregabalin 300 mg/d | 4 | 916 | Risk Ratio (IV, Random, 95% CI) | 1.35 [1.08, 1.68] |
| 9.3 Pregabalin 450 mg/d | 4 | 917 | Risk Ratio (IV, Random, 95% CI) | 1.49 [1.20, 1.85] |
| 9.4 Pregabalin 600 mg/d | 3 | 752 | Risk Ratio (IV, Random, 95% CI) | 1.37 [1.07, 1.76] |
| 9.5 Pregabalin flexible 300 mg/d or 450 mg/d | 1 | 498 | Risk Ratio (IV, Random, 95% CI) | 1.32 [1.04, 1.68] |
| 10 Anxiety Show forest plot | 5 | 3214 | Std. Mean Difference (IV, Random, 95% CI) | ‐0.12 [‐0.20, ‐0.04] |
| Analysis 4.10  Comparison 4 Pregabalin versus placebo at end of treatment, Outcome 10 Anxiety. | ||||
| 10.1 Pregabalin 150 mg/d | 1 | 166 | Std. Mean Difference (IV, Random, 95% CI) | 0.07 [‐0.28, 0.42] |
| 10.2 Pregabalin 300 mg/d | 4 | 903 | Std. Mean Difference (IV, Random, 95% CI) | ‐0.05 [‐0.20, 0.10] |
| 10.3 Pregabalin 450 mg/d | 4 | 900 | Std. Mean Difference (IV, Random, 95% CI) | ‐0.15 [‐0.30, 0.00] |
| 10.4 Pregabalin 600 mg/d | 3 | 749 | Std. Mean Difference (IV, Random, 95% CI) | ‐0.16 [‐0.32, 0.01] |
| 10.5 Pregabalin flexible 300 mg/d or 450 mg/d | 1 | 496 | Std. Mean Difference (IV, Random, 95% CI) | ‐0.17 [‐0.35, 0.01] |
| 11 Depression Show forest plot | 5 | 3212 | Std. Mean Difference (IV, Random, 95% CI) | ‐0.09 [‐0.16, ‐0.01] |
| Analysis 4.11 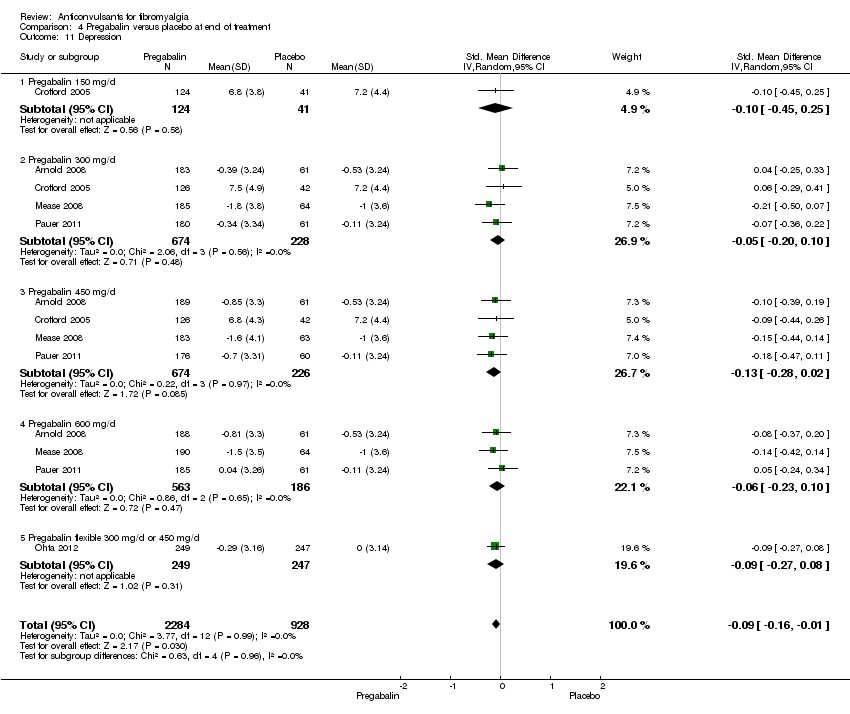 Comparison 4 Pregabalin versus placebo at end of treatment, Outcome 11 Depression. | ||||
| 11.1 Pregabalin 150 mg/d | 1 | 165 | Std. Mean Difference (IV, Random, 95% CI) | ‐0.10 [‐0.45, 0.25] |
| 11.2 Pregabalin 300 mg/d | 4 | 902 | Std. Mean Difference (IV, Random, 95% CI) | ‐0.05 [‐0.20, 0.10] |
| 11.3 Pregabalin 450 mg/d | 4 | 900 | Std. Mean Difference (IV, Random, 95% CI) | ‐0.13 [‐0.28, 0.02] |
| 11.4 Pregabalin 600 mg/d | 3 | 749 | Std. Mean Difference (IV, Random, 95% CI) | ‐0.06 [‐0.23, 0.10] |
| 11.5 Pregabalin flexible 300 mg/d or 450 mg/d | 1 | 496 | Std. Mean Difference (IV, Random, 95% CI) | ‐0.09 [‐0.27, 0.08] |
| 12 Disability Show forest plot | 5 | 3145 | Std. Mean Difference (IV, Random, 95% CI) | ‐0.01 [‐0.11, 0.09] |
| Analysis 4.12  Comparison 4 Pregabalin versus placebo at end of treatment, Outcome 12 Disability. | ||||
| 12.1 Pregabalin 150 mg/d | 1 | 166 | Std. Mean Difference (IV, Random, 95% CI) | 0.11 [‐0.24, 0.47] |
| 12.2 Pregabalin 300 mg/d | 4 | 879 | Std. Mean Difference (IV, Random, 95% CI) | 0.04 [‐0.11, 0.20] |
| 12.3 Pregabalin 450 mg/d | 4 | 888 | Std. Mean Difference (IV, Random, 95% CI) | 0.00 [‐0.17, 0.18] |
| 12.4 Pregabalin 600 mg/d | 3 | 714 | Std. Mean Difference (IV, Random, 95% CI) | 0.03 [‐0.14, 0.21] |
| 12.5 Pregabalin flexible 300 mg/d or 450 mg/d | 1 | 498 | Std. Mean Difference (IV, Random, 95% CI) | ‐0.29 [‐0.47, ‐0.12] |
| 13 Patient Global Impression of Change 'much' or 'very much' improved Show forest plot | 5 | 3183 | Risk Ratio (IV, Random, 95% CI) | 1.38 [1.23, 1.55] |
| Analysis 4.13  Comparison 4 Pregabalin versus placebo at end of treatment, Outcome 13 Patient Global Impression of Change 'much' or 'very much' improved. | ||||
| 13.1 Pregabalin 150 mg/d | 1 | 175 | Risk Ratio (IV, Random, 95% CI) | 1.30 [0.74, 2.29] |
| 13.2 Pregabalin 300 mg/d | 4 | 886 | Risk Ratio (IV, Random, 95% CI) | 1.25 [0.99, 1.57] |
| 13.3 Pregabalin 450 mg/d | 4 | 892 | Risk Ratio (IV, Random, 95% CI) | 1.54 [1.15, 2.06] |
| 13.4 Pregabalin 600 mg/d | 3 | 734 | Risk Ratio (IV, Random, 95% CI) | 1.37 [1.06, 1.76] |
| 13.5 Pregabalin flexible 300 mg/d or 450 mg/d | 1 | 496 | Risk Ratio (IV, Random, 95% CI) | 1.44 [1.11, 1.87] |


Risk of bias graph: review authors' judgements about each risk of bias item presented as percentages across all included studies.

Risk of bias summary: review authors' judgements about each risk of bias item for each included study.
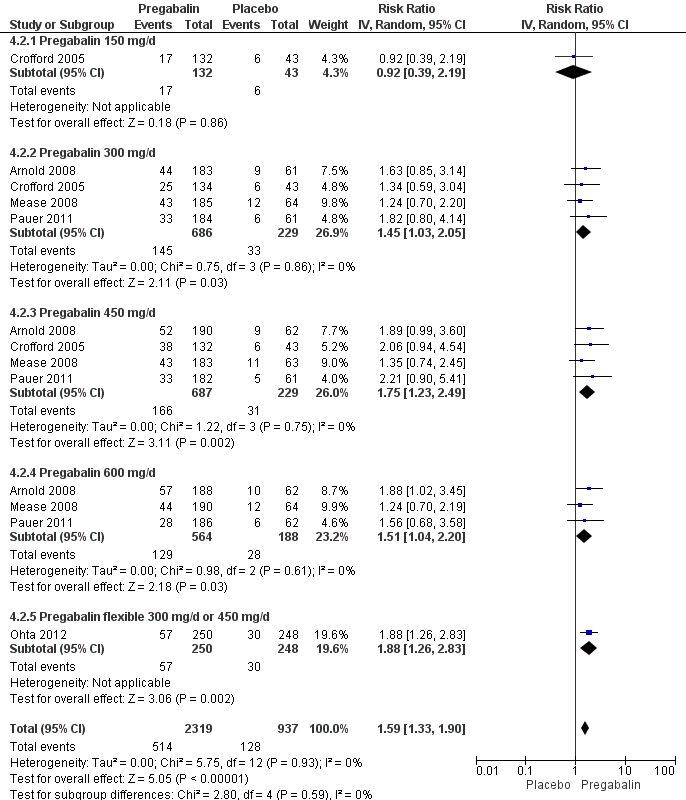
Forest plot of comparison: 4 Pregabalin versus placebo at end of treatment, outcome: 4.2 50% pain reduction.

Forest plot of comparison: 4 Pregabalin versus placebo at end of treatment, outcome: 4.3 Fatigue.

Forest plot of comparison: 4 Pregabalin versus placebo at end of treatment, outcome: 4.4 Sleep problems.
Comparison 1 Gabapentin flexible 1200 to 2400 mg/day versus placebo at end of treatment, Outcome 1 Pain.
Comparison 1 Gabapentin flexible 1200 to 2400 mg/day versus placebo at end of treatment, Outcome 2 50% pain reduction.
Comparison 1 Gabapentin flexible 1200 to 2400 mg/day versus placebo at end of treatment, Outcome 3 Sleep problems.
Comparison 1 Gabapentin flexible 1200 to 2400 mg/day versus placebo at end of treatment, Outcome 4 Health‐related quality of life.
Comparison 1 Gabapentin flexible 1200 to 2400 mg/day versus placebo at end of treatment, Outcome 5 Withdrawal due to adverse events.
Comparison 1 Gabapentin flexible 1200 to 2400 mg/day versus placebo at end of treatment, Outcome 6 Dizziness.
Comparison 1 Gabapentin flexible 1200 to 2400 mg/day versus placebo at end of treatment, Outcome 7 30% pain reduction.
Comparison 1 Gabapentin flexible 1200 to 2400 mg/day versus placebo at end of treatment, Outcome 8 Depression.
Comparison 1 Gabapentin flexible 1200 to 2400 mg/day versus placebo at end of treatment, Outcome 9 Disability.
Comparison 2 Lacosamide 400 mg/day versus placebo at end of treatment, Outcome 1 Pain.
Comparison 2 Lacosamide 400 mg/day versus placebo at end of treatment, Outcome 2 Fatigue.
Comparison 2 Lacosamide 400 mg/day versus placebo at end of treatment, Outcome 3 Sleep problems.
Comparison 2 Lacosamide 400 mg/day versus placebo at end of treatment, Outcome 4 Health‐related quality of life.
Comparison 2 Lacosamide 400 mg/day versus placebo at end of treatment, Outcome 5 Serious adverse events.
Comparison 2 Lacosamide 400 mg/day versus placebo at end of treatment, Outcome 6 Dizziness.
Comparison 2 Lacosamide 400 mg/day versus placebo at end of treatment, Outcome 7 Anxiety.
Comparison 2 Lacosamide 400 mg/day versus placebo at end of treatment, Outcome 8 Depression.
Comparison 2 Lacosamide 400 mg/day versus placebo at end of treatment, Outcome 9 Disability.
Comparison 2 Lacosamide 400 mg/day versus placebo at end of treatment, Outcome 10 Patient Global Impression of Change 'much' or 'very much' improved.
Comparison 3 Levetiracetam up to 3000 mg/day versus placebo at end of treatment, Outcome 1 Pain.
Comparison 3 Levetiracetam up to 3000 mg/day versus placebo at end of treatment, Outcome 2 50% pain reduction.
Comparison 3 Levetiracetam up to 3000 mg/day versus placebo at end of treatment, Outcome 3 Sleep problems.
Comparison 3 Levetiracetam up to 3000 mg/day versus placebo at end of treatment, Outcome 4 Health‐related quality of life.
Comparison 3 Levetiracetam up to 3000 mg/day versus placebo at end of treatment, Outcome 5 Withdrawal due to adverse events.
Comparison 3 Levetiracetam up to 3000 mg/day versus placebo at end of treatment, Outcome 6 Dizziness.
Comparison 3 Levetiracetam up to 3000 mg/day versus placebo at end of treatment, Outcome 7 30% pain reduction.
Comparison 4 Pregabalin versus placebo at end of treatment, Outcome 1 Pain.
Comparison 4 Pregabalin versus placebo at end of treatment, Outcome 2 50% pain reduction.
Comparison 4 Pregabalin versus placebo at end of treatment, Outcome 3 Fatigue.
Comparison 4 Pregabalin versus placebo at end of treatment, Outcome 4 Sleep problems.
Comparison 4 Pregabalin versus placebo at end of treatment, Outcome 5 Health‐related quality of life.
Comparison 4 Pregabalin versus placebo at end of treatment, Outcome 6 Withdrawal due to adverse events.
Comparison 4 Pregabalin versus placebo at end of treatment, Outcome 7 Serious adverse events.
Comparison 4 Pregabalin versus placebo at end of treatment, Outcome 8 Dizziness.
Comparison 4 Pregabalin versus placebo at end of treatment, Outcome 9 30% pain reduction.
Comparison 4 Pregabalin versus placebo at end of treatment, Outcome 10 Anxiety.
Comparison 4 Pregabalin versus placebo at end of treatment, Outcome 11 Depression.
Comparison 4 Pregabalin versus placebo at end of treatment, Outcome 12 Disability.
Comparison 4 Pregabalin versus placebo at end of treatment, Outcome 13 Patient Global Impression of Change 'much' or 'very much' improved.
| Pregabalin versus placebo at final treatment for fibromyalgia | ||||||
| Patient or population: People with fibromyalgia | ||||||
| Outcomes | Illustrative comparative risks* (95% CI) | Relative effect | No of participants | Quality of the evidence | Comments | |
| Assumed risk | Corresponding risk | |||||
| Control | Anticonvulsants versus placebo at final treatment | |||||
| 50% pain reduction | 137 per 1000 | 217 per 1000 | RR 1.59 | 3256 | ⊕⊕⊕⊕ | Absolute risk difference (fewer pain) 8% (95% CI 6% to 11%) Relative per cent improvement 59% (95% CI 33% to 90%) NNTB 12 (95% CI 9 to 21) |
| Patient Global Impression of Change of 'much' or 'very much' improved | 279 per 1000 | 385 per 1000 | RR 1.38 | 3183 | ⊕⊕⊕⊕ | Absolute risk difference (more global impression of 'much' and 'very much' improved) 12% (95% CI 4% to 20%) Relative per cent improvement 38% (95% CI 23% to 55%) NNTB 9 (95% CI 7 to 15) |
| Fatigue (1‐50 scale) Higher scores indicate higher fatigue levels | MAF baseline fatigue score control group 35.6 (standard deviation 8.0) ** | The mean fatigue in the intervention groups was | 3195 | ⊕⊕⊕⊕ | SMD ‐0.17 (‐0.25 to ‐0.09) 2.7% (95% CI 1.4% to 4.0%) fewer points on the fatigue scale (absolute improvement) 3.8% (95% CI 2.0% to 5.6%) relative improvement NNTB 13 (95% CI 9 to 25) | |
| Sleep problems (0‐100 scale). Higher scores indicate more sleep problems | MOS baseline overall sleep problem index control group 58.5 (17.8) *** | The mean sleep problems in the intervention groups was | 3139 | ⊕⊕⊕⊕ | SMD ‐0.35 (‐0.43 to ‐0.27) 6.2% (95% CI 4.8% to 7.7%) fewer points on the sleep problem scale (absolute improvement) 10.6% (95% CI 82.% to 13.1%) relative improvement NNTB 7 (95% CI 5 to 8) | |
| Withdrawal due to adverse events | 110 per 1000 | 185 per 1000 | RR 1.68 | 3259 | ⊕⊕⊕⊕ | Absolute risk difference (more withdrawal due to adverse events) 8% (95% CI 5% to 12%) Relative per cent worsening 68% (95% CI 36% to 107%) NNTH 13 (95% CI 9 to 23) |
| Serious adverse events | 41 per 1000 | 42 per 1000 | RR 1.03 | 2729 | ⊕⊕⊕⊝ | Absolute risk difference 0 (95% CI ‐1 to 1) Relative per cent change 0 (95% CI ‐1 to 1) Not statistically significant |
| Dizziness reported to be an adverse event | 93 per 1000 | 350 per 1000 | RR 3.77 | 3257 | ⊕⊕⊕⊕ | Absolute risk difference (more dizziness) 28% (95% CI 24% to 32%) Relative per cent worsening 277% (95% CI 206% to 363%) NNTH 4 (95% CI 3 to 5) |
| *The basis for the assumed risk (e.g. the median control group risk across studies) is provided in footnotes. The corresponding risk (and its 95% confidence interval) is based on the assumed risk in the comparison group and the relative effect of the intervention (and its 95% CI). CI: confidence interval; MAF: Multidimensional Assessment of Fatigue; MOS: Medical Outcomes Study; NNTB: number needed to treat for an additional beneficial outcome; NNTH: number needed to treat for an additional harmful outcome; NRS: numeric rating scale; RR: risk ratio; SMD: standardised mean difference. | ||||||
| GRADE Working Group grades of evidence | ||||||
| 1 Frequency of serious adverse events not reported by one study. ** Arnold 2008: n = 190 participants; MAF (NRS 1‐50). *** Arnold 2008: n = 190 participants; MOS Overall Sleep Problems Index (NRS 0‐100). | ||||||
| Outcome or subgroup title | No. of studies | No. of participants | Statistical method | Effect size |
| 1 Pain Show forest plot | 1 | 119 | Std. Mean Difference (IV, Random, 95% CI) | ‐0.49 [‐0.86, ‐0.13] |
| 2 50% pain reduction Show forest plot | 1 | 150 | Risk Ratio (IV, Random, 95% CI) | 1.6 [1.01, 2.53] |
| 3 Sleep problems Show forest plot | 1 | 119 | Std. Mean Difference (IV, Random, 95% CI) | ‐0.71 [‐1.08, ‐0.34] |
| 4 Health‐related quality of life Show forest plot | 1 | 119 | Std. Mean Difference (IV, Random, 95% CI) | ‐0.66 [‐1.03, ‐0.29] |
| 5 Withdrawal due to adverse events Show forest plot | 1 | 150 | Risk Ratio (IV, Random, 95% CI) | 1.71 [0.71, 4.11] |
| 6 Dizziness Show forest plot | 1 | 150 | Risk Ratio (IV, Random, 95% CI) | 2.71 [1.21, 6.07] |
| 7 30% pain reduction Show forest plot | 1 | 150 | Risk Ratio (M‐H, Random, 95% CI) | 1.65 [1.10, 2.48] |
| 8 Depression Show forest plot | 1 | 119 | Std. Mean Difference (IV, Random, 95% CI) | ‐0.52 [‐0.89, ‐0.16] |
| 9 Disability Show forest plot | 1 | 119 | Std. Mean Difference (IV, Random, 95% CI) | ‐0.94 [‐1.32, ‐0.56] |
| Outcome or subgroup title | No. of studies | No. of participants | Statistical method | Effect size |
| 1 Pain Show forest plot | 1 | 158 | Std. Mean Difference (IV, Random, 95% CI) | ‐0.25 [‐0.56, 0.07] |
| 2 Fatigue Show forest plot | 1 | 121 | Std. Mean Difference (IV, Random, 95% CI) | ‐0.07 [‐0.43, 0.28] |
| 3 Sleep problems Show forest plot | 1 | 158 | Std. Mean Difference (IV, Random, 95% CI) | ‐0.19 [‐0.51, 0.12] |
| 4 Health‐related quality of life Show forest plot | 1 | 157 | Std. Mean Difference (IV, Random, 95% CI) | ‐0.15 [‐0.47, 0.16] |
| 5 Serious adverse events Show forest plot | 1 | 159 | Risk Ratio (IV, Random, 95% CI) | 0.15 [0.01, 2.82] |
| 6 Dizziness Show forest plot | 1 | 159 | Risk Ratio (IV, Random, 95% CI) | 2.34 [1.08, 5.06] |
| 7 Anxiety Show forest plot | 1 | 133 | Std. Mean Difference (IV, Random, 95% CI) | 0.0 [‐0.34, 0.34] |
| 8 Depression Show forest plot | 1 | 134 | Std. Mean Difference (IV, Random, 95% CI) | 0.11 [‐0.23, 0.45] |
| 9 Disability Show forest plot | 1 | 158 | Std. Mean Difference (IV, Random, 95% CI) | ‐0.19 [‐0.51, 0.12] |
| 10 Patient Global Impression of Change 'much' or 'very much' improved Show forest plot | 1 | 134 | Risk Ratio (IV, Random, 95% CI) | 1.32 [0.85, 2.04] |
| Outcome or subgroup title | No. of studies | No. of participants | Statistical method | Effect size |
| 1 Pain Show forest plot | 1 | 50 | Std. Mean Difference (IV, Random, 95% CI) | ‐0.21 [‐0.77, 0.36] |
| 2 50% pain reduction Show forest plot | 1 | 66 | Risk Ratio (IV, Random, 95% CI) | 1.52 [0.43, 5.34] |
| 3 Sleep problems Show forest plot | 1 | 50 | Std. Mean Difference (IV, Random, 95% CI) | ‐0.16 [‐0.72, 0.40] |
| 4 Health‐related quality of life Show forest plot | 1 | 50 | Std. Mean Difference (IV, Random, 95% CI) | 0.14 [‐0.42, 0.70] |
| 5 Withdrawal due to adverse events Show forest plot | 1 | 66 | Risk Ratio (IV, Random, 95% CI) | 0.87 [0.21, 3.56] |
| 6 Dizziness Show forest plot | 1 | 66 | Risk Ratio (IV, Random, 95% CI) | 1.3 [1.02, 1.66] |
| 7 30% pain reduction Show forest plot | 1 | 66 | Risk Ratio (IV, Random, 95% CI) | 1.23 [0.65, 2.33] |
| Outcome or subgroup title | No. of studies | No. of participants | Statistical method | Effect size |
| 1 Pain Show forest plot | 5 | 3252 | Std. Mean Difference (IV, Random, 95% CI) | ‐0.28 [‐0.35, ‐0.20] |
| 1.1 Pregabalin 150 mg/d | 1 | 175 | Std. Mean Difference (IV, Random, 95% CI) | ‐0.10 [‐0.45, 0.24] |
| 1.2 Pregabalin 300 mg/d | 4 | 913 | Std. Mean Difference (IV, Random, 95% CI) | ‐0.24 [‐0.39, ‐0.09] |
| 1.3 Pregabalin 450 mg/d | 4 | 915 | Std. Mean Difference (IV, Random, 95% CI) | ‐0.36 [‐0.51, ‐0.20] |
| 1.4 Pregabalin 600 mg/d | 3 | 751 | Std. Mean Difference (IV, Random, 95% CI) | ‐0.30 [‐0.51, ‐0.09] |
| 1.5 Pregabalin flexible 300 or 450 mg/d | 1 | 498 | Std. Mean Difference (IV, Random, 95% CI) | ‐0.24 [‐0.41, ‐0.06] |
| 2 50% pain reduction Show forest plot | 5 | 3256 | Risk Ratio (IV, Random, 95% CI) | 1.59 [1.33, 1.90] |
| 2.1 Pregabalin 150 mg/d | 1 | 175 | Risk Ratio (IV, Random, 95% CI) | 0.92 [0.39, 2.19] |
| 2.2 Pregabalin 300 mg/d | 4 | 915 | Risk Ratio (IV, Random, 95% CI) | 1.45 [1.03, 2.05] |
| 2.3 Pregabalin 450 mg/d | 4 | 916 | Risk Ratio (IV, Random, 95% CI) | 1.75 [1.23, 2.49] |
| 2.4 Pregabalin 600 mg/d | 3 | 752 | Risk Ratio (IV, Random, 95% CI) | 1.51 [1.04, 2.20] |
| 2.5 Pregabalin flexible 300 mg/d or 450 mg/d | 1 | 498 | Risk Ratio (IV, Random, 95% CI) | 1.88 [1.26, 2.83] |
| 3 Fatigue Show forest plot | 5 | 3195 | Std. Mean Difference (IV, Random, 95% CI) | ‐0.17 [‐0.25, ‐0.09] |
| 3.1 Pregabalin 150 mg/d | 1 | 165 | Std. Mean Difference (IV, Random, 95% CI) | ‐0.20 [‐0.56, 0.15] |
| 3.2 Pregabalin 300 mg/d | 4 | 892 | Std. Mean Difference (IV, Random, 95% CI) | ‐0.16 [‐0.31, ‐0.01] |
| 3.3 Pregabalin 450 mg/d | 4 | 897 | Std. Mean Difference (IV, Random, 95% CI) | ‐0.15 [‐0.30, 0.01] |
| 3.4 Pregabalin 600 mg/d | 3 | 743 | Std. Mean Difference (IV, Random, 95% CI) | ‐0.08 [‐0.25, 0.09] |
| 3.5 Pregabalin flexible 300 or 450 mg/d | 1 | 498 | Std. Mean Difference (IV, Random, 95% CI) | ‐0.31 [‐0.49, ‐0.14] |
| 4 Sleep problems Show forest plot | 5 | 3193 | Std. Mean Difference (IV, Random, 95% CI) | ‐0.35 [‐0.43, ‐0.27] |
| 4.1 Pregabalin 150 mg/d | 1 | 163 | Std. Mean Difference (IV, Random, 95% CI) | ‐0.44 [‐0.80, ‐0.08] |
| 4.2 Pregabalin 300 mg/d | 4 | 897 | Std. Mean Difference (IV, Random, 95% CI) | ‐0.29 [‐0.44, ‐0.14] |
| 4.3 Pregabalin 450 mg/d | 4 | 893 | Std. Mean Difference (IV, Random, 95% CI) | ‐0.45 [‐0.63, ‐0.27] |
| 4.4 Pregabalin 600 mg/d | 3 | 744 | Std. Mean Difference (IV, Random, 95% CI) | ‐0.40 [‐0.57, ‐0.23] |
| 4.5 Pregabalin flexible 300 or 450 mg/d | 1 | 496 | Std. Mean Difference (IV, Random, 95% CI) | ‐0.20 [‐0.37, ‐0.02] |
| 5 Health‐related quality of life Show forest plot | 4 | 2724 | Std. Mean Difference (IV, Random, 95% CI) | ‐0.17 [‐0.26, ‐0.09] |
| 5.1 Pregabalin 300 mg/d | 3 | 738 | Std. Mean Difference (IV, Random, 95% CI) | ‐0.12 [‐0.28, 0.05] |
| 5.2 Pregabalin 450 mg/d | 3 | 737 | Std. Mean Difference (IV, Random, 95% CI) | ‐0.24 [‐0.41, ‐0.07] |
| 5.3 Pregabalin 600 mg/d | 3 | 751 | Std. Mean Difference (IV, Random, 95% CI) | ‐0.14 [‐0.31, 0.02] |
| 5.4 Pregabalin flexible 300 mg/d or 450 mg/d | 1 | 498 | Std. Mean Difference (IV, Random, 95% CI) | ‐0.20 [‐0.37, ‐0.02] |
| 6 Withdrawal due to adverse events Show forest plot | 5 | 3259 | Risk Ratio (IV, Random, 95% CI) | 1.68 [1.36, 2.07] |
| 6.1 Pregabalin 150 mg/d | 1 | 175 | Risk Ratio (IV, Random, 95% CI) | 1.19 [0.35, 4.08] |
| 6.2 Pregabalin 300 mg/d | 4 | 917 | Risk Ratio (IV, Random, 95% CI) | 1.54 [1.02, 2.34] |
| 6.3 Pregabalin 450 mg/d | 4 | 917 | Risk Ratio (IV, Random, 95% CI) | 2.02 [1.32, 3.09] |
| 6.4 Pregabalin 600 mg/d | 3 | 752 | Risk Ratio (IV, Random, 95% CI) | 2.53 [1.65, 3.86] |
| 6.5 Pregabalin flexible 300 mg/d or 450 mg/d | 1 | 498 | Risk Ratio (IV, Random, 95% CI) | 1.01 [0.65, 1.57] |
| 7 Serious adverse events Show forest plot | 4 | 2729 | Risk Ratio (IV, Random, 95% CI) | 1.03 [0.71, 1.49] |
| 7.1 Pregabalin 300 mg/d | 3 | 738 | Risk Ratio (IV, Random, 95% CI) | 0.96 [0.50, 1.86] |
| 7.2 Pregabalin 450 mg/d | 3 | 741 | Risk Ratio (IV, Random, 95% CI) | 1.03 [0.52, 2.03] |
| 7.3 Pregabalin 600 mg/d | 3 | 752 | Risk Ratio (IV, Random, 95% CI) | 1.01 [0.55, 1.87] |
| 7.4 Pregabalin flexible 300 mg/d or 450 mg/d | 1 | 498 | Risk Ratio (IV, Random, 95% CI) | 2.98 [0.31, 28.42] |
| 8 Dizziness Show forest plot | 5 | 3257 | Risk Ratio (IV, Random, 95% CI) | 3.77 [3.06, 4.63] |
| 8.1 Pregabalin 150 mg/d | 1 | 175 | Risk Ratio (IV, Random, 95% CI) | 2.44 [0.91, 6.54] |
| 8.2 Pregabalin 300 mg/d | 4 | 916 | Risk Ratio (IV, Random, 95% CI) | 3.11 [2.09, 4.65] |
| 8.3 Pregabalin 450 mg/d | 4 | 917 | Risk Ratio (IV, Random, 95% CI) | 3.95 [2.68, 5.82] |
| 8.4 Pregabalin 600 mg/d | 3 | 751 | Risk Ratio (IV, Random, 95% CI) | 4.00 [2.65, 6.03] |
| 8.5 Pregabalin flexible 300 mg/d or 450 mg/d | 1 | 498 | Risk Ratio (IV, Random, 95% CI) | 4.89 [2.89, 8.28] |
| 9 30% pain reduction Show forest plot | 5 | 3259 | Risk Ratio (IV, Random, 95% CI) | 1.37 [1.22, 1.53] |
| 9.1 Pregabalin 150 mg/d | 1 | 176 | Risk Ratio (IV, Random, 95% CI) | 1.05 [0.62, 1.77] |
| 9.2 Pregabalin 300 mg/d | 4 | 916 | Risk Ratio (IV, Random, 95% CI) | 1.35 [1.08, 1.68] |
| 9.3 Pregabalin 450 mg/d | 4 | 917 | Risk Ratio (IV, Random, 95% CI) | 1.49 [1.20, 1.85] |
| 9.4 Pregabalin 600 mg/d | 3 | 752 | Risk Ratio (IV, Random, 95% CI) | 1.37 [1.07, 1.76] |
| 9.5 Pregabalin flexible 300 mg/d or 450 mg/d | 1 | 498 | Risk Ratio (IV, Random, 95% CI) | 1.32 [1.04, 1.68] |
| 10 Anxiety Show forest plot | 5 | 3214 | Std. Mean Difference (IV, Random, 95% CI) | ‐0.12 [‐0.20, ‐0.04] |
| 10.1 Pregabalin 150 mg/d | 1 | 166 | Std. Mean Difference (IV, Random, 95% CI) | 0.07 [‐0.28, 0.42] |
| 10.2 Pregabalin 300 mg/d | 4 | 903 | Std. Mean Difference (IV, Random, 95% CI) | ‐0.05 [‐0.20, 0.10] |
| 10.3 Pregabalin 450 mg/d | 4 | 900 | Std. Mean Difference (IV, Random, 95% CI) | ‐0.15 [‐0.30, 0.00] |
| 10.4 Pregabalin 600 mg/d | 3 | 749 | Std. Mean Difference (IV, Random, 95% CI) | ‐0.16 [‐0.32, 0.01] |
| 10.5 Pregabalin flexible 300 mg/d or 450 mg/d | 1 | 496 | Std. Mean Difference (IV, Random, 95% CI) | ‐0.17 [‐0.35, 0.01] |
| 11 Depression Show forest plot | 5 | 3212 | Std. Mean Difference (IV, Random, 95% CI) | ‐0.09 [‐0.16, ‐0.01] |
| 11.1 Pregabalin 150 mg/d | 1 | 165 | Std. Mean Difference (IV, Random, 95% CI) | ‐0.10 [‐0.45, 0.25] |
| 11.2 Pregabalin 300 mg/d | 4 | 902 | Std. Mean Difference (IV, Random, 95% CI) | ‐0.05 [‐0.20, 0.10] |
| 11.3 Pregabalin 450 mg/d | 4 | 900 | Std. Mean Difference (IV, Random, 95% CI) | ‐0.13 [‐0.28, 0.02] |
| 11.4 Pregabalin 600 mg/d | 3 | 749 | Std. Mean Difference (IV, Random, 95% CI) | ‐0.06 [‐0.23, 0.10] |
| 11.5 Pregabalin flexible 300 mg/d or 450 mg/d | 1 | 496 | Std. Mean Difference (IV, Random, 95% CI) | ‐0.09 [‐0.27, 0.08] |
| 12 Disability Show forest plot | 5 | 3145 | Std. Mean Difference (IV, Random, 95% CI) | ‐0.01 [‐0.11, 0.09] |
| 12.1 Pregabalin 150 mg/d | 1 | 166 | Std. Mean Difference (IV, Random, 95% CI) | 0.11 [‐0.24, 0.47] |
| 12.2 Pregabalin 300 mg/d | 4 | 879 | Std. Mean Difference (IV, Random, 95% CI) | 0.04 [‐0.11, 0.20] |
| 12.3 Pregabalin 450 mg/d | 4 | 888 | Std. Mean Difference (IV, Random, 95% CI) | 0.00 [‐0.17, 0.18] |
| 12.4 Pregabalin 600 mg/d | 3 | 714 | Std. Mean Difference (IV, Random, 95% CI) | 0.03 [‐0.14, 0.21] |
| 12.5 Pregabalin flexible 300 mg/d or 450 mg/d | 1 | 498 | Std. Mean Difference (IV, Random, 95% CI) | ‐0.29 [‐0.47, ‐0.12] |
| 13 Patient Global Impression of Change 'much' or 'very much' improved Show forest plot | 5 | 3183 | Risk Ratio (IV, Random, 95% CI) | 1.38 [1.23, 1.55] |
| 13.1 Pregabalin 150 mg/d | 1 | 175 | Risk Ratio (IV, Random, 95% CI) | 1.30 [0.74, 2.29] |
| 13.2 Pregabalin 300 mg/d | 4 | 886 | Risk Ratio (IV, Random, 95% CI) | 1.25 [0.99, 1.57] |
| 13.3 Pregabalin 450 mg/d | 4 | 892 | Risk Ratio (IV, Random, 95% CI) | 1.54 [1.15, 2.06] |
| 13.4 Pregabalin 600 mg/d | 3 | 734 | Risk Ratio (IV, Random, 95% CI) | 1.37 [1.06, 1.76] |
| 13.5 Pregabalin flexible 300 mg/d or 450 mg/d | 1 | 496 | Risk Ratio (IV, Random, 95% CI) | 1.44 [1.11, 1.87] |