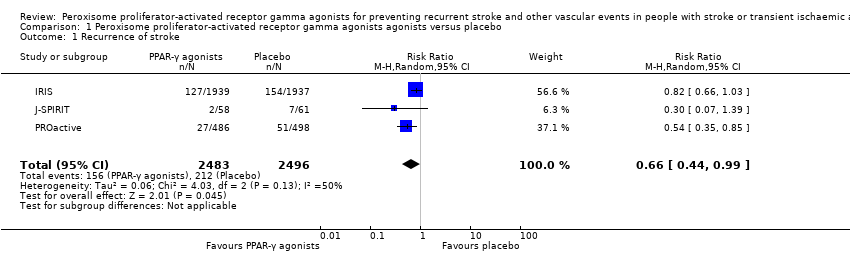
Scolaris Content Display Scolaris Content Display

Study flow diagram.
Figures and Tables -
Figure 1

Study flow diagram.

'Risk of bias' summary: review authors' judgements about each risk of bias item for each included study.
Figures and Tables -
Figure 2

'Risk of bias' summary: review authors' judgements about each risk of bias item for each included study.

'Risk of bias' graph: review authors' judgements about each risk of bias item presented as percentages across all included studies.
Figures and Tables -
Figure 3

'Risk of bias' graph: review authors' judgements about each risk of bias item presented as percentages across all included studies.

Comparison 1 Peroxisome proliferator‐activated receptor gamma agonists agonists versus placebo, Outcome 1 Recurrence of stroke.
Figures and Tables -
Analysis 1.1

Comparison 1 Peroxisome proliferator‐activated receptor gamma agonists agonists versus placebo, Outcome 1 Recurrence of stroke.

Comparison 1 Peroxisome proliferator‐activated receptor gamma agonists agonists versus placebo, Outcome 2 Reported adverse events.
Figures and Tables -
Analysis 1.2

Comparison 1 Peroxisome proliferator‐activated receptor gamma agonists agonists versus placebo, Outcome 2 Reported adverse events.

Summary of findings for the main comparison. Peroxisome proliferator‐activated receptor gamma agonists for preventing recurrent stroke and other vascular events in people with stroke or transient ischaemic attack

Peroxisome proliferator‐activated receptor gamma (PPAR‐γ) agonists for preventing recurrent stroke and other vascular events in people with stroke or transient ischaemic attack

Patient or population: people with stroke or transient ischaemic attack

Settings: inpatients

Intervention: PPAR‐γ agonists

Comparison: placebo

Outcomes

Illustrative comparative risks* (95% CI)

Relative effect
(95% CI)

No. of participants
(studies)

Quality of the evidence
(GRADE)

Comments

Assumed risk

Corresponding risk

Placebo

PPAR‐γ agonists

Recurrence of stroke

Follow‐up: 25 to 57.6 months

85 per 1000

56 per 1000

(37 to 84)

RR 0.66 (0.44 to 0.99)

4979
(3 studies)

⊕⊕⊕⊝
Moderate¹

Reported adverse events

Follow‐up: 3 to 34.5 months

492 per 1000

502 per 1000

(412 to 530)

RD 0.10 (‐0.08 to 0.28)

1044
(3 studies)

⊕⊕⊝⊝
Low²

Serious vascular events

For the total events of all‐cause death, non‐fatal myocardial infarction, acute coronary syndrome and cardiac intervention, stroke, major leg amputation, or bypass surgery or leg revascularisation, there were 126 of 498 (25%). For the total events of all‐cause death, non‐fatal myocardial infarction or non‐fatal stroke, there were 98 of 498 (20%).

For the total events of all‐cause death, non‐fatal myocardial infarction, acute coronary syndrome and cardiac intervention, stroke, major leg amputation, or bypass surgery or leg revascularisation, there were 98 of 486 (20%). For the total events of all‐cause death, non‐fatal myocardial infarction or non‐fatal stroke, there were 76 of 486 (16%).

For the total events of all‐cause death, non‐fatal myocardial infarction, acute coronary syndrome and cardiac intervention, stroke, major leg amputation, or bypass surgery or leg revascularisation (RR 0.80, 95% CI 0.63 to 1.01). For the total events of all‐cause death, non‐fatal myocardial infarction or non‐fatal stroke (RR 0.79, 95% CI 0.61 to 1.04). Pioglitazone reduced fatal or non‐fatal stroke (RR 0.54, 95% CI 0.35 to 0.85) and total events of cardiovascular death, non‐fatal myocardial infarction or non‐fatal stroke (RR 0.73, 95% CI 0.54 to 0.99).

984
(1 study)

⊕⊕⊝⊝
Low³

Pioglitazone reduced fatal or non‐fatal stroke and total events of cardiovascular death, non‐fatal myocardial infarction or non‐fatal stroke.

Deaths due to vascular events

Not reported

Not reported

Disability due to vascular events

Not reported

Not reported

Improvement in quality of life

Not reported

Not reported

Insulin sensitivity

Assessed with composite insulin sensitivity index

The change in the composite index was ‐0.1 ± 0.6. The C‐reactive protein concentration increased from 0.41 to 0.45 mg/L.

The change in the composite index was 1.2 ± 0.6. The C‐reactive protein concentration declined from 0.30 to 0.20 mg/L.

The change in the composite index was significantly increased in the pioglitazone group in comparison with the placebo group (P = 0.0003).

20
(1 study)

⊕⊕⊝⊝
Low³

Ubiquitin‐proteasome activity in carotid plaques

Ubiquitin 468.7 ± 89 ng/mg; proteasome 20S 79.8 ± 25 pmol/mg; nitrotyrosine 3.5 ± 0.42 nmol/pg; superoxide anion production 6.26 ± 1.4 pmol/L

Ubiquitin 322 ± 79 ng/mg; proteasome 20S 46.8 ± 10 pmol/mg; nitrotyrosine 2.2 ± 0.21 nmol/pg; superoxide anion production 3.57 ± 1.1 pmol/L

Compared with the placebo group, symptomatic carotid plaques in the rosiglitazone group showed fewer inflammatory cells (P < 0.01) with less ubiquitin (P < 0.01), proteasome 20S (P < 0.01), nuclear factor kappa B (P < 0.01), nitrotyrosine (P < 0.01), superoxide anion production (P < 0.01), and more collagen content (P < 0.01).

40
(1 study)

⊕⊕⊝⊝
Low³

*The basis for the assumed risk (e.g. the median control group risk across studies) is provided in footnotes. The corresponding risk (and its 95% confidence interval) is based on the assumed risk in the comparison group and the relative effect of the intervention (and its 95% CI).
CI: confidence interval; RD: risk difference; RR: risk ratio

GRADE Working Group grades of evidence
High quality: Further research is very unlikely to change our confidence in the estimate of effect.
Moderate quality: Further research is likely to have an important impact on our confidence in the estimate of effect and may change the estimate.
Low quality: Further research is very likely to have an important impact on our confidence in the estimate of effect and is likely to change the estimate.
Very low quality: We are very uncertain about the estimate.

1Downgraded one level due to risk of bias.
2Downgraded one level due to risk of bias and one level due to inconsistency of results.
3Downgraded one level due to risk of bias and one level due to imprecision (small number of participants).

Figures and Tables -
Summary of findings for the main comparison. Peroxisome proliferator‐activated receptor gamma agonists for preventing recurrent stroke and other vascular events in people with stroke or transient ischaemic attack
Comparison 1. Peroxisome proliferator‐activated receptor gamma agonists agonists versus placebo

Outcome or subgroup title

No. of studies

No. of participants

Statistical method

Effect size

1 Recurrence of stroke Show forest plot

3

4979

Risk Ratio (M‐H, Random, 95% CI)

0.66 [0.44, 0.99]

2 Reported adverse events Show forest plot

3

1044

Risk Difference (M‐H, Random, 95% CI)

0.10 [‐0.08, 0.28]

Figures and Tables -
Comparison 1. Peroxisome proliferator‐activated receptor gamma agonists agonists versus placebo