Tratamiento quirúrgico versus no quirúrgico para el empiema pleural
Information
- DOI:
- https://doi.org/10.1002/14651858.CD010651.pub2Copy DOI

- Database:
-
- Cochrane Database of Systematic Reviews
- Version published:
-
- 17 March 2017see what's new
- Type:
-
- Intervention
- Stage:
-
- Review
- Cochrane Editorial Group:
-
Cochrane Acute Respiratory Infections Group
- Copyright:
-
- Copyright © 2017 The Cochrane Collaboration. Published by John Wiley & Sons, Ltd.
Article metrics
Altmetric:
Cited by:
Authors
Contributions of authors
Tze Yang Chin and Mark Redden conducted the searches, extracted data, and drafted the review under the guidance of Mieke van Driel. All review authors read and approved the final draft.
Sources of support
Internal sources
-
No funding support received, Other.
External sources
-
No funding support received, Other.
Declarations of interest
Mark Redden: None known.
Tze Yang Chin: None known.
Mieke van Driel: None known.
Acknowledgements
We would like to acknowledge the previous authors of this review, Nicky Coote and Elspeth Kay. We also thank Sarah Thorning, Information Specialist for the Cochrane Acute Respiratory Infections Group, for designing the search strategy and conducting the searches for this review, and Liz Dooley, Managing Editor of the Cochrane Acute Respiratory Infections Group, for her guidance throughout the publication process. We thank Lars Eriksson, librarian at the University of Queensland, for conducting the search updates. We thank Dr Charlie C‐T Hsu for his advice on interpretation of the review findings. We thank the following people for commenting on the draft of the protocol: Amy Zelmer, Mario Kopljar, Craig Mellis, Nelcy Rodrigues, and Meenu Singh. Finally, we thank the following people for commenting on the draft of this review: Janet Yarrow, Devi Prasad Mohapatra, Craig Mellis, Hiren Mehta, Robert Ware, and Meenu Singh.
Version history
| Published | Title | Stage | Authors | Version |
| 2017 Mar 17 | Surgical versus non‐surgical management for pleural empyema | Review | Mark D Redden, Tze Yang Chin, Mieke L van Driel | |
| 2013 Jul 15 | Surgical versus non‐surgical management for pleural empyema | Protocol | Tze Yang Chin, Mark D Redden, Charlie C‐T Hsu, Mieke L van Driel | |
Differences between protocol and review
We replaced the planned subgroup analysis for trials involving the use of intrapleural fibrinolytic therapy with a sensitivity analysis exploring the same topic.
We rewrote the review objective from “To assess the validity of surgical versus procedural interventions for CPPE or pleural empyema” to “To assess the effectiveness and safety of surgical versus non‐surgical treatments for complicated parapneumonic effusion or pleural empyema”. This was done to capture both the effectiveness and safety of the interventions investigated.
Keywords
MeSH
Medical Subject Headings (MeSH) Keywords
Medical Subject Headings Check Words
Adult; Child; Humans;
PICOs

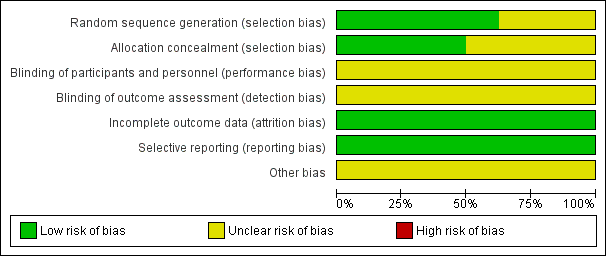
Risk of bias graph: review authors' judgements about each risk of bias item presented as percentages across all included studies.
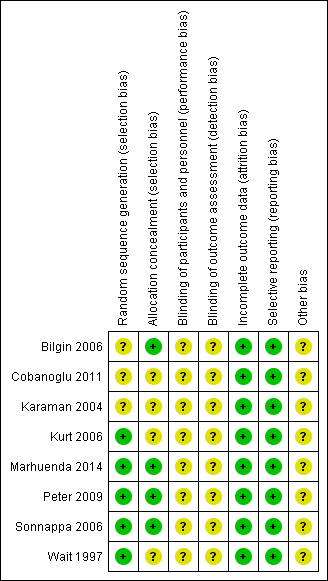
Risk of bias summary: review authors' judgements about each risk of bias item for each included study.
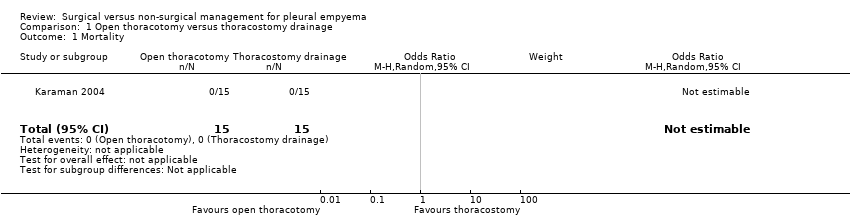
Comparison 1 Open thoracotomy versus thoracostomy drainage, Outcome 1 Mortality.

Comparison 1 Open thoracotomy versus thoracostomy drainage, Outcome 2 Length of hospital stay (days).

Comparison 1 Open thoracotomy versus thoracostomy drainage, Outcome 3 Procedural complications.
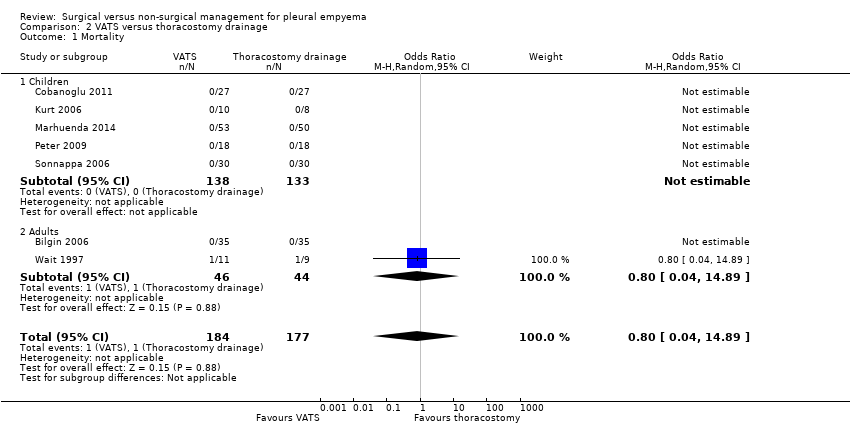
Comparison 2 VATS versus thoracostomy drainage, Outcome 1 Mortality.
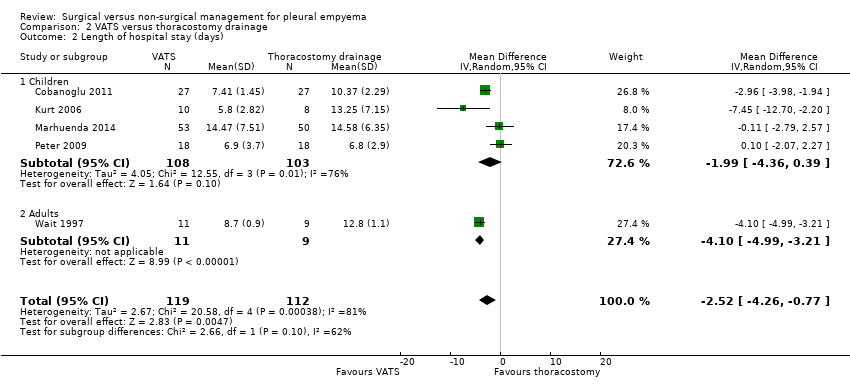
Comparison 2 VATS versus thoracostomy drainage, Outcome 2 Length of hospital stay (days).
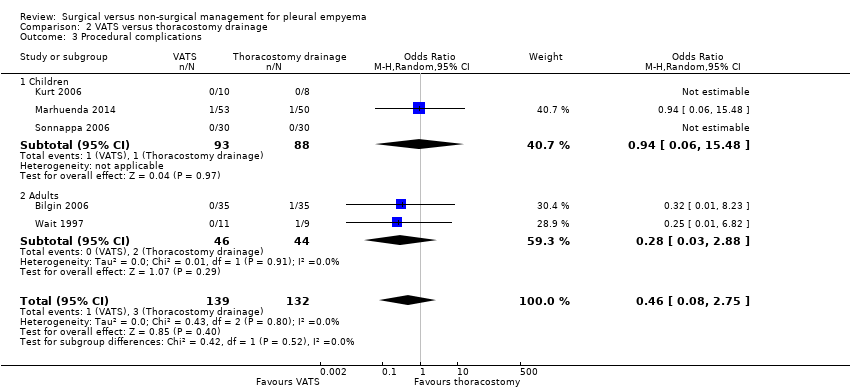
Comparison 2 VATS versus thoracostomy drainage, Outcome 3 Procedural complications.
| Open thoracotomy compared to thoracostomy drainage for pleural empyema | ||||||
| Patient or population: children with pleural empyema | ||||||
| Outcomes | Anticipated absolute effects* (95% CI) | Relative effect | № of participants | Quality of the evidence | Comments | |
| Thoracostomy drainage | Open thoracotomy | |||||
| Mortality Follow‐up: up to 3 months after discharge | Risk in study population | Not estimable | 30 | ⊕⊕⊕⊝ | No deaths occurred in either group. | |
| — | — | |||||
| Length of hospital stay (days) Follow‐up: up to 3 months after discharge | The mean length of hospital stay in the control group was 15.4 days. | The mean length of hospital stay in the intervention group was 5.9 days fewer (7.29 fewer to 4.51 fewer). | — | 30 | ⊕⊕⊕⊝ | |
| Procedural complications Follow‐up: up to 3 months after discharge | Risk in study population | OR 0.10 | 30 | ⊕⊕⊕⊝ | ||
| 600 per 1000 | 130 per 1000 | |||||
| *The risk in the intervention group (and its 95% confidence interval) is based on the assumed risk in the comparison group and the relative effect of the intervention (and its 95% CI). | ||||||
| GRADE Working Group grades of evidence | ||||||
| 1Downgraded one level due to small sample size and only one study. | ||||||
| VATS compared to thoracostomy drainage for pleural empyema | ||||||
| Patient or population: children and adults with pleural empyema | ||||||
| Outcomes | Anticipated absolute effects* (95% CI) | Relative effect | № of participants | Quality of the evidence | Comments | |
| Thoracostomy drainage | VATS | |||||
| Mortality | Risk in study population | OR 0.80 | 361 | ⊕⊕⊝⊝ | Data only for adults | |
| 6 per 1000 | 5 per 1000 | |||||
| Mortality: children | Risk in study population | Not estimable | 271 | ⊕⊕⊕⊝ | No deaths occurred in either group. | |
| Not pooled | Not pooled | |||||
| Mortality: adults Follow‐up: not reported | Risk in study population | OR 0.80 | 90 | ⊕⊕⊕⊝ | No deaths occurred in Bilgin 2006. Data based on Wait 1997 | |
| 23 per 1000 | 18 per 1000 | |||||
| Length of hospital stay (days) Follow‐up: 1 year in Cobanoglu 2011 and 3 months in Marhuenda 2014 | Control group | The mean length of hospital stay in the intervention group was 2.52 days fewer (4.26 fewer to 0.77 fewer). | — | 231 | ⊕⊕⊕⊝ | Note: Follow‐up period not reported in Kurt 2006; Peter 2009; Wait 1997. |
| Procedural complications Follow‐up: 6 months in Bilgin 2006 and not reported in Wait 1997 | Risk in study population | OR 0.46 | 271 | ⊕⊕⊕⊝ | ||
| 23 per 1000 | 11 per 1000 | |||||
| *The risk in the intervention group (and its 95% confidence interval) is based on the assumed risk in the comparison group and the relative effect of the intervention (and its 95% CI). | ||||||
| GRADE Working Group grades of evidence | ||||||
| 1Downgraded two levels due to wide confidence intervals (data from only one study) and indirectness (data only available for adults). | ||||||
| Trial | Total treatment cost (USD): | Total treatment cost (USD): | P value |
| Mean 386.672 ± 72.06 | Mean 957.487 ± 137.238 | < 0.001 | |
| Median (IQR) 21,947 (17,895 to 37,458) | Median (IQR) 19,714 (17,325 to 23,000) | 0.315 | |
| Mean 9127 | Mean 11,379 | < 0.001 | |
| Mean 7600 ± 5400 | Mean 11,700 ± 2900 | 0.02 | |
| Mean 24,052 ± 3466 | Mean 16,642 ± 2841 | 0.11 | |
| IQR: interquartile range | |||
| Trial | Duration of chest tube | Duration of chest tube drainage: | P value |
| Mean 9.48 ± 2.50 | Mean 6.56 ± 1.55 | < 0.001 | |
| Mean 13.8 ± 2.3 | Mean 7.5 ± 1.1 | < 0.05 | |
| Mean 9.63 ± 5.45 | Mean 2.80 ± 0.63 | < 0.001 | |
| Median (IQR) 5 (4 to 6) | Median (IQR) 4 (3 to 5) | < 0.001 | |
| Mean 9.8 ± 1.3 | Mean 5.8 ± 1.1 | 0.03 | |
| IQR: interquartile range | |||
| Trial | Postintervention fever duration: | Postintervention fever | P value |
| Mean 3.9 ± 2.1 | Mean 3.4 ± 2.4 | 0.782 | |
| Mean 6.25 ± 4.10 | Mean 3.60 ± 2.95 | 0.146 | |
| Median (IQR) 6 (3 to 7) | Median (IQR) 4 (2 to 7) | 0.62 | |
| Median (range) 2.5 (0 to 25) | Median (range) 2.5 (0 to 10) | 0.635 | |
| Mean 3.8 ± 2.9 | Mean 3.1 ± 2.7 | 0.46 | |
| IQR: interquartile range | |||
| Outcome or subgroup title | No. of studies | No. of participants | Statistical method | Effect size |
| 1 Mortality Show forest plot | 1 | 30 | Odds Ratio (M‐H, Random, 95% CI) | 0.0 [0.0, 0.0] |
| 2 Length of hospital stay (days) Show forest plot | 1 | 30 | Mean Difference (IV, Random, 95% CI) | ‐5.9 [‐7.29, ‐4.51] |
| 3 Procedural complications Show forest plot | 1 | 30 | Odds Ratio (M‐H, Random, 95% CI) | 0.10 [0.02, 0.63] |
| Outcome or subgroup title | No. of studies | No. of participants | Statistical method | Effect size |
| 1 Mortality Show forest plot | 7 | 361 | Odds Ratio (M‐H, Random, 95% CI) | 0.8 [0.04, 14.89] |
| 1.1 Children | 5 | 271 | Odds Ratio (M‐H, Random, 95% CI) | 0.0 [0.0, 0.0] |
| 1.2 Adults | 2 | 90 | Odds Ratio (M‐H, Random, 95% CI) | 0.8 [0.04, 14.89] |
| 2 Length of hospital stay (days) Show forest plot | 5 | 231 | Mean Difference (IV, Random, 95% CI) | ‐2.52 [‐4.26, ‐0.77] |
| 2.1 Children | 4 | 211 | Mean Difference (IV, Random, 95% CI) | ‐1.99 [‐4.36, 0.39] |
| 2.2 Adults | 1 | 20 | Mean Difference (IV, Random, 95% CI) | ‐4.10 [‐4.99, ‐3.21] |
| 3 Procedural complications Show forest plot | 5 | 271 | Odds Ratio (M‐H, Random, 95% CI) | 0.46 [0.08, 2.75] |
| 3.1 Children | 3 | 181 | Odds Ratio (M‐H, Random, 95% CI) | 0.94 [0.06, 15.48] |
| 3.2 Adults | 2 | 90 | Odds Ratio (M‐H, Random, 95% CI) | 0.28 [0.03, 2.88] |