Ciclo natural en la fecundación in vitro (FIV) para parejas subfértiles
References
References to studies included in this review
References to studies excluded from this review
References to ongoing studies
Additional references
Characteristics of studies
Characteristics of included studies [ordered by study ID]
Jump to:
| Methods | Multicentre randomised controlled trial (17 centres in the Netherlands): trial acronym INeS 603 couples randomised, of whom 395 were randomised to comparisons of interest in current review Conducted Jan 2009 to Feb 2011 Follow‐up 12 months | |
| Participants | Included: Couples with female aged between 18 and 38 years, diagnosed with unexplained or mild male subfertility, failure to conceive within at least 12 months of unprotected intercourse and a poor prognosis. A poor prognosis was defined as a chance of spontaneous pregnancy within 12 months below 30% or failure to conceive within at least 3 years of unprotected intercourse. Mild male subfertility was defined as pre‐wash total motile sperm count above 10 million or a post‐wash total motile sperm count above 1 million Excluded: Women with PCOS/anovulatory cycles, severe endometriosis, double sided tubal pathology or serious endocrine illness | |
| Interventions | 1. Modified natural cycle (MNC) IVF x six cycles: the oocyte that developed spontaneously was used for IVF, minimally modified with a GnRH antagonist to prevent untimely ovulations, together with FSH to prevent collapse of the follicle When a lead follicle with a mean diameter of at least 14 mm was observed, daily injections of 0.25 mg of a GnRH‐antagonist together with 150 IU FSH were started. GnRH‐antagonist was continued up to and including the day of ovulation triggering. FSH was continued up to the day of ovulation triggering (n=195 randomised, 194 analysed) 2. IVF with elective single‐embryo transfer (SET) x 3 cycles, plus cryo‐cycles within 12 months. Controlled ovarian hyperstimulation after down‐regulation with a GnRH agonist in a long protocol with a mid luteal start or with a fixed start antagonist protocol starting on day two. Controlled ovarian hyperstimulation was started with 150 IU FSH. Treatment was continued until at least 2 follicles > 18mm had developed. Ovulation was induced by 10.000 IU human chorionic gonadotropin hormone (hCG). (n=203 randomised, 201 analysed) Findings were evaluated over one year of follow up, within which time some women in each group underwent cycles in addition to their allocated treatment, as follows: 1. MNC‐IVF group (n=194) Allocated treatment: MNC‐IVF 640 cycles Additional treatment: IUI 58 cycles, IVF MNC/SET/double embryo transfer (DET): 34 cycles, IVF SET 34 cycles, IVF DET<7 cycles, cryo cycles: 9 2. IVF‐SET group (n=201) Allocated treatment: IVF‐SET 303 cycles, frozen cycles 147, Additional treatment: IUI cycles 35, IVF MNC/SET/DET 4 cycles, IVF SET 1 cycle [3. The study also included a group undergoing IUI with COH x 6 cycles (n=207 randomised, 207 analysed). This group were not included in the current review] | |
| Outcomes | Birth of healthy singleton (term, birth weight >5th percentile, no congenital anomalies, normal development up to 6 weeks), multiple pregnancy, clinical pregnancy, ongoing pregnancy, time to pregnancy, neonatal and pregnancy complications, cost‐effectiveness | |
| Notes | Funding: Netherlands Organization for Health Research and Development (ZonMw) and Zorgverzekeraars Nederland (ZN) In this review we reported data from the 2013 ESHRE slide presentation, which are 95% complete. Follow up is incomplete for 7/194 in the MNC group and 8/201 in the standard IVF group. | |
| Risk of bias | ||
| Bias | Authors' judgement | Support for judgement |
| Random sequence generation (selection bias) | Low risk | Central internet‐based randomisation programme |
| Allocation concealment (selection bias) | Low risk | Central internet‐based randomisation programme |
| Blinding of participants and personnel (performance bias) | Low risk | The outcomes are not likely to be influenced by any lack of blinding |
| Blinding of outcome assessment (detection bias) | Low risk | The outcomes are not likely to be influenced by any lack of blinding |
| Incomplete outcome data (attrition bias) | Low risk | Analysed by ITT. Incomplete follow‐up for 7/194 in MNC group and 8/201 in standard IVF group (4%) |
| Selective reporting (reporting bias) | Unclear risk | Reported only in abstract/slide presentation so far and not all outcomes reported yet (numbers inconsistent between the presentations) |
| Other bias | Low risk | Baseline characteristics of two groups were similar. Reported only as abstract/slide presentation but no evidence of likely bias |
| Methods | Randomised controlled trial (block randomisation, five patients in each block) Performed between August 1 and December 31, 1997 Informed consent obtained | |
| Participants | Fertility Clinic and Perinatal Epidemiological Research Unit, Department of Obstetrics and Gynaecology, Aarhun University Hospital, Skejby Sygehus, Aarhus, Denmark As stated in the article: among 564 couples waiting for IVF or ICSO treatment, 196 were invited to participate in the study, fulfilling the following criteria: female age < 35, unexplained infertility, tubal factor or due to severe male factor with indication for ICSI, regular menstrual cycle, presence of two ovaries and no previous IVF treatment. Of these, 29 did not respond, 35 were enrolled in a pilot study so 132 couples participated in the present study. Unstimulated group:
Clomiphene citrate group:
| |
| Interventions | Unstimulated cycle IVF versus stimulated cycle IVF Unstimulated cycle group (64) received no treatment. When the dominant follicle reached a diameter of ≥17 mm, HCG (Pregnyl®; 5000 IU) was given for a timed oocyte retrieval 35 ‐ 36 hours later. The stimulated group (68) received clomiphene citrate (Clomivid®; Astra, Denmark) 100 mg from cycle day 3‐7. When the dominant follicle reached a diameter ≥ 20 mm, HCG (Pregnyl®; 5000 IU) was given for a timed oocyte retrieval 35 ‐ 36 hours later. | |
| Outcomes | Oocyte aspiration Oocyte harvested Oocytes fertilised Cycles with embryo transfer Total number of embryos transferred Live intrauterine pregnancy rate per started cycle Live intrauterine pregnancy rate per embryo transfer Implantation rate. | |
| Notes | Author was unable to provide additional information, contact author again for update. | |
| Risk of bias | ||
| Bias | Authors' judgement | Support for judgement |
| Random sequence generation (selection bias) | Unclear risk | Block randomisation was used, with five patients in each block. Does not state method of randomisation |
| Allocation concealment (selection bias) | Unclear risk | A sealed envelope method was used, does not state opaque |
| Blinding of participants and personnel (performance bias) | Low risk | The outcomes are not likely to be influenced by any lack of blinding |
| Blinding of outcome assessment (detection bias) | Low risk | The outcome measurement is not likely to be influenced by any lack of blinding |
| Incomplete outcome data (attrition bias) | High risk | Results of 35 pilot patients are not reported |
| Selective reporting (reporting bias) | Unclear risk | No protocol available |
| Other bias | Low risk | No other sources of bias were found |
| Methods | Prospective randomised crossover study | |
| Participants | George Washington University Medical Center, Washington, DC As stated in the abstract, 31 IVF‐ET candidates with regular ovulatory menstrual cycles and no male factor have enrolled thus far | |
| Interventions | Natural cycle versus stimulated cycle IVF In the natural cycle, 4000 IU hCG was given in an effort to precede the endogenous LH surge In the stimulated cycle, luteal phase initiated GnRH suppression was followed by human menopausal gonadotropin (10.000 IU) administration | |
| Outcomes | Pregnancy rates, cancellation rates, oocyte retrieval and fertilisation rate | |
| Notes | Stated as ongoing. Attempts to contact any of the authors failed. | |
| Risk of bias | ||
| Bias | Authors' judgement | Support for judgement |
| Random sequence generation (selection bias) | Unclear risk | Does not state method of randomisation. No further information obtained |
| Allocation concealment (selection bias) | Unclear risk | Method not stated |
| Blinding of participants and personnel (performance bias) | Low risk | The outcomes are not likely to be influenced by any lack of blinding |
| Blinding of outcome assessment (detection bias) | Low risk | The outcome measurement is not likely to be influenced by any lack of blinding |
| Incomplete outcome data (attrition bias) | Low risk | Thirty‐one patients included, 16 patients underwent natural cycle and 13 underwent the stimulated cycle; 2 patients are missing; 94% of participants included in analysis |
| Selective reporting (reporting bias) | Unclear risk | No protocol available |
| Other bias | Low risk | No other sources of bias were found |
| Methods | Prospective, randomised controlled trial Performed between August 2006 and April 2008 Informed consent obtained Sixty women randomised | |
| Participants | Ruijin Hospital, Shanghai, China Inclusion criteria as stated:
| |
| Interventions | Modified natural cycle IVF versus controlled ovarian hyperstimulation IVF The modified natural cycle treatment as stated: If the serum estradiol concentration was < 50 pg/ml, HMG 150 IU/day was given IM, by a nurse or doctor, starting on the third day of the menstrual cycle; patients whose serum estradiol concentration was > 50 pg/ml were removed from the study. The number and size of ovarian follicles in were monitored by transvaginal ultrasonography on the second day of stimulation. No gonadotrophin agonist or antagonist was given at any time during the treatment cycle. The COH treatment as stated: A GNRH agonist (triptorelin 0.1 mg/day SC) was self‐administered by the patients from day 21 of the menstrual cycle (7 days after ovulation), before the IVF cycle. Recombinant FSH (Gonal‐F®; Merck Sereno, Geneva, Switzerland) 150 – 300 IU/day was then self administered by the patients from day 2 of the menstrual cycle, at which time the dose of GNRH agonist was reduced to 0.05 mg/day. On the second day of the menstrual cycle and on alternate days subsequently, the number and size of ovarian follicles in the patients were monitored by transvaginal ultrasonography and measurement of serum estradiol was carried out. The daily dose of recombinant FSH was adjusted according to the serum estradiol level and the number and size of ovarian follicles. If the rate of development follicles was greater or less than expected, the FSH dose was decreased or increased, respectively, by 75 IU/day. In both groups, HCG 10000 IU was administered at a predetermined time of the day on which two or more follicles ≥ 17 mm in diameter | |
| Outcomes | Implantation rate Clinical pregnancy rate Successful pregnancies Number of oocytes retrieved Medication cost | |
| Notes | No additional data from the author were obtained. | |
| Risk of bias | ||
| Bias | Authors' judgement | Support for judgement |
| Random sequence generation (selection bias) | Low risk | Computer generated set of random numbers |
| Allocation concealment (selection bias) | Unclear risk | Method not stated |
| Blinding of participants and personnel (performance bias) | Low risk | The outcomes are not likely to be influenced by any lack of blinding |
| Blinding of outcome assessment (detection bias) | Low risk | The outcome measurement is not likely to be influenced by any lack of blinding |
| Incomplete outcome data (attrition bias) | Low risk | No missing outcome data |
| Selective reporting (reporting bias) | Unclear risk | No protocol available |
| Other bias | Low risk | No other sources of bias were found |
| Methods | Randomised controlled trial Informed consent obtained | |
| Participants | Hallam Medical Centre, The London Women’s Clinic, The Middlesex Hospital and King’s College Hospital, London, United Kingdom 30 patients with the following inclusion criteria:
| |
| Interventions | Natural cycle versus clomiphene citrate stimulated cycles The natural cycle group (n=14) received no treatment, whereas the clomiphene citrate group received 100 mg during cycle day 2‐6. All patients had an ultrasound scan (US) on day 2 and 7, followed by daily scans once the leading follicle reached a size of 14 mm in diameter. Serum LH and E2 concentrations were measured daily from day 7 of the cycle. When the mean diameter of the dominant follicle reached 17 mm, hCG, 5000 IU, was administered and US‐directed oocyte collection was performed 35 hour later. | |
| Outcomes | Number of patients reaching oocyte recovery Numbers of oocytes collected and fertilised Embryos transferred Clinical pregnancy rate Multiple pregnancy rate | |
| Notes | Author stated: patients were randomised using computer generated numbers to assign patients to treatment arm with concealment in brown sealed opaque envelopes. | |
| Risk of bias | ||
| Bias | Authors' judgement | Support for judgement |
| Random sequence generation (selection bias) | Low risk | Computer selected random numbers were used |
| Allocation concealment (selection bias) | Low risk | After contacting the author, she stated the use of 'brown paper opaque envelopes that were numbered individually' |
| Blinding of participants and personnel (performance bias) | Low risk | The outcomes are not likely to be influenced by any lack of blinding |
| Blinding of outcome assessment (detection bias) | Low risk | The outcome measurement is not likely to be influenced by any lack of blinding |
| Incomplete outcome data (attrition bias) | Low risk | No missing outcome data |
| Selective reporting (reporting bias) | Unclear risk | No protocol available |
| Other bias | Low risk | No other sources of bias were found |
| Methods | Randomised controlled trial Performed between January 2000 and July 2002 Informed consent received | |
| Participants | Bioroma Center, Rome, Italy One hundred and forty women with the following inclusion criteria:
| |
| Interventions | Natural cycle IVF versus IVF with controlled ovarian hyperstimulation The natural cycle treatment as stated: The follicle size was monitored by transvaginal ultrasound scan daily from the 7th day of the cycle to measure follicular structures and endometrial thickness and morphology. When a follicle reached 16 mm in diameter, ovulation was triggered with hCG, 10,000 IU (Profasi HP 5000, Serono, Italy). The COH treatment as stated: Patients undergoing controlled ovarian hyperstimulation with the microdose GnRH analog flare protocol group were treated with 0.05 mg buserelin (Suprefact; Hoechst, Berlin, Germany) SC twice daily from the 1st day of the menstrual cycle and FSH, 600 IU (Metrodin HP, Serono, Italy) daily from the 3rd day of the menstrual cycle. Follicle size was measured daily by ultrasound and plasma levels of E2 were measured from the 7th day of stimulation. From this stage, the dose of pFSH was adjusted, depending on the individual response of each patient. When at least 2 follicles reached 16 mm in diameter, ovulation was triggered with hCG, 10,000 IU (Profasi HP 5000, Serono, Italy). | |
| Outcomes | Number of oocytes retrieved Pregnancy rate per cycle Pregnancy rate per transfer Implantation rate | |
| Notes | Author stated: For randomisation we used a list of random numbers in sealed opaque envelopes given to patients Re‐analysis was required for data per woman Pregnancy rate: Out of 59 NC patients, 40.7% had a transfer so (59 x 40.7) / 100% = 24 transfers Out of 24 transfers, 4.2% got pregnant so (24 x 4.2) / 100% = 1 pregnancy in NC Out of 70 COH patients, 71.4% had a transfer so (70 x 71.4) / 100% = 50 transfers Out of 50 transfers, 4.0% got pregnant so (50 x 4.0) / 100% = 2 pregnancies in COH Cycle cancellation: Out of 59 NC patients, 72.9% had an oocyte retrieval; therefore we assume 27.1% had a cycle cancellation. So (59 x 27.1) / 100% = 16 cycle cancellations for NC Out of 70 COH patients, 82.8% had an oocyte retrieval; therefore we assume 17.2% had a cycle cancellation. So (70 x 17.2) / 100% = 12 cycle cancellations for COH | |
| Risk of bias | ||
| Bias | Authors' judgement | Support for judgement |
| Random sequence generation (selection bias) | Low risk | The patients were randomised according to a computer generated number sequence at the time that their cycle was scheduled |
| Allocation concealment (selection bias) | Low risk | After contacting the author, he stated the use of a 'list of random numbers in sealed, opaque envelopes given to patients' |
| Blinding of participants and personnel (performance bias) | Low risk | The outcomes are not likely to be influenced by any lack of blinding |
| Blinding of outcome assessment (detection bias) | Low risk | The outcome measurement is not likely to be influenced by any lack of blinding |
| Incomplete outcome data (attrition bias) | High risk | Seventy women were randomly allocated to each group: 11 women assigned to the natural‐cycle group refused the randomization and chose another treatment. Thus attrition rate of 16% in one group |
| Selective reporting (reporting bias) | Unclear risk | No protocol available |
| Other bias | Low risk | No other sources of bias were found |
Characteristics of excluded studies [ordered by study ID]
Jump to:
| Study | Reason for exclusion |
| This is a cohort study | |
| This is a cohort study | |
| Not a comparison of interest; study compares assisted hatching versus no assisted hatching | |
| This publication is a study protocol. It compares NC‐frozen thawed embryo transfer (FET) versus artificial cycle (AC)‐FET, not a comparison of interest | |
| This is a retrospective study | |
| Consecutive women were used, so not a randomised controlled trial | |
| Study compares 2 stimulation protocols: clomiphene citrate/gonadotropin/antagonist versus microdose GnRH agonist flare protocols, so not a comparison of interest | |
| This study compares 2 different stimulation protocols: minimal stimulation using the GnRH antagonist cetrorelix and 150 IU recombinant human FSH (rhFSH; Gonal‐F, Merck Serono SA) versus FSH 225 IU/day in combination with cetrorelix (Cetrotide) 0.25 mg/day when the mean diameter of the lead follicle reached 13 to14 mm | |
| This is a retrospective study | |
| This study included females of proven fertility, so not a study population of interest. The outcome measures are in gene expression, so no outcomes of interest | |
| This is a study on unstimulated cycle IVF, not a comparison of interest | |
| This study uses questionnaires, so it is not a randomised controlled trial | |
| This study compares 2 stimulation protocols, clomiphene citrate in combination with FSH versus the standard long IVF protocol with a GnRH agonist, so not a comparison of interest | |
| This is a review of the literature on natural cycle IVF | |
| Treatments were assigned to patients according to admission date, so not a randomised controlled trial | |
| This study compares two different stimulation protocols, an ultrashort gonadotrophin‐releasing hormone agonist versus a modified suppression protocol, so not a comparison of interest | |
| This study compares a GnRHa agonists versus GnRH antagonists in endometrial preparation for oocyte donation, so not a comparison of interest |
Characteristics of ongoing studies [ordered by study ID]
Jump to:
| Trial name or title | IVF Clinical Trial of Two Different Treatment Protocols |
| Methods | Randomised controlled trial |
| Participants | New Hope Fertility Center, New York, New York, United States Inclusion criteria:
Exclusion criteria:
|
| Interventions | IVF protocol and minimal stimulation IVF protocol |
| Outcomes | Primary outcome parameter: Live birth Secondary outcome parameters: Biochemical pregnancy, Clinical pregnancy, Ongoing pregnancy, Multiple pregnancy rate, Miscarriage rate, Fertilisation rate, Number of oocytes, Number of embryos |
| Starting date | December 2008 |
| Contact information | Henriette Julien, MD, [email protected] |
| Notes | Estimated completion date: January 2014 |
Data and analyses
| Outcome or subgroup title | No. of studies | No. of participants | Statistical method | Effect size |
| 1 Live births Show forest plot | 2 | 425 | Odds Ratio (M‐H, Fixed, 95% CI) | 0.68 [0.46, 1.01] |
| Analysis 1.1  Comparison 1 Natural cycle IVF versus standard IVF, Outcome 1 Live births. | ||||
| 2 OHSS Show forest plot | 1 | 60 | Odds Ratio (M‐H, Fixed, 95% CI) | 0.19 [0.01, 4.06] |
| Analysis 1.2 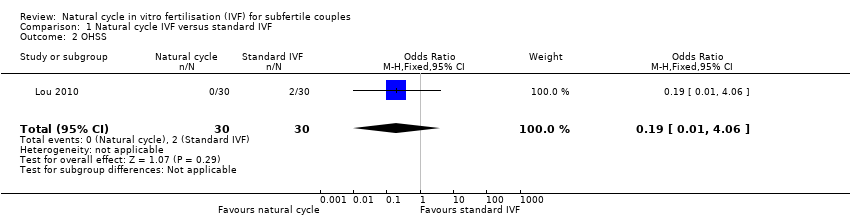 Comparison 1 Natural cycle IVF versus standard IVF, Outcome 2 OHSS. | ||||
| 3 Clinical pregnancy Show forest plot | 4 | 351 | Odds Ratio (M‐H, Random, 95% CI) | 0.52 [0.17, 1.61] |
| Analysis 1.3  Comparison 1 Natural cycle IVF versus standard IVF, Outcome 3 Clinical pregnancy. | ||||
| 3.1 Cumulative rate over up to 3 cycles | 2 | 261 | Odds Ratio (M‐H, Random, 95% CI) | 0.44 [0.06, 3.25] |
| 3.2 Single cycle | 2 | 90 | Odds Ratio (M‐H, Random, 95% CI) | 0.84 [0.30, 2.37] |
| 4 Ongoing pregnancy Show forest plot | 3 | 485 | Odds Ratio (M‐H, Fixed, 95% CI) | 0.72 [0.50, 1.05] |
| Analysis 1.4 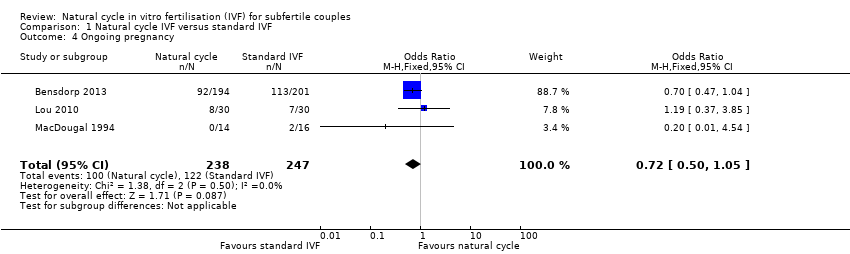 Comparison 1 Natural cycle IVF versus standard IVF, Outcome 4 Ongoing pregnancy. | ||||
| 5 Oocytes retrieved Show forest plot | 1 | 60 | Mean Difference (IV, Fixed, 95% CI) | ‐4.40 [‐7.87, ‐0.93] |
| Analysis 1.5  Comparison 1 Natural cycle IVF versus standard IVF, Outcome 5 Oocytes retrieved. | ||||
| 8 Multiple pregnancies Show forest plot | 2 | 527 | Odds Ratio (M‐H, Fixed, 95% CI) | 0.76 [0.25, 2.31] |
| Analysis 1.8  Comparison 1 Natural cycle IVF versus standard IVF, Outcome 8 Multiple pregnancies. | ||||
| 9 Gestational abnormalities Show forest plot | 1 | 18 | Odds Ratio (M‐H, Fixed, 95% CI) | 0.44 [0.03, 5.93] |
| Analysis 1.9  Comparison 1 Natural cycle IVF versus standard IVF, Outcome 9 Gestational abnormalities. | ||||
| 11 Cycle cancellations Show forest plot | 2 | Odds Ratio (M‐H, Random, 95% CI) | Subtotals only | |
| Analysis 1.11  Comparison 1 Natural cycle IVF versus standard IVF, Outcome 11 Cycle cancellations. | ||||
| 11.1 NC‐IVF versus stimulated cycle IVF | 2 | 159 | Odds Ratio (M‐H, Random, 95% CI) | 8.98 [0.20, 393.66] |
| 12 Costs Show forest plot | 1 | 60 | Std. Mean Difference (IV, Fixed, 95% CI) | ‐5.59 [‐6.75, ‐4.44] |
| Analysis 1.12  Comparison 1 Natural cycle IVF versus standard IVF, Outcome 12 Costs. | ||||
| 13 Subgroup analysis: Clinical pregnancy rate by intervention Show forest plot | 4 | 351 | Odds Ratio (M‐H, Random, 95% CI) | 0.52 [0.17, 1.61] |
| Analysis 1.13  Comparison 1 Natural cycle IVF versus standard IVF, Outcome 13 Subgroup analysis: Clinical pregnancy rate by intervention. | ||||
| 13.1 NC IVF versus stimulated cycle IVF | 3 | 291 | Odds Ratio (M‐H, Random, 95% CI) | 0.39 [0.08, 1.89] |
| 13.2 MNC‐IVF versus stimulated cycle IVF | 1 | 60 | Odds Ratio (M‐H, Random, 95% CI) | 1.0 [0.33, 3.02] |


Risk of bias summary: review authors' judgements about each risk of bias item for each included study.

Risk of bias graph: review authors' judgements about each risk of bias item presented as percentages across all included studies.
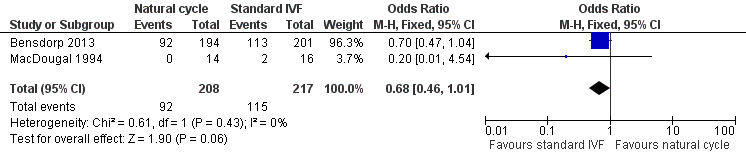
Forest plot of comparison: 1 Natural cycle IVF versus standard IVF, outcome: 1.1 Live births.

Forest plot of comparison: 1 Natural cycle IVF versus standard IVF, outcome: 1.2 OHSS.

Forest plot of comparison: 1 Natural cycle IVF versus standard IVF, outcome: 1.3 Clinical pregnancy.
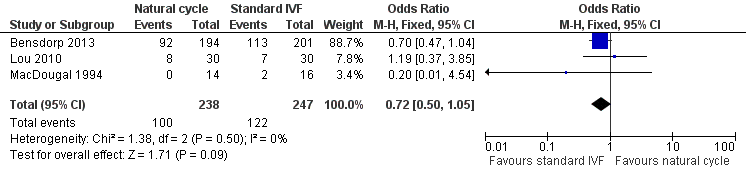
Forest plot of comparison: 1 Natural cycle IVF versus standard IVF, outcome: 1.4 Ongoing pregnancy.

Forest plot of comparison: 1 Natural cycle IVF versus standard IVF, outcome: 1.11 Cycle cancellations.
Comparison 1 Natural cycle IVF versus standard IVF, Outcome 1 Live births.
Comparison 1 Natural cycle IVF versus standard IVF, Outcome 2 OHSS.
Comparison 1 Natural cycle IVF versus standard IVF, Outcome 3 Clinical pregnancy.
Comparison 1 Natural cycle IVF versus standard IVF, Outcome 4 Ongoing pregnancy.
Comparison 1 Natural cycle IVF versus standard IVF, Outcome 5 Oocytes retrieved.
Comparison 1 Natural cycle IVF versus standard IVF, Outcome 8 Multiple pregnancies.
Comparison 1 Natural cycle IVF versus standard IVF, Outcome 9 Gestational abnormalities.
Comparison 1 Natural cycle IVF versus standard IVF, Outcome 11 Cycle cancellations.
Comparison 1 Natural cycle IVF versus standard IVF, Outcome 12 Costs.
Comparison 1 Natural cycle IVF versus standard IVF, Outcome 13 Subgroup analysis: Clinical pregnancy rate by intervention.
| DRAFT Natural cycle IVF versus standard IVF for subfertile couples | ||||||
| Patient or population: Subfertile couples | ||||||
| Outcomes | Illustrative comparative risks* (95% CI) | Relative effect | No of Participants | Quality of the evidence | Comments | |
| Assumed risk | Corresponding risk | |||||
| Standard IVF | Natural cycle IVF | |||||
| Live birth per woman | 530 per 1000 | 434 per 1000 | OR 0.68 | 425 | ⊕⊕⊕⊝ Moderate1 | |
| OHSS per woman | 67 per 1000 | 13 per 1000 | OR 0.19 | 60 | ⊕⊝⊝⊝ Very low2 | |
| Clinical pregnancy per woman | 207 per 1000 | 119 per 1000 | OR 0.52 | 351 | ⊕⊕⊝⊝ | |
| Ongoing pregnancy per woman | 494 per 1000 | 416 per 1000 | OR 0.72 | 485 | ⊕⊕⊕⊝ Moderate1,2 | |
| Multiple pregnancy per woman | 26 per 1000 | 20 per 1000 (7 to 58) | OR 0.76 (0.25 to 2.31) | 527 (2 studies) | ⊕⊝⊝⊝ Very low2 | |
| *The basis for the assumed risk is the median control group risk across studies. The corresponding risk (and its 95% confidence interval) is based on the assumed risk in the comparison group and the relative effect of the intervention (and its 95% CI). | ||||||
| GRADE Working Group grades of evidence | ||||||
| 1 Serious imprecision: confidence intervals compatible with no difference between the interventions or with substantial benefit from standard IVF 4 Substantial inconsistency (I2=63%), findings sensitive to choice of statistical model | ||||||
| Initial search result | After screening | |
| CENTRAL | 151 | 16 |
| EMBASE | 127 | 2 |
| MEDLINE | 110 | 3 |
| PsycINFO | 15 | 0 |
| MDSG | 28 | 3 |
| Clinicaltrials | 114 | 2 |
| CINAHL | 7 | 1 |
| WEBOFKN | 66 | 9 |
| TOTAL | 617 | 36 |
| Natural cycle | Stimulated cycle | Natural cycle | Stimulated cycle | |
| Cycles | 114 | 111 | 22 | 26 |
| Clinical pregnancy rate | 4 | 20 | 0 | 6 |
| Oocytes retrieved | 68 (0.92 ± 0.40) | 174 (1.83 ± 1.15) | ||
| Cycle cancellations | 40 | 16 | 6 | 1 |
| Outcome or subgroup title | No. of studies | No. of participants | Statistical method | Effect size |
| 1 Live births Show forest plot | 2 | 425 | Odds Ratio (M‐H, Fixed, 95% CI) | 0.68 [0.46, 1.01] |
| 2 OHSS Show forest plot | 1 | 60 | Odds Ratio (M‐H, Fixed, 95% CI) | 0.19 [0.01, 4.06] |
| 3 Clinical pregnancy Show forest plot | 4 | 351 | Odds Ratio (M‐H, Random, 95% CI) | 0.52 [0.17, 1.61] |
| 3.1 Cumulative rate over up to 3 cycles | 2 | 261 | Odds Ratio (M‐H, Random, 95% CI) | 0.44 [0.06, 3.25] |
| 3.2 Single cycle | 2 | 90 | Odds Ratio (M‐H, Random, 95% CI) | 0.84 [0.30, 2.37] |
| 4 Ongoing pregnancy Show forest plot | 3 | 485 | Odds Ratio (M‐H, Fixed, 95% CI) | 0.72 [0.50, 1.05] |
| 5 Oocytes retrieved Show forest plot | 1 | 60 | Mean Difference (IV, Fixed, 95% CI) | ‐4.40 [‐7.87, ‐0.93] |
| 8 Multiple pregnancies Show forest plot | 2 | 527 | Odds Ratio (M‐H, Fixed, 95% CI) | 0.76 [0.25, 2.31] |
| 9 Gestational abnormalities Show forest plot | 1 | 18 | Odds Ratio (M‐H, Fixed, 95% CI) | 0.44 [0.03, 5.93] |
| 11 Cycle cancellations Show forest plot | 2 | Odds Ratio (M‐H, Random, 95% CI) | Subtotals only | |
| 11.1 NC‐IVF versus stimulated cycle IVF | 2 | 159 | Odds Ratio (M‐H, Random, 95% CI) | 8.98 [0.20, 393.66] |
| 12 Costs Show forest plot | 1 | 60 | Std. Mean Difference (IV, Fixed, 95% CI) | ‐5.59 [‐6.75, ‐4.44] |
| 13 Subgroup analysis: Clinical pregnancy rate by intervention Show forest plot | 4 | 351 | Odds Ratio (M‐H, Random, 95% CI) | 0.52 [0.17, 1.61] |
| 13.1 NC IVF versus stimulated cycle IVF | 3 | 291 | Odds Ratio (M‐H, Random, 95% CI) | 0.39 [0.08, 1.89] |
| 13.2 MNC‐IVF versus stimulated cycle IVF | 1 | 60 | Odds Ratio (M‐H, Random, 95% CI) | 1.0 [0.33, 3.02] |