Intervenciones con ejercicios y régimen dietético combinados para la prevención de la diabetes mellitus gestacional
References
Referencias de los estudios incluidos en esta revisión
Referencias de los estudios excluidos de esta revisión
Referencias de los estudios en espera de evaluación
Referencias de los estudios en curso
Referencias adicionales
Referencias de otras versiones publicadas de esta revisión
Characteristics of studies
Characteristics of included studies [ordered by study ID]
| Methods | Randomised controlled trial. | |
| Participants | 144 women were randomised. Setting: The Resident Obstetric Clinic in Charlotte, North Carolina, USA (recruitment from October 2005 to April 2007). Inclusion criteria: women who established antenatal care at 6 to 16 weeks gestation, were aged between 18 and 49 years, who received all antenatal care at the Resident Obstetrics Clinic, were English‐speaking, Spanish‐speaking or both, and had a singleton pregnancy. Exclusion criteria: women who established antenatal care at > 16 weeks gestation, were non‐English or non‐Spanish speaking, had a multiple pregnancy, had a BMI > 40 kg/m², had pre‐existing diabetes, untreated thyroid disease or hypertension requiring medication, or other medical conditions that might affect body weight, who delivered at an institution other than Carolinas Medical Centre‐Main, had a pregnancy ending in preterm birth (< 37 weeks) or who had limited antenatal care (< 4 visits). | |
| Interventions | Intervention group (n = 57) Women underwent a complete history and physical exam with specific attention paid to pre‐pregnancy weight, current weight, height and BMI. At the initial visit women met with a registered dietitian to receive a standardised counselling session including information on pregnancy‐specific diet and lifestyle choices. Diet: counselling consisted of recommendations for a patient‐focused caloric value divided in a 40% carbohydrate, 30% protein, and 30% fat fashion. Exercise: women were instructed to engage in moderate‐intensity exercise > 3 times per week, preferably 5 times. Women also received information on the appropriate GWG using the IOM guidelines. At each routine appointment, women's weight was measured and charted on an IOM GWG Grid in front of them. The healthcare provider informed the women whether their weight was at the appropriate level. If the GWG was appropriate the women were praised and encouraged to continue their diet and exercise regimen. If their GWG was not within the guidelines, their regimen was reviewed, and they were advised on increasing/decreasing intake and exercise. Control group (n = 43) Women received routine antenatal care, which included an initial physical examination and history, routine laboratory tests, and routine visits as per ACOG standards. The only counselling of diet and exercise during pregnancy was that included in the standard ‘What to do When You’re Having a Baby’ booklet. At each routine appointment, women's weight was measured and recorded. | |
| Outcomes | Data in meta‐analyses for: GWG; caesarean section. Additional narrative text for: GDM: hypertensive disorders of pregnancy: pre‐eclampsia; operative vaginal birth; perineal trauma (vaginal lacerations). | |
| Notes | Funding:"Funded by a grant from the Carolina Healthcare Foundation". Declarations of interest:"The authors did not report any potential conflicts of interest". The trial was terminated early due to time restrictions involved with completing a resident research project. | |
| Risk of bias | ||
| Bias | Authors' judgement | Support for judgement |
| Random sequence generation (selection bias) | Low risk | Quote: "Randomization was performed using computer‐generated random allocation". |
| Allocation concealment (selection bias) | Low risk | Quote: "Study randomization was numbered and sealed in an opaque envelope. Randomization occurred in consecutive order at the time of the new obstetrical visit". |
| Blinding of participants and personnel (performance bias) | High risk | Blinding of women and trial personnel not considered feasible in view of the intervention and control. |
| Blinding of outcome assessment (detection bias) | Unclear risk | No information provided. |
| Incomplete outcome data (attrition bias) | High risk | Of 144 women randomised, 44 (31%) were excluded after randomisation; therefore 100 (69%) were included in the analyses. It was unclear which groups the excluded women had been randomised to. No other losses to follow‐up were reported. |
| Selective reporting (reporting bias) | High risk | Outcomes were not clearly pre‐specified in the methods (only total GWG and BMI change from pre‐pregnancy to before delivery were discussed in the methods). Whilst the results section details secondary outcomes including operative vaginal birth, neonatal weight, pre‐eclampsia, GDM, vaginal/perinatal lacerations and shoulder dystocia, no numeric outcome data were reported; quote: "no statistically significant differences were noted between the groups". |
| Other bias | Low risk | No obvious sources of other bias identified. |
| Methods | Randomised controlled trial. | |
| Participants | 191 women were randomised. Setting: public antenatal clinic at the Obstetric Unit of the Mother‐Infant Department of Azienda Ospedaliero‐Universitaria, Policlinico di Modena, Modena, Italy (recruitment from February 2013 to June 2014). Inclusion criteria: pregnant women with a pre‐pregnancy BMI ≥ 25 kg/m², aged > 18 years, with a singleton pregnancy, between their 9th and 12th weeks of pregnancy. Exclusion criteria: chronic diseases including diabetes mellitus (first trimester glycosuria > 100 mg/dL or fasting plasma glucose ≥126 mg/dL, or random glycaemia≥ 200 mg/dL), hypertension, medical conditions or dietary supplements that might affect body weight (e.g. thyroid diseases), previous bariatric surgery, contraindications to exercise, and intent to give birth elsewhere, previous GDM, smoking habits (≥ 5 cigarettes per day). | |
| Interventions | Intervention group (n = 96) A personalised dietary modification intervention was initiated at enrolment through a 1‐hour counselling session with a dietitian. Follow‐up visits, scheduled for the 16th, 20th, 25th and 36th weeks of pregnancy, with both the gynaecologist and dietitian, were used to promote adherence to the intervention. At each of the follow‐up visits, the women's weight was measured. In addition, women were interviewed by the dietitian about their diet and exercise habits and counselled about possible changes, when necessary. The women who did not attend the 36‐week examination received a phone call. Diet: the primary focus was decreasing the consumption of foods with a high GI and a high saturated fat content by substituting them with healthier alternatives based on the taste and preferences of the women. Personalised dietary advise included prescription of a low GI, low saturated fat diet with a total intake of 1500 kcal/day (in light of the additional physical activity intervention, 200 kcal/day for obese and 300 kcal/day for overweight women were added). The diet plan recommended to women included a wide range of plant foods, cereals, legumes and fish, with olive old as the main source of fat, and moderate to no consumption of red wine. The diet had a target macronutrient composition of 55% carbohydrates, 20% protein and 25% fat with moderately low fat levels. The recommended intake of carbohydrates was ≥ 225 g/day. Exercise: the focus was on encouraging women to develop a more active lifestyle. Women were advised to participate in 30 minutes of moderate‐intensity activity > 3 times a week. The 'talk test' was recommended to monitor exercise intensity. Control group (n = 95) At enrolment, women in the control group attended a 1‐hour counselling session with a dietitian, who provided general recommendations on diet during pregnancy, and the same physical activity advice that was given to the women in the intervention group. In accordance with the Italian Guidelines for a healthy diet and physical activity during pregnancy, the women were also provided with a booklet providing nutrition and lifestyle. The dietitian recommended that women avoid food with a high GI, reduce the consumption of food with a high saturated fat content and increase consumption of vegetables and fruit with a low GI. No specific advice about food quantities, caloric intake, meal composition or meal distribution was given. At the follow‐up visits, women in the control group were simply asked about their adherence to the suggested lifestyle. | |
| Outcomes | Data in meta‐analyses (or other data) for: GDM; caesarean birth; pregnancy‐induced hypertension; large‐for‐gestational age; induction of labour; GWG; behaviour changes associated with the intervention; stillbirth; gestational age at birth; preterm birth; Apgar score < 7 at 5 minutes; macrosomia; small‐for‐gestational age; birthweight. Additional narrative text for: NICU admission. | |
| Notes | Funding:"The study was supported by funding from Policlinico University Hospital of Modena. The funders had no role in the study design, data collection or analysis, decision to publish or preparation of the article". Delcarations of interest:"The authors declare that they have no conflicts of interest". | |
| Risk of bias | ||
| Bias | Authors' judgement | Support for judgement |
| Random sequence generation (selection bias) | Low risk | Quote: "The randomization list was obtained by computer‐generated random allocation with a 1:1 ratio". |
| Allocation concealment (selection bias) | Low risk | Quote: "The allocations were sealed in numbered white envelopes, which were kept in the midwifery facility. After eligibility was assessed, a midwife opened the next random envelope". |
| Blinding of participants and personnel (performance bias) | High risk | The trial was described as "open"; quote: "Because of the study design, the gynaecologist and the dietitian knew the group allocation of the patient". |
| Blinding of outcome assessment (detection bias) | Low risk | Quote: "The obstetrician in charge of the enrolled women was blind to the allocation group. The data regarding the delivery and the newborns were collected from the clinical records by two residents who were blind to the allocation group". Though not clear whether some outcomes (such as GDM and GWG) were able to be assessed blind, we have judged risk of detection bias as low. |
| Incomplete outcome data (attrition bias) | High risk | Of 191 women randomised, 131 (69%) women were included in the analyses. Women lost to follow‐up were significantly younger, had a lower educational level and were more frequently overweight. |
| Selective reporting (reporting bias) | High risk | The protocol, published with ClinicalTrials.gov, was modified before the preliminary analyses; the primary outcome was changed, and additional secondary outcomes were included. The reporting of outcomes is incomplete for outcomes such as NICU admission ("were very few and did not differ between the groups"). |
| Other bias | Low risk | No obvious sources of other bias identified. |
| Methods | Randomised controlled trial. | |
| Participants | 2212 women were randomised. Setting: 3 major metropolitan maternity hospitals in Adelaide, South Australia (recruitment from June 2008 to December 2011). Inclusion criteria: women with a BMI ≥ 25 kg/m², with a singleton pregnancy at 10 to 20 weeks gestation. Exclusion criteria: women with a multiple pregnancy, or type 1 or 2 diabetes diagnosed prior to pregnancy. | |
| Interventions | Intervention group (n = 1108 randomised) Women participated in a comprehensive diet and lifestyle intervention that included diet, exercise and behavioural strategies delivered by a research dietitian and trained research assistants. Women attending a planning session with the dietitian and were provided with individualised information (meal plans, healthy recipes, simple food substitutions, options for healthy snacking and eating out and guidelines for healthy food preparation). Women were encouraged to set achievable goals for diet and exercise change, supported to make changes, and asked to self‐monitor with a workbook; they were also asked to identify barriers and assisted to develop strategies to overcome these. The information was reinforced during a visit with the dietitian at 28 weeks, and during telephone calls with a research assistant at 22, 24 and 32 weeks, and a face‐to‐face visit with a research assistant at 36 weeks. Diet: advice was consistent with the Australian standards (maintain balance of carbohydrates, fat and protein; reduce intake of foods high in refined carbohydrates and saturated fats; increase intake of fibre; aim for 2 servings of fruit, 5 servings of vegetables and 3 servings of dairy daily). Exercise: advice encouraged women to increase walking and incidental activity. Control group (n = 1104 randomised) Women received their pregnancy care according to state‐wide perinatal practice and local guidelines, which did not include routine provision of diet or exercise advice, or advice regarding GWG. | |
| Outcomes | Data in meta‐analyses (or other data tables for): GDM; pre‐eclampsia; hypertension; caesarean birth; perinatal mortality; large‐for‐gestational age; induction of labour; perineal trauma; postpartum haemorrhage; postpartum infection; GWG; behaviour changes associated with the intervention; sense of well‐being and quality of life; stillbirth; neonatal mortality; gestational age at birth; preterm birth; Apgar score < 7 at 5 minutes; macrosomia; birthweight; birthweight z score; head circumference; head circumference z score; length; length z score; ponderal index; adiposity; shoulder dystocia; bone fracture; nerve palsy; respiratory distress syndrome; neonatal hypoglycaemia; neonatal hyperbilirubinaemia; antenatal admissions; NICU admission; length of antenatal stay; length of postnatal stay (mother); length of postnatal stay (baby). Additional narrative text for: views of the intervention. | |
| Notes | Funding:"This project was funded by a four year project grant from the National Health and Medical Research Council (NHMRC), Australia (ID 519240). JMD is supported through a NHMRC Practitioner Fellowship (ID 627005). The funder had no role in the study design, data collection, analysis, interpretation, or writing of the report". Declarations of interest:"All authors have completed the ICMJE uniform disclosure form at www.icmje.org/coi_disclosure.pdf and declare: no support from any organisation for the submitted work; no financial relationships with any organisations that might have an interest in the submitted work in the previous three years; no other relationships or activities that could appear to have influenced the submitted work". | |
| Risk of bias | ||
| Bias | Authors' judgement | Support for judgement |
| Random sequence generation (selection bias) | Low risk | Quote: "The computer generated randomisation schedule used balanced variable blocks in the ratio 1:1 and was prepared by an investigator not involved with recruitment or clinical care". |
| Allocation concealment (selection bias) | Low risk | Quote: "A research assistant counselled eligible women and then randomised them to receive lifestyle advice or standard care by telephoning the central randomisation service". |
| Blinding of participants and personnel (performance bias) | High risk | Blinding of women and trial personnel not considered feasible in view of the intervention and control. |
| Blinding of outcome assessment (detection bias) | Low risk | Quotes: "Outcome assessors were blinded to the treatment group allocated." "After birth, a research assistant not involved in providing the intervention and blinded to treatment allocation obtained information relating to antenatal, birth, and infant outcomes from the case notes". |
| Incomplete outcome data (attrition bias) | Low risk | 2212 women were randomised; 10 withdrew consent to use data. Of the 1108 women in the intervention group, there were 25 miscarriages/terminations before 20 weeks, 3 women withdrew consent to use data, there was 1 maternal death, 4 neonatal deaths (3 due to lethal anomalies) and 5 stillbirths. Therefore, there were 1080 women (97%) included in the intervention group analyses and 1075 infants (excluding miscarriages, stillbirths and withdrawn consents). Of the 1104 women in the control group, there were 25 miscarriages/terminations before 20 weeks, 7 women withdrew consent to use data, there was 1 maternal death, 1 neonatal death and 5 stillbirths. Therefore, there were 1072 (97%) women included in the analyses, and 1067 infants (excluding miscarriages, stillbirths and withdrawn consents). |
| Selective reporting (reporting bias) | Low risk | Data for pre‐specified outcomes (according to published trial protocol) were reported. |
| Other bias | Low risk | No obvious sources of other bias identified. |
| Methods | Randomised controlled trial. | |
| Participants | 100 women were randomised. Setting: Egypt. Inclusion criteria: obese women at risk of GDM at their first antenatal visit. Exclusion criteria: none detailed. | |
| Interventions | Intervention group (assumed that n = 50 randomised, n = 48 analysed) Women participated in a 12‐week mild physical activity program and diet control. Control group (assumed that n = 50 randomised, n = 48 analysed) Not detailed. | |
| Outcomes | Data in meta‐analyses for: no outcomes. Additional narrative text for: GDM, GWG, "adverse neonatal outcome". | |
| Notes | Funding: not reported. Declarations of interest: not reported. Information taken from published abstract only. | |
| Risk of bias | ||
| Bias | Authors' judgement | Support for judgement |
| Random sequence generation (selection bias) | Unclear risk | Not described in abstract. |
| Allocation concealment (selection bias) | Unclear risk | Not described in abstract. |
| Blinding of participants and personnel (performance bias) | High risk | Blinding of women and trial personnel not considered feasible in view of the intervention and control. |
| Blinding of outcome assessment (detection bias) | Unclear risk | Not described in abstract. |
| Incomplete outcome data (attrition bias) | Unclear risk | Insufficient information to determine. 100 women were enrolled, however in the abstract, data are reported for 48 women per group. |
| Selective reporting (reporting bias) | Unclear risk | Insufficient information to determine. |
| Other bias | Unclear risk | Insufficient information to determine. |
| Methods | Randomised controlled trial. | |
| Participants | 228 women were randomised. Setting: 3 large metropolitan tertiary teaching hospitals in Victoria, Australia (recruited from June 2008 to September 2010). Inclusion criteria: women at 12 to 15 weeks gestation, who were overweight (BMI 25 or 23 kg/m² if high‐risk ethnicity) or obese (BMI 30 kg/m²), and were at increased risk for developing GDM according to a validated risk prediction tool (based on first trimester data of women attending the hospital). Women had to agree to complete an OGTT at 28 weeks (rather than a standard GCT at GDM screening). Exclusion criteria: women with multiple pregnancies, diagnosed with type 1 or 2 diabetes, BMI > 45 kg/m², pre‐existing chronic medical condition, non‐English speaking. | |
| Interventions | Intervention group (n = 121 women randomised) Women allocated to the intervention received 4 individual sessions of a behavioural change lifestyle intervention, based on social cognitive theory. Sessions were provided in the antenatal clinic, scheduled around routine visits (14‐16, 20, 24, 28 weeks), by a health coach (exercise physiologist); however was, designed to be delivered by generic healthcare providers. The sessions provided pregnancy‐specific diet advice, simple healthy eating and physical activity messages. Simple behavioural change strategies were practiced to identify short‐term goals, increase self‐efficacy and self‐monitoring. Goals were determined by women, informed by the lifestyle messages, and included goals such as increasing fruit and vegetable intake, reducing high fat or convenience foot, and increasing physical activity frequency. Self‐monitoring strategies included use of pedometers and GWG charts based on IOM recommendations. Women received the same written information as controls, in addition to resources promoting optimal health, GWG and lifestyle. On‐going contact and support with mobile phone SMS text messages, personalised by name, were provided throughout the trial commencing from the third session, reinforcing simple health messages for diet, physical activity, behaviour change and relapse prevention; 2 healthy lifestyle postcards were also sent at 30 and 34 weeks gestation to maintain engagement and remind women of the simple health messages. Control group (n = 107 women randomised) Women received a brief, single education session based on the widely available generic Australian Dietary and Physical Activity Guidelines. Written pamphlet versions were provided. GWG was not discussed and there was no further trial support. | |
| Outcomes | Data in meta‐analyses (or other data tables) for: GDM; GWG: behaviour changes associated with the intervention; postnatal weight retention; gestational age at birth; preterm birth; birthweight; breastfeeding; postnatal BMI. Additional narrative text for: GWG: adherence to the intervention. | |
| Notes | Funding:"This project is supported by a BRIDGES grant from the International Diabetes Federation. BRIDGES, an International Diabetes Federation project is supported by an educational grant from Lilly Diabetes (Project Number: LT07‐121). The Jack Brockhoff Foundation also provided funding for this study. Helena Teede is an NHMRC research fellow. Cheryce Harrison is supported by a Postdoctoral Fellowship (100168) from the National Heart Foundation". Declarations of interest:"The authors declare that they have no competing interests". | |
| Risk of bias | ||
| Bias | Authors' judgement | Support for judgement |
| Random sequence generation (selection bias) | Low risk | Quote: "Participating women were randomly assigned to intervention or control through computer‐generated randomized sequencing". |
| Allocation concealment (selection bias) | Low risk | Quote: "Allocation concealment was achieved by using sealed opaque envelopes". |
| Blinding of participants and personnel (performance bias) | High risk | Due to the nature of the intervention and control, it was not possible to blind women, though "pedometers were sealed to blind participants to their step count". Blinding of trial personnel is unclear, as although the authors stated: "Care providers, investigators, and outcome data analyzers were blinded to group allocation" it is unclear how this would have been successfully achieved for care providers, given women's knowledge of their group allocation. |
| Blinding of outcome assessment (detection bias) | Low risk | Quotes: "Care providers, investigators, and outcome data analyzers were blinded to group allocation"; "Anthropometric assessment included weight... and height measured by a registered nurse unaware of participant allocation". |
| Incomplete outcome data (attrition bias) | Low risk | 121 women allocated to intervention, 15 (12%) were lost to follow‐up, and therefore 106 (88%) were analysed. Reasons for loss to follow‐up: miscarriage (1 woman), premature birth < 26 weeks (3 women), change in circumstance (3 women), unavailable at 28 weeks (2 women), lost contact (6 women). 107 women allocated to control, 10 (9%) were lost to follow‐up, and therefore 97 (91%) were analysed. Reasons for loss to follow‐up: miscarriage (2 women), premature birth < 26 weeks (1 woman), change in circumstance (1 woman), unavailable at 28 weeks (4 women), lost contact (2 women). Follow‐up: At 6 weeks postpartum 17 (14%) intervention group women were lost to follow‐up, therefore 104 (86%) analysed; 9 (8%) control group women were lost to follow‐up, therefore 98 (92%) analysed. |
| Selective reporting (reporting bias) | Unclear risk | With no access to a trial protocol, it was not possible to confidently assess selective reporting. |
| Other bias | Low risk | No obvious sources of other bias identified. |
| Methods | Randomised controlled trial. | |
| Participants | 68 women were randomised. Setting: Baystate Medical Center and Mercy Medical Center in Western Massachusetts, USA (recruited from April 2010 to August 2011). Inclusion criteria: Hispanic women aged 18 to 40 years, with a gestational age of < 18 weeks, who were overweight or obese (pre‐pregnancy BMI ≥ 25 kg/m²) and who self‐reported participating in < 30 minutes of moderate‐intensity activity per week. Exclusion criteria: history of type 2 diabetes, hypertension, heart disease or chronic renal disease; current medications that adversely influence glucose tolerance; not planning to continue the pregnancy to term; contraindications to participating in moderate‐intensity physical activity or a low‐fat/high‐fibre diet; self‐reported participation in ≥ 30 minutes of moderate‐intensity exercise on ≥ 3 days per week or ≥ 20 minutes of vigorous‐intensity exercise on ≥ 1 day per week; or multiple gestation (e.g. twins). | |
| Interventions | Intervention group (n = 33 randomised) The intervention consisted of 6 in‐person behavioural counselling sessions and 5 telephone booster sessions delivered by bicultural and bilingual health educators, tailored for Hispanic women’s culture and context. All materials were available in Spanish and English and were written at a sixth‐grade reading level. Diet: women were encourage to decrease their intake of foods high in saturated fat, and to increase intake of dietary fibre (as recommended by the ADA). Health educators assessed readiness and preferences for change, consistent with the Stage of Change framework, and assisted women in developing dietary change goals. Women were provided with a low‐literacy pictured‐based food guide by which ethnic and other foods were classified based on GI/fibre content and saturated fat using the ‘traffic light’ colours and self‐monitoring logs. Activities in the follow‐up in‐person and telephone‐delivered booster sessions included review of logs, problem‐solving of challenges, introduction of new tailored materials and goal setting. Exercise: the physical activity during pregnancy guidelines of the ACOG (≥ 30 minutes of moderate‐intensity activity on most days of the week) were discussed. Women were encouraged to achieve the standards set in the guideline through increasing their walking and developing a more active lifestyle. Informed by responses to a 'Stage of Change Questionnaire', women were provided with a stage‐matched manual which included motivationally targeted materials combined with tip sheets on building social support for new behavioural patterns and strategies for overcoming barriers to physical activity. The health educators assisted the women in developing personalised physical activity goals. Women were provided with a digital pedometer and a physical activity log to track their progress Control group (n = 35 randomised) Women in the control group received standard care (no further details reported). | |
| Outcomes | Data in meta‐analyses (or other data) for: GWG; behaviour changes associated with the intervention; relevant biomarker changes associated with the intervention; gestational age at birth; birthweight. Additional narrative text for: GDM; adherence to the intervention; views of the intervention. | |
| Notes | Funding: "This work was supported by CDC/ASPH S3948". Declarations of interest:"None declared". | |
| Risk of bias | ||
| Bias | Authors' judgement | Support for judgement |
| Random sequence generation (selection bias) | Unclear risk | Quote: "eligible patients were randomized... by the health educators to either a lifestyle intervention or a standard care group. Randomization was stratified by age (< 30 years, ≥ 30 years) and pre‐pregnancy BMI (25–30 kg/m², ≥ 30 kg/m²with a block size of four". |
| Allocation concealment (selection bias) | Unclear risk | As above; no further information provided. |
| Blinding of participants and personnel (performance bias) | High risk | Blinding of women and trial personnel not considered feasible in view of the intervention and control. |
| Blinding of outcome assessment (detection bias) | Low risk | Quote: "Assessments were conducted by telephone, at baseline, mid‐pregnancy, and at 6 weeks postpartum by bilingual and bicultural interviewers blinded to the assigned intervention group". Though not clear whether clinical outcomes (such as GDM) were able to be assessed blind, we have judged risk of detection bias as low. |
| Incomplete outcome data (attrition bias) | Low risk | Of the 33 women randomised to the intervention group, 30 (94%), 32 (97%) and 24 (75%) were available for the mid‐pregnancy, clinical outcome and postpartum assessments, respectively. Of the 35 women randomised to the control group, 29 (85%), 34 (97%) and 29 (85%) were available for the mid‐pregnancy, clinical outcome and postpartum assessments respectively. The losses at mid‐pregnancy and postpartum were associated with women being unable to be contacted via telephone; losses for clinical outcomes were associated with women being delivered off‐site. |
| Selective reporting (reporting bias) | High risk | Reporting of GDM is incomplete (only the number of cases across both groups in text) and a very limited number of clinical outcomes are reported. |
| Other bias | Low risk | No obvious sources of other bias identified. |
| Methods | Randomised controlled trial. | |
| Participants | 66 women were randomised. Setting: 2 large outpatient obstetric practices at Temple Univeresity, Philadelphia, Pennsylvania, USA (recruitment from January 2013 to March 2014). Inclusion criteria: women aged ≥ 18 years, self‐identifying as African American, at a gestational age < 20 weeks, with a first trimester BMI of 25 to 45 kg/m², with Medicaid recipient status, and cell phone ownership (including unlimited text messaging) and Facebook membership. Exclusion criteria: women with multiple pregnancies, conditions requiring specialised nutritional care, and endorsed tobacco use. | |
| Interventions | Intervention group (n = 33 randomised) A technology‐based behavioural weight control intervention was delivered, via Facebook, telephone and text messaging and 1 in‐person consultation (at baseline). The intervention was designed to build women's motivation, support and self‐efficacy for weight‐related behaviour change, while at the same time remain responsive to low‐income African American women's social context. At their baseline visit from the health coach, women were oriented to the program, provided with an overview of behavioural change goals, an explanation of the intervention components, and a review of the schedule. Women were assigned the same scheduled for the first 12 weeks, after which the health coach prioritised the order in which goals were to be repeated until birth. The structure of the intervention implementation was as follows: baseline, in person at Temple; target: self‐weighing, behavioural goal: weigh yourself weekly; week 1: telephone; target: energy intake, behavioural goal: limit sugar‐sweetened beverages to 1 cup per day; weeks 2 and 4: telephone; target: energy intake; behavioural goal: limit junk and high fat food to no more than 1 per day; weeks 6 and 8: telephone; target: physical activity; behavioural goal: walk 5000 steps daily; weeks 10 and 12: telephone; target: energy intake; behavioural goal: stick to 1 plate of food at each meal. Women were also offered a binder with print versions of the content, if technology access was lost. Women were prompted to weigh themselves at home, and were supplied with digital scales. Diet: in addition to the specific recommendations described above, general recommendations were provided around energy intake. Women were encouraged to limit their sugar‐sweetened beverages to 1 cup per day, and stick to 1 plate of food at each meal, with low calorie beverages, and convenient, inexpensive, palatable, nutrient‐rich food, compatible with social norms suggested as alternatives (consistent with IOM recommendations). Exercise: women were encouraged to walk 5000 steps daily (gradually increasing walking by 500 steps each week), and were provided pedometers and a walking DVD. Control group (n = 33 randomised) Women received standard obstetric care which included: an initial visit in the first trimester, with comprehensive patient history, physical exam, ultrasound and blood work; follow‐up visits monthly until week 24, and every 2 to 3 weeks until week 36, with assessment of weight, blood pressure, urine protein and fetal heart rate; weekly visits from week 36 to birth. Women were also provided with information from the ACOG about optimal GWG. | |
| Outcomes | Data in meta‐analyses (or other data) for: GDM; caesarean birth; large‐for‐gestational age; GWG; preterm birth; small‐for‐gestational age; birthweight. Additional narrative data for: adherence to intervention; views of intervention. | |
| Notes | Funding:"This study was supported by grants from the National Institutes of Health (NIH K23 HL106231) and the Health Resources and Services Administration (HRSA R40MC26818) of the U.S. Department of Health and Human Services (HHS)". Declarations of interest:"At the time of the study, Dr. Herring served on scientific advisory boards for Novo Nordisk and Johnson and Johnson; Dr. Bennett served on the scientific advisory boards for Nutrisystem and the board of Scale Down; and Dr. Foster served on scientific advisory boards of Con Agra Foods, Tate and Lyle, and United Health Group. Currently, Dr. Foster is a full‐time employee of Weight Watchers International. None of these entities have provided financial support for this study nor did they have any influence on the weight control methods in this study. All other authors declare no conflicts of interest". | |
| Risk of bias | ||
| Bias | Authors' judgement | Support for judgement |
| Random sequence generation (selection bias) | Low risk | Quote: "Randomization was computer‐generated (by study statistician) with a 1:1 allocation ratio". |
| Allocation concealment (selection bias) | Low risk | Quote:"randomization status was concealed in opaque envelopes prepared by the statistician". |
| Blinding of participants and personnel (performance bias) | High risk | Authors reported that "providers and clinic staff were blinded to subject randomisation to prevent contamination". However, blinding of women and trial personnel not considered feasible in view of the intervention and control. |
| Blinding of outcome assessment (detection bias) | Unclear risk | No detail provided. |
| Incomplete outcome data (attrition bias) | Unclear risk | Of the 33 women randomised to the intervention, 0 were lost to follow‐up, 6 were excluded (miscarriage: 3; elective termination: 1; preterm birth: 2); therefore 27 (82%) were analysed. Of the 33 women randomised to usual care, 0 were lost to follow‐up, 4 were excluded (miscarriage: 2; preterm birth: 2); and thus 29 (88%) were analysed. Relatively high attrition in small sample. |
| Selective reporting (reporting bias) | Unclear risk | Some discrepancies between trial registration and published report (e.g. trial registration reports primary outcome to be: change in maternal weight from early pregnancy (< 20 weeks gestation) to 6 months and 1 year postpartum), whereas main report presents primary outcome as proportion of women with excessive GWG) and additional outcomes noted in trial registration are not presented in published report. No measure of variance reported for birthweight which thus could not be included in the meta‐analysis. With no access to a trial protocol, it was not possible to further assess selective reporting. |
| Other bias | Low risk | No obvious sources of other bias identified. |
| Methods | Randomised controlled trial. | |
| Participants | 480 women were randomised. Setting: not specified though authors affiliated to the Hospital Federal dos Servidores do Estado, Rio de Janeiro, Brazil (recruitment from 2011 to 2015). Inclusion criteria: women aged 18 to 40 years, with ≥ 2 consecutive first trimester abortions who conceived spontaneously. Exclusion criteria: antiphospholipid antibodies, second or third trimester losses, multiple pregnancies, physical disabilities such as paraplegia, liver or kidney failure, women assigned to standard care following recommendations given to the intervention group, any condition requiring a priori anticoagulation. | |
| Interventions | Intervention group (n randomised not reported, n = 159 completed the trial) Women were instructed to walk briskly for ≥ 40 minutes 7 days a week, to avoid high carbohydrate index meals (such as snacks, candies, fibre‐free juices or sugar‐sweetened beverages), and to eat 2 daily servings of meat, poultry, fish or other protein rich food, starting when they decided to get pregnant and continuing until birth. Control group (n randomised not reported, n = 160 completed the trial) Women received standard care (no further detail provided). | |
| Outcomes | Data in meta‐analyses for: no outcomes. Additional narrative text for: GDM; pre‐eclampsia; large‐for‐gestational age (appropriate); perinatal mortality; GWG (excessive); preterm birth (full term births); neonatal hypoglycaemia. | |
| Notes | Funding: not reported. Declarations of interest: not reported. Information taken from published abstract only. Correspondence with trial authors provided additional unpublished abstract for manuscript under review. | |
| Risk of bias | ||
| Bias | Authors' judgement | Support for judgement |
| Random sequence generation (selection bias) | Unclear risk | Not described in abstract. |
| Allocation concealment (selection bias) | Unclear risk | Not described in abstract. |
| Blinding of participants and personnel (performance bias) | High risk | Blinding of women and trial personnel not considered feasible in view of the intervention and control. |
| Blinding of outcome assessment (detection bias) | Unclear risk | Not described in abstract. |
| Incomplete outcome data (attrition bias) | High risk | Of the 480 women randomised, 319 (66%) completed the trial (159 women in the intervention group, and 160 in the control group). |
| Selective reporting (reporting bias) | Unclear risk | Insufficient information to determine. |
| Other bias | Unclear risk | Insufficient information to determine. |
| Methods | Randomised controlled trial. | |
| Participants | 224 women were randomised. Setting: Winnipeg, Manitoba, Canada (recruitment from July 2004 to February 2010). Inclusion criteria: non‐diabetic pregnant women (at < 26 weeks gestation), attending antenatal classes or community clinics in Winnipeg. Exclusion criteria: women with medical or obstetric contraindications to exercise during pregnancy. | |
| Interventions | Intervention group (n = 112 randomised, n = 102 analysed) Diet: diet interviews and counselling were provided 2 times to each woman by a registered dietitian – at enrolment, and 2 months after enrolment. The interview was assisted with a ‘Food Choice Map’ (a computerised dietary interview tool, which consisted of a map, 91 magnetic stickers with pictures of common foods and bar codes and software modified for pregnant women). Women recalled their food intakes in a typical week, and women and dietitians placed stickers on the maps – bar codes and locations of stickers on the map represented the frequency, types and quantities of food intakes – which were scanned into the computer at the end of the interview to allow analysis instantly of calories and nutrients. Dietitians provided personalised counselling based on the interview results, pregnancy week, GWG and Health Canada Guidelines. Exercise: women were given a community‐based exercise program designed for pregnant women. Recommended exercise included walking, mild‐to‐moderate aerobic, stretching and strength exercises. An exercise regimen (3 to 5 times per week; including a weekly group exercise session and multiple home sessions) of mild‐to‐moderate exercise for 30 to 45 minutes per session was recommended. It was suggested that the exercise began between 20 to 26 weeks and ended at 36 weeks. The group sessions were held in air‐conditioned gymnasia in community centres (day time and night time classes were available). An exercise instruction video was given to women to assist with home exercise. Activity logbooks were collected weekly by the project coordinator from the women. Control group (n = 112 randomised, n = 88 analysed) Women received standard antenatal care recommended by the SOGC, and were provided with a package of up‐to‐date information on physical activity and nutrition from Health Canada. No exercise instruction or dietary intervention were provided. | |
| Outcomes | Data in meta‐analyses (or other data tables) for: GDM; caesarean birth; large‐for‐gestational age; GWG: behaviour changes associated with the intervention; gestational age at birth; birthweight. | |
| Notes | Funding:"The study was supported by operating grants from the Lawson Foundation, the Canadian Institutes of Health Research and the Public Health Agency of Canada". Declarations of interest:"The authors do not have any conflict of interest regarding the content of results presented in the text". | |
| Risk of bias | ||
| Bias | Authors' judgement | Support for judgement |
| Random sequence generation (selection bias) | Low risk | Quote: "Randomisation was performed using a computer‐generated randomisation allocation table by a staff member without involvement in the study design". |
| Allocation concealment (selection bias) | Low risk | Quote: "After randomisation, participants received a sealed envelope labelled with the assigned randomisation number, which contained instructions for participants". |
| Blinding of participants and personnel (performance bias) | High risk | Authors report: "The nature of the study meant that participants and study staff were not blinded to the types of interventions". |
| Blinding of outcome assessment (detection bias) | Unclear risk | No information provided. |
| Incomplete outcome data (attrition bias) | Unclear risk | Of 112 women randomised to intervention group, 102 (91%) were included in analyses; of 112 women randomised to control group, 88 (79%) were included in analyses. 4 women were excluded from analyses due to miscarriage (1 in the control group, 3 in the intervention group). 23 women discontinued the trial in the control group and 7 in the intervention group (due to relocation, work/study, and loss to follow‐up). Suggestion of differential attrition. |
| Selective reporting (reporting bias) | Unclear risk | With no access to a trial protocol, it was not possible to confidently assess selective reporting. |
| Other bias | Low risk | No obvious sources of other bias identified. |
| Methods | Randomised controlled trial. | |
| Participants | 113 women were randomised. Setting: Winnipeg, Manitoba, Canada (recruitment from May 2009 to December 2011). Inclusion criteria: women at < 20 weeks of pregnancy, with no existing diabetes, who signed a consent form. Exclusion criteria: none detailed (3 women were excluded because of the existence of medical or obstetric contraindications for exercise during pregnancy). | |
| Interventions | Intervention group (n = 57 women randomised) Women received a community‐based lifestyle change intervention. Dietary: women received 1‐on‐1 dietary counselling at baseline and 2 months later, using Food Choice Map software; women recalled their food intake in a typical week, and women and dietitians placed food stickers on a magnetic board (including food items, portion sizes, frequency of each food) which was scanned into the computer at the end of the session, with daily calorie intake and macronutrients analysed instantly. Nutritional recommendations were then based on the dietary intake analysis and Health Canada guidelines, with consideration of food preferences, beliefs and budgeting. GWG goals were discussed and emphasised. Women received a copy of the Food Choice Map with the agreed changes, which served as the diet plan to promote changes. The follow‐up at 2 months reinforced recommendations. Exercise: a group exercise program was delivered, in a group session or via DVD format at home. The program included mild‐to‐moderate aerobic exercise, stretching and strength exercise. Women were encouraged to exercise 3 to 5 times a week for 30 to 45 minutes, from 20 to 26 weeks to 36 weeks gestation. Women kept a log book as a motivator (attendance < 3 times at the group class, showing no interest to exercise at home or no record of exercise in the log book was considered withdrawal from the trial). Control group (n = 56 women randomised) Women received standard antenatal care, as recommended by the SOGC, and were provided with a package of current information on physical activity and healthy eating during pregnancy from Health Canada. | |
| Outcomes | Data in meta‐analyses (or other data tables) for: GDM; caesarean birth; large‐for‐gestational age; GWG: behaviour changes associated with the intervention; gestational age at birth; birthweight; Additional narrative text for: adherence to the intervention. | |
| Notes | Funding:"grant support from the Canadian Institutes of Health Research, the Lawson Foundation and the Public Health Agency of Canada". Declarations of interest:"The authors declare that there are no competing interests". | |
| Risk of bias | ||
| Bias | Authors' judgement | Support for judgement |
| Random sequence generation (selection bias) | Low risk | Quote: "Randomization was performed using a computer‐generated randomization allocation table by a staff member without involvement in the study design". |
| Allocation concealment (selection bias) | Low risk | Quote: "After randomisation participants received a sealed envelope labelled with the assigned randomisation number, which contained instructions for participants". |
| Blinding of participants and personnel (performance bias) | High risk | Authors reported that "the nature of the study meant that participants and study staff were not blinded to the types of interventions". |
| Blinding of outcome assessment (detection bias) | Low risk | Quote:"Data on delivery route, maternal weight at delivery room, birth weight and birth weight‐related obstetric procedures (induction, forceps or caesarean section) were collected from hospital medical charts by student assistants without knowledge in study design". Though not clear whether some outcomes (such as GDM and GWG) were able to be assessed blind, we have judged risk of detection bias as low. |
| Incomplete outcome data (attrition bias) | Low risk | Quote: "None of the participants discontinued during the participation". No losses or exclusions. |
| Selective reporting (reporting bias) | Unclear risk | With no access to a trial protocol, it was not possible to confidently assess selective reporting. |
| Other bias | Low risk | No obvious sources of other bias identified. |
| Methods | Randomised controlled trial. | |
| Participants | 262 women were randomised. Setting: West China Second University Hospital, China (recruitment from September 2012 to February 2013). Inclusion criteria: women with singleton pregnancies, aged ≥ 18 years, who could understand the written Chinese language, and did not have pre‐existing diabetes. Exclusion criteria: pregnancy‐related complications or general medical disorders not associated with pregnancy. | |
| Interventions | Intervention group (n = 131 randomised) Women received a lifestyle education intervention informed by the Health Belief Model. The key points of education included harms of GWG and GDM, the benefits of encouraged behaviours, the difficulties involved in change habits, and importance of belief in the efficacy of the intervention. In addition to receiving the standardised health education materials provided by the hospital as part of routine care, women received an education manual on diet and physical activity written by the research team, and had 1‐on‐1 counselling for ≥ 30 minutes with a trained graduate student, at 16 to 20 weeks gestation and 20 to 24 weeks gestation. The graduate was also available to answer questions about diet and physical activity until 20 to 24 weeks, over the phone or via a group on Tencent instant messenger. Control group (n = 131 randomised) Women received only conventional interventions such as standard health education manuals produced by the hospital. | |
| Outcomes | Data in meta‐analyses (or other data tables) for: GDM: GWG: behaviour changes associated with the intervention. | |
| Notes | Funding: not reported. Declarations of interest"The authors have no conflicts of interest". | |
| Risk of bias | ||
| Bias | Authors' judgement | Support for judgement |
| Random sequence generation (selection bias) | Low risk | Quote:"The participants were divided according to the sequence of time and randomized numbers produced by SAS version 11.0 (SAS Institute Inc, Raleigh, NC, USA)". |
| Allocation concealment (selection bias) | Unclear risk | No information provided. |
| Blinding of participants and personnel (performance bias) | High risk | Quote: "Participants and data analysts were masked to group assignment. The investigators were not masked to the assignment so that they could implement the personalized intervention for women in the intervention group". While authors reported women were blinded, blinding of women was not considered feasible in view of the intervention and control. |
| Blinding of outcome assessment (detection bias) | Unclear risk | No information provided. |
| Incomplete outcome data (attrition bias) | Unclear risk | Quote: "Only women who finished the whole study were included in the analysis". In the intervention group, of the 131 women randomised, 115 (88%) were included in the analyses (16 did not complete the trial: 1 had abnormal blood sugar; 2 had spontaneous abortions; 11 relocated; 2 lost to follow‐up). In the control group, of the 131 women randomised, 106 (81%) were included in the analyses (25 did not complete the trial: 1 had abnormal blood sugar; 2 had spontaneous abortions; 13 relocated; 9 lost to follow‐up). Suggestion of differential attrition. |
| Selective reporting (reporting bias) | Unclear risk | With no access to a trial protocol, it was not possible to confidently assess selective reporting. |
| Other bias | Low risk | No obvious sources of other bias identified. |
| Methods | Randomised controlled trial. | |
| Participants | 293 women were randomised. Setting: multi‐centre trial, with 2 rural municipalities: Kauhajoki and Lapua in Finland (from February 2008 to January 2014). Inclusion criteria: women who had 1 or more risk factors for GDM (BMI > 25 kg/m², previous history of GDM, previous child born at > 4.5 kg, aged greater than 40 years, family history of diabetes), or who had a venous plasma glucose concentration after 12 hours of fasting in the morning of 4.8 mmol/L, to 5.5 mmol/L, and a 2 hour‐OGTT plasma glucose < 7.8 mmol/L. [A 2‐hour OGTT was offered to all women at their first contact with maternal healthcare units during gestational weeks 8 to 12]. Exclusion criteria: women with GDM (fasting plasma glucose ≥ 5.6 mmol/L or 2‐hour plasma glucose ≥ 7.8 mmol/L), and women who did not want to participate in the trial for personal or professional reasons. | |
| Interventions | Intervention group (n = 155 randomised) Women received individualised, structured lifestyle counselling from specifically trained trial nurses (midwives) and dietitians, 3 times during their pregnancy (at medians of 13.3 weeks, 23.1 weeks, and 35.1 weeks). Women also attended a 2‐hour group counselling session with a dietitian at the time of enrolment. Women also visited the trial nurses at 6 weeks, 6 months and 12 months postpartum. Diet: for women with a pre‐pregnancy BMI ≥ 30 kg/m², the recommendation was no GWG during the first 2 trimesters. Dietary advice was based on Nordic Nutrition Recommendations and focused on optimising women's consumption of vegetables, fruit and berries, whole‐grain products rich in fibre, low‐fat dairy products, vegetable fats high in unsaturated fatty acids, fish, and low‐fat meat product, and lowering intakes of sugar‐rich foods. 'The plate model' was used during the counselling (filling half a plate with raw or cooked vegetables, one‐quarter with starchy carbohydrates (e.g. potato, rice or pasta) and one‐quarter with meat, fish, beans, eggs or other sources of protein). The aim was to achieve a total intake of 1600 to 1800 kcal a day, with 40% to 50% energy coming from carbohydrates, 30% to 40% energy from fats and 20% to 25% energy from protein. During the postpartum, breastfeeding and infant nutrition counselling were provided. Women filled out 3‐day food diaries every 3 months throughout the trial. Exercise: women were encourage to achieve a minimum of 150 minutes (30 minutes 5 times a week, or 50 minutes 3 times a week) of moderate‐intensity physical activity per week, and to adopt an overall active lifestyle (moderate‐intensity exercise was defined as exercise during which the women became at least slightly out of breath and perspired but were still able to talk or a level equalling 11 to 15 on Borg's visual scale of perceived exertion). Women and trial nurses (midwives) planned, and during the follow‐up updated, an individual physical activity program. Women received pedometers, with a recommendation of a minimum of 10,000 steps a day. Women had access, free of charge, to public swimming pools and/or guided exercise groups once a week provided by the municipalities. Where exercise goals were not met, women were instructed to book in with the physical activity advisor. Women completed physical activity log books. Control group (n = 138 randomised) Women received general information leaflets on diet and physical activity like those provided by local Primary Health Care centres/antenatal clinics at the time of enrolment. During their pregnancy, women visited the trial nurse 3 times, to make measurements, obtain blood samples, and administer questionnaires, as well as antenatal clinics according to standard practice. | |
| Outcomes | Data in meta‐analyses (or other data tables) for: GDM; pre‐eclampsia; hypertension (pregnancy‐induced hypertension, essential hypertension); caesarean section; GWG; behaviour changes associated with the intervention; relevant biomarker changes associated with the intervention; gestational age at birth; macrosomia; birthweight; birthweight z score; length; respiratory distress syndrome; antenatal visits. | |
| Notes | Funding:"This study was funded by the Ahokas Foundation, the Finnish Foundation for Cardiovascular Disease, Special State Subsidy for Health Science Research of Helsinki University Central Hospital, Samfundet Folkhalsan, The Finnish Diabetes Research Foundation, the State Provincial Office of Southern Finland, and The Social Insurance Institution of Finland. The funders have not had any role in designing or conducting the study; in the collection, management, analysis, or interpretation of the data; in the preparation, review, or approval of the manuscript; and in the decision to submit the manuscript for publication". Declarations of interest:"No potential conflicts of interest relevant to this article were reported". | |
| Risk of bias | ||
| Bias | Authors' judgement | Support for judgement |
| Random sequence generation (selection bias) | Unclear risk | Quote: "In the randomization process, we used randomly permuted blocks stratified by risk factors (BMI ≥30 kg/m², history of GDM)". Not stated how randomly permuted blocks were generated; thus judged to be unclear risk of selection bias. |
| Allocation concealment (selection bias) | Low risk | Quote:"The randomisation was performed by a study nurse and by dispensing the next sequentially numbered subject code and opening the corresponding code envelope, which included the intervention arm to be assigned to the subject". |
| Blinding of participants and personnel (performance bias) | High risk | Blinding of women and trial personnel not considered feasible in view of the intervention and control. |
| Blinding of outcome assessment (detection bias) | Low risk | Quote: "Blinded‐study physicians reviewed participants' obstetric records and confirmed maternal and neonatal diagnosis". |
| Incomplete outcome data (attrition bias) | Low risk | Of 155 women randomised to the intervention group, 11 (7%) were lost; thus 144 (93%) were included in the analyses; of the 138 women randomised to the control group, 13 (9%) were lost; thus 125 (91%) were included in the analyses. |
| Selective reporting (reporting bias) | Unclear risk | The trial has reported on perinatal outcomes; the trial protocol indicates that 12‐month follow‐up is also complete (this was not reported on), and that there will be ongoing follow‐up to 10 years for mothers, fathers and children. The protocol indicates additional outcomes which have not yet been reported (including maternal quality of life, cost‐effectiveness, prevention of maternal type 2 diabetes 1 year after birth, small‐for‐gestational age and neonatal hypoglycaemia). |
| Other bias | Low risk | No obvious sources of other bias identified. |
| Methods | Randomised controlled trial. | |
| Participants | 60 women were randomised. Setting: multi‐centre trial, with 2 rural municipalities: Kauhajoki and Lapua in Finland (recruitment from April 2005 to May 2006). Inclusion criteria: women who had 1 or more risk factors for GDM (BMI > 25 kg/m², previous history of GDM, previous child born at > 4.5 kg, aged > 40 years, family history of diabetes), or who had a venous plasma glucose concentration after 12 hours of fasting in the morning of 4.8 mmol/L, to 5.5 mmol/L, and a 2 hour OGTT plasma glucose of < 7.8 mmol/L. [a 2‐hour OGTT was offered to all women at their first contact with maternal healthcare units during gestational weeks 8 to 12] Exclusion criteria: women with GDM (fasting plasma glucose ≥ 5.6 mmol/L or 2‐hour plasma glucose ≥ 7.8 mmol/L), and women who did not want to participate in the trial for personal or professional reasons. | |
| Interventions | Intervention group (n = 30 randomised; n = 27 analysed) Diet: dietary advice tailored to each woman individually on 6 occasions was provided; the nurse in the healthcare centres had on average 13 appointments with the intervention women. Women were encouraged to eat a diet rich in vegetables, berries and fruits, and to use low‐fat dairy products, low‐fat meat, soft margarines and vegetable oils and whole grain products (with a goal of carbohydrate 50% to 55% energy, fibre 15 g/1000 kcal, fat 30% energy %, saturated fat < 10% energy, and protein 15% to 20% energy). Recommendation for energy intake was 30 kcal/kg/day for normal weight women and 25 kcal/kg/day for overweight women. Exercise: moderate‐intensity physical exercise during pregnancy was encouraged; the women had 6 sessions of exercise counselling with the physiotherapist. During the sessions the physiotherapist motivated the women to continue exercising during pregnancy or to start exercising, and gave written instructions for exercise and self‐care. The goal of the exercise intervention was 30 minutes of daily physical activity if the woman previously exercised < 2.5 hours per week, and 45 minutes if the woman already engaged in 2.5 hours per week. Recommended types of exercise included brisk walking, Nordic walking, swimming, cycling, and cross‐country skiing. (If the BMI of the woman was > 30 kg/m² and the woman had not been active, exercise was started with 15 minutes per day 3 times a week). Control group (n = 30 randomised; n = 27 analysed) All women were given general information on diet and physical activity to decrease the risk of GDM during pregnancy as part of routine care. Women were followed up in the antenatal clinical at 1‐month intervals according to standard care. For all women, dietary information was collected 3 times during pregnancy, and women returned a self‐reported exercise history twice, and a monthly questionnaire of activity. | |
| Outcomes | Data in meta‐analyses (or other tables data) for: GDM; GWG; relevant biomarkers associated with the intervention; birthweight. Additional narrative text for: pre‐eclampsia; caesarean birth; induction of labour; perineal trauma (lacerations); gestational age at birth; macrosomia; respiratory distress; hyperbilirubinaemia (jaundice requiring phototherapy); NICU admission. | |
| Notes | Funding:"This study was funded by Seinäjoki Central Hospital and Kuopio University Hospital, University of Eastern Finland and municipalities of Kauhajoki, Lapua i.e. employers of the authors mentioned on the title page. The study was supported by EVO funding from Kuopio University Hospital and South Ostrobothnia Hospital District". Declarations of interest:"The authors declare that they have no competing interests". | |
| Risk of bias | ||
| Bias | Authors' judgement | Support for judgement |
| Random sequence generation (selection bias) | Low risk | Quote: "These high‐risk women were randomly assigned to the lifestyle intervention group... or to the close follow‐ up group... by the study physician in the Central Hospital with the use of a computed randomisation list". |
| Allocation concealment (selection bias) | Unclear risk | As above, and "The health care nurses who scheduled the study visits did not have access to the randomisation list". |
| Blinding of participants and personnel (performance bias) | High risk | No blinding, trial described as "open". |
| Blinding of outcome assessment (detection bias) | Unclear risk | Trial described as "open". No further information provided. |
| Incomplete outcome data (attrition bias) | Unclear risk | 60 women were randomised; 54 women (90%) were analysed. 3 women dropped out from each group (4 due to early miscarriage, 1 with a twin pregnancy, and 1 woman moved away). No detail of whether the characteristics of the women lost to follow‐up differed from those analysed. |
| Selective reporting (reporting bias) | High risk | For the baseline characteristics, and a number of other outcomes, data were reported by groups, with the P values reported as "NS" (indicating non‐significance). For a number of outcomes, the data were not presented ("There was no statistically significant difference between the randomised groups in terms of pre‐eclampsia, induction of labor, lacerations, Cesarean deliveries (data not shown)".) |
| Other bias | Unclear risk | Pre‐pregnancy weight in the intervention group tended to be higher (P = 0.061) with "all women weighing over 100 kg" being in the intervention group. Women in the control group tended to have a higher educational status (P = 0.080). |
| Methods | Cluster‐randomised controlled trial. | |
| Participants | 14 municipalities, with 640 women, were randomised. Setting: maternity clinics of primary healthcare centres of 14 municipalities in Pirkanmaa region in south‐western Finland. All 14 municipalities with ≥ 70 annual deliveries were recruited to the trial (recruitment from October 2007 to December 2008). Inclusion criteria: pregnant women with ≥ 1 of the following risk factors: BMI ≥ 25 kg/m² based on measured height and self‐reported pre‐pregnancy weight, GDM or any signs of glucose intolerance or newborn macrosomia in any earlier pregnancy, type 1 or 2 diabetes in first or second degree relatives, aged ≥ 40 years. Exclusion criteria: ≥ 1 of 3 baseline OGTT measurements abnormal (fasting blood glucose ≥ 5.3 mmol/L, ≥ 10.0 mmol/L at 1 hour, and ≥ 8.6 mmol/L at 2 hours), pre‐pregnancy type 1 or 2 diabetes, unable to speak Finnish, < 18 years old, multiple pregnancy, a physical restriction preventing physical activity, substance abuse, treatment or clinical history of psychiatric illness. | |
| Interventions | Intervention group (n = 7 municipalities) The intervention continued from the first maternity clinic (8 to 12 weeks) to 37 weeks gestation. At the first visit, recommendations for GWG were discussed and an appropriate GWG graph selected to guide the woman in her GWG. The primary physical activity counselling was implemented at 8 to 12 weeks, and the primary dietary counselling session at 16 to 18 weeks. Physical activity counselling was enhanced at 4, and diet counselling at 3, subsequent visits. If the OGTT at 26 to 28 weeks was pathological, women were referred to other healthcare specialists. Diet: the goal of diet counselling was to help women achieve a healthy diet (≤ 10% saturated fat, 5% to 10% polyunsaturated fat, 25% to 30% total fat, and < 10% saccharose of total energy intake, and 25 g/day to 35 g/day fibre). Women were advised to consume vegetables, fruits and berries ≥ 5 portions a day, to select mostly high‐fibre bread and wholemeal products, to select mostly fat‐free or low‐fat versions of milk and milk products, to eat fish ≥ twice per week, to use moderate amounts of soft table spreads on bread, oil‐based salad dressings in salad and oil in cooking/baking, to consume seldom (small portions) of foods high in fat, and to consume seldom (small portions) snacks with high levels of sugar and fat. Counselling cards helped nurses to standardise counselling. The women used follow‐up notebooks to set their individualised plans and to keep a record of adherence. Physical activity counselling: aims were to increase leisure time for those women not fulfilling recommendations, or to adjust/maintain time for women who were fulfilling recommendations. The minimum weekly leisure time physical activity dose in the plan was 800 MET minutes. Women were offered an opportunity to participate in monthly group exercise sessions. Control group (n = 7 municipalities) Women received no counselling beyond usual care – which included some dietary counselling and follow‐up of GWG, but little on physical activity. | |
| Outcomes | Data in meta‐analyses (or other data tables) for: GDM; pre‐eclampsia; large‐for‐gestational age; GWG; behaviour changes associated with the intervention; relevant biomarkers associated with the intervention; sense of well‐being and quality of life; gestational age at birth; macrosomia; small‐for‐gestational age; birthweight; birthweight z score; head circumference; length; length z score; ponderal index; costs to families associated with management provided; costs associated with the intervention; costs of maternal care; costs of offspring care. Additional narrative text for: adherence to the intervention; costs associated with the intervention. | |
| Notes | Funding:"The main sources of funding in this study are (Finnish) Diabetes research fund, Competitive research funding from Pirkanmaa hospital district, Academy of Finland, Ministry of Education and Ministry of Social Affairs and Health. The funders had no role in study design, data collection and analysis, decision to publish, or preparation of the manuscript". Declarations of interest:"The authors have declared that no competing interests exist". ICC of 0.12 was used in the analyses. | |
| Risk of bias | ||
| Bias | Authors' judgement | Support for judgement |
| Random sequence generation (selection bias) | Low risk | Quote: "In the randomization process, participating municipalities were first pairwise matched with regard to annual number of births, size and socio‐economic level of the population, estimated incidence of GDM, and urbanity level. Municipalities were then randomized by computer". |
| Allocation concealment (selection bias) | Unclear risk | No information provided. |
| Blinding of participants and personnel (performance bias) | High risk | Quote: "An inevitable limitation is also that the women and the nurses in the usual care group could not be blinded for the purpose of the study, which may have resulted in changes in their health behavior or counseling practices". |
| Blinding of outcome assessment (detection bias) | Unclear risk | No information provided. |
| Incomplete outcome data (attrition bias) | High risk | 14 clusters were randomised and all included in the analyses. Of the 343 women in the intervention group and 297 women in the control group that agreed to participate (after having been screened for eligibility), 81 (24%) in the intervention group and 93 (31%) in the control group were excluded due to abnormal OGTT results at baseline (and 16 and 8 respectively due to miscarriage). The final number of women in the analyses, after further loss to follow‐up (27 in the intervention group and 16 in the control group) was 219 in the intervention group and 180 in the control group. Thus, of the women considered preliminarily eligible, who consented to participate, 219 (64%) were followed up in the intervention group, and 180 (60%) in the control group; of the women who received the allocated intervention, 219 (89%) were followed up in the intervention group and 180 (92%) in the control group. For some outcomes "n Missing" is reported in the tables – it is unclear however from which groups the missing data are from (for example, GWG "n Missing" = 31, and it is unclear if these women are from the intervention or control groups). |
| Selective reporting (reporting bias) | Unclear risk | The published trial protocol indicates that data for a number of additional outcomes including other perinatal outcomes (caesarean section and need for induction of labour), maternal quality of life, and direct and indirect costs during pregnancy have been (or will be) collected; however outcome data for these outcomes were not reported in this manuscript. In addition, 1‐year follow‐up data are expected; the manuscript does indicate that these will be published in a later report. |
| Other bias | Unclear risk | There were more women in the intervention group with high education than in the usual care group. The trial's statistical methods appear to take clustering into account, and a number of individual level characteristics such as education (unadjusted and adjusted analyses were performed). |
| Methods | Randomised controlled trial. | |
| Participants | 63 women were randomised Setting: Obstetric Unit at the Mother‐Infant Department of Policlinico Hospital, University of Modena, Modena, Italy (recruitment from April 2011 to October 2011). Inclusion criteria: pregnant women with a pre‐pregnancy BMI ≥ 25 kg/m², aged > 18 years, with a single pregnancy during their 12th week. Exclusion criteria: twin pregnancy, chronic diseases (e.g. diabetes, chronic hypertension, untreated thyroid diseases), GDM in previous pregnancies, smoking during pregnancy, previous bariatric surgery, engagement in regular physical activity, use of dietary supplements or herbal products known to affect body weight, other medical conditions that might affect body weight, plans to deliver outside the Birth Centre. | |
| Interventions | Intervention group (n = 33) Women received a "Therapeutic Lifestyle Changes (TLC) Program", with specific follow‐up for adherence at the 16th, 20th, 28th and 36th week. Diet: women were prescribed a diet consisting of 1700 kcal/day for overweight women and 1800 kcal/day for obese women, with 3 main meals and 3 snacks. The primary focus of the diet was decreasing high‐GI foods and substituting with healthier alternatives; with a second goal being redistribution of the number of meals throughout the day, with the last 2 snacks eaten after dinner to avoid hypoglycaemia at night. The target macronutrient composition was 55% carbohydrate (80% complex with low GI and 20% simple), 20% protein (50% animal and 50% vegetable), 25% fat (12% monounsaturated, 7% polyunsaturated, 6% saturated); the daily intake of carbohydrates was ≥ 225 g/day. The diet was introduced after randomisation by a gynaecologist and dietitian, with a 1‐hour counselling session about appropriate GWG at term for preventing unfavourable outcomes. Women completed Food Frequency Questionnaires at baseline and the 36th week. Exercise: the exercise component focused on developing a more active lifestyle, with women advised to participate in 30 minutes of moderate‐intensity activity ≥ 3 days a week. Women were provided with a pedometer to wear during each walking session for assessment of adherence, and were told to consider using the ‘talk test’ (to be able to maintain a conversation during activity). Control group (n = 30) Women received a simple nutritional booklet about lifestyle (in agreement with Italian Guidelines for healthy diet during pregnancy) and attended their regularly scheduled visits with their obstetrician until birth. | |
| Outcomes | Data in meta‐analyses (or other data tables) for: GDM; pregnancy‐induced hypertension; caesarean birth; induction of labour; GWG; preterm birth; behaviour changes associated with the intervention. Additional narrative text for: large‐for‐gestational age; perineal trauma; postpartum haemorrhage; Apgar score < 7 at 5 minutes; NICU admission. | |
| Notes | Funding: not reported. Declarations of interest:"The authors report no conflicts of interest". | |
| Risk of bias | ||
| Bias | Authors' judgement | Support for judgement |
| Random sequence generation (selection bias) | Low risk | Quote: "Randomization list was obtained by using a computer‐generated random allocation in blocks of three". |
| Allocation concealment (selection bias) | Low risk | Quote: "The numbers were sealed in numbered white envelopes. After eligibility assessment, the midwife open the next envelope". |
| Blinding of participants and personnel (performance bias) | High risk | Blinding of women and trial personnel not considered feasible in view of the intervention and control. |
| Blinding of outcome assessment (detection bias) | Unclear risk | No information provided. |
| Incomplete outcome data (attrition bias) | Low risk | Quote: "Two women randomized to Controls later withdrew their consent for the study. Therefore, the remnant participants were 33 in the Therapeutic Lifestyle Changes group and 28 in the Controls". |
| Selective reporting (reporting bias) | High risk | A number of outcomes are reported incompletely as "similar" between groups, or "no statistically significant differences". |
| Other bias | Low risk | No obvious sources of other bias identified. |
| Methods | Randomised controlled trial. | |
| Participants | 401 women were randomised. Setting: 6 obstetric offices in Providence, Rhode Island, USA (recruitment from 2006 to 2008). Inclusion criteria: women with a gestational age between 10 to 16 weeks, with a BMI between 19.8 kg/m² to 40 kg/m², who were non‐smoking adults (≥ 18 years), were fluent in English, had access to a telephone, and who had a singleton pregnancy. Exclusion criteria: women with self‐reported major health or psychiatric disease, with weight loss during pregnancy, or with a history of ≥ 3 miscarriages. | |
| Interventions | Intervention group (n = 201) Women in the intervention group received all aspects of standard care plus a behavioural lifestyle intervention designed to prevent excessive GWG; no intervention was provided postpartum. The intervention included 1 face‐to‐face visit with an interventionist at the onset of treatment who discussed appropriate GWG. There was an emphasis on decreasing high‐fat foods, increasing physical activity and daily self‐monitoring of eating, exercise, and weight. Women received 3 brief supportive phone calls from the dietitian during the intervention. Women who were over or under GWG guidelines during any 1‐month interval received additional phone calls (2 calls per month) that provided structured meal plans, and specific goals. Diet: recommendation: calorie goals (20 kcal/kg). Exercise: recommendation: 30 minutes walking most days of the week. Control group (n = 200) Women attended regular scheduled visits to antenatal care providers, occurring monthly until 28 weeks gestation, bi‐weekly from 28 to 36 weeks gestation, weekly until birth, and at 6 weeks postpartum. Women received standard nutrition counselling provided by physicians, nurses, nutritionists, and counsellors. Women were weighed by nurses at each visit, and attended a brief (15 minute) face‐to‐face visit at trial entry with the trial interventionist and received trial newsletters at 2‐month intervals during pregnancy and postpartum, providing information about pregnancy related issues (antenatal vitamins and maternity clothes), to improve retention in the trial. | |
| Outcomes | Data in meta‐analyses (or other data tables) for: GDM; pre‐eclampsia; hypertension; caesarean birth; GWG; behaviour changes associated with the intervention; sense of well‐being and quality of life; postnatal weight retention; return to pre‐pregnancy weight; gestational age at birth; preterm birth; macrosomia; birthweight. Additional narrative text for: breastfeeding. | |
| Notes | Funding:"Supported by the National Institutes of Health (grant DK071667)."The National Institutes of Health was not involved in the design and conduct of the study; collection, management, analysis, and interpretation of data; or the preparation, review, or approval of the manuscript". Declarations of interest:"None of the authors had a conflict of interest". | |
| Risk of bias | ||
| Bias | Authors' judgement | Support for judgement |
| Random sequence generation (selection bias) | Low risk | Quote: "Randomization was computer‐generated (by the study statistician) in randomly varying block sizes and stratified by clinic and BMI category". |
| Allocation concealment (selection bias) | Low risk | Quote: "allocation was concealed in opaque envelopes prepared by the study statistician". |
| Blinding of participants and personnel (performance bias) | High risk | Authors report "Clinic staff and physicians were blinded to subject randomisation to prevent contamination". However, blinding of women and trial personnel not considered feasible in view of the intervention and control. |
| Blinding of outcome assessment (detection bias) | Low risk | Quotes: "assessor‐blind"; "Postpartum weight, changes in demographics, and breastfeeding status (any breastfeeding compared with formula only) were obtained by a blinded research assistant at the 6‐mo postpartum visit. Obstetric records were abstracted after delivery to obtain maternal and fetal complications"; "Assessments were conducted by blind assessors at study entry, 30 wk of gestation, and 6 and 12 mo postpartum". Though not clear whether some outcomes (such as GWG) were able to be assessed blind, we have judged risk of detection bias as low. |
| Incomplete outcome data (attrition bias) | Low risk | Of the 201 women randomised to the intervention group, 188 (94%) attended the 30 week assessment visit, and 159 (79%) attended a 6‐month postpartum assessment, though 176 (88%) were included in the 6‐month postpartum analyses. Of the 200 women randomised to the control group, 187 (94%) attended the 30‐week assessment visit, and 161 (80%) attended a 6‐month postpartum assessment, though 182 (91%) were included in the 6‐month postpartum analyses. Follow‐up: 128 (64%) women in the intervention group attended a 12‐month postpartum assessment, though 164 (82%) were included in the 12‐month postpartum analyses; 133 (67%) women in the control group attended a 12‐month postpartum assessment, though 167 (84%) were included in the 12‐month postpartum analyses. [After the exclusion of women with miscarriages, GDM or subsequent pregnancies 320/358 (89% completed the 6‐month assessment, and 261/331 (79%) completed the 12‐month assessment; "Completers (n = 261) of the 12‐mo postpartum assessment were more likely to be married (71.3% compared with 48.6%; P = 0.0004) and white (67.8% compared with 54.2%; P = 0.04) and were marginally older (28.5 compared with 27.3 y; P = 0.08) than the non completers (n = 70)" |
| Selective reporting (reporting bias) | Unclear risk | With no access to a trial protocol, it was not possible to confidently assess selective reporting. |
| Other bias | Low risk | No obvious sources of other bias identified. Completers of the 6‐month postpartum assessment were older than non‐completers, but no other differences were shown (and no differences were shown at baseline between groups). |
| Methods | Randomised controlled trial. | |
| Participants | 120 women were randomised. Setting: Obstetric clinic for low‐income women at a hospital in Pittsburgh, Pennsylvania, USA. Inclusion criteria: women < 20 weeks gestation, who gave informed consent. Exclusion criteria: underweight women (BMI < 19.8 kg/m²) based on self‐reported height and pre‐pregnancy weight, aged < 18 years, whose first antenatal visit was < 12 weeks gestation, with high‐risk pregnancies (i.e. drug abuse, chronic health problems, previous complications during pregnancy, or current multiple gestation). | |
| Interventions | Intervention group (n = 61 randomised; n = 57 followed to birth) The intervention was delivered by staff with training in nutrition/clinical psychology at regular scheduled clinic visits. Women were given written and oral information regarding: appropriate GWG; exercise during pregnancy; healthy eating during pregnancy. Newsletters were mailed bi‐weekly. Between clinic visits women were contacted by phone to discuss progress towards the goals set at the previous visit. After each clinic visit, women were sent a personalised graph of their weight gain ‐ women whose GWG exceeded the recommended levels were given additional individualised nutrition/behavioural counselling using 6 steps (review of GWG chart; assessment of current eating and exercise based on 24‐hour recall or review of self‐monitoring records). Diet: the primary focus of the intervention was on decreasing high‐fat foods, and substituting healthier alternatives. If these approaches did not help the woman achieve the recommended weight, a more structured meal plan and individualised calorie goals were set. Exercise: the intervention focused on increasing walking and developing a more active lifestyle. Control group (n = 59 randomised; n = 53 followed to birth) Women received standard care, including standard nutrition counselling provided by the physicians, nutritionists and counsellors at Magee‐Women’s Hospital. This counselling emphasised a well‐balanced dietary intake and advice to take a multivitamin/iron supplement. No information or counselling was provided by the research staff. | |
| Outcomes | Data in meta‐analyses (or other data) for: GDM; pre‐eclampsia; hypertension; caesarean birth; GWG; behaviour changes associated with the intervention; postnatal weight retention; gestational age at birth; preterm birth; macrosomia; birthweight. | |
| Notes | Funding:"This work was funded by a grant from Magee‐Womens Health Foundation; Magee‐Womens Research Institute awarded to Dr Wing". Declarations of interest: not reported. | |
| Risk of bias | ||
| Bias | Authors' judgement | Support for judgement |
| Random sequence generation (selection bias) | Unclear risk | Quote: "Women were randomly assigned"; no further information provided. |
| Allocation concealment (selection bias) | Unclear risk | No information provided. |
| Blinding of participants and personnel (performance bias) | High risk | Blinding of women and trial personnel not considered feasible in view of the intervention and control. |
| Blinding of outcome assessment (detection bias) | Unclear risk | No information provided. |
| Incomplete outcome data (attrition bias) | Low risk | Minimal losses to follow‐up during the pregnancy period: of 61 women randomised to the intervention group, 2 women moved out of the area, 1 had a miscarriage, and 1 withdrew; thus 57 (93%) were followed to delivery; in the control group, of 59 women randomised, 4 women moved out of the area and 2 had miscarriages; thus 53 (90%) were followed to delivery. Follow‐up: an additional 23 intervention group women were lost to postpartum follow‐up, thus 34 (56%) were followed postpartum; an additional 13 control group women were lost postpartum, thus 40 (68%) were followed postpartum. |
| Selective reporting (reporting bias) | Unclear risk | While outcomes were described in the methods, with no access to a trial protocol, it is not possible to confidently assess selective reporting. |
| Other bias | Low risk | No obvious sources of other bias identified. |
| Methods | Randomised controlled trial. | |
| Participants | 183 women were randomised. Setting: 4 hospitals in the UK (Glasgow, Newcastle, London), in urban settings (recruitment from March 2010 to May 2011). Inclusion criteria: women with a BMI ≥ 30 kg/m², singleton pregnancy, a gestational age > 15 weeks and < 17 + 6 weeks. Exclusion criteria: women unable or unwilling to give informed consent, at a gestation < 15 weeks and > 17 + 6 weeks, with pre‐existing diabetes, pre‐existing essential hypertension (treated), pre‐existing renal disease, a multiple pregnancy, systemic lupus erythematosus, antiphospholipid syndrome, sickle cell disease, thalassaemia, coeliac disease, who were prescribed metformin, had a thyroid disease or current psychosis. | |
| Interventions | Intervention group (n = 94 randomised) Women in the intervention group attended a 1‐to‐1 appointment with a"Health Trainer" (no specific health professional qualification, but experience in behaviour modification and conducting group sessions) – and were invited to attend weekly group sessions for 8 consecutive weeks from 19 weeks gestation. The intervention was informed by psychological models of health behaviour. SMART (specific, measurable, achievable, relevant, time specific) diet and activity goals were set, with behaviours recorded in a log book. Identification of benefits and overcoming barriers to behaviour change, and increasing self‐efficacy were included; social support was facilitated through the group format. For women unable to attend, the session content was delivered by phone or email. At the initial 1‐to‐1 appointment, women received a handbook, a pedometer, a log‐book (for weekly SMART goals and related behaviours) and a DVD of a specifically devised pregnancy exercise regimen. Each group session delivered a different element of the dietary and physical activity intervention; goals from the previous week were reviewed and goals set for the following week. Diet: the focus on the advice was on increased consumption of foods with a low GI, including replacing sugar sweetened beverages with low‐GI alternatives; reduction in saturated fats, and replacement with monosaturated and polyunsaturated fat was recommended; exchange of foods was emphasised – high GI food for low GI food – rather than limiting energy intake. Exercise: women were encouraged to increase daily physical activity incrementally, setting goals of incremental step counts (monitored by pedometers) and maintaining the achieved physical activity level after the intervention period. Recommendations included an emphasis on walking at moderate‐intensity level. Control group (n = 89 randomised) Women in the control group received standard antenatal care, and returned for data collection appointments with the trial midwife at 27 to 28 + 6 weeks and 34 to 36 + 6 weeks (where possible with coinciding antenatal visits). All women attended routine antenatal care appointments and received advice regarding diet and physical activity according to local policies, which draw on UK NICE guidelines. | |
| Outcomes | Data in meta‐analyses (or other data tables) for: GDM; large‐for‐gestational age; behaviour changes associated with the intervention; sense of well‐being and quality of life; macrosomia. Additional narrative text for: GWG; adherence to the intervention; views of the intervention. | |
| Notes | Funding:"This paper presents independent research commissioned by the National Institute for Health Research (NIHR) (UK) under the Programme Grants for Applied Research programme RP‐0407‐10452. The views expressed in this paper are those of the author(s) and not necessarily those of the National Health Service, the NIHR or the Department of Health. The study was also supported by Guys and St.Thomas’ Charity; Reg Charity 251983, UK; Chief Scientist Office, Scottish Government Health Directorates, Edinburgh, UK and Tommy’s Charity; Reg Charity 1060508, UK". Declarations of interest:"The authors declare that they have no competing interests". | |
| Risk of bias | ||
| Bias | Authors' judgement | Support for judgement |
| Random sequence generation (selection bias) | Low risk | Quote: "The randomised treatment was allocated automatically, balanced by minimisation for maternal age, centre, ethnicity, parity and BMI". |
| Allocation concealment (selection bias) | Low risk | Quote: "Randomisation was performed online". |
| Blinding of participants and personnel (performance bias) | High risk | Blinding of women and trial personnel not considered feasible in view of the intervention and control. |
| Blinding of outcome assessment (detection bias) | Unclear risk | No information provided. |
| Incomplete outcome data (attrition bias) | Low risk | 94 women were allocated to the intervention group; 15 women and 9 neonates were lost to follow‐up; 4 women discontinued the intervention and 4 withdrew. 89 women were allocated to the control group: 14 women and 5 neonates were lost to follow‐up. Therefore, for the intervention group, 79 (84%) women and 85 (90%) neonates were included in the analysis, and 75 (84%) women and 84 neonates (94%) in the control group. |
| Selective reporting (reporting bias) | Unclear risk | With no access to a trial protocol, it was not possible to confidently assess selective reporting. The methods specify a number of clinical outcomes for which data were "recorded but not reported". |
| Other bias | Low risk | No obvious sources of other bias identified. |
| Methods | Randomised controlled trial. | |
| Participants | 1555 women were randomised. Setting: antenatal clinics in 8 inner‐city National Health Service Trust Hospitals in the UK: London (3 centres), Bradford, Glasgow, Manchester, Newcastle, and Sutherland (from March 31 2009 to June 2 2014). Inclusion criteria: women > 16 years with a BMI ≥ 30 kg/m², a singleton pregnancy, between 15 weeks and 18 weeks plus 6 days gestation. Exclusion criteria: women who were unable or unwilling to give informed consent, with underlying disorders including pre‐pregnancy diagnosis of essential hypertension, diabetes, renal disease, systemic lupus erythematosus, antiphospholipid syndrome, sickle cell disease, thalassaemia, celiac disease, thyroid disease, and current psychosis; and using metformin. | |
| Interventions | Intervention group (n = 783 randomised) The intervention was informed by control theory and elements of social cognitive theory. Within a week of randomisation, women attended an individual interview at their centre, with a health trainer (a person with skills in assisting behavioural change, but not necessarily a health professional). Women had 8 further health trainer‐led group or individual sessions of 1 hour, weekly; where women could not attend in person, material was provided by telephone or email. Sessions addressed approaches to achieving SMART (specific, measurable, achievable, relevant and time specific) goals. Women received advice on: self‐monitoring, identifying, and problem‐solving barriers to behaviour change; enlisting social support; and providing opportunities for social comparison. Women also received a handbook with information about the intervention, with recommended foods and recipes and suggestions for physical activity. In addition, women were provided with a DVD of an exercise regimen safe pregnancy, a pedometer, and a log book for recording their weekly goals. Diet: the diet intervention aimed to promote healthy eating, but not necessarily restrict energy intake; women received tailored recommendations which suggested exchanging foods with medium‐to‐high GI for those with a lower GI, and restricting intake of saturated fat. Exercise: women were encouraged to incrementally increase walking from a pedometer assessed baseline. The initial goal for walking activity was tailored to each woman's pre‐existing activities. The emphasis was walking at moderate intensity, with additional options included, for women who already engaged in some physical activity. Control group (n = 772 randomised) Women in the control group received standard antenatal care, at their trial centre, in accordance with local practice. Typically, women attended 9 appointments. The local practice for women with obesity was informed by the UK NICE guidelines, which stated that women should be advised at first contact with a health professional, and at no other time, about a healthy diet and the benefits of physical activity. The women returned for data collection appointments with the trial midwife at 27 to 28 + 6 weeks and 34 to 36 + 6 weeks (where possible with coinciding antenatal visits). No further information was provided to control group women, about benefits of physical activity and diet, beyond that given, as per UK NICE guideline informed practice, in the initial session. | |
| Outcomes | Data in meta‐analyses (or other data tables) for: GDM; pre‐eclampsia; caesarean birth; perinatal mortality; large‐for‐gestational age; operative vaginal birth; induction of labour; placental abruption; postpartum haemorrhage; postpartum infection; GWG; behaviour changes associated with the intervention; relevant biomarkers associated with the intervention; breastfeeding; postnatal weight retention; postnatal BMI; stillbirth; neonatal mortality; gestational age at birth; preterm birth; macrosomia; small‐for‐gestational age; birthweight; head circumference; adiposity; neonatal hypoglycaemia; childhood weight; childhood weight z score; childhood height; childhood height z score; childhood head circumference; childhood adiposity; length of antenatal stay; NICU admission; length of postnatal stay (mother); length of postnatal stay (baby). Additional narrative text for: adherence to the intervention. | |
| Notes | Funding:"Our research was funded by the UK’s National Institute for Health Research (NIHR) under its grants for applied research programme (RP‐PG‐0407‐10452). Support was also received from the NIHR collaboration for leadership in applied health research (to JS, PTS, and ALB). Contributions to funding were also provided by the Chief Scientist Office Scottish Government Health Directorates (Edinburgh) (CZB/A/680), Guys and St Thomas’ Charity, Tommy’s Charity (to LP, ALB, and NP), and the NIHR Biomedical Research Centre at Guy’s and St Thomas’ NHS Foundation Trust and King’s College London. KMG is supported by the NIHR through the NIHR Southampton Biomedical Research Centre. LP and KMG are supported by the European Union’s seventh framework programme (FP7/2007‐2013; project EarlyNutrition, grant agreement 289346). The views expressed in this Article are those of the authors and not necessarily those of the UK’s National Health Service, the NIHR, or the Department of Health in England". Declarations of interest:"LP reports a research grant from Abbott Nutrition, outside the submitted work. TABS reports personal consultancy fees from the Natural Hydration Council, Heinz Foods, Archer Daniels Midland, the Global Dairy Platform, and GlaxoSmithKline, outside the submitted work; and is a trustee and scientific governor for the British Nutrition Foundation, outside the submitted work. KMG reports reimbursement of travel and accommodation expenses from Nestle Nutrition Institute, outside the submitted work; research grants from Abbott Nutrition and Nestec, outside the submitted work; and patents pending for phenotype prediction, predictive use of CpG methylation, and maternal nutrition composition, outside the submitted work. All other authors declare no competing interests". | |
| Risk of bias | ||
| Bias | Authors' judgement | Support for judgement |
| Random sequence generation (selection bias) | Low risk | Quote: "We used a computer‐generated randomisation procedure via a password‐protected website". |
| Allocation concealment (selection bias) | Low risk | Quotes: "We used a computer‐generated randomisation procedure via a password‐protected website"; "allocation to study groups was done by centre's UPBEAT trial midwife". |
| Blinding of participants and personnel (performance bias) | High risk | Authors reported: "in view of the nature of the intervention, participants and staff were aware of allocations". |
| Blinding of outcome assessment (detection bias) | Unclear risk | No information provided. |
| Incomplete outcome data (attrition bias) | Unclear risk | Of the 783 women randomised to the intervention group, primary outcome data were available for 629 (80%) mothers, and 761 (97%) infants; and of the 772 women randomised to the control group primary outcome data were provided for 651 (84%) mothers and 751 (97%) infants. Authors reported that "the main reason for missing outcome data was that participants declined to attend further study visits". More women in the intervention group (129; 16%) compared with the control group (92; 12%) failed to complete the OGTT required for the primary outcome. Follow‐up: 1522 women were approached for 6‐month follow‐up, 720 (47%) infants, and 707 (47%) women took part. Authors reported that: "in comparison with those who did not take part, mothers who attended the 6‐month visit were on average 1.3 years older, more likely to be Caucasian, nulliparous, to have had gestational diabetes mellitus in the index pregnancy...and were less likely to be current smokers" and "infants who attended the 6‐month appointment had a greater gestational age at delivery...were 67g heavier, and more likely to have been breast‐fed at birth than those who did not attend". |
| Selective reporting (reporting bias) | Low risk | Outcomes appear to have been measured and reported (though not yet in full) as per published trial protocol. |
| Other bias | Low risk | No obvious sources of other bias identified. |
| Methods | Cluster‐randomised controlled trial. | |
| Participants | 250 women from 8 gynaecological practices. Setting: gynaecological practices in Munich, Germany (from February 2010 to August 2011). Inclusion criteria: pregnant women, > 18 years, with a singleton pregnancy, prior to their 18th week of pregnancy, with a BMI ≥ 18 kg/m², with "sufficient" German language. Exclusion criteria: women with any condition preventing physical activity (cervical incompetence, placenta praevia, persistent bleeding), pre‐pregnancy diabetes, uncontrolled chronic diseases that could affect weight development (thyroid dysfunction, psychiatric diseases). | |
| Interventions | Intervention group (4 practices: 83 women recruited, 74 analysed) The FeLIPO (feasibility of a lifestyle intervention in pregnancy to optimise maternal weight development) intervention had 2 individual counselling sessions, given by trained researchers during the 20th (lasting up to 60 minutes, and including the main components of the intervention) and 30th (lasting 30 minutes, repeating topics from the first, with a 'problem‐oriented' manner) week of gestation. The counselling focused on nutrition, physical activity and GWG monitoring, and during both sessions women received feedback on their nutrition and physical activity habits based on 7‐day dietary records and physical activity questionnaires. The intervention had 3 main parts: general information on a healthy lifestyle during pregnancy; promoting self‐monitoring (diet, physical activity, GWG); setting behavioural goals. Diet: general topics such as energy balance and health nutrition (according to the German Nutrition Society) were explained; women were informed about additional energy requirements, and macro and micro nutrition requirements in pregnancy. The advice aimed to decrease the intake of energy‐dense foods and high‐fat foods and substitute them for low‐fat alternatives, and aimed to increase consumption of fruit, vegetables and wholegrain products. The advice also focused on improving the quality of fat consumed (increasing fish consumption; choosing the correct fat/oil for cooking). Exercise: the advice given was in accordance with current guidelines for physical activity in pregnancy from the SOGC and the ACOG. The recommendations used the FITT (frequency, intensity, time, type) criteria: 30 minutes of moderate‐intensity activity on most days, at an appropriate heart‐rate zone. Non weight‐bearing/low‐impact endurance exercises were suggested (walking, cycling, swimming, aquatic exercises). Women were additionally provided with a list of adequate local antenatal physical activity programs and advised to participate in such programs. Each woman received a GWG chart personalised according to her baseline BMI group, which incorporates the IOM's GWG recommendations. Women were asked to use their chart to monitor their weight development, weekly. Control group (4 practices: 167 women recruited, 152 analysed) Women in the control group received routine care, which included an information leaflet with 10 general statements about a healthy lifestyle during pregnancy (but no advice on diet or gaining weight). | |
| Outcomes | Data in meta‐analyses (or other data tables) for: GDM: caesarean birth; large‐for‐gestational age; operative vaginal birth; induction of labour; GWG; behaviour changes associated with the intervention; breastfeeding; postnatal weight retention; preterm birth; small‐for‐gestational age; birthweight; length; child weight. | |
| Notes | Funding:"The study was partially funded by the Else Kröner‐Fresenius Foundation, Bad Homburg. This work was supported by the German Research Foundation (DFG) and the Technische Universität München within the funding programme Open Access Publishing". Declarations of interest:"The authors declare that they have no competing interests". ICC of 0.12 was used in analyses. | |
| Risk of bias | ||
| Bias | Authors' judgement | Support for judgement |
| Random sequence generation (selection bias) | Low risk | Quote: "were randomly assigned to either an ‘intervention’ or ‘control group’ using a computer‐generated randomization allocation table". |
| Allocation concealment (selection bias) | Unclear risk | Quote:"Randomization was performed by a research not involved in the study design thereby preventing allocation bias". |
| Blinding of participants and personnel (performance bias) | High risk | The trial was "open‐label". Quote: "The nature of the study meant that participants and study staff were not blinded to the types of interventions". |
| Blinding of outcome assessment (detection bias) | Unclear risk | No information provided. |
| Incomplete outcome data (attrition bias) | Low risk | 83 women were recruited to the control group; and 167 to the intervention group. 4 (5%) women from the control group withdrew (relocation, personal reasons, unable to contact) and 8 (5%) women in the intervention group withdrew (personal reasons, complications in pregnancy). A further 3 (7% total) women in the intervention group were considered 'drop‐outs' (miscarriages, and late‐term abortion). Women who gave birth preterm (5 in the control group; 4 in the intervention group) were excluded from the GWG analysis. Follow‐up: 72 (87%) women in the control group and 152 (91%) in the intervention group could be contacted at the 4‐month follow‐up. 65 (78%) women in the control group and 148 (89%) women in the intervention group were included in the 1‐year follow=up. |
| Selective reporting (reporting bias) | Unclear risk | With no access to a trial protocol, it was not possible to confidently assess selective reporting. |
| Other bias | High risk | Quote: "During recruitment, however it turned out that it was easier to recruit women for the intervention group than for the control group, yielding a 2:1 ratio". The authors speculated that this may have been due to unmotivated gynaecologists/practice staff recruiting women, or low numbers of pregnant women among the control practices; they acknowledge that as practice staff and women were not blinded, knowledge of the 'control group' status of these practices may have influence recruitment and participation rates, raising the possibility of post‐randomisation selection. Pre‐pregnancy weight and BMI were "although slightly" significantly higher in the control group, compared to the intervention group (with more overweight and obese women in the control group); median weight at the first antenatal visit was also higher among women in the control group. The sample size calculations did not take into account clustering. |
| Methods | Randomised controlled trial. | |
| Participants | 606 women were randomised. Setting: 8 healthcare clinics in southern Norway, cities of Kristiansand and Mandal, as well as the more rural surrounding areas (recruitment from September 2009 to February 2013). Inclusion criteria: women who were nulliparous, with a singleton pregnancy at ≤ 20 weeks gestation, with a pre‐pregnancy BMI ≥ 19 kg/m², who were literate in Norwegian or English, who provided informed signed consent. Exclusion criteria: women with pre‐existing diabetes, disabilities precluding participation in a physical fitness program, continued substance abuse or planned relocation outside of the trial area before birth. | |
| Interventions | Intervention group (n = 303 randomised) Women received the Norwegian Fit for Delivery (NFFD) intervention, a lifestyle intervention that included dietary counselling and an exercise program. The NFFD lifestyle counselling and recommendations were reinforced with booklets, access to an Internet site, and with an invitation to 1 cooking class, as well as to an evening meeting (which provided information on the trial and the value of healthy eating and exercise in pregnancy). Diet: focused on 10 recommendations designed to increase awareness of food choices, with specific advice on portion sizes, regular meal patterns, limiting the consumption of snack foods, and increasing the intake of water, fruits and vegetables. The dietary counselling was performed by telephone, with an initial consultation and then a follow‐up 4 to 6 weeks later, each of approximately 20 minutes. Counsellors were either experienced clinical dietitians or graduate students in public health, trained and supervised by the NFFD team. Women were informed of the recommended GWG based on pre‐pregnancy BMI and current IOM guidelines. Exercise: women were advised to attend twice‐weekly exercise classes at a local gym facility, all following the same pattern: 10 minutes of warm‐up, 40 minutes of strength training and cardiovascular exercise at moderate intensity (using aerobics, callisthenics, and weight training), and 10 minutes of stretching. The intensity of the exercise was self‐monitored using Borg’s scale of perceived exertion, with a target intensity of 12 to 14 on the 6 to 20 scale. Classes were led by physical therapists or students in sports science who were trained and quality‐controlled by the NFFD team. Although practical and economic considerations limited classes to 2 per week, women were encouraged to be physically active at moderate intensity on 3 additional days per week, and activity was assessed using questionnaire responses in late pregnancy. Control group (n = 303 randomised) Women in the control group received routine antenatal care in accordance with Norwegian standards: 8 antenatal appointments, including 1 second‐trimester ultrasound examination, with additional care as needed. The standard care was provided through alternating visits with midwives and doctors, as per standard practice. All women, including those in the control group, received a booklet with advice on antenatal nutrition and physical activity, including recommendations for GWG based on the IOM guidelines. | |
| Outcomes | Data in meta‐analyses (or other data tables) for: GDM; pre‐eclampsia, caesarean birth; large‐for‐gestational age; operative vaginal birth; perineal trauma; postpartum haemorrhage; GWG; behaviour changes associated with the intervention; postnatal weight retention; return to pre‐pregnancy weight; stillbirth; gestational age at birth; Apgar score < 7 at 5 minutes; preterm birth; macrosomia; small‐for‐gestational age; birthweight; length; head circumference; ponderal index; shoulder dystocia; admission to NICU. Additional narrative text for: breastfeeding; adherence to the intervention. | |
| Notes | Funding:"The NFFD trial was funded by the Norwegian South‐Eastern Regional Health Authority, with additional funding from the municipalities of Aust Agder and Vest Agder. The funders had no role in study design, data collection and analysis, decision to publish, or preparation of the article". Declarations of interest:"Full disclosure of interests available to view online as supporting information;" "Dr. Sagedal reports grants from South‐Eastern Norway Regional Health Authority and grants from the municipalities of southern Norway, during the conduct of the study;" All other authors "nothing to disclose". | |
| Risk of bias | ||
| Bias | Authors' judgement | Support for judgement |
| Random sequence generation (selection bias) | Low risk | Quote: "using a computer‐generated list with 1 : 1 allocation ratio in blocks of 20". |
| Allocation concealment (selection bias) | Unclear risk | Quote: "A research nurse assigned participants...The research nurse never met the participants, had no role in recruitment or measurements, and had no knowledge of questionnaire responses". |
| Blinding of participants and personnel (performance bias) | High risk | Quote: "It was not feasible to blind participants to their group allocation, but they were instructed to refrain from revealing this to assessors". |
| Blinding of outcome assessment (detection bias) | Low risk | Quote; "All examinations, blood test evaluations, record reviews, and scoring of questionnaire responses were performed by assessors blinded to group allocation". |
| Incomplete outcome data (attrition bias) | Low risk | Of the 303 women randomised to the intervention group, 296 (98%) were included in the main analyses; of the 303 women randomised to the control group, 295 (97%) were included in the main analyses (14 and 15 women respectively withdrew from the participation but consented to data collection). Follow‐up: of the 591 women included in the analyses, 32 withdrew consent and 1 had a stillborn, leaving 558 eligible for follow‐up; after exclusion of those who were not weighed ≥ once postpartum (6 or 12 months) and those who were subsequently pregnant at 12 months postpartum, 201 (66%) of the 303 women in the intervention group and 188 (62%) of the 303 women in the control group were included in the 12‐month analyses. Authors reported that compared with measured women at 12 months, missing women at 12 months follow‐up were "somewhat younger...had lower educational levels...lower income ...and tended to have a higher pre‐pregnancy BMI...Women with missing postpartum data had a similar GWG to those measured". |
| Selective reporting (reporting bias) | Low risk | Outcomes reported as per the published trial protocol, except for the pre‐specified outcomes 'maternal glucose levels, and 'hormones related to glucose metabolism". |
| Other bias | Low risk | No obvious sources of other bias identified. |
| Methods | Randomised controlled trial. | |
| Participants | 360 women were randomised. Setting: 2 university hospitals in Denmark: Odense and Aarhus University Hospital (recruitment from October 2007 to October 2010). Inclusion criteria: women aged 18 to 40 years at 10 to 14 weeks gestation, with a BMI of 30 to 45 kg/m² as calculated from pre‐pregnancy weight or first measured weight in pregnancy. Exclusion criteria: women with prior serious obstetric complications, chronic diseases (e.g. hypertension and diabetes); positive OGTT in early pregnancy, alcohol or drug abuse, who were Non‐Danish speaking, with a multiple pregnancy. | |
| Interventions | Intervention group (n = 180 randomised, n = 150 analysed) Dietary counselling was performed by trained dietitians on 4 separate occasions, at 15, 20, 28 and 35 weeks gestation, to limit GWG to 5 kg. The counselling included advice based on the official Danish recommendations. Diet: energy requirements were individually estimated according to weight and level of activity. Exercise component: women were encouraged to be moderately physically active 30 to 60 minutes daily and were equipped with a pedometer to motivate and improve daily activity. They also had free full membership to a fitness centre for 6 months where they had closed training classes with physiotherapists for 1 hour each week. Training consisted of aerobic (low‐step), training with light weights and elastic bands, and balance exercises. After training women were grouped 4 to 6 times with a physiotherapist using coaching‐inspired methods for improving integration of activity into daily life. Control group (n = 180 randomised, n = 154 analysed)) Women in the control group received the same initial information about the purpose and content of the trial, including access to a website with advice about dietary habits and physical activities in pregnancy, but no additional intervention. Weight was measured at all antenatal visits, all women had the same follow‐up program including repeated monitoring of blood pressure and 2 additional ultrasounds in third trimester. | |
| Outcomes | Data in meta‐analyses (or other data tables) for: GDM; pre‐eclampsia; caesarean birth; large‐for‐gestational age; GWG; behaviour changes associated with the intervention; relevant biomarkers associated with the intervention; breastfeeding; return to pre‐pregnancy weight; maternal cardiovascular health; stillbirth; gestational age at birth; preterm birth; macrosomia; birthweight; birthweight z score; length; childhood weight; childhood height; childhood adiposity; childhood cardiovascular health; NICU admission. Additional narrative text for: adherence with the intervention. | |
| Notes | Funding:"The study was supported by Trygfonden, The Health Insurance Foundation (Helsefonden), the Faculty of Health Sciences, University of Southern Denmark, the Danish Diabetes Association, Odense University Hospital, the NoVo Foundation, the Danish Medical Association Research Foundation, Aase og Ejnar Danielsens Fond, CMA Medico, and Ferrosan A/S". Follow‐up: "Funding for this study was obtained from Odense University Hospital, The Hede Nielsen Family foundation, The A.P. Møller Foundation for the Advancement of Medical Science and Sister lodge No. 3 Freja I.O.O.F. MT is a recipient of PhD scholarships from The Region of Southern Denmark, The faculty of Health sciences, University of Southern Denmark and The Danish PhD school of Molecular Metabolism. The funders had no role in study design, data collection and analysis, decision to publish, or preparation of the manuscript". Declarations of interest:"The authors have declared that no competing interests exist". | |
| Risk of bias | ||
| Bias | Authors' judgement | Support for judgement |
| Random sequence generation (selection bias) | Low risk | Quote: "participants were randomized 1:1 by computer‐generated numbers". |
| Allocation concealment (selection bias) | Low risk | Quote:"in closed, opaque envelopes". |
| Blinding of participants and personnel (performance bias) | High risk | Trial described as "non‐blinded"; quotes:"blinding was not possible for pragmatic reasons"; "there was no blinding to patients or healthcare professionals". |
| Blinding of outcome assessment (detection bias) | Unclear risk | Trial described as "non‐blinded". No further information provided. For 2.8‐year follow‐up: "All children were measured by a medical doctor (M.T.) and a research bioanalyst, both blinded to the LiP intervention". |
| Incomplete outcome data (attrition bias) | Unclear risk | Of the 180 women randomised to each group (360 total), 56 (16%) women dropped out. 30 women dropped out from the intervention group (GDM: 9, withdrew: 18, missed miscarriage: 1, misclassification: 2) and 26 from the control group (GDM: 3, withdrew: 14, twins: 2, missed miscarriage: 4, abortion: 3); thus 150 (83%) women in the intervention group and 154 (86%) in the control group were included in analyses. Follow‐up: at 6‐month postpartum follow‐up, 238 (66%) women were included (123 (68%) in the intervention group, 115 (64%) in the control group); the 66 women who did not attend, and were excluded had "higher mean pre gestational BMI, higher GWG and more obstetric or neonatal complications, but the differences were not significant compared with those who did not attend". For 2.8‐year follow‐up: 301 children were eligible; 157 (52%) were analysed (82 (55%) of 148 in the intervention group and 75 (49%) 153 in the control group). |
| Selective reporting (reporting bias) | Unclear risk | With no access to a trial protocol, it was not possible to confidently assess selective reporting. A protocol for the infant follow‐up was supplied as supporting information. The trial registration lists "Metabolic Markers" as secondary outcome measures, however data were not reported for these outcomes. Some data are reported incompletely, e.g. breastfeeding at 5 months, "no differences between the intervention groups", and weight development from 0‐5 months and 0‐12 months "no difference...between the intervention groups...(data not known)". |
| Other bias | Unclear risk | The groups did not differ significantly on any maternal baseline characteristics, although there were more smokers in the control group despite stratified randomisation (11.7% versus 7.3%). The dropout group was older and had a higher percentage with a BMI ≥ 40 kg/m², and a higher percentage of smokers, compared with the completing group (though not statistically significant). For the follow‐up trial: "At baseline, there were no differences between those who attended and who were lost to follow‐up except for 20‐h OGTT plasma glucose values performed at 28 weeks gestation". |
| Methods | Randomised controlled trial. | |
| Participants | 299 women were randomised. Setting: Department of Obstetrics and Gynecology, Peking University First Hospital, China (recruitment from September 2012 to January 2013). Inclusion criteria: women before the 8th gestational weeks, with ≥ 1 risk factor for GDM including age. Exclusion criteria: pre‐existing diabetes, multiple pregnancy, ≥ 35 years, pre‐pregnancy BMI ≥ 25 kg/m², family history of diabetes mellitus, history of polycystic ovary syndrome, history of GDM or macrosomia from a previous pregnancy | |
| Interventions | Intervention group (n = 151 randomised) All women in the intervention group received routine antenatal care plus a standardised lifestyle intervention delivered at 6 to 8 weeks gestation, and enforcement interventions informed by maternal anthropometrics at 12 to 13 gestational weeks. The standardised courses were delivered by 1 physician and included 3 courses: 'What is a balanced diet?'; 'Proper physical activity is beneficial during pregnancy'; and 'Standard weight‐gain during pregnancy'. Each course was group based (< 6 women per group) and lasted 40 to 60 minutes. Diet: key take‐home messages relating to diet provided in the courses were: following a balanced diet, defined according to the dietary pagoda of pregnant women in China; and achieving standard GWG, defined according to the IOM 2009 recommendations. Exercise: a key take‐home message of the physical activity course was 'proper physical activity is beneficial during pregnancy'. Women were encouraged to walk engage in 30 minutes of walking after a meal ≥ once a day. Control group (n = 150 randomised) All women in the control group received routine antenatal care, and were followed until a 75 OGTT was administered at 24 to 28 weeks gestation. | |
| Outcomes | Data in meta‐analyses for: GDM; GWG. | |
| Notes | Funding: not reported. Declarations of interest: not reported. Reported to be cluster‐randomised, however no indication in reported methods that 'clusters' were randomised, and rather, appeared to be individually randomised. | |
| Risk of bias | ||
| Bias | Authors' judgement | Support for judgement |
| Random sequence generation (selection bias) | Unclear risk | Authors reported that the trial was cluster randomised. However, it is not clear how clustering was used. The sequence generation is simply described as: "exponential random numbers produced the intervention group and the control group". |
| Allocation concealment (selection bias) | Unclear risk | No information provided. |
| Blinding of participants and personnel (performance bias) | High risk | Blinding of women and trial personnel not considered feasible in view of the intervention and control. |
| Blinding of outcome assessment (detection bias) | Unclear risk | No information provided. |
| Incomplete outcome data (attrition bias) | Low risk | Of the 151 women randomised to the intervention group, 134 (91%) were followed up and included in the analyses (2 refused, 3 had pre‐existing diabetes, 4 did not have singleton pregnancies, 8 had abortions). Of the 150 women randomised to the control group, 138 (92%) were followed up and included in the analyses (7 refused, 1 did not have a singleton pregnancy, 4 had abortions). |
| Selective reporting (reporting bias) | Unclear risk | With no access to a trial protocol, it was not possible to confidently assess selective reporting. |
| Other bias | Unclear risk | Limited methodological detail provided; insufficient information to determine risk of other bias. |
Abbreviations: ACOG: American College of Obstetricians and Gynecologists; ADA: American Diabetes Association; BMI: body mass index; FeLIPO: Feasibility of a Lifestyle Intervention in Pregnancy to Optimise maternal weight development; FITT: frequency, intensity, time, type; GDM: gestational diabetes mellitus; GCT: glucose challenge test; GI: glycaemic index; GWG: gestational weight gain; IOM: Institute of Medicine; MET: multiples of resting metabolic equivalents; NFFD: Norwegian Fit for Delivery; NICE: National Institute for Health and Care Excellence; NICU: neonatal intensive care unit; NIH: National Institutes for Health; NIHR: National Insitute for Health Research; OGTT: oral glucose tolerance test; SOGC: Society of Obstetricians and Gynaecologists Canada; UK: United Kingdom; USA: United States of America.
Characteristics of excluded studies [ordered by study ID]
| Study | Reason for exclusion |
| This randomised controlled trial assessed the effects of an exercise intervention. | |
| This randomised controlled trial included women with GDM. | |
| This randomised controlled trial assessed the effects of a dietary intervention. | |
| This randomised controlled trial included women with borderline GDM. | |
| This was a non‐randomised controlled trial. | |
| This randomised controlled trial assessed the effects of a dietary intervention. | |
| This randomised controlled trial assessed the effects of an exercise intervention. | |
| This ongoing randomised controlled trial is recruiting and randomising women pre‐conception. | |
| This randomised controlled trial assessed the effects of a dietary intervention. | |
| This randomised controlled trial included women with GDM. | |
| This randomised controlled trial assessed the effects of a dietary intervention. | |
| This randomised controlled trial assessed the effects of different exercise interventions. | |
| This randomised controlled trial assessed the effects of a diet and exercise intervention compared with a diet alone intervention and an exercise alone intervention. | |
| This was a quasi‐randomised controlled trial. | |
| This randomised controlled trial included women with GDM. |
Abbreviations: GDM: gestational diabetes mellitus
Characteristics of studies awaiting assessment [ordered by study ID]
| Methods | Randomised controlled trial. |
| Participants | 246 women were randomised. Setting: 8 midwifery practices in the Netherlands, in towns with 23,000 to 735,000 inhabitants (from February 2005 to May 2006). Inclusion criteria: pregnant with first child; in first 14 weeks of gestation; able to read, write and speak Dutch; attended 1 of the participating midwifery practices. Exclusion criteria: not reported. |
| Interventions | Intervention group (n = 123) The "New Life(style) intervention", a life‐style modification program individually tailored to each participant, focused on weight development, physical activity and nutrition habits during pregnancy delivered via 4 face‐to face individual counselling modules (of approximately 15 minutes a session except for the first session, which lasted 30 minutes) during pregnancy and 1 telephone session after birth. In the sessions, counsellors discussed how to control weight gain during and after pregnancy, and how to maintain or optimise a healthy lifestyle during pregnancy. The content of the first session was summarised in a brochure that was given to women. The women received counselling from 1 counsellor (a member of the trial team) throughout the intervention. A key focus in the counselling sessions was on the IOM guidelines for weight gain during pregnancy, how women were progressing towards achieving the IOM weight gain goals, and how to implement strategies to achieve set goals. A key message relating to exercise was the relationship between energy intake and expenditure. Exercise levels of women were assessed and feedback and goals relating to increasing activity were discussed. Diet: the guidelines for pregnant women of the Dutch Nutrition Centre constituted the basis of the nutritional part of the counselling sessions. Exercise: the information and feedback that counsellors provided on exercise were based on the recommendations of the American Centers for Disease Control and Prevention, which promote 30 minutes of ≥ moderate‐intensity activity on 5 or all days of the week. Control group (n = 123) Women in the control group received usual care provided by midwives in the Netherlands, where midwives are independent paramedical practitioners, qualified to provide full maternity care to all women whose pregnancies and childbirths are uncomplicated. As per usual practice, women in the control group had their first appointment with the midwife between the 9th and 12th week of gestation. Subsequently they visited the midwife 11 to 13 times during their pregnancy (for about 15 minutes each time). |
| Outcomes | To date, data have been reported for outcomes including: GWG, postpartum weight, birthweight, macrosomia, preterm birth, caesarean section. |
| Notes | In the previous version of this review, this trial was 'excluded'; we have now re‐classified this trial as 'awaiting classification', pending the availability/reporting of GDM outcome data. |
| Methods | Randomised controlled trial. |
| Participants | 102 women were randomised. Setting: a family health centre providing services for a population of approximately 21,000 people, mostly families with middle‐income level, in Istanbul, Turkey (from June 2011 to July 2012). Inclusion criteria: pregnant at ≤ 12 weeks gestation; aged ≥ 18 years; gravidity ≤ 2; without health problems; "got pregnant in natural ways for two times at most"; were pregnant for ≤ 3 months; did not intend to lose weight in pregnancy. Exclusion criteria: not reported. |
| Interventions | Intervention group (n = 51) Women received an individualised lifestyle intervention focusing on healthy lifestyle, diet, exercise, and weight monitoring, delivered through 4 sessions, at 12 to 15, 16 to 18, 20 to 24, and 37 weeks gestation. At each session, a card indicating personal height, weight, an appropriate GWG range for BMI was prepared and provided to the woman as a reminder. Weights were measured in every meeting and recorded on the card. In addition, objectives of nutrition and physical activity for optimal GWG were specified for the period until the next meeting. Women reaching their objectives were praised and encouraged. Nutrition and physical activity levels of women who could not reach their objectives were discussed, and a more intensive consultancy (repetition and telephone calls) was provided. Counselling and behavioural skill building interventions were personalised according to the barriers of women. Physical activity advice, focused on during the 16 to 18 weeks interview, included the recommendations that women engage in mild‐to‐moderate safe exercise, (which increased the heart rate to 140 beats/minute while being easily able to talk, for 30 minutes every other day; e.g. elliptical trainer, swimming, Pilates, yoga and mild level aerobic exercises) and that they maintain a more active lifestyle (taking walks every day, going to work by walking, using stairs instead of elevators, participating in sporting activities in their leisure times). Control group (n = 51) Women received routine antenatal care. This included follow‐up ≥ 4 times during pregnancy. At each follow‐up, weight was measured; however, women were not informed on what the GWG range appropriate for their BMI was, or their personal weight changes. Consultancies focused on pregnancy complaints, performing tests, provision of information about the birth and postpartum period, and discussion about circumstances that might pose a danger to women during their pregnancy. |
| Outcomes | To date, data have been reported for outcomes including: health‐promoting lifestyle behaviours; dietary intake; physical activity; GWG; postpartum weight retention; gestational age; caesarean section; hospitalisation time; birthweight; birth length. |
| Notes | Trial 'awaiting classification', pending the availability/reporting of GDM outcome data. |
| Methods | Randomised controlled trial. |
| Participants | 278 women were randomised. Setting: women recruited via a federally qualified health centre, Supplemental Nutrition Program for Women, Infants, and Children clinics, located in a predominantly low‐income, Mexian‐origin Latino community in southwest Detroit, USA (from 2004 to 2006). Inclusion criteria: women ≥ 18 years of age; residents of southwest Detroit; pregnant at < 20 weeks gestation. Exclusion criteria: type 1 or 2 diabetes; an incompetent cervix/cerclage; an active thyroid; multiple gestation; cardiac, vascular or pulmonary disease; drug or alcohol addiction; serious physical or mental illness or condition that would substantially interfere with participation in or completion of the entire intervention. |
| Interventions | Intervention group (n = 139) Women received the Spanish language Healthy Mothers on the Move (MOMs) intervention, an 11‐week, culturally‐tailored community‐based lifestyle behaviour change intervention offering home visits (2), group classes (9), related activities and social support, delivered by community health workers and peers. Women were provided with general pregnancy education and information, discussion and activities aimed at developing knowledge and skills needed to reduce social and environmental barriers to healthy eating, regular exercise, and management of daily life stressors. Each group meeting concluded with content review and goal setting. While the intervention included an exercise component, and women were encouraged to engage in regular exercise, the focus was on dietary behaviours. Meeting 1, "healthy mom, healthy baby", focused on discussing stress and dietary behaviours. In meeting 2, and the home visits, community health workers encouraged women to develop and review behavioural goals. 4 meetings focused specifically on providing dietary advice: Meeting 3, "plan to eat healthy", focused on discussing the role of nutrition, beliefs about food and eating patterns during pregnancy, and included a home visit. Meetings 5, 6 and 7 were group meetings titled "Eat More Fiber", "Eat More Fruits and Vegetables" and "Eat Less Fat and Sugar" respectively. They offered education and discussion about these topics, and used the US Department of Agriculture Pregnancy Food Guide Pyramid, as well as food label reading, food models and taste test activities. Optional weekly group activities such a healthy cooking demonstrations corresponding to the 3 different dietary topics (meetings 5 to 7), were offered. A key component of the intervention was informational and emotional social support from the community health workers and peers. Community health workers encouraged women to problem solve, share strategies, and recognise each other's efforts. Control group (n = 139) The control group, reported as the"minimal intervention" group, received 3 group pregnancy education meetings, delivered in Spanish by professional staff from a partner organisation, in a separate community setting. The sessions used MOMs curriculum materials related to pregnancy, childbirth, fetal, newborn, and postpartum development and care. The women also received March of Dimes and ACOG materials about eating and exercise during pregnancy. Similar to women in the intervention group, the control group women received transportation and child care required for participation in all trial activities, monthly newsletters, attendance reminder cards and phone calls, small mother and baby care gift incentives after each intervention meeting, and $50 grocery store gift certificates after baseline and follow‐up data collection. |
| Outcomes | To date, data have been reported for outcomes including: depressive symptoms (CES‐D scores); dietary intake. |
| Notes | Trial 'awaiting classification', pending the availability/reporting of GDM outcome data. |
| Methods | Randomised controlled trial |
| Participants | 1664 women were randomised Setting: 4 hospitals serving a large and racially diverse population in a metropolitan area within the northeastern USA (dates not reported). Inclusion criteria: pregnant women aged 18 to 35 years; planned to deliver in 1 of the 4 participating hospitals; consented ≤ 20 weeks gestation, available for a 24‐month intervention; planned to carry pregnancy to term and keep the baby; read and understood English; had a valid e‐mail address. Exclusion criteria: BMI < 18.5 kg/m² or ≥ 35.0 kg/m²; multiple gestation; 3 or more consecutive miscarriages; presence of pre‐pregnancy medical conditions that could influence weight loss or gain. |
| Interventions | Intervention group 1 (n= 554) Women received an online "healthy weight intervention during pregnancy and postpartum" program. Women were also provided with access to online goal‐setting and self‐monitoring tools throughout their pregnancy, designed to encourage them to achieve several behavioural targets for appropriate GWG. 3 features and related activities in the web‐based program were used to promote the desired change: (1) A weight tracking feature requested women to enter their weight regularly; (2) A physical activity feature first reviewed information on physical activity during pregnancy and then encouraged women to reflect and report on this and options for increasing their activity; based on this, the website offered women feedback, named appropriate goal areas, outlined barriers that could be encountered in the pursuit of those goals, and described strategies to overcome those barriers; women were promoted to set personal goals by specifying types of activities that they hoped to participate in, and timeline for accomplishing these goals; they were encouraged to come back to the website to monitor progress on (or simply remind themselves of) their physical activity goals. (3) A feature related to diet provided women with recommendations about healthy eating behaviours during pregnancy based on their responses to questions assessing common dietary problem areas; women were encouraged to indicate which issue area they would like to focus on at the time, to set timelines for achieving goals, and to monitor progress towards achieving the goals. Women also received a postpartum program (not described in detail). Intervention group 2 (n = 556) Women received an online "healthy weight during pregnancy only" program. During pregnancy, women received the same intervention as those in intervention group 1 (see above). Control group (n = 554) Women were provided with a standardised basic version of the web‐based program. This included access to pregnancy‐related information and a variety of features, including informational and interactive features that women could use to gather information and advice about pregnancy, maintain calendars for their appointments with antenatal care providers, and share experiences with other women who had access to the website through a blog feature. |
| Outcomes | To date, data have been reported for outcomes including: goal‐setting and self‐monitoring behaviour; beliefs about weight control; motivation and intention. |
| Notes | Trial 'awaiting classification', pending the availability/reporting of GDM outcome data. |
| Methods | Randomised controlled trial. |
| Participants | 57 women were randomised. Setting: Grady Memobria Hospital, a large metropolitan hospital in the USA. Inclusion criteria: women (Black or Hispanic) aged 18 to 45 years; overweight or obese (BMI > 25 kg/m²); a sedentary lifestyle (< 30 minutes/day of moderate physical activity); established antenatal care established at < 20 weeks of gestation; singleton pregnancy. Exclusion criteria: a history of diagnosis of type 2 diabetes, hypertension, cardiovascular disease, chronic renal disease, active liver disease, or anaemia; receipt of medications which adversely influence glucose tolerance; multiple pregnancies; not planning to continue pregnancy to term; contraindications to participate in regular physical activity; mental conditions ‐ unable to understand nature, scope and possible consequences of the trial. |
| Interventions | Intervention group (n = 28) Women received a lifestyle intervention consisting of monthly visits focused on increasing fruit and vegetable intakes, reducing intakes of fats and sugars, and increasing levels of moderate physical activity. Control group (n = 29) Women received regular care. This was comprised of counselling routinely provided to all women as recommended by the IOM for appropriate nutrition and weight gain, and ACOG guidelines for appropriate physical activity during pregnancy. |
| Outcomes | To date, data have been reported for outcomes including: glucose and insulin indices; activity (total, sedentary behaviour); GWG. |
| Notes | Trial 'awaiting classification', pending the availability/reporting of GDM outcome data. |
| Methods | Randomised controlled trial. |
| Participants | 79 women were randomised. Setting: not reported. Inclusion criteria: obese women; singleton pregnancies. Exclusion criteria: not reported. |
| Interventions | Intervention group Women received a"pregnancy, exercise and nutrition (PEN) program". Women received 5 dietary/nutrition sessions during pregnancy and at 3 months postpartum (food records, pedometers and logs, pregnancy activity questionnaire and food frequency questionnaires were used; anthropometric measures were collected throughout pregnancy and postpartum). Control group Women received standard care. |
| Outcomes | To date, data have been reported for outcomes including: GWG: postpartum weight retention. |
| Notes | Trial 'awaiting classification', pending the availability/reporting of GDM outcome data. |
| Methods | Randomised controlled trial. |
| Participants | 86 women were randomised. Setting: Portugal. Inclusion criteria: pregnant women; further details not reported. Exclusion criteria: not reported. |
| Interventions | Intervention group (n = 24) Women received a lifestyle change intervention with a group based physical exercise and nutritional counselling component. Diet: described in the conference abstract as "a monthly 30‐minute lecture; supervised by a certified dietitian". Exercise: women received a group‐based physical exercise program involving moderate‐intensity exercise; they were encouraged to attend 2 sessions per week of 45 minutes, between 14 and 38 weeks' gestation. Each session included: warm up, group‐based low impact aerobics, general strength training (including pelvic floor muscle, balance and stabilisation exercises), and cool down (stretching and relaxation). The exercise classes were supervised by graduate fitness instructors. Control group (n = 62). Women received standard care. |
| Outcomes | To date, data have been reported for outcomes including: physical activity; GWG; postpartum weight retention; gestational age at birth; mode of birth; birthweight; birth length; Apgar score. |
| Notes | Trial 'awaiting classification', pending the availability/reporting of GDM outcome data. |
| Methods | Randomised controlled trial. |
| Participants | 261 women were randomised. Setting: Birralee Maternity Service, located in the Eastern Heath Region of Melbroune, Australia (from August 2011 to August 2013). Inclusion criteria: women aged ≥ 18 years; provided informed consent; BMI > 18.5; English speaking; < 18 weeks gestation. Exclusion criteria: history of disordered eating or diabetes. |
| Interventions | Intervention group (n = 130) In addition to usual care offered to pregnant women by their obstetrician, midwife or GP, women assigned to the "Healthy Coaching Intervention group", received a tailored intervention (with individual and group components) designed to prevent excessive GWG, and promote positive psychosocial and motivational outcomes, delivered by a Health Coach. The individual component included a 1‐hour individualised session (either in person or via phone) with a trained Health Coach (an allied health professional) who (1) promoted adoption of healthy lifestyle behaviours for the purpose of weight management and (2) addressed mood management and body image issues that commonly arise during pregnancy. Women had a second session (half hour) via telephone, at 27 weeks gestation and an additional follow‐up 15‐minute phone consultation at 30 weeks gestation. In addition, women were offered a fourth optional 15‐minute follow‐up telephone consultation just prior to reaching 32 weeks gestation. The group component consisted of 2 2‐hour sessions, which provided women with additional information related to healthy behaviours and mood, stress control and coping strategies, and supported and assisted them in initiating, maintaining, and achieving their goals for healthy behaviour change both before and after the birth of the child. During the group sessions, women completed activities such as writing a personalised letter to themselves to read 6 weeks post birth. Control group (n = 131). Women in the "education alone" group, received usual care, and 2 2 hour education sessions, that offered factual information only. A qualified workplace trainer and assessor ran the sessions. |
| Outcomes | To date, data have been reported for outcomes including: GWG: motivation, psychosocial, and GWG knowledge and expectations; birthweight; mode of birth; preterm birth. |
| Notes | Trial 'awaiting classification', pending the availability/reporting of GDM outcome data. |
| Methods | Randomised controlled trial. |
| Participants | Setting: women were from predominantly Hispanic low‐income underserved communities, with economic, time, cultural and social barriers for engaging in lifestyle intervention. They were recruited through the Puerto Rico Hospital, located in Puerto Rico, USA. Inclusion criteria: women aged ≥ 18 years; singleton viable pregnancy; willing to receive care at the University Hospital in San Juan Puerto Rico; could be randomised between 9 weeks and 15 weeks 6 days; BMI ≥ 25 kg/m². Exclusion criteria: diagnosis of diabetes prior to pregnancy or HBA1c ≥ 6.5% or another test result suggestive of pre‐pregnancy diabetes; IV drug use; HIV infection; non‐Spanish speaking; known fetal anomalies; planned termination of pregnancy; history of 3 or more consecutive first‐trimester miscarriages; past history of anorexia or bulimia by medical history or self‐report; a current eating disorder; actively suicidal; prior or planned bariatric surgery; current use of metformin; unable to participate in group sessions. |
| Interventions | Intervention group Women received the "Pregnancy and EARLy Life (PEARLS)" lifestyle improvement program. The intervention used an empowerment theoretical framework and was delivered through individual and group‐based counselling and communication. Antenatal counselling sessions included: 2 individual and 7 group sessions plus monthly calls. The focus was on improving/modifying total calorie consumption and improving diet quality (by reducing the intake of refined carbohydrates and sugar sweetened beverages), reducing sitting time and increasing physical activity (through promotion of non‐structured physical activity). Postpartum counselling sessions included: 2 individual and 2 group sessions plus monthly calls during which women received education on breastfeeding, physical and cognitive activation of the infant, infant feeding patterns, sleep, and diet choices for the infant. Women were provided with brown rice, omega‐3 rich vegetable oil and spread, and water monthly. Women set their own goals, which were monitored. To reinforce intervention messages, women were provided with a culturally‐tailored physical activity video. The video provided ways to support engagement in physical activity at home by including 5 sessions of 5 to 10 minutes each with low impact, easy to do exercises, such as stretching, aerobics with resistance training, belly dance, Latin dances, and basic yoga poses and respiration techniques. Control group Women received routine antenatal care. In addition, they received regular phone calls and mailings, token gifts and some information related to data gathered during the trial, such as on physical activity, and feedback on behaviour through the trial. Women received 2 antenatal and 1 postpartum group session which provided general pregnancy related information not related to the intervention. |
| Outcomes | To date, information reported has related to "Development, implementation, lessons learned and future applications". |
| Notes | Trial 'awaiting classification', pending the availability/reporting of GDM outcome data. |
| Methods | Randomised controlled trial. |
| Participants | 360 women were randomised. Setting: tertiary maternity hospital in South East Queensland, Australia, with approximately 5000 births a year (from 31 August 2010 to 7 March 2011). Inclusion criteria: women ≥ 18 years (or under 18 years with the consent of a parent or guardian); pregnant; attending the Mater Mothers' Hospital antenatal clinic for pregnancy care; able to provide informed consent. Exclusion criteria: unable to read and speak English at a level to allow completion of pen and paper surveys. |
| Interventions | Intervention group (n = 178) Women received the "healthy start to pregnancy" program, a low‐intensity early antenatal health promotion program aimed at improving maternal health behaviours. In addition to participating in the 1‐hour early (before 20 weeks gestation if possible) antenatal lifestyle behaviour change workshop, women received written health education material (a booklet) designed to facilitate behaviour change. The education provided during the workshop covered diet, physical activity, healthy GWG, smoking cessation, breastfeeding, goal setting and self‐monitoring techniques. Women were provided with contact for ongoing support. Control group (n = 182) Women received usual care. This included receipt of written health education material designed to facilitate behaviour change (the same booklet distributed at the workshop to intervention group women). The booklet was informed by best practice for health education print material and contained evidence‐based literature regarding behaviours that influence maternal and infant health outcomes (fruit and vegetable intake; healthy weight gain; physical activity). The booklet included self‐monitoring and goal setting activities. |
| Outcomes | To date, data have been reported for outcomes including: dietary intake; diet quality index; GWG awareness; physical activity; cigarette smoking; intention to breast feed. |
| Notes | Trial 'awaiting classification', pending the availability/reporting of GDM outcome data. |
Abbreviations: ACOG: American College of Obstetricians and Gynecologists; BMI: body mass index; GDM; gestational diabetes mellitus; GWG: gestational weight gain; HbA1c: glycated haemoglobin; HIV: human immunodeficiency virus; IOM: Institute of Medicine; IV: intravenous; MOMs: Healthy Mothers on the Move; PEARLs: Pregnancy and EARLy Life lifestyle improvement program; PEN: pregnancy, exercise and nutrition; USA: United States of America.
Characteristics of ongoing studies [ordered by study ID]
| Trial name or title | Proyeto Mamȃ: a lifestyle intervention in overweight and obese Hispanic women: a randomised controlled trial |
| Methods | Randomised controlled trial. |
| Participants | Setting: ambulatory obstetrical practices of Baystate Medicial Center in Western Massachusetts, USA. Inclusion criteria: pregnant Hispanic women who are overweight or obese (BMI ≥ 25 kg/m²) and 18 to 45 years of age. Exclusion criteria: pre‐pregnancy BMI < 25 kg/m²; history of type 2 diabetes; heart disease or chronic renal disease; contraindications to participate in moderate physical activity or a low‐fat/high‐fibre diet (e.g. Crohn's disease, ulcerative colitis); inability to read English or Spanish at 6th grade level; < 16 or > 45 years of age; > 16 weeks gestation; current medications which adversely influence glucose tolerance; not planning to continue to term or deliver at the trial site; non‐singleton pregnancy (e.g., twins, triplets, etc.). |
| Interventions | Intervention group Women will receive the "Poyeto Mama lifestyle intervention" consisting of exercise and dietary intervention materials culturally‐adapted for Hispanics, and shown to be efficacious in previous controlled trials in Hispanic women. The intervention draws from Social Cognitive Theory and the Transtheoretical Model, and includes strategies for partner and/or family support to address specific social, cultural, and economic challenges faced by underserved Hispanic women. To support compliance, actigraphs and the Hispanic food frequency questionnaires will be used. Multimodel contacts (i.e., in person, telephone counselling, and mailed print‐based materials) will be used, starting from 12 weeks gestation and continuing to 6 months postpartum. Follow‐up will continue for 1‐year postpartum. The main focus of the intervention is on encouraging women to meet: (1) IOM guidelines for GWG and postpartum weight loss; (2) ACOG guidelines for physical activity (through increasing walking and developing a more active lifestyle); and (3) ADA guidelines for following a balanced diet (reducing calory intake). Control group Women will receive the "comparison health and wellness" intervention. This will include receipt of mailed health materials and telephone booster calls at the same frequency as the intervention group; however the materials will not focus on exercise and dietary topics, and will include booklets from the ACOG and the American Academy of Pediatrics in English or Spanish. These booklets represent high‐quality, standard, low‐cost, self‐help material currently available to the public. |
| Outcomes | Primary outcomes: insulin resistance. Other outcomes: mother: GWG, postpartum weight loss; pregnancy and postpartum biomarkers of insulin resistance (i.e. glucose; insulin; HbA1c; HOMA; leptin; adiponectin); postpartum biomarkers of cardiovascular risk (i.e. blood lipids; blood pressure); child: markers of insulin resistance; anthropometric measures. |
| Starting date | January 2014. Estimated completion date April 2018 (final data collection date for primary outcome measure). |
| Contact information | Lisa Chasan‐Taber, Professor of Epidemiology, University of Masachusetts, Amherst, USA. E‐mail: [email protected] |
| Notes | Recruitment target: 333 women. |
| Trial name or title | The "Get Healthy in Pregnancy" Trial. |
| Methods | Randomised controlled trial. |
| Participants | Setting: antenatal clinics at 5 hospitals, including Orange Base, Lismore Base and Dubbo Base (located in rural community settings) and (metropolitan settings) in New South Wales, Australia. Inclusion criteria: ≥ 18 years, singleton pregnancy, English speaking, gestation of≤ 18 weeks, agreed to participate (signed consent forms and verbal consent provided at first coaching call) and attending of the 5 trial hospitals during the recruitment period. Aim is to include 177 and 532 women with a pre‐pregnancy BMI of 18.5‐24.9 kg/m² (healthy range) and ≥ 25.0 kg/m² (overweight or obese range) respectively. Further, to recruit 248 women across the 3 rural hospitals, and 462 from the metropolitan hospitals (to reflect the larger populations in these areas), Exclusion criteria: key criteria (i) pre‐pregnancy BMI, 18.5 kg/m²; (2) gestation over 18 weeks; (3) non Engllish speaking; (4) multiple pregnancy; and (5) women with complex medical conditions. In addition, various pre‐existing conditions at screening including: cardiovascular disease; endocrine disease; respiratory disease; and severe lung disorder. |
| Interventions | Intervention group Women will receive information and telephone‐based health coaching designed to support them to achieve appropriate GWG. This is a program run by the "Get Healthy Service (GHS)" that has been adapted specifically for pregnant women. The program comprises up to 10 calls, of between 15 to 40 minutes duration by university qualified coaches (8 during pregnancy and 2 after birth). The length of calls is determined by women. Similar to the standard GHS, the calls are aimed at healthy eating, physical activity and achieving healthy GWG. Calls are based on behaviour change principles designed to help with goal setting, maintaining motivation, overcoming barriers and making sustainable life changes. The timing of calls is designed to be flexible based on women's preferences. Generallly, the schedule for calls pre‐delivery is: 3 calls in the first 3 weeks, followed by a call every 2 to 3 weeks; unless requested otherwise. For post‐pregnancy: 1 call at 10 weeks, 1 call at 14 weeks; unless requested otherwise. Women in the intervention group will also be provided with the following information materials: evidence‐based pregnancy specific fact sheets, the "Having a Baby Book" published by New South Wales health, and the "Get Healthy" information booklet, which includes generic advice on healthy eating, physical activity as well as achieving and maintaining a healthy weight. All materials are based on nationally and internationally endorsed guidelines such as the Australian Dietary Guidelines and US IOM GWG guidelines. Control group Women will receive a one‐off information and coaching session from a health coach and will receive the information materials described directly above (with the exception of the diary). They will also receive usual care from their maternity clinicians during the trial with the exception of setting their GWG range target and general advice about GWG at their first antenatal visit with their midwife. |
| Outcomes | Primary outcome: weight of mother (at 36 weeks of pregnancy and 12 months postpartum). Other outcomes: diet of mother (fruit and vegetable intake, at 36 weeks and 12 months postpartum); views of the intervention (mothers/clients and service providers); |
| Starting date | 2 September 2014 (anticipated). |
| Contact information | Primary investigator: Ms Michelle Maxwell. E‐mail: [email protected]. Scientific queries: Dr Santosh Khanal. Liverpool Hospital, Don Everett Building, New South Wales, Australia. E‐mail: [email protected] |
| Notes | Recruitment target: 640 women. |
| Trial name or title | Not reported. |
| Methods | Randomised controlled trial. |
| Participants | Setting: 4 urban public health centres and 4 private obstetric offices located in Isfahan, the capital of Isfahan Province, Iran. Inclusion criteria: able to read and write and speak Persian; gestational age 6 to 10 weeks; no disease or condition that requires special medical care or drug counselling. Exclusion criteria: not interested in continuing participation in the trial; taking weight control medication; having any disease or condition requiring special medical care or hospitalisation; multiple pregnancy. |
| Interventions | Intervention group A "maternal centred life‐style modification program" for pregnant women consisting of: (1) provision of an educational package of antenatal care for the women (PCPW); (2) a log book for recording goals and progress; and (3) 10 counselling sessions (appointments at 6 to 10, 11 to 15, 16 to 20, 21 to 25, 26 to 30, 31 to 34, 35 to 37, 38, 39 and 40 weeks gestation. The counselling will be delivered throughout the program by 1 counsellor, who is a midwife. The PCPW educational package consists of 14 chapters: GWG during pregnancy; GWG charting; principles of nutrition in pregnancy; nutritional guidance for low and normal and high BMI; food calories; principles of personal hygiene; mental health; stress management; suitable positions in pregnancy; stretching exercises; respiratory exercises; relaxation; massage in pregnancy; and physical activity principles and guidelines. The log book contains 5 sessions including on planning for delivery and timing of counselling sessions; monitoring GWG (chart); diet and nutrition recording; physical activity goal setting and recording; and stress management goals/records. Each counselling session will be approximately 20 minutes, excepting for the first session, which is 30 minutes. In the first session, the midwife will provide general information about the trial and provide the educational materials and log book. The women's BMI will be calculated and the IOM guidelines for GWG during pregnancy will be discussed and personalised goals set. The counsellor will explain how to monitor/record GWG. At the end of the session the women will be provided with the package and log book and reminded about the date of the next session. During subsequent sessions, the woman and counsellor will review achievements against the goals set. If the GWG trend is above normal, the counsellor will help the woman to find a solution to overcoming difficulties. Control group Women in the control group will attend the clinics at the same pregnancy time points as above. During each visit, the midwife will measure the weight of the women and plot the GWG curve. Aside from this activity related to the trial data collection, women in the control group will receive standard antenatal care. |
| Outcomes | Primary outcome: GWG. |
| Starting date | October 2012. |
| Contact information | Dr Zahra Amini Pozveh, Department of Community Medicine, Isfahan University of Medical Sciences, Hezer Jerib St., Isfahan, Iran. E‐mail: [email protected] |
| Notes | Recruitment target: 160 women. |
| Trial name or title | The Chilean maternal and infant nutrition cohort study (CHiMINCs). |
| Methods | Cluster‐randomised controlled trial. |
| Participants | Setting: 12 primary healthcare centres (> 400 births annually) in 2 counties (La Florida = 5, Puente Alto = 7) in the south east of Santiago, Chile. Inclusion criteria: ≤ 15 weeks gestation; residing within a catchment area of included health centres; expressing that they are not planning to change residence within the next 2 years. Exclusion criteria: women classified as high risk according to Chilean norms (i.e. age < 16 or > 40 years; multiple pregnancies; pre‐gestational medical conditions; previous pregnancy‐related issues) and/or underweight (BMI < 18.5 kg/m²). |
| Interventions | Intervention group Women will receive the "CHiMINC" intervention, a low‐intensity intervention designed to support the implementation of evidence‐based guidelines by enhancing the uptake of existing programs. Women will receive GWG monitoring, diet and physical activity counselling support, and breastfeeding promotion, from the first antenatal visit (< 15 weeks) to 12 months postpartum. The intervention has 2 main components: (1) training for professionals (midwives, dietitians, nurses) including on maternal GWG assessment, use of charts, referral to dietitian criteria, dietary and physical activity recommendations, and how to communicate nutrition messages effectively. (2) actions, including advice about diet and physical activity, provided during antenatal visits. Diet: women will, at the first antenatal visit receive education about optimal GWG, and at each routine midwife visit, computer‐based weight assessment and feedback about how to achieve GWG goals. At each subsequent midwife visit women will receive advice about ≥ 2 of the following key nutrition during pregnancy messages ("avoid the consumption of sugar‐sweetened beverages"; "restrict the consumption of white bread to two pieces/day"; "replace fatty meats with lean meat and fish"; "eat a variety of vegetables and fruits each day in place of foods higher in fat and calories"). Women will be referred to a dietitian if necessary according to pre‐defined criteria. Exercise: women will be invited to physical activity classes. They will be encouraged to attend a program for pregnant women of moderate‐intensity exercise (60 minutes, 3 times a week). The program will be delivered at each of the participating sites, and supervised by licensed physical activity instructors. Each session will consist of 10 minutes of strength exercises and 10 minutes of stretching and elongating exercises. Control group Women will receive routine care according to national guidelines. |
| Outcomes | Primary outcomes: GWG (36 to 40 weeks gestation); maternal diet; postpartum weight retention (12 months postpartum); maternal glycaemic control (at 20 to 24 weeks gestation); breastfeeding (birth to 12 months); lactation rates (at 12 months postpartum); infant weight, length and BMI (during the first year of life); psychomotor development (during first year of life). Secondary outcomes: adherence to the intervention; intervention implementation (including resource use). |
| Starting date | September 2013 (estimated completion date March 2017). |
| Contact information | Dr Maria L Garmendia, Institute of Nutrition and Food Technology, University of Chile, Chile. E‐mail:[email protected] |
| Notes | Recruitment target: 2400 women. |
| Trial name or title | DALI: Vitamin D and lifestyle intervention for GDM prevention: an European multi‐centre, randomised trial. |
| Methods | Randomised controlled trial. |
| Participants | Setting: 9 European countries: UK, Ireland, the Netherlands, Belgium, Poland, Italy, Spain, Austria, Denmark. Inclusion criteria: pregnant women with a pre‐pregnancy BMI ≥ 29 kg/m²; before 19 + 6 weeks gestation; with a singleton pregnancy; aged ≥ 18 years. Exclusion criteria: diagnosed with GDM on OGTT before randomisation using IADPSG criteria (fasting venous plasma glucose ≥ 5.1 mmol/L and/or 1‐hour glucose ≥ 10 mmol/L and/or 2‐hour glucose ≥ 8.5 mmol/L); pre‐existing diabetes; not able to walk ≥ 100 metres safely; requiring complex diets; chronic medical conditions (e.g. valvular heart disease); significant psychiatric disease; unable to speak major language of the country of recruitment fluently or unable to converse with the lifestyle coach in another language for which translated materials exist. For the vitamin D arm, 2 additional exclusion criteria apply: current or past abnormal calcium metabolism, e.g. hypo/hyperparathyroidism, nephrolithiasis, hypercalciuria; hypercalciuria (> 0.6 mmol/mmol creatinine in spot morning urine) or hypercalcaemia (> 10.6 mg/dL, 2.65 mmol/L) detected at baseline measurement. |
| Interventions | This trial will have intervention arms using a 2×(2×2) factorial design: Healthy eating:
Physical activity:
Vitamin D alone: each vitamin D tablet contains 400 IU, and women will be asked to take 4 tablets/day until birth. Placebo alone: placebo tablets, identical to the vitamin D tablets in appearance, will be packed in identical bottles with identical labels as the vitamin D bottles. The women will be asked to take 4 tablets daily. Control: no lifestyle intervention or vitamin D/placebo. Women will receive usual care from their midwife or obstetrician during pregnancy. Healthy eating and physical activity. Healthy eating and physical activity and vitamin D. Healthy eating and physical activity and placebo. |
| Outcomes | Primary outcome: GWG; fasting glucose; insulin sensitivity. Other outcomes: cost‐effectiveness. |
| Starting date | February 2013. |
| Contact information | Mireille NM van Poppel, Department of Public and Occupational Health, EMGO+−Institute for Health and Care Research, VU University Medical Centre, Van der Boechorststraat 7, 1081BT Amsterdam, the Netherlands. E‐mail: [email protected] |
| Notes | Recruitment target: 880 women. |
| Trial name or title | Pregnancy, exercise and nutrition research study with app support: a randomized controlled trial. |
| Methods | Randomised controlled trial. |
| Participants | Setting: Ireland. Inclusion criteria: singleton pregnancies with a live fetus; smart phone; between the ages of 18 and 45 at 10 to 15 weeks gestation with an early pregnancy BMI ≥ 25 kg/m²; with adequate understanding of the English language and an understanding of the trial to enable them to give informed consent to participate. Exclusion criteria: multiple pregnancy; < 18 or > 45 years of age; with pre‐GDM or early onset GDM or past history of GDM; fetal anomaly; previous stillbirth or perinatal death; English inadequate or unable to understand the trial adequately to participate; medical disorder requiring medication. |
| Interventions | Intervention group Women will receive a "Healthy lifestyle package" consisting of targeted advice on a low GI eucaloric diet, individualised exercise goals and a specially designed smart phone application containing daily information about nutrition, and exercise delivered in a motivational way. Women will have individual and group education sessions on the healthy lifestyle package at randomisation. The research team will contact women every 2 weeks to support adherence to exercise goals and low GI diet. Control group: women will receive routine antenatal care which does not include specific nutritional advice nor specific advice on GWG. |
| Outcomes | Primary outcome: GDM. Other outcomes: GWG; GI; activity levels during the third trimester. |
| Starting date | January 2013. |
| Contact information | Prof Fionnuala McAuliffe, National Maternity Hospital, Holles St, Dublin, Ireland. E‐mail: [email protected] |
| Notes | Recruitment target: 500 women. |
| Trial name or title | Primary prevention of GDM for women who are overweight and obese: a randomised controlled trial. |
| Methods | Randomised controlled trial. |
| Participants | Setting: Australia. Inclusion criteria: pregnant women at < 14 weeks gestation; singleton pregnancy; BMI ≥ 25 kg/m²; able to give informed consent in English. Exclusion criteria: diabetes or a history of GDM. |
| Interventions | Intervention group: From recruitment in the first trimester until birth, women will receive a telephone‐based program informed by the Theory of Self‐efficacy and employing motivational interviewing. Brief phone contact will alternate each week with a text message/email and this contact will involve goal setting, behaviour change reinforcement with weekly self‐weighing and charting, and the provision of health information. Control group Women will receive usual pregnancy care |
| Outcomes | Primary outcome: GDM. Other outcomes: large‐for‐gestational age; self‐efficacy related to healthy lifestyle changes in diet and exercise; anxiety; depression. |
| Starting date | February 2013. |
| Contact information | Dr Cate Nagle, Deakin University School of Nursing and Midwifery Waterfont Campus 1 Gheringhap St Geelong Victoria 3220, Australia. E‐mail: [email protected] |
| Notes | Recruitment target: 370. |
| Trial name or title | Interventions to reduce excess weight gain in pregnancy in overweight and obese mothers. |
| Methods | Randomised controlled trial. |
| Participants | Setting: USA. Inclusion criteria: aged 15 to 46 years; in first trimester; willing not to join any other weight control program while in the trial; BMI 25 to 40 kg/m²; willingness and ability to attend support group meetings either in person or via web; able to read, speak, and understand English. Exclusion criteria: carrying multiple fetuses; GDM at trial entry; type 2 diabetes or blood glucose > 125 mg/dL at screening; self‐reported current substance abuse; current smoking; alcohol consumption of > 1 drink per day; pre‐existing medical conditions (including bariatric surgery) or use of medications that would impact trial involvement or outcomes testing; eating disorder in the past 2 years; depression or diagnosis of bipolar disorder; concurrent participation in any other research trial that would impact participation in this investigation. |
| Interventions | Intervention group Women will attend meetings with a nutrition counsellor and/or psychologist where individualised eating plans will be developed and reviewed, and regular group meetings during which information about healthy eating for GWG management will be discussed. Control group Women will attend routine clinical care and receive no additional interventions. |
| Outcomes | Primary outcome: maternal weight change from first trimester to 1‐year postpartum; infant weight change from birth to 1‐year old. Other outcomes: infant: body composition changes through the first year; characteristics at birth including Apgar score and gestational age; dietary intake and food preferences at 1 year; maternal outcomes: caesarean section; gestational hypertension/pre‐eclampsia; preterm birth; birth complications; fasting blood glucose and insulin throughout pregnancy; body composition and energy requirements at baseline and 24 to 28 weeks of pregnancy; total energy expenditure at 24 to 28 weeks of pregnancy; rate of breastfeeding and breastfeeding practices at 1, 3, 6, and 12 months postpartum. |
| Starting date | July 2012. |
| Contact information | Dr Susan B Roberts, Tufts University Human Nutrition Research Center on Aging, Boston, Massachusetts, USA, 02111. E‐mail: [email protected] |
| Notes | Recruitment target: 75 women. |
| Trial name or title | Be healthy in pregnancy (B‐HIP): a randomised clinical trial to study nutrition and exercise approaches for healthy pregnancy. |
| Methods | Randomised controlled trial. |
| Participants | Setting: Canada. Inclusion criteria: healthy pregnant women > 18 years of age with singleton pregnancies (either nulliparous or multiparous); < 20 weeks gestation; pre‐pregnancy BMI > 25 and < 40 kg/m²; plan to deliver at a Hamilton Health Sciences, St Joseph's Healthcare Hamilton, Joseph Brant Hospital or by home birth but willing to attend research visits at the McMaster University Medical Centre site; approval of primary care provider; able to provide signed informed consent. Exclusion criteria: unable to understand some English; currently breastfeeding previous child; pregnancy from in vitro fertilisation; known contraindications to exercise as recommended by the Canadian clinical practice guidelines for pregnancy; severe chronic gastrointestinal diseases or conditions; refusal to consume dairy foods due to intolerance or dislike; any significant heart, kidney, liver or pancreatic diseases; pre‐existing diabetes; a depression score above 10 on the validated Edinburgh Depression scale as that is indicative of severe depression and should be referred for treatment; smoking. |
| Interventions | Intervention group: Women will receive a high‐protein (25% energy) diet providing low‐fat dairy foods, individualised to energy needs and aerobic exercise (walking). Control group Women will receive usual antenatal care. |
| Outcomes | Primary outcome: GWG within IOM guidelines. Other outcomes: mother and infant bone outcomes at 6 months postpartum. |
| Starting date | July 2012. |
| Contact information | Dr Stephanie A Atkinson, McMaster University Medical Centre,Hamilton, Ontario, Canada, L8S 4K1. E‐mail: [email protected] |
| Notes | Recruitment target: 110 women. |
| Trial name or title | Randomised control pilot of a behaviour‐based exercise and diet intervention to reduce risk factors for GDM among otherwise healthy pregnant women. |
| Methods | Randomised controlled trial. |
| Participants | Setting: USA. Inclusion criteria: healthy first‐trimester pregnant women. Exclusion criteria: hypertension; diabetes; known cardiopulmonary disease; orthopedic problems or other conditions that would prevent regular physical activity. |
| Interventions | Intervention group Women will participate in 20 educational sessions designed to promote daily exercise, vegetable and fruit intake, maintain a diet that is relatively lower in fat and rich in wholegrains. Control group Women will receive standard medical care. |
| Outcomes | Primary outcome: achieving 30 minutes of daily exercise, 4 or more times each week. Other outcomes: eating 5 or more servings of vegetables and/or fruits each day; pregnancy weight gain; HbA1c. |
| Starting date | November 2012. |
| Contact information | Dr Linn Goldberg, Oregon Health and Science University, Portland, Oregon, USA, 97239. E‐mail: [email protected] |
| Notes | Recruitment target: 30 women. |
| Trial name or title | Intervention en Changement Des Habitudes de Vie Par l'Activité Physique et un Support Nutritionnel Durant la Grossesse en Estrie. |
| Methods | Randomised controlled trial. |
| Participants | Setting: Canada Inclusion criteria: women aged ≥ 18 years; with a pre‐pregnancy BMI ≥ 25 kg/m²; at risk of developing GDM (a history of GDM or glucose 1 hour post 50 g > 7.1 mmol/L. Exclusion criteria: pre‐pregnancy diabetes detected in the first trimester (HbA1c > 6.5%; fasting glucose > 7.0 mmol/L; random blood glucose > 11.1 mmol/L; glucose > 10.3 mmol/L 1 hour post 50 g); twin pregnancy; taking medications that can affect blood sugar or weight; practice ≥ 150 minutes of physical activity per week; against formal indication for physical activity. |
| Interventions | Intervention group Women will receive nutritional counselling every 2 weeks by a nutritionist until week 36 of gestation; a physical activity group session once a week lead by a kinesiologist until week 36 of gestation; 2 sessions of physical activity counselling (weeks 12 and 24). Control group: In addition to the standard antenatal care for pregnancy, women will receive information about recommended GWG and an evaluation of their nutritional and physical activity habits. |
| Outcomes | Primary outcome: GWG. Other outcomes: maternal and fetal adipokines; maternal and fetal glycaemic control. |
| Starting date | December 2011. |
| Contact information | Dr Marie‐France Hivert, Centre Hospitalier Universitaire de Sherbrooke, Sherbrooke, Quebec, Canada, J1H5N4. |
| Notes | Recruitment target: 16 women. |
| Trial name or title | The Healthy Living in Pregnancy (GeLiS) study. |
| Methods | Cluster‐randomised controlled trial. |
| Participants | Setting: 10 regions of Bavaria, a federal state of Germany. Inclusion criteria: women aged 18 to 43 years; < 12 weeks gestation; a singleton pregnancy; pre‐pregnancy BMI ≥ 18.5 and ≤ 40 kg/m²; sufficient German skills; written informed consent. Exclusion criteria: multiple pregnancy; high‐risk pregnancy prohibiting trial participation (contraindications to exercise e.g. placenta previa, persistent bleeding, cervical incompetence etc.); pre‐pregnancy diabetes mellitus or early GDM; uncontrolled chronic diseases (e.g. thyroid dysfunction); psychiatric or psychosomatic diseases; any other diseases which could interfere with compliance according to the trial protocol. |
| Interventions | Intervention group Women will receive a lifestyle intervention program consisting of 4 structured and partially individualised counselling sessions emphasising optimal diet, physical activity and weight monitoring, delivered by specifically trained and certified professionals (midwives, gynaecologists or medical staff) during the pregnancy period (12 to 16, 16 to 20, 30 to 34 weeks of gestation), and the postpartum period (6 to 8 weeks after birth). The sessions will be delivered alongside routine antenatal visits and will follow a defined curriculum. Women will receive a pedometer as well as brochures that provide: i) examples of adequate exercise; ii) a list of local antenatal physical exercise programs; and iii) recommendations for a balanced diet in pregnancy according to the"Healthy Start ‐ Young Family Network". In the initial counselling session (30 to 45 minutes), women will receive detailed information about a healthy diet and physical activity during pregnancy. The principles of healthy eating and the risks of alcohol, smoking and food borne infections during pregnancy will be discussed. They will also receive advice relating to GWG goals, weight monitoring and critical nutrients during pregnancy. The brochure including the list of suitable exercises and group‐based physical exercise programs that are easily accessible will be provided during this session. During visit 2, women will receive specific and detailed individual counselling targeting dietary habits and physical activity, informed by the first counselling session. In the third counselling session, the focus will be on repetition and consolidation of the messages delivered during the earlier sessions. In the final counselling session, women will receive advice about diet during breastfeeding and as in all the sessions, women will have their weight measured and documented. Control group Women in the control group will receive standard antenatal care, including a leaflet about a healthy lifestyle in pregnancy. They will receive no specific advice on diet, physical activity or GWG. |
| Outcomes | Primary outcome: GWG (proportion of women with excessive GWG as defined by the IOM). Secondary outcomes: GDM; HbA1c; pre‐eclampsia; infant anthropometric measures and health status (birthweight, height, head circumference, large‐for‐gestational age, small‐for‐gestational age, Apgar scores, pH); mode of birth and obstetric complications; maternal diet and physical activity behaviour; maternal weight after birth (6 to 8 weeks postpartum), maternal well‐being (mental health and postnatal depression). |
| Starting date | September 2013. |
| Contact information | Hans Hanuer and Kathrin Rach, Research Centre for Nutrition and Food Sciences, Technische, Universität München, Freising‐Weihenstephan, Germany. E‐mail: [email protected] or [email protected] |
| Notes | Recruitment target: 2500 women. |
| Trial name or title | Pregnancy and early infancy (POMC‐Mother‐Baby) |
| Methods | Randomised controlled trial. |
| Participants | Setting: the Naval Hospital, Camp Lejeune, North Carolina, USA. Inclusion criteria: women aged 18 to 35 years with low risk pregnancies; receiving their care within the Military Health System; planning to reside in the trial area for ≥ 18 months; not at elevated risk of complications due to BMI on determination of pregnancy; BMI > 18 and < 30 kg/m²; not actively involved in another weight management program; able to speak English. Exclusion criteria: current involvement in a structured weight loss program; multiple pregnancies; a medical‐risk pregnancy based on VA/DoD Management of Pregnancy Guidelines (e.g., hypertension, thyroid disease). |
| Interventions | Intervention group Women will receive "positive gains counselling", once each trimester and at 2‐week, 2‐month, 4‐month and 6‐month well‐child visits (7 sessions in total), focused on the benefits of being physically fit, eating healthy foods, and regular exercise, and the costs of obesity, a high‐fat/high‐sugar diet, and sedentary behavior. Specific counselling (where possible provided by the same counsellor throughout pregnancy and early infancy) will focus on positive‐gain‐based cognitive strategies to promote breastfeeding, recognise infant satiety cues, and promote healthy food choices. Each counselling session will have a different topic related to issues specific to each stage of pregnancy/infancy (e.g. preparing for birth, initiating and maintaining breastfeeding, introducing solid foods). By incorporating counselling sessions with pre‐existing clinic visits, women will receive additional social and emotional support during pregnancy and after they give birth. Control group Women will receive routine antenatal care in accordance with accepted guidelines. Primary care providers will deliver the anticipatory guidance in their usual fashion with no external cues or counselling by the research team. |
| Outcomes | Outcomes: GWG; well‐being (anxiety and depression, during pregnancy and 2 months postpartum); behaviour (physical activity and diet, mid pregnancy and 6 months postpartum); BMI; child anthropometric measures (during pregnancy and at 2 months, 4 months and 6 months postpartum). |
| Starting date | Not reported. |
| Contact information | Tracy Sbrocco. E‐mail: [email protected] |
| Notes | Recruitment target: 120 women. |
| Trial name or title | Healthy Moms Study. |
| Methods | Randomised controlled trial. |
| Participants | Setting: 8 obstetrics and gynaecology clinics belonging to the not for profit health maintenance organisation, Kaiser Permanente North West (KPNW), located in Portland, Oregon, USA. Inclusion criteria: obese at the start of pregnancy (BMI ≥30 kg/m²); < 20 weeks gestation; singleton pregnancy; member of KPNW; receiving pre‐natal care at KPNW; ≥ 18 ≤ 50 years. Exclusion criteria: current treatment for cancer; bariatric surgery; current renal disease; multiple birth anticipated; hyperemesis requiring hospitalisation; diabetes (type 1 or 2); non‐English speaking. |
| Interventions | Intervention group Women will receive a weekly group‐based diet and lifestyle intervention focused on achieving the goal of containing their weight during pregnancy to within 3% of their weight at randomisation (at between 10 to 20 weeks gestation). The dietary and physical activity interventions will be tailored to each women's weight and lifestyle. Diet: women will receive 2 individual counselling sessions on nutrition and once‐weekly group sessions and will be supplied with food diaries. To help women stay within their weight goals, intervention staff will monitor women's weight and food records weekly, and adjust calorie targets as needed. Nutrition goals to be focused on will include: "staying within individual calorie guidelines"; "limiting portion sizes: reducing fat intake to 25% of calories"; "reducing sweets and sweetened beverages"; and "consuming more whole grains and complex carbohydrates". Women will be encouraged to follow the DASH diet (without limiting sodium intake) combined with, 1) eating 8 to 12 servings of fruit and vegetables per day; and 2) consuming 2 to 3 servings of low fat dairy products per day. Exercise: women will be encouraged to engage in ≥ 30 minutes of moderate physical activity per day unless restrictions are advised by their primary obstetric care provider. They will be provided with pedometers to encourage physical activity. They will be asked to record their daily step totals or minutes of physical activity and report on their physical activity at each group session. Physical activity recommendations will emphasise safe activity during pregnancy. Control group In addition to routine antenatal care, women will receive information only consisting of a single dietary advice session. Pedometers will not be provided to women in the control group until they have completed the 1‐year follow‐up visit. |
| Outcomes | Primary outcomes: maternal weight change (baseline to 2 weeks postpartum). Secondary outcomes: GWG (baseline to 34 weeks gestation); large‐for‐gestational age; views of the intervention; feasibility of the intervention; behaviour (diet and physical activity); birthweight; feeding patterns; infant growth during the first year of life. |
| Starting date | October 2009 (planned completion date March 2013). |
| Contact information | Kimberly Vesco. Center for Health Research, 3800 N.Interstate Avenue, Portland, USA. E‐mail: [email protected] |
| Notes | Recruitment target: 118 women. |
Abbreviations: ACOG: American College of Obstetricians and Gynecologists; ADA: American Diabetes Association; BMI: body mass index; CHiMINCs: Chilean maternal and infant nutrition cohort study; DALI: Vitamin D and lifestyle intervention for GDM prevention randomised trial; DASH: Dietary Approaches to Stop Hypertension; FITT: frequency, intensity, time, type; g: gram; GDM; gestational diabetes mellitus; GELiS: Healthy Living in Pregnancy study; GI: glycaemic index; GHW: Get Healthy Service; GWG: gestational weight gain; HbA1c: glycated haemoglobin; HOMA: Homeostasis Model Assessment; IADPSG: International Association of the Diabetes and Pregnancy Study Group; IOM: Institute of Medicine; IU: international units; KPNW: Kaiser Permanente North West; OGTT: oral glucose tolerance test; PCPW: package of antenatal care for the pregnant women; POMC‐Mother‐Baby: Pregnancy and early infancy study; UK: United Kingdom; USA: United States of America.
Data and analyses
| Outcome or subgroup title | No. of studies | No. of participants | Statistical method | Effect size | |||||||||||||||||||||||||||||||||||||||||||||||||||||||||||||||||||||||||||||||||||||||||||||||
| 1 Gestational diabetes Show forest plot | 19 | 6633 | Risk Ratio (M‐H, Random, 95% CI) | 0.85 [0.71, 1.01] | |||||||||||||||||||||||||||||||||||||||||||||||||||||||||||||||||||||||||||||||||||||||||||||||
| Analysis 1.1  Comparison 1 Combined diet and exercise interventions versus standard care, Outcome 1 Gestational diabetes. | |||||||||||||||||||||||||||||||||||||||||||||||||||||||||||||||||||||||||||||||||||||||||||||||||||
| 2 Pre‐eclampsia Show forest plot | 8 | Risk Ratio (M‐H, Fixed, 95% CI) | Subtotals only | ||||||||||||||||||||||||||||||||||||||||||||||||||||||||||||||||||||||||||||||||||||||||||||||||
| Analysis 1.2 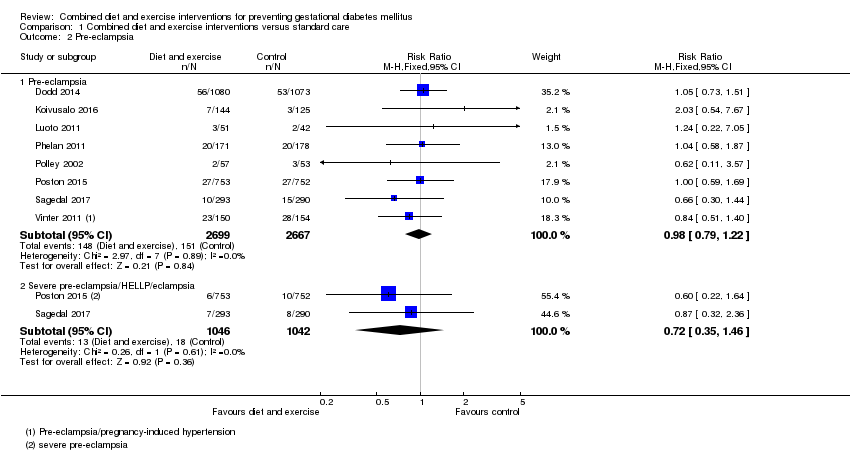 Comparison 1 Combined diet and exercise interventions versus standard care, Outcome 2 Pre‐eclampsia. | |||||||||||||||||||||||||||||||||||||||||||||||||||||||||||||||||||||||||||||||||||||||||||||||||||
| 2.1 Pre‐eclampsia | 8 | 5366 | Risk Ratio (M‐H, Fixed, 95% CI) | 0.98 [0.79, 1.22] | |||||||||||||||||||||||||||||||||||||||||||||||||||||||||||||||||||||||||||||||||||||||||||||||
| 2.2 Severe pre‐eclampsia/HELLP/eclampsia | 2 | 2088 | Risk Ratio (M‐H, Fixed, 95% CI) | 0.72 [0.35, 1.46] | |||||||||||||||||||||||||||||||||||||||||||||||||||||||||||||||||||||||||||||||||||||||||||||||
| 3 Pregnancy‐induced hypertension and/or hypertension Show forest plot | 6 | Risk Ratio (M‐H, Random, 95% CI) | Subtotals only | ||||||||||||||||||||||||||||||||||||||||||||||||||||||||||||||||||||||||||||||||||||||||||||||||
| Analysis 1.3 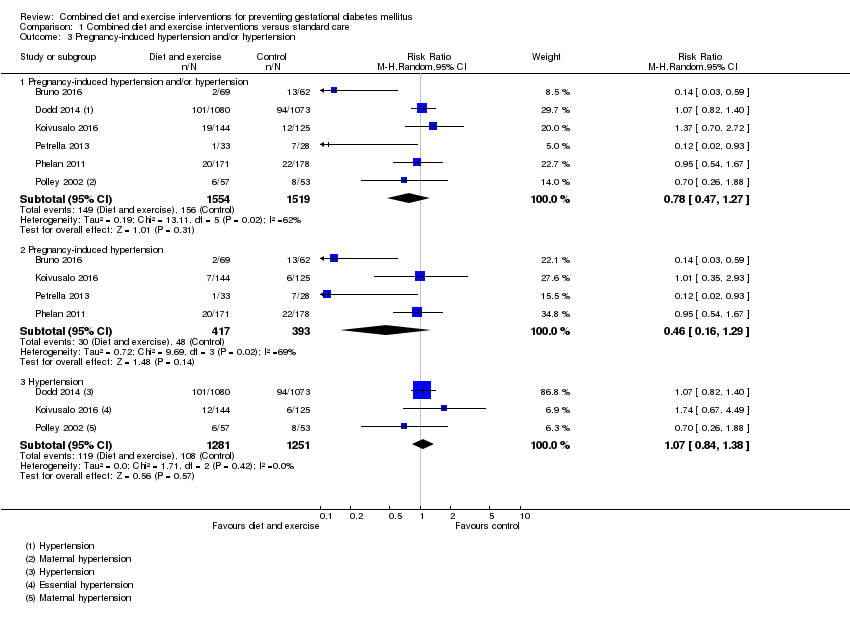 Comparison 1 Combined diet and exercise interventions versus standard care, Outcome 3 Pregnancy‐induced hypertension and/or hypertension. | |||||||||||||||||||||||||||||||||||||||||||||||||||||||||||||||||||||||||||||||||||||||||||||||||||
| 3.1 Pregnancy‐induced hypertension and/or hypertension | 6 | 3073 | Risk Ratio (M‐H, Random, 95% CI) | 0.78 [0.47, 1.27] | |||||||||||||||||||||||||||||||||||||||||||||||||||||||||||||||||||||||||||||||||||||||||||||||
| 3.2 Pregnancy‐induced hypertension | 4 | 810 | Risk Ratio (M‐H, Random, 95% CI) | 0.46 [0.16, 1.29] | |||||||||||||||||||||||||||||||||||||||||||||||||||||||||||||||||||||||||||||||||||||||||||||||
| 3.3 Hypertension | 3 | 2532 | Risk Ratio (M‐H, Random, 95% CI) | 1.07 [0.84, 1.38] | |||||||||||||||||||||||||||||||||||||||||||||||||||||||||||||||||||||||||||||||||||||||||||||||
| 4 Caesarean section Show forest plot | 14 | 6089 | Risk Ratio (M‐H, Fixed, 95% CI) | 0.95 [0.88, 1.02] | |||||||||||||||||||||||||||||||||||||||||||||||||||||||||||||||||||||||||||||||||||||||||||||||
| Analysis 1.4 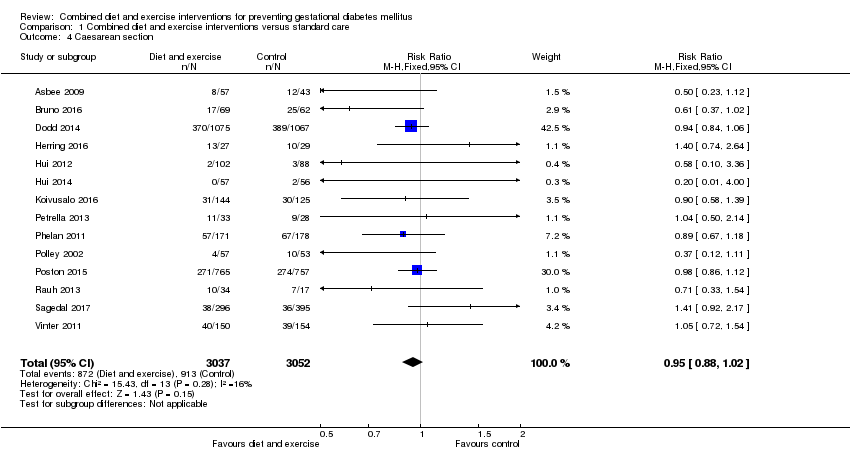 Comparison 1 Combined diet and exercise interventions versus standard care, Outcome 4 Caesarean section. | |||||||||||||||||||||||||||||||||||||||||||||||||||||||||||||||||||||||||||||||||||||||||||||||||||
| 5 Perinatal mortality Show forest plot | 2 | 3757 | Risk Ratio (M‐H, Fixed, 95% CI) | 0.82 [0.42, 1.63] | |||||||||||||||||||||||||||||||||||||||||||||||||||||||||||||||||||||||||||||||||||||||||||||||
| Analysis 1.5 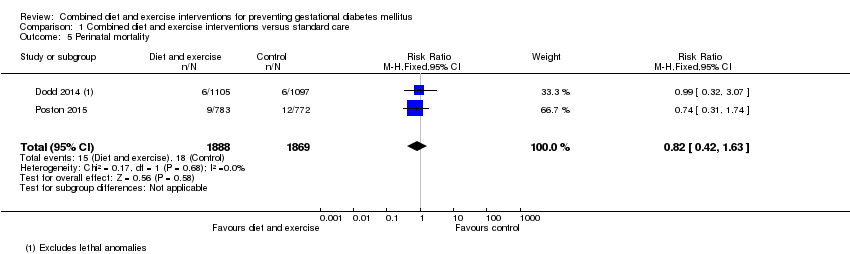 Comparison 1 Combined diet and exercise interventions versus standard care, Outcome 5 Perinatal mortality. | |||||||||||||||||||||||||||||||||||||||||||||||||||||||||||||||||||||||||||||||||||||||||||||||||||
| 6 Large‐for‐gestational age Show forest plot | 11 | 5353 | Risk Ratio (M‐H, Fixed, 95% CI) | 0.93 [0.81, 1.07] | |||||||||||||||||||||||||||||||||||||||||||||||||||||||||||||||||||||||||||||||||||||||||||||||
| Analysis 1.6  Comparison 1 Combined diet and exercise interventions versus standard care, Outcome 6 Large‐for‐gestational age. | |||||||||||||||||||||||||||||||||||||||||||||||||||||||||||||||||||||||||||||||||||||||||||||||||||
| 7 Operative vaginal birth Show forest plot | 3 | 2164 | Risk Ratio (M‐H, Fixed, 95% CI) | 1.07 [0.86, 1.34] | |||||||||||||||||||||||||||||||||||||||||||||||||||||||||||||||||||||||||||||||||||||||||||||||
| Analysis 1.7  Comparison 1 Combined diet and exercise interventions versus standard care, Outcome 7 Operative vaginal birth. | |||||||||||||||||||||||||||||||||||||||||||||||||||||||||||||||||||||||||||||||||||||||||||||||||||
| 8 Induction of labour Show forest plot | 5 | 3907 | Risk Ratio (M‐H, Random, 95% CI) | 0.92 [0.79, 1.06] | |||||||||||||||||||||||||||||||||||||||||||||||||||||||||||||||||||||||||||||||||||||||||||||||
| Analysis 1.8  Comparison 1 Combined diet and exercise interventions versus standard care, Outcome 8 Induction of labour. | |||||||||||||||||||||||||||||||||||||||||||||||||||||||||||||||||||||||||||||||||||||||||||||||||||
| 9 Perineal trauma Show forest plot | 2 | 2733 | Risk Ratio (M‐H, Fixed, 95% CI) | 1.27 [0.78, 2.05] | |||||||||||||||||||||||||||||||||||||||||||||||||||||||||||||||||||||||||||||||||||||||||||||||
| Analysis 1.9 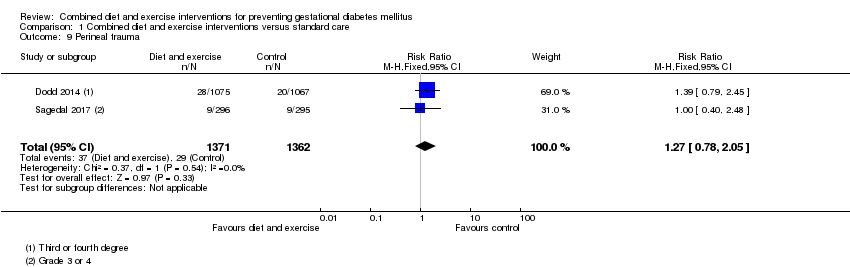 Comparison 1 Combined diet and exercise interventions versus standard care, Outcome 9 Perineal trauma. | |||||||||||||||||||||||||||||||||||||||||||||||||||||||||||||||||||||||||||||||||||||||||||||||||||
| 10 Placental abruption Show forest plot | 1 | 1555 | Risk Ratio (M‐H, Fixed, 95% CI) | 2.96 [0.12, 72.50] | |||||||||||||||||||||||||||||||||||||||||||||||||||||||||||||||||||||||||||||||||||||||||||||||
| Analysis 1.10  Comparison 1 Combined diet and exercise interventions versus standard care, Outcome 10 Placental abruption. | |||||||||||||||||||||||||||||||||||||||||||||||||||||||||||||||||||||||||||||||||||||||||||||||||||
| 11 Postpartum haemorrhage Show forest plot | 3 | 4235 | Risk Ratio (M‐H, Fixed, 95% CI) | 1.03 [0.89, 1.18] | |||||||||||||||||||||||||||||||||||||||||||||||||||||||||||||||||||||||||||||||||||||||||||||||
| Analysis 1.11  Comparison 1 Combined diet and exercise interventions versus standard care, Outcome 11 Postpartum haemorrhage. | |||||||||||||||||||||||||||||||||||||||||||||||||||||||||||||||||||||||||||||||||||||||||||||||||||
| 12 Postpartum infection Show forest plot | 2 | Risk Ratio (M‐H, Fixed, 95% CI) | Subtotals only | ||||||||||||||||||||||||||||||||||||||||||||||||||||||||||||||||||||||||||||||||||||||||||||||||
| Analysis 1.12 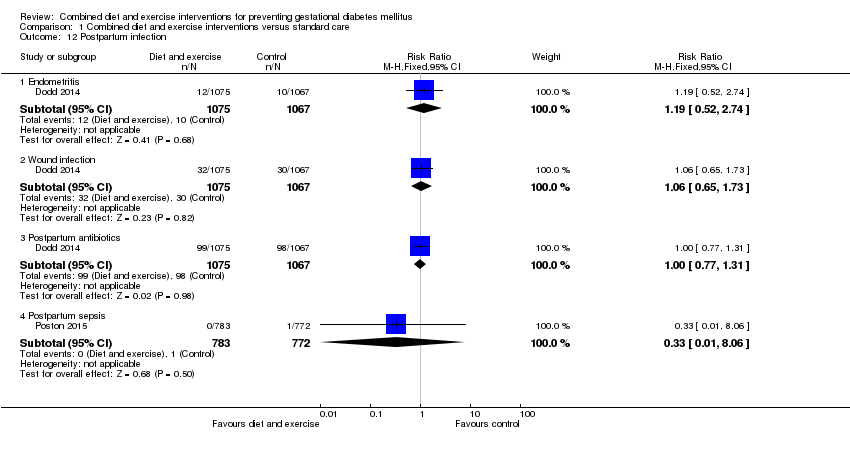 Comparison 1 Combined diet and exercise interventions versus standard care, Outcome 12 Postpartum infection. | |||||||||||||||||||||||||||||||||||||||||||||||||||||||||||||||||||||||||||||||||||||||||||||||||||
| 12.1 Endometritis | 1 | 2142 | Risk Ratio (M‐H, Fixed, 95% CI) | 1.19 [0.52, 2.74] | |||||||||||||||||||||||||||||||||||||||||||||||||||||||||||||||||||||||||||||||||||||||||||||||
| 12.2 Wound infection | 1 | 2142 | Risk Ratio (M‐H, Fixed, 95% CI) | 1.06 [0.65, 1.73] | |||||||||||||||||||||||||||||||||||||||||||||||||||||||||||||||||||||||||||||||||||||||||||||||
| 12.3 Postpartum antibiotics | 1 | 2142 | Risk Ratio (M‐H, Fixed, 95% CI) | 1.00 [0.77, 1.31] | |||||||||||||||||||||||||||||||||||||||||||||||||||||||||||||||||||||||||||||||||||||||||||||||
| 12.4 Postpartum sepsis | 1 | 1555 | Risk Ratio (M‐H, Fixed, 95% CI) | 0.33 [0.01, 8.06] | |||||||||||||||||||||||||||||||||||||||||||||||||||||||||||||||||||||||||||||||||||||||||||||||
| 13 Gestational weight gain (kg) Show forest plot | 16 | 5052 | Mean Difference (IV, Random, 95% CI) | ‐0.89 [‐1.39, ‐0.40] | |||||||||||||||||||||||||||||||||||||||||||||||||||||||||||||||||||||||||||||||||||||||||||||||
| Analysis 1.13  Comparison 1 Combined diet and exercise interventions versus standard care, Outcome 13 Gestational weight gain (kg). | |||||||||||||||||||||||||||||||||||||||||||||||||||||||||||||||||||||||||||||||||||||||||||||||||||
| 14 Gestational weight gain (various times reported) (kg) Show forest plot | 4 | Mean Difference (IV, Fixed, 95% CI) | Subtotals only | ||||||||||||||||||||||||||||||||||||||||||||||||||||||||||||||||||||||||||||||||||||||||||||||||
| Analysis 1.14 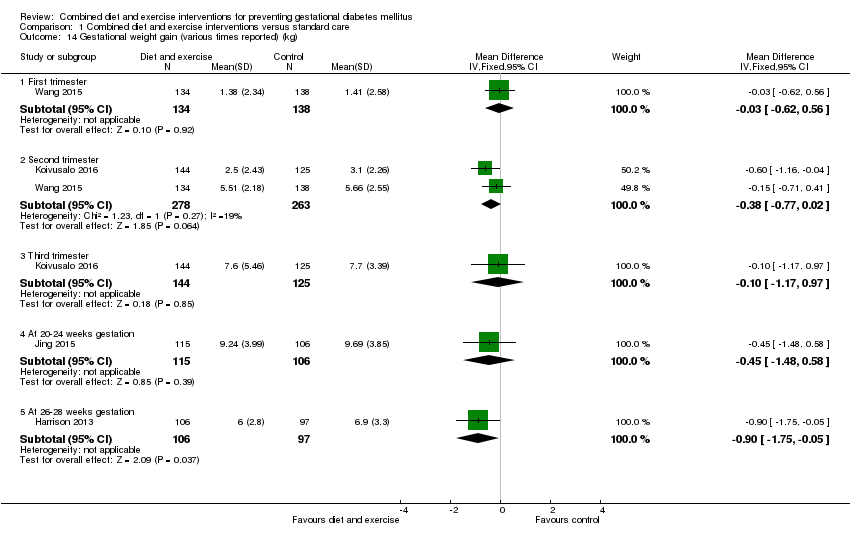 Comparison 1 Combined diet and exercise interventions versus standard care, Outcome 14 Gestational weight gain (various times reported) (kg). | |||||||||||||||||||||||||||||||||||||||||||||||||||||||||||||||||||||||||||||||||||||||||||||||||||
| 14.1 First trimester | 1 | 272 | Mean Difference (IV, Fixed, 95% CI) | ‐0.03 [‐0.62, 0.56] | |||||||||||||||||||||||||||||||||||||||||||||||||||||||||||||||||||||||||||||||||||||||||||||||
| 14.2 Second trimester | 2 | 541 | Mean Difference (IV, Fixed, 95% CI) | ‐0.38 [‐0.77, 0.02] | |||||||||||||||||||||||||||||||||||||||||||||||||||||||||||||||||||||||||||||||||||||||||||||||
| 14.3 Third trimester | 1 | 269 | Mean Difference (IV, Fixed, 95% CI) | ‐0.10 [‐1.17, 0.97] | |||||||||||||||||||||||||||||||||||||||||||||||||||||||||||||||||||||||||||||||||||||||||||||||
| 14.4 At 20‐24 weeks gestation | 1 | 221 | Mean Difference (IV, Fixed, 95% CI) | ‐0.45 [‐1.48, 0.58] | |||||||||||||||||||||||||||||||||||||||||||||||||||||||||||||||||||||||||||||||||||||||||||||||
| 14.5 At 26‐28 weeks gestation | 1 | 203 | Mean Difference (IV, Fixed, 95% CI) | ‐0.90 [‐1.75, ‐0.05] | |||||||||||||||||||||||||||||||||||||||||||||||||||||||||||||||||||||||||||||||||||||||||||||||
| 15 Gestational weight gain (kg/week) Show forest plot | 4 | 2772 | Mean Difference (IV, Random, 95% CI) | ‐0.03 [‐0.06, ‐0.00] | |||||||||||||||||||||||||||||||||||||||||||||||||||||||||||||||||||||||||||||||||||||||||||||||
| Analysis 1.15 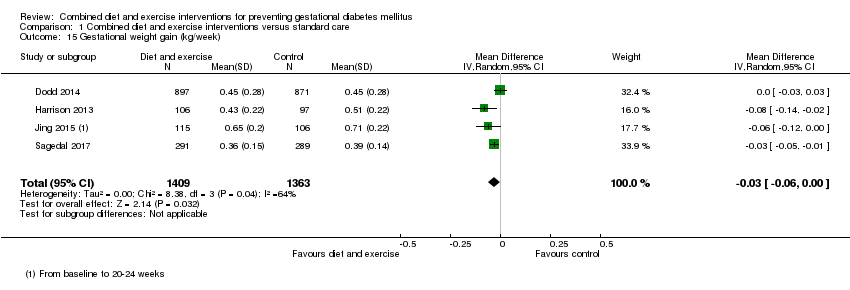 Comparison 1 Combined diet and exercise interventions versus standard care, Outcome 15 Gestational weight gain (kg/week). | |||||||||||||||||||||||||||||||||||||||||||||||||||||||||||||||||||||||||||||||||||||||||||||||||||
| 16 Gestational weight gain (above IOM recommendations) Show forest plot | 11 | 4556 | Risk Ratio (M‐H, Random, 95% CI) | 0.87 [0.79, 0.96] | |||||||||||||||||||||||||||||||||||||||||||||||||||||||||||||||||||||||||||||||||||||||||||||||
| Analysis 1.16  Comparison 1 Combined diet and exercise interventions versus standard care, Outcome 16 Gestational weight gain (above IOM recommendations). | |||||||||||||||||||||||||||||||||||||||||||||||||||||||||||||||||||||||||||||||||||||||||||||||||||
| 17 Gestational weight gain (within IOM recommendations) Show forest plot | 9 | 3730 | Risk Ratio (M‐H, Fixed, 95% CI) | 1.02 [0.93, 1.11] | |||||||||||||||||||||||||||||||||||||||||||||||||||||||||||||||||||||||||||||||||||||||||||||||
| Analysis 1.17 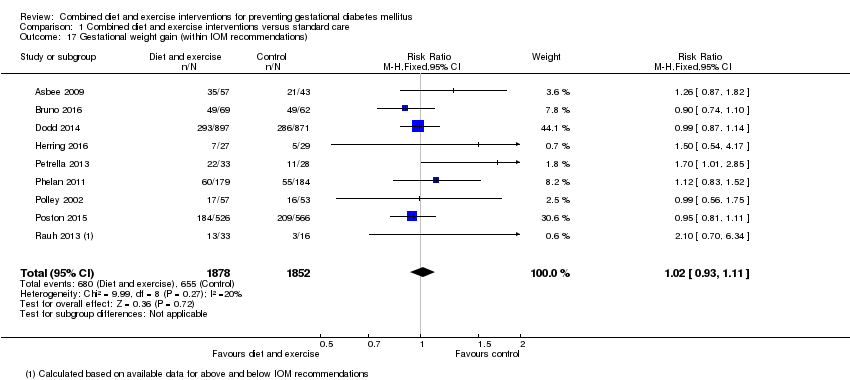 Comparison 1 Combined diet and exercise interventions versus standard care, Outcome 17 Gestational weight gain (within IOM recommendations). | |||||||||||||||||||||||||||||||||||||||||||||||||||||||||||||||||||||||||||||||||||||||||||||||||||
| 18 Gestational weight gain (below IOM recommendations) Show forest plot | 7 | 3499 | Risk Ratio (M‐H, Fixed, 95% CI) | 1.10 [0.98, 1.24] | |||||||||||||||||||||||||||||||||||||||||||||||||||||||||||||||||||||||||||||||||||||||||||||||
| Analysis 1.18  Comparison 1 Combined diet and exercise interventions versus standard care, Outcome 18 Gestational weight gain (below IOM recommendations). | |||||||||||||||||||||||||||||||||||||||||||||||||||||||||||||||||||||||||||||||||||||||||||||||||||
| 19 Behaviour changes associated with the intervention Show forest plot | Other data | No numeric data | |||||||||||||||||||||||||||||||||||||||||||||||||||||||||||||||||||||||||||||||||||||||||||||||||
| Analysis 1.19
Comparison 1 Combined diet and exercise interventions versus standard care, Outcome 19 Behaviour changes associated with the intervention. | |||||||||||||||||||||||||||||||||||||||||||||||||||||||||||||||||||||||||||||||||||||||||||||||||||
| 20 Relevant biomarker changes associated with the intervention Show forest plot | Other data | No numeric data | |||||||||||||||||||||||||||||||||||||||||||||||||||||||||||||||||||||||||||||||||||||||||||||||||
| Analysis 1.20
Comparison 1 Combined diet and exercise interventions versus standard care, Outcome 20 Relevant biomarker changes associated with the intervention. | |||||||||||||||||||||||||||||||||||||||||||||||||||||||||||||||||||||||||||||||||||||||||||||||||||
| 21 Sense of well‐being and quality of life Show forest plot | Other data | No numeric data | |||||||||||||||||||||||||||||||||||||||||||||||||||||||||||||||||||||||||||||||||||||||||||||||||
| Analysis 1.21
Comparison 1 Combined diet and exercise interventions versus standard care, Outcome 21 Sense of well‐being and quality of life. | |||||||||||||||||||||||||||||||||||||||||||||||||||||||||||||||||||||||||||||||||||||||||||||||||||
| 22 Breastfeeding (exclusive) Show forest plot | 3 | Risk Ratio (M‐H, Fixed, 95% CI) | Subtotals only | ||||||||||||||||||||||||||||||||||||||||||||||||||||||||||||||||||||||||||||||||||||||||||||||||
| Analysis 1.22 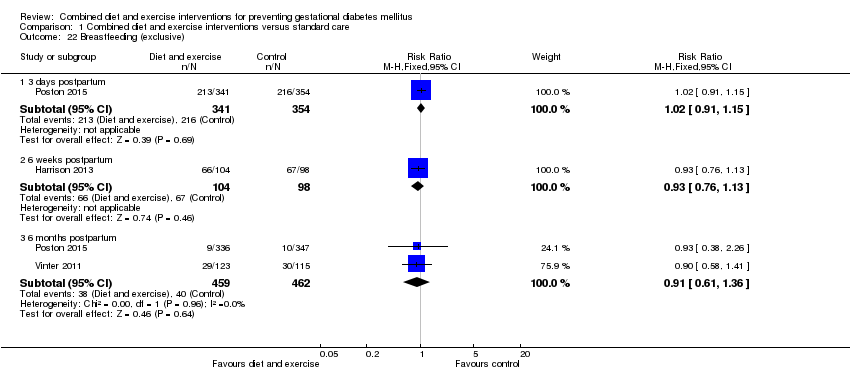 Comparison 1 Combined diet and exercise interventions versus standard care, Outcome 22 Breastfeeding (exclusive). | |||||||||||||||||||||||||||||||||||||||||||||||||||||||||||||||||||||||||||||||||||||||||||||||||||
| 22.1 3 days postpartum | 1 | 695 | Risk Ratio (M‐H, Fixed, 95% CI) | 1.02 [0.91, 1.15] | |||||||||||||||||||||||||||||||||||||||||||||||||||||||||||||||||||||||||||||||||||||||||||||||
| 22.2 6 weeks postpartum | 1 | 202 | Risk Ratio (M‐H, Fixed, 95% CI) | 0.93 [0.76, 1.13] | |||||||||||||||||||||||||||||||||||||||||||||||||||||||||||||||||||||||||||||||||||||||||||||||
| 22.3 6 months postpartum | 2 | 921 | Risk Ratio (M‐H, Fixed, 95% CI) | 0.91 [0.61, 1.36] | |||||||||||||||||||||||||||||||||||||||||||||||||||||||||||||||||||||||||||||||||||||||||||||||
| 23 Breastfeeding (partial) Show forest plot | 3 | Risk Ratio (M‐H, Fixed, 95% CI) | Subtotals only | ||||||||||||||||||||||||||||||||||||||||||||||||||||||||||||||||||||||||||||||||||||||||||||||||
| Analysis 1.23  Comparison 1 Combined diet and exercise interventions versus standard care, Outcome 23 Breastfeeding (partial). | |||||||||||||||||||||||||||||||||||||||||||||||||||||||||||||||||||||||||||||||||||||||||||||||||||
| 23.1 3 days postpartum | 1 | 695 | Risk Ratio (M‐H, Fixed, 95% CI) | 0.51 [0.40, 0.66] | |||||||||||||||||||||||||||||||||||||||||||||||||||||||||||||||||||||||||||||||||||||||||||||||
| 23.2 6 weeks postpartum | 1 | 202 | Risk Ratio (M‐H, Fixed, 95% CI) | 1.44 [0.80, 2.60] | |||||||||||||||||||||||||||||||||||||||||||||||||||||||||||||||||||||||||||||||||||||||||||||||
| 23.3 6 months postpartum | 2 | 921 | Risk Ratio (M‐H, Fixed, 95% CI) | 0.98 [0.82, 1.18] | |||||||||||||||||||||||||||||||||||||||||||||||||||||||||||||||||||||||||||||||||||||||||||||||
| 24 Breastfeeding Show forest plot | Other data | No numeric data | |||||||||||||||||||||||||||||||||||||||||||||||||||||||||||||||||||||||||||||||||||||||||||||||||
| Analysis 1.24
Comparison 1 Combined diet and exercise interventions versus standard care, Outcome 24 Breastfeeding. | |||||||||||||||||||||||||||||||||||||||||||||||||||||||||||||||||||||||||||||||||||||||||||||||||||
| 25 Postnatal weight retention (latest time reported) (kg) Show forest plot | 6 | 1673 | Mean Difference (IV, Fixed, 95% CI) | ‐0.94 [‐1.52, ‐0.37] | |||||||||||||||||||||||||||||||||||||||||||||||||||||||||||||||||||||||||||||||||||||||||||||||
| Analysis 1.25  Comparison 1 Combined diet and exercise interventions versus standard care, Outcome 25 Postnatal weight retention (latest time reported) (kg). | |||||||||||||||||||||||||||||||||||||||||||||||||||||||||||||||||||||||||||||||||||||||||||||||||||
| 26 Return to pre‐pregnancy weight (latest time reported) Show forest plot | 3 | 960 | Risk Ratio (M‐H, Fixed, 95% CI) | 1.25 [1.08, 1.45] | |||||||||||||||||||||||||||||||||||||||||||||||||||||||||||||||||||||||||||||||||||||||||||||||
| Analysis 1.26  Comparison 1 Combined diet and exercise interventions versus standard care, Outcome 26 Return to pre‐pregnancy weight (latest time reported). | |||||||||||||||||||||||||||||||||||||||||||||||||||||||||||||||||||||||||||||||||||||||||||||||||||
| 27 Postnatal BMI (latest time reported) Show forest plot | 2 | Mean Difference (IV, Fixed, 95% CI) | Subtotals only | ||||||||||||||||||||||||||||||||||||||||||||||||||||||||||||||||||||||||||||||||||||||||||||||||
| Analysis 1.27  Comparison 1 Combined diet and exercise interventions versus standard care, Outcome 27 Postnatal BMI (latest time reported). | |||||||||||||||||||||||||||||||||||||||||||||||||||||||||||||||||||||||||||||||||||||||||||||||||||
| 27.1 BMI | 2 | 902 | Mean Difference (IV, Fixed, 95% CI) | ‐0.15 [‐0.85, 0.55] | |||||||||||||||||||||||||||||||||||||||||||||||||||||||||||||||||||||||||||||||||||||||||||||||
| 27.2 BMI change from baseline to 6 weeks postpartum | 1 | 202 | Mean Difference (IV, Fixed, 95% CI) | ‐0.56 [‐1.12, ‐0.00] | |||||||||||||||||||||||||||||||||||||||||||||||||||||||||||||||||||||||||||||||||||||||||||||||
| 28 Maternal cardiovascular health (latest time reported) Show forest plot | Other data | No numeric data | |||||||||||||||||||||||||||||||||||||||||||||||||||||||||||||||||||||||||||||||||||||||||||||||||
| Analysis 1.28
Comparison 1 Combined diet and exercise interventions versus standard care, Outcome 28 Maternal cardiovascular health (latest time reported). | |||||||||||||||||||||||||||||||||||||||||||||||||||||||||||||||||||||||||||||||||||||||||||||||||||
| 29 Stillbirth Show forest plot | 5 | 4783 | Risk Ratio (M‐H, Fixed, 95% CI) | 0.69 [0.35, 1.36] | |||||||||||||||||||||||||||||||||||||||||||||||||||||||||||||||||||||||||||||||||||||||||||||||
| Analysis 1.29  Comparison 1 Combined diet and exercise interventions versus standard care, Outcome 29 Stillbirth. | |||||||||||||||||||||||||||||||||||||||||||||||||||||||||||||||||||||||||||||||||||||||||||||||||||
| 30 Neonatal mortality Show forest plot | 2 | Risk Ratio (M‐H, Fixed, 95% CI) | Subtotals only | ||||||||||||||||||||||||||||||||||||||||||||||||||||||||||||||||||||||||||||||||||||||||||||||||
| Analysis 1.30 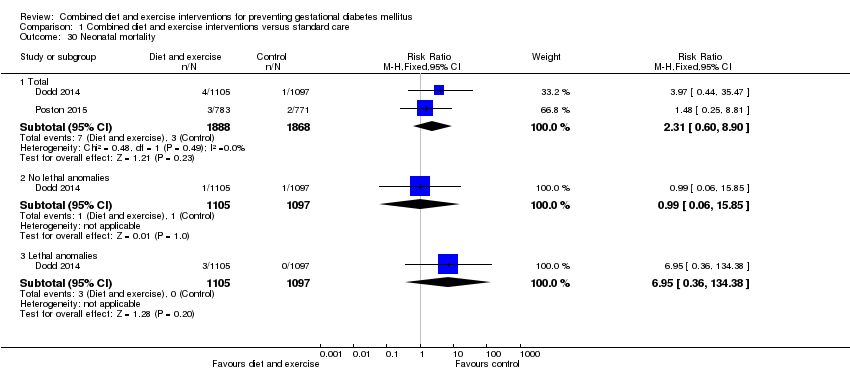 Comparison 1 Combined diet and exercise interventions versus standard care, Outcome 30 Neonatal mortality. | |||||||||||||||||||||||||||||||||||||||||||||||||||||||||||||||||||||||||||||||||||||||||||||||||||
| 30.1 Total | 2 | 3756 | Risk Ratio (M‐H, Fixed, 95% CI) | 2.31 [0.60, 8.90] | |||||||||||||||||||||||||||||||||||||||||||||||||||||||||||||||||||||||||||||||||||||||||||||||
| 30.2 No lethal anomalies | 1 | 2202 | Risk Ratio (M‐H, Fixed, 95% CI) | 0.99 [0.06, 15.85] | |||||||||||||||||||||||||||||||||||||||||||||||||||||||||||||||||||||||||||||||||||||||||||||||
| 30.3 Lethal anomalies | 1 | 2202 | Risk Ratio (M‐H, Fixed, 95% CI) | 6.95 [0.36, 134.38] | |||||||||||||||||||||||||||||||||||||||||||||||||||||||||||||||||||||||||||||||||||||||||||||||
| 31 Gestational age at birth (weeks) Show forest plot | 11 | 5658 | Mean Difference (IV, Fixed, 95% CI) | 0.05 [‐0.05, 0.15] | |||||||||||||||||||||||||||||||||||||||||||||||||||||||||||||||||||||||||||||||||||||||||||||||
| Analysis 1.31  Comparison 1 Combined diet and exercise interventions versus standard care, Outcome 31 Gestational age at birth (weeks). | |||||||||||||||||||||||||||||||||||||||||||||||||||||||||||||||||||||||||||||||||||||||||||||||||||
| 32 Gestational age at birth (days or weeks) Show forest plot | Other data | No numeric data | |||||||||||||||||||||||||||||||||||||||||||||||||||||||||||||||||||||||||||||||||||||||||||||||||
| Analysis 1.32
Comparison 1 Combined diet and exercise interventions versus standard care, Outcome 32 Gestational age at birth (days or weeks). | |||||||||||||||||||||||||||||||||||||||||||||||||||||||||||||||||||||||||||||||||||||||||||||||||||
| 33 Preterm birth Show forest plot | 11 | 5398 | Risk Ratio (M‐H, Fixed, 95% CI) | 0.80 [0.65, 0.98] | |||||||||||||||||||||||||||||||||||||||||||||||||||||||||||||||||||||||||||||||||||||||||||||||
| Analysis 1.33  Comparison 1 Combined diet and exercise interventions versus standard care, Outcome 33 Preterm birth. | |||||||||||||||||||||||||||||||||||||||||||||||||||||||||||||||||||||||||||||||||||||||||||||||||||
| 34 Apgar score less than seven at five minutes Show forest plot | 3 | 2864 | Risk Ratio (M‐H, Fixed, 95% CI) | 0.80 [0.48, 1.32] | |||||||||||||||||||||||||||||||||||||||||||||||||||||||||||||||||||||||||||||||||||||||||||||||
| Analysis 1.34 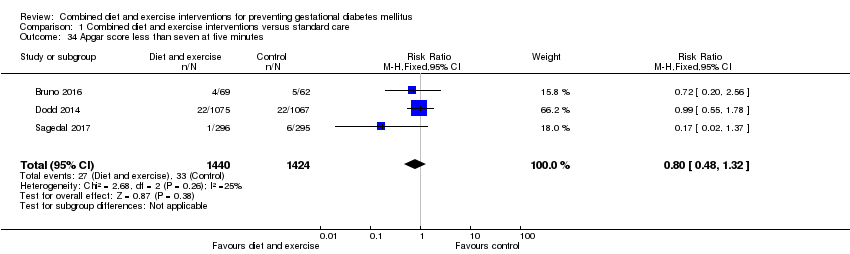 Comparison 1 Combined diet and exercise interventions versus standard care, Outcome 34 Apgar score less than seven at five minutes. | |||||||||||||||||||||||||||||||||||||||||||||||||||||||||||||||||||||||||||||||||||||||||||||||||||
| 35 Macrosomia Show forest plot | 10 | Risk Ratio (M‐H, Fixed, 95% CI) | Subtotals only | ||||||||||||||||||||||||||||||||||||||||||||||||||||||||||||||||||||||||||||||||||||||||||||||||
| Analysis 1.35  Comparison 1 Combined diet and exercise interventions versus standard care, Outcome 35 Macrosomia. | |||||||||||||||||||||||||||||||||||||||||||||||||||||||||||||||||||||||||||||||||||||||||||||||||||
| 35.1 > 4000 g | 9 | 5368 | Risk Ratio (M‐H, Fixed, 95% CI) | 0.89 [0.78, 1.01] | |||||||||||||||||||||||||||||||||||||||||||||||||||||||||||||||||||||||||||||||||||||||||||||||
| 35.2 > 4500 g | 4 | 3061 | Risk Ratio (M‐H, Fixed, 95% CI) | 0.63 [0.42, 0.94] | |||||||||||||||||||||||||||||||||||||||||||||||||||||||||||||||||||||||||||||||||||||||||||||||
| 36 Small‐for‐gestational age Show forest plot | 6 | 2434 | Risk Ratio (M‐H, Fixed, 95% CI) | 1.20 [0.95, 1.52] | |||||||||||||||||||||||||||||||||||||||||||||||||||||||||||||||||||||||||||||||||||||||||||||||
| Analysis 1.36 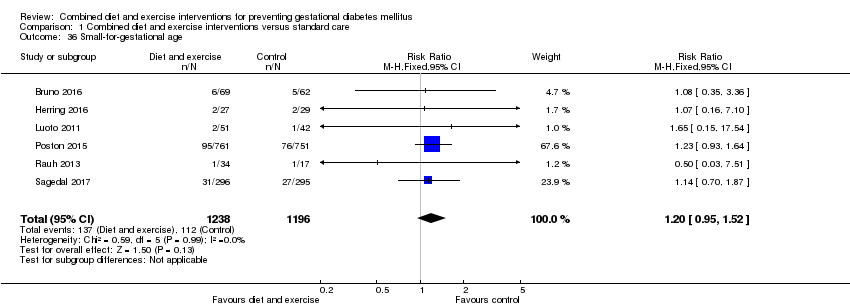 Comparison 1 Combined diet and exercise interventions versus standard care, Outcome 36 Small‐for‐gestational age. | |||||||||||||||||||||||||||||||||||||||||||||||||||||||||||||||||||||||||||||||||||||||||||||||||||
| 37 Birthweight (g) Show forest plot | 13 | 5763 | Mean Difference (IV, Fixed, 95% CI) | ‐17.67 [‐46.28, 10.94] | |||||||||||||||||||||||||||||||||||||||||||||||||||||||||||||||||||||||||||||||||||||||||||||||
| Analysis 1.37 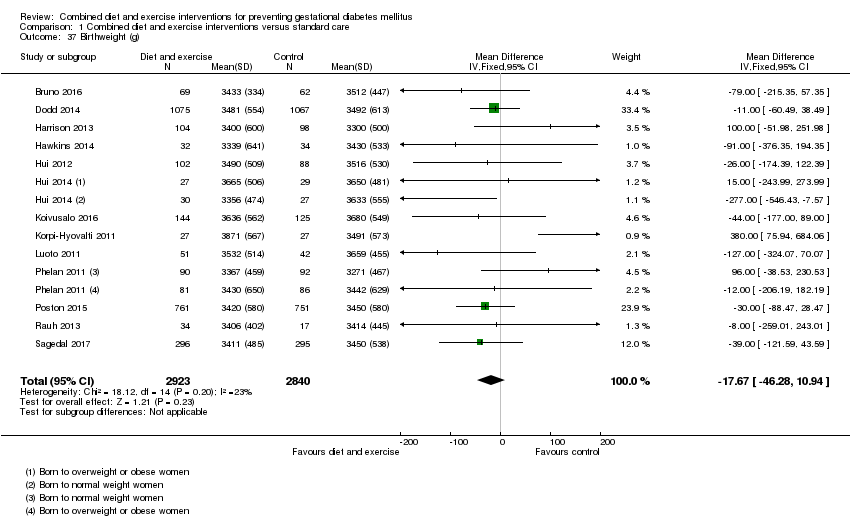 Comparison 1 Combined diet and exercise interventions versus standard care, Outcome 37 Birthweight (g). | |||||||||||||||||||||||||||||||||||||||||||||||||||||||||||||||||||||||||||||||||||||||||||||||||||
| 38 Birthweight (g) Show forest plot | Other data | No numeric data | |||||||||||||||||||||||||||||||||||||||||||||||||||||||||||||||||||||||||||||||||||||||||||||||||
| Analysis 1.38
Comparison 1 Combined diet and exercise interventions versus standard care, Outcome 38 Birthweight (g). | |||||||||||||||||||||||||||||||||||||||||||||||||||||||||||||||||||||||||||||||||||||||||||||||||||
| 39 Birthweight z score Show forest plot | 4 | 2661 | Mean Difference (IV, Fixed, 95% CI) | ‐0.05 [‐0.13, 0.03] | |||||||||||||||||||||||||||||||||||||||||||||||||||||||||||||||||||||||||||||||||||||||||||||||
| Analysis 1.39 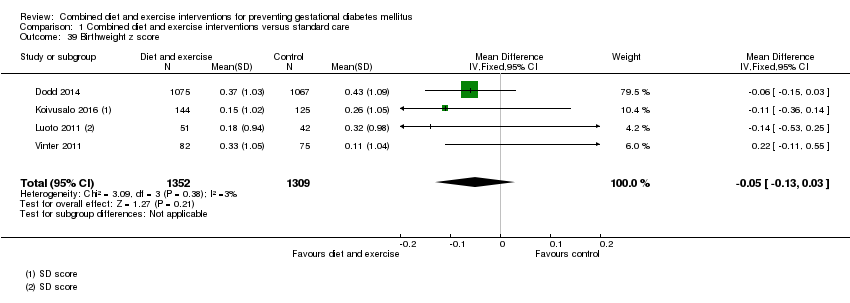 Comparison 1 Combined diet and exercise interventions versus standard care, Outcome 39 Birthweight z score. | |||||||||||||||||||||||||||||||||||||||||||||||||||||||||||||||||||||||||||||||||||||||||||||||||||
| 40 Head circumference (cm) Show forest plot | 4 | 4229 | Mean Difference (IV, Fixed, 95% CI) | ‐0.01 [‐0.11, 0.10] | |||||||||||||||||||||||||||||||||||||||||||||||||||||||||||||||||||||||||||||||||||||||||||||||
| Analysis 1.40 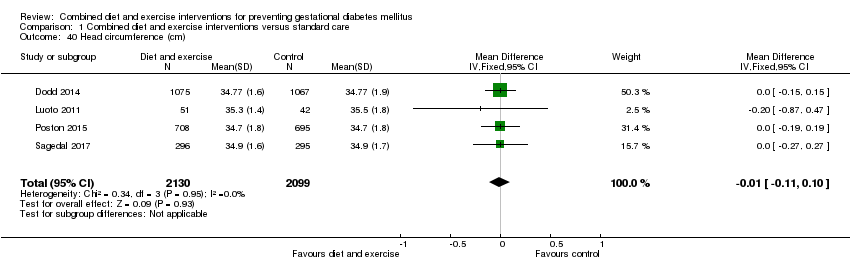 Comparison 1 Combined diet and exercise interventions versus standard care, Outcome 40 Head circumference (cm). | |||||||||||||||||||||||||||||||||||||||||||||||||||||||||||||||||||||||||||||||||||||||||||||||||||
| 41 Head circumference z score Show forest plot | 1 | 2142 | Mean Difference (IV, Fixed, 95% CI) | ‐0.05 [‐0.14, 0.04] | |||||||||||||||||||||||||||||||||||||||||||||||||||||||||||||||||||||||||||||||||||||||||||||||
| Analysis 1.41 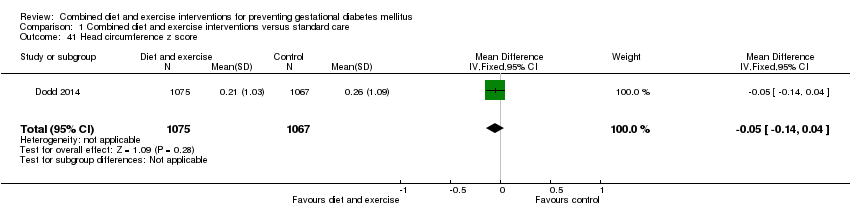 Comparison 1 Combined diet and exercise interventions versus standard care, Outcome 41 Head circumference z score. | |||||||||||||||||||||||||||||||||||||||||||||||||||||||||||||||||||||||||||||||||||||||||||||||||||
| 42 Length (cm) Show forest plot | 6 | 3303 | Mean Difference (IV, Fixed, 95% CI) | ‐0.09 [‐0.26, 0.09] | |||||||||||||||||||||||||||||||||||||||||||||||||||||||||||||||||||||||||||||||||||||||||||||||
| Analysis 1.42  Comparison 1 Combined diet and exercise interventions versus standard care, Outcome 42 Length (cm). | |||||||||||||||||||||||||||||||||||||||||||||||||||||||||||||||||||||||||||||||||||||||||||||||||||
| 43 Length z score Show forest plot | 2 | 2235 | Mean Difference (IV, Fixed, 95% CI) | ‐0.08 [‐0.15, ‐0.02] | |||||||||||||||||||||||||||||||||||||||||||||||||||||||||||||||||||||||||||||||||||||||||||||||
| Analysis 1.43 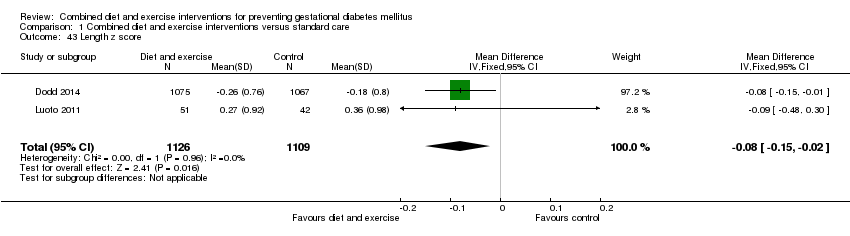 Comparison 1 Combined diet and exercise interventions versus standard care, Outcome 43 Length z score. | |||||||||||||||||||||||||||||||||||||||||||||||||||||||||||||||||||||||||||||||||||||||||||||||||||
| 44 Ponderal index (kg/m3) Show forest plot | 3 | 2826 | Mean Difference (IV, Fixed, 95% CI) | 0.04 [‐0.16, 0.25] | |||||||||||||||||||||||||||||||||||||||||||||||||||||||||||||||||||||||||||||||||||||||||||||||
| Analysis 1.44  Comparison 1 Combined diet and exercise interventions versus standard care, Outcome 44 Ponderal index (kg/m3). | |||||||||||||||||||||||||||||||||||||||||||||||||||||||||||||||||||||||||||||||||||||||||||||||||||
| 45 Adiposity (sum of skinfold thickness) (mm) Show forest plot | 2 | 1472 | Mean Difference (IV, Fixed, 95% CI) | 0.09 [‐0.33, 0.50] | |||||||||||||||||||||||||||||||||||||||||||||||||||||||||||||||||||||||||||||||||||||||||||||||
| Analysis 1.45  Comparison 1 Combined diet and exercise interventions versus standard care, Outcome 45 Adiposity (sum of skinfold thickness) (mm). | |||||||||||||||||||||||||||||||||||||||||||||||||||||||||||||||||||||||||||||||||||||||||||||||||||
| 45.1 Sum of biceps, triceps, subscapular, suprailiac, abdominal and thigh skinfold thickness | 1 | 970 | Mean Difference (IV, Fixed, 95% CI) | 0.03 [‐0.86, 0.92] | |||||||||||||||||||||||||||||||||||||||||||||||||||||||||||||||||||||||||||||||||||||||||||||||
| 45.2 Sum of triceps and subscapular skinfold thickness (mm) | 1 | 502 | Mean Difference (IV, Fixed, 95% CI) | 0.10 [‐0.36, 0.56] | |||||||||||||||||||||||||||||||||||||||||||||||||||||||||||||||||||||||||||||||||||||||||||||||
| 46 Adiposity (abdominal circumference) (cm) Show forest plot | 2 | 1566 | Mean Difference (IV, Fixed, 95% CI) | ‐0.01 [‐0.23, 0.22] | |||||||||||||||||||||||||||||||||||||||||||||||||||||||||||||||||||||||||||||||||||||||||||||||
| Analysis 1.46 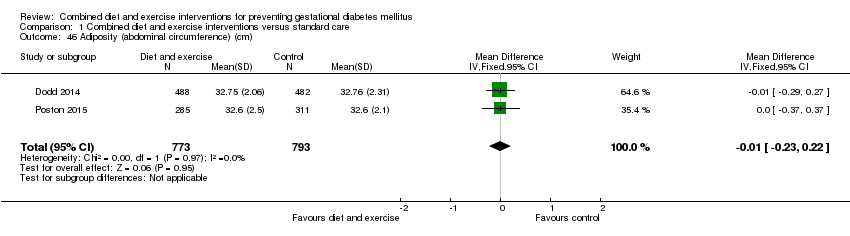 Comparison 1 Combined diet and exercise interventions versus standard care, Outcome 46 Adiposity (abdominal circumference) (cm). | |||||||||||||||||||||||||||||||||||||||||||||||||||||||||||||||||||||||||||||||||||||||||||||||||||
| 47 Adiposity Show forest plot | Other data | No numeric data | |||||||||||||||||||||||||||||||||||||||||||||||||||||||||||||||||||||||||||||||||||||||||||||||||
| Analysis 1.47
Comparison 1 Combined diet and exercise interventions versus standard care, Outcome 47 Adiposity. | |||||||||||||||||||||||||||||||||||||||||||||||||||||||||||||||||||||||||||||||||||||||||||||||||||
| 48 Shoulder dystocia Show forest plot | 2 | 2733 | Risk Ratio (M‐H, Fixed, 95% CI) | 1.20 [0.79, 1.83] | |||||||||||||||||||||||||||||||||||||||||||||||||||||||||||||||||||||||||||||||||||||||||||||||
| Analysis 1.48  Comparison 1 Combined diet and exercise interventions versus standard care, Outcome 48 Shoulder dystocia. | |||||||||||||||||||||||||||||||||||||||||||||||||||||||||||||||||||||||||||||||||||||||||||||||||||
| 49 Nerve palsy Show forest plot | 1 | 2142 | Risk Ratio (M‐H, Fixed, 95% CI) | 1.99 [0.36, 10.82] | |||||||||||||||||||||||||||||||||||||||||||||||||||||||||||||||||||||||||||||||||||||||||||||||
| Analysis 1.49  Comparison 1 Combined diet and exercise interventions versus standard care, Outcome 49 Nerve palsy. | |||||||||||||||||||||||||||||||||||||||||||||||||||||||||||||||||||||||||||||||||||||||||||||||||||
| 50 Bone fracture Show forest plot | 1 | 2142 | Risk Ratio (M‐H, Fixed, 95% CI) | 1.99 [0.36, 10.82] | |||||||||||||||||||||||||||||||||||||||||||||||||||||||||||||||||||||||||||||||||||||||||||||||
| Analysis 1.50  Comparison 1 Combined diet and exercise interventions versus standard care, Outcome 50 Bone fracture. | |||||||||||||||||||||||||||||||||||||||||||||||||||||||||||||||||||||||||||||||||||||||||||||||||||
| 51 Respiratory distress syndrome Show forest plot | 2 | 2411 | Risk Ratio (M‐H, Fixed, 95% CI) | 0.56 [0.33, 0.97] | |||||||||||||||||||||||||||||||||||||||||||||||||||||||||||||||||||||||||||||||||||||||||||||||
| Analysis 1.51 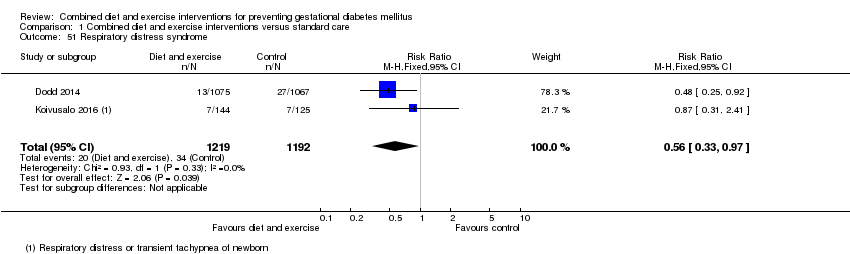 Comparison 1 Combined diet and exercise interventions versus standard care, Outcome 51 Respiratory distress syndrome. | |||||||||||||||||||||||||||||||||||||||||||||||||||||||||||||||||||||||||||||||||||||||||||||||||||
| 52 Hypoglycaemia Show forest plot | 2 | 3653 | Risk Ratio (M‐H, Random, 95% CI) | 1.42 [0.67, 2.98] | |||||||||||||||||||||||||||||||||||||||||||||||||||||||||||||||||||||||||||||||||||||||||||||||
| Analysis 1.52 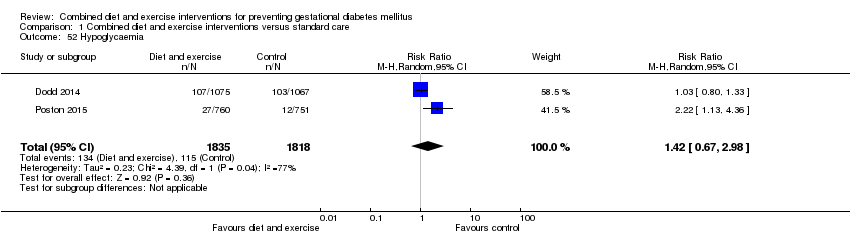 Comparison 1 Combined diet and exercise interventions versus standard care, Outcome 52 Hypoglycaemia. | |||||||||||||||||||||||||||||||||||||||||||||||||||||||||||||||||||||||||||||||||||||||||||||||||||
| 53 Hyperbilirubinaemia Show forest plot | 1 | 2142 | Risk Ratio (M‐H, Fixed, 95% CI) | 0.82 [0.61, 1.11] | |||||||||||||||||||||||||||||||||||||||||||||||||||||||||||||||||||||||||||||||||||||||||||||||
| Analysis 1.53 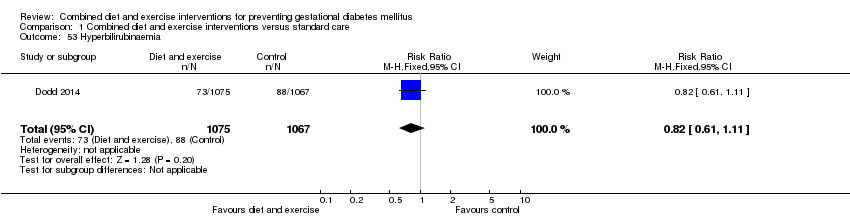 Comparison 1 Combined diet and exercise interventions versus standard care, Outcome 53 Hyperbilirubinaemia. | |||||||||||||||||||||||||||||||||||||||||||||||||||||||||||||||||||||||||||||||||||||||||||||||||||
| 54 Childhood weight (latest time reported) (kg) Show forest plot | 3 | 882 | Mean Difference (IV, Random, 95% CI) | ‐0.05 [‐0.33, 0.22] | |||||||||||||||||||||||||||||||||||||||||||||||||||||||||||||||||||||||||||||||||||||||||||||||
| Analysis 1.54  Comparison 1 Combined diet and exercise interventions versus standard care, Outcome 54 Childhood weight (latest time reported) (kg). | |||||||||||||||||||||||||||||||||||||||||||||||||||||||||||||||||||||||||||||||||||||||||||||||||||
| 54.1 6 months | 1 | 677 | Mean Difference (IV, Random, 95% CI) | ‐0.10 [‐0.26, 0.06] | |||||||||||||||||||||||||||||||||||||||||||||||||||||||||||||||||||||||||||||||||||||||||||||||
| 54.2 10‐12 months | 1 | 48 | Mean Difference (IV, Random, 95% CI) | ‐0.36 [‐0.96, 0.24] | |||||||||||||||||||||||||||||||||||||||||||||||||||||||||||||||||||||||||||||||||||||||||||||||
| 54.3 2.8 years | 1 | 157 | Mean Difference (IV, Random, 95% CI) | 0.30 [‐0.19, 0.79] | |||||||||||||||||||||||||||||||||||||||||||||||||||||||||||||||||||||||||||||||||||||||||||||||
| 55 Childhood weight z score (latest time reported) Show forest plot | 1 | 643 | Mean Difference (IV, Fixed, 95% CI) | ‐0.09 [‐0.26, 0.08] | |||||||||||||||||||||||||||||||||||||||||||||||||||||||||||||||||||||||||||||||||||||||||||||||
| Analysis 1.55  Comparison 1 Combined diet and exercise interventions versus standard care, Outcome 55 Childhood weight z score (latest time reported). | |||||||||||||||||||||||||||||||||||||||||||||||||||||||||||||||||||||||||||||||||||||||||||||||||||
| 56 Childhood height (latest time reported) (cm) Show forest plot | 2 | 816 | Mean Difference (IV, Fixed, 95% CI) | 0.33 [‐0.58, 1.25] | |||||||||||||||||||||||||||||||||||||||||||||||||||||||||||||||||||||||||||||||||||||||||||||||
| Analysis 1.56  Comparison 1 Combined diet and exercise interventions versus standard care, Outcome 56 Childhood height (latest time reported) (cm). | |||||||||||||||||||||||||||||||||||||||||||||||||||||||||||||||||||||||||||||||||||||||||||||||||||
| 56.1 6 months | 1 | 659 | Mean Difference (IV, Fixed, 95% CI) | 1.04 [‐0.58, 2.66] | |||||||||||||||||||||||||||||||||||||||||||||||||||||||||||||||||||||||||||||||||||||||||||||||
| 56.2 2.8 years | 1 | 157 | Mean Difference (IV, Fixed, 95% CI) | 0.0 [‐1.11, 1.11] | |||||||||||||||||||||||||||||||||||||||||||||||||||||||||||||||||||||||||||||||||||||||||||||||
| 57 Childhood height z score (latest time reported) Show forest plot | 1 | 622 | Mean Difference (IV, Fixed, 95% CI) | ‐0.02 [‐0.31, 0.27] | |||||||||||||||||||||||||||||||||||||||||||||||||||||||||||||||||||||||||||||||||||||||||||||||
| Analysis 1.57  Comparison 1 Combined diet and exercise interventions versus standard care, Outcome 57 Childhood height z score (latest time reported). | |||||||||||||||||||||||||||||||||||||||||||||||||||||||||||||||||||||||||||||||||||||||||||||||||||
| 58 Childhood head circumference (latest time reported) (cm) Show forest plot | 1 | 670 | Mean Difference (IV, Fixed, 95% CI) | ‐0.12 [‐0.70, 0.46] | |||||||||||||||||||||||||||||||||||||||||||||||||||||||||||||||||||||||||||||||||||||||||||||||
| Analysis 1.58  Comparison 1 Combined diet and exercise interventions versus standard care, Outcome 58 Childhood head circumference (latest time reported) (cm). | |||||||||||||||||||||||||||||||||||||||||||||||||||||||||||||||||||||||||||||||||||||||||||||||||||
| 59 Childhood adiposity (latest time reported) (BMI z score) Show forest plot | 2 | 794 | Mean Difference (IV, Random, 95% CI) | 0.05 [‐0.29, 0.40] | |||||||||||||||||||||||||||||||||||||||||||||||||||||||||||||||||||||||||||||||||||||||||||||||
| Analysis 1.59  Comparison 1 Combined diet and exercise interventions versus standard care, Outcome 59 Childhood adiposity (latest time reported) (BMI z score). | |||||||||||||||||||||||||||||||||||||||||||||||||||||||||||||||||||||||||||||||||||||||||||||||||||
| 59.1 6 months | 1 | 637 | Mean Difference (IV, Random, 95% CI) | ‐0.11 [‐0.39, 0.17] | |||||||||||||||||||||||||||||||||||||||||||||||||||||||||||||||||||||||||||||||||||||||||||||||
| 59.2 2.8 years | 1 | 157 | Mean Difference (IV, Random, 95% CI) | 0.24 [‐0.10, 0.58] | |||||||||||||||||||||||||||||||||||||||||||||||||||||||||||||||||||||||||||||||||||||||||||||||
| 60 Childhood adiposity (latest time reported) (abdominal circumference) (cm) Show forest plot | 2 | 833 | Mean Difference (IV, Fixed, 95% CI) | 0.26 [‐0.37, 0.90] | |||||||||||||||||||||||||||||||||||||||||||||||||||||||||||||||||||||||||||||||||||||||||||||||
| Analysis 1.60 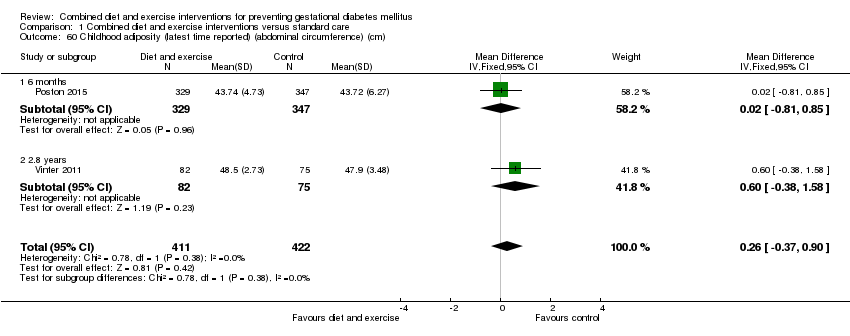 Comparison 1 Combined diet and exercise interventions versus standard care, Outcome 60 Childhood adiposity (latest time reported) (abdominal circumference) (cm). | |||||||||||||||||||||||||||||||||||||||||||||||||||||||||||||||||||||||||||||||||||||||||||||||||||
| 60.1 6 months | 1 | 676 | Mean Difference (IV, Fixed, 95% CI) | 0.02 [‐0.81, 0.85] | |||||||||||||||||||||||||||||||||||||||||||||||||||||||||||||||||||||||||||||||||||||||||||||||
| 60.2 2.8 years | 1 | 157 | Mean Difference (IV, Fixed, 95% CI) | 0.60 [‐0.38, 1.58] | |||||||||||||||||||||||||||||||||||||||||||||||||||||||||||||||||||||||||||||||||||||||||||||||
| 61 Childhood adiposity (latest time reported) (subscapular skinfold thickness) (mm) Show forest plot | 2 | 705 | Mean Difference (IV, Random, 95% CI) | ‐0.17 [‐0.66, 0.32] | |||||||||||||||||||||||||||||||||||||||||||||||||||||||||||||||||||||||||||||||||||||||||||||||
| Analysis 1.61 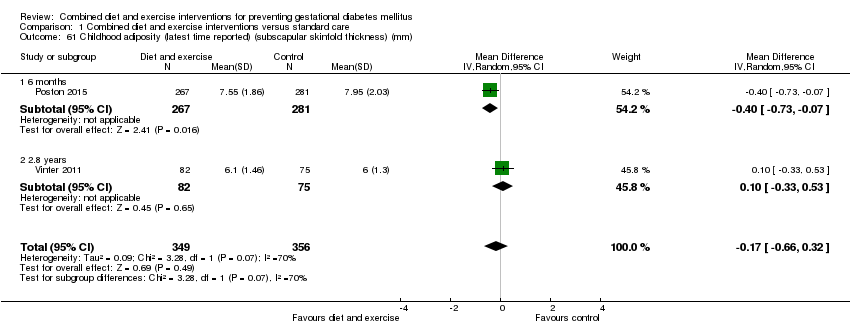 Comparison 1 Combined diet and exercise interventions versus standard care, Outcome 61 Childhood adiposity (latest time reported) (subscapular skinfold thickness) (mm). | |||||||||||||||||||||||||||||||||||||||||||||||||||||||||||||||||||||||||||||||||||||||||||||||||||
| 61.1 6 months | 1 | 548 | Mean Difference (IV, Random, 95% CI) | ‐0.40 [‐0.73, ‐0.07] | |||||||||||||||||||||||||||||||||||||||||||||||||||||||||||||||||||||||||||||||||||||||||||||||
| 61.2 2.8 years | 1 | 157 | Mean Difference (IV, Random, 95% CI) | 0.10 [‐0.33, 0.53] | |||||||||||||||||||||||||||||||||||||||||||||||||||||||||||||||||||||||||||||||||||||||||||||||
| 62 Childhood adiposity (latest time reported) (triceps skinfold thickness) (mm) Show forest plot | 2 | 784 | Mean Difference (IV, Fixed, 95% CI) | ‐0.12 [‐0.48, 0.23] | |||||||||||||||||||||||||||||||||||||||||||||||||||||||||||||||||||||||||||||||||||||||||||||||
| Analysis 1.62 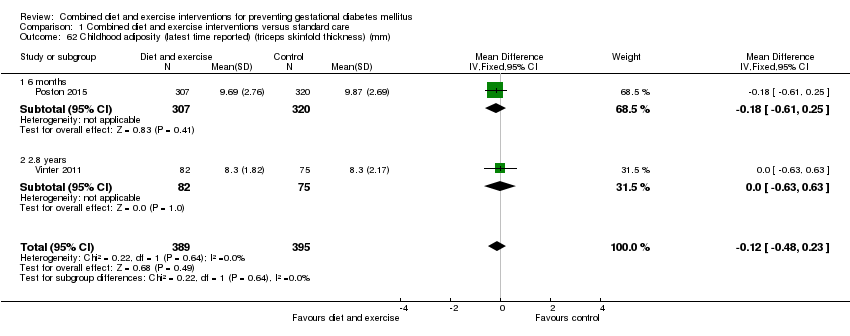 Comparison 1 Combined diet and exercise interventions versus standard care, Outcome 62 Childhood adiposity (latest time reported) (triceps skinfold thickness) (mm). | |||||||||||||||||||||||||||||||||||||||||||||||||||||||||||||||||||||||||||||||||||||||||||||||||||
| 62.1 6 months | 1 | 627 | Mean Difference (IV, Fixed, 95% CI) | ‐0.18 [‐0.61, 0.25] | |||||||||||||||||||||||||||||||||||||||||||||||||||||||||||||||||||||||||||||||||||||||||||||||
| 62.2 2.8 years | 1 | 157 | Mean Difference (IV, Fixed, 95% CI) | 0.0 [‐0.63, 0.63] | |||||||||||||||||||||||||||||||||||||||||||||||||||||||||||||||||||||||||||||||||||||||||||||||
| 63 Childhood adiposity (latest time reported) (total body fat) (%) Show forest plot | 2 | 614 | Mean Difference (IV, Fixed, 95% CI) | ‐0.74 [‐1.56, 0.07] | |||||||||||||||||||||||||||||||||||||||||||||||||||||||||||||||||||||||||||||||||||||||||||||||
| Analysis 1.63  Comparison 1 Combined diet and exercise interventions versus standard care, Outcome 63 Childhood adiposity (latest time reported) (total body fat) (%). | |||||||||||||||||||||||||||||||||||||||||||||||||||||||||||||||||||||||||||||||||||||||||||||||||||
| 63.1 6 months | 1 | 547 | Mean Difference (IV, Fixed, 95% CI) | ‐0.80 [‐1.64, 0.04] | |||||||||||||||||||||||||||||||||||||||||||||||||||||||||||||||||||||||||||||||||||||||||||||||
| 63.2 2.8 years | 1 | 67 | Mean Difference (IV, Fixed, 95% CI) | 0.0 [‐3.03, 3.03] | |||||||||||||||||||||||||||||||||||||||||||||||||||||||||||||||||||||||||||||||||||||||||||||||
| 64 Childhood adiposity (latest time reported) Show forest plot | Other data | No numeric data | |||||||||||||||||||||||||||||||||||||||||||||||||||||||||||||||||||||||||||||||||||||||||||||||||
| Analysis 1.64
Comparison 1 Combined diet and exercise interventions versus standard care, Outcome 64 Childhood adiposity (latest time reported). | |||||||||||||||||||||||||||||||||||||||||||||||||||||||||||||||||||||||||||||||||||||||||||||||||||
| 65 Childhood cardiovascular health (latest time reported) Show forest plot | Other data | No numeric data | |||||||||||||||||||||||||||||||||||||||||||||||||||||||||||||||||||||||||||||||||||||||||||||||||
| Analysis 1.65
Comparison 1 Combined diet and exercise interventions versus standard care, Outcome 65 Childhood cardiovascular health (latest time reported). | |||||||||||||||||||||||||||||||||||||||||||||||||||||||||||||||||||||||||||||||||||||||||||||||||||
| 66 Antenatal visits Show forest plot | 1 | 269 | Mean Difference (IV, Fixed, 95% CI) | 0.0 [‐0.36, 0.36] | |||||||||||||||||||||||||||||||||||||||||||||||||||||||||||||||||||||||||||||||||||||||||||||||
| Analysis 1.66  Comparison 1 Combined diet and exercise interventions versus standard care, Outcome 66 Antenatal visits. | |||||||||||||||||||||||||||||||||||||||||||||||||||||||||||||||||||||||||||||||||||||||||||||||||||
| 67 Antenatal admissions Show forest plot | 1 | 2153 | Risk Ratio (M‐H, Fixed, 95% CI) | 0.86 [0.71, 1.04] | |||||||||||||||||||||||||||||||||||||||||||||||||||||||||||||||||||||||||||||||||||||||||||||||
| Analysis 1.67  Comparison 1 Combined diet and exercise interventions versus standard care, Outcome 67 Antenatal admissions. | |||||||||||||||||||||||||||||||||||||||||||||||||||||||||||||||||||||||||||||||||||||||||||||||||||
| 68 Length of antenatal stay (days) Show forest plot | 2 | Mean Difference (IV, Fixed, 95% CI) | Subtotals only | ||||||||||||||||||||||||||||||||||||||||||||||||||||||||||||||||||||||||||||||||||||||||||||||||
| Analysis 1.68  Comparison 1 Combined diet and exercise interventions versus standard care, Outcome 68 Length of antenatal stay (days). | |||||||||||||||||||||||||||||||||||||||||||||||||||||||||||||||||||||||||||||||||||||||||||||||||||
| 68.1 Antenatal stay (days) | 1 | 2153 | Mean Difference (IV, Fixed, 95% CI) | ‐0.27 [‐0.49, ‐0.05] | |||||||||||||||||||||||||||||||||||||||||||||||||||||||||||||||||||||||||||||||||||||||||||||||
| 68.2 Antenatal inpatient stay (nights), if admitted | 1 | 139 | Mean Difference (IV, Fixed, 95% CI) | 0.0 [‐1.00, 1.00] | |||||||||||||||||||||||||||||||||||||||||||||||||||||||||||||||||||||||||||||||||||||||||||||||
| 69 Neonatal intensive care unit admission Show forest plot | 4 | 4549 | Risk Ratio (M‐H, Fixed, 95% CI) | 1.03 [0.93, 1.14] | |||||||||||||||||||||||||||||||||||||||||||||||||||||||||||||||||||||||||||||||||||||||||||||||
| Analysis 1.69 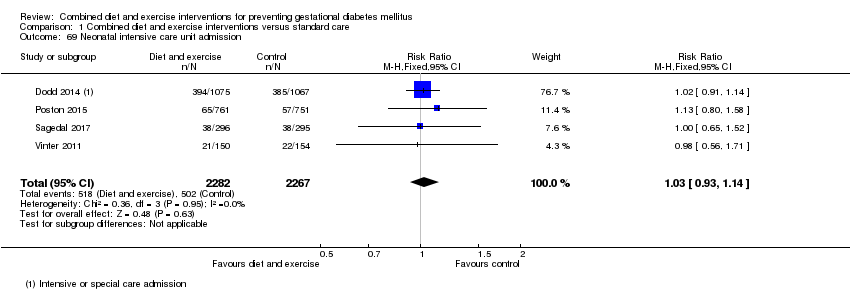 Comparison 1 Combined diet and exercise interventions versus standard care, Outcome 69 Neonatal intensive care unit admission. | |||||||||||||||||||||||||||||||||||||||||||||||||||||||||||||||||||||||||||||||||||||||||||||||||||
| 70 Length of postnatal stay (mother) (days) Show forest plot | 2 | 3511 | Mean Difference (IV, Random, 95% CI) | 0.01 [‐0.14, 0.17] | |||||||||||||||||||||||||||||||||||||||||||||||||||||||||||||||||||||||||||||||||||||||||||||||
| Analysis 1.70 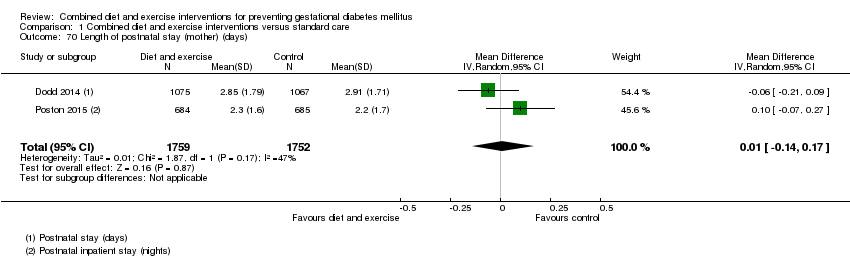 Comparison 1 Combined diet and exercise interventions versus standard care, Outcome 70 Length of postnatal stay (mother) (days). | |||||||||||||||||||||||||||||||||||||||||||||||||||||||||||||||||||||||||||||||||||||||||||||||||||
| 71 Length of postnatal stay (baby) (days) Show forest plot | 2 | 3618 | Mean Difference (IV, Fixed, 95% CI) | ‐0.35 [‐0.90, 0.20] | |||||||||||||||||||||||||||||||||||||||||||||||||||||||||||||||||||||||||||||||||||||||||||||||
| Analysis 1.71  Comparison 1 Combined diet and exercise interventions versus standard care, Outcome 71 Length of postnatal stay (baby) (days). | |||||||||||||||||||||||||||||||||||||||||||||||||||||||||||||||||||||||||||||||||||||||||||||||||||
| 72 Costs to families associated with the management provided (unit cost, €) Show forest plot | 1 | Mean Difference (IV, Fixed, 95% CI) | Subtotals only | ||||||||||||||||||||||||||||||||||||||||||||||||||||||||||||||||||||||||||||||||||||||||||||||||
| Analysis 1.72  Comparison 1 Combined diet and exercise interventions versus standard care, Outcome 72 Costs to families associated with the management provided (unit cost, €). | |||||||||||||||||||||||||||||||||||||||||||||||||||||||||||||||||||||||||||||||||||||||||||||||||||
| 72.1 Delivery cost to the patient | 1 | 93 | Mean Difference (IV, Fixed, 95% CI) | 3.0 [‐10.82, 16.82] | |||||||||||||||||||||||||||||||||||||||||||||||||||||||||||||||||||||||||||||||||||||||||||||||
| 72.2 Neonatal care cost to the patient | 1 | 93 | Mean Difference (IV, Fixed, 95% CI) | 3.00 [‐13.67, 19.67] | |||||||||||||||||||||||||||||||||||||||||||||||||||||||||||||||||||||||||||||||||||||||||||||||
| 73 Costs associated with the intervention (unit cost, €) Show forest plot | 1 | 93 | Mean Difference (IV, Fixed, 95% CI) | 769.0 [‐1032.23, 2570.23] | |||||||||||||||||||||||||||||||||||||||||||||||||||||||||||||||||||||||||||||||||||||||||||||||
| Analysis 1.73  Comparison 1 Combined diet and exercise interventions versus standard care, Outcome 73 Costs associated with the intervention (unit cost, €). | |||||||||||||||||||||||||||||||||||||||||||||||||||||||||||||||||||||||||||||||||||||||||||||||||||
| 73.1 Total costs | 1 | 93 | Mean Difference (IV, Fixed, 95% CI) | 769.0 [‐1032.23, 2570.23] | |||||||||||||||||||||||||||||||||||||||||||||||||||||||||||||||||||||||||||||||||||||||||||||||
| 74 Cost of maternal care (unit cost, €) Show forest plot | 1 | Mean Difference (IV, Fixed, 95% CI) | Subtotals only | ||||||||||||||||||||||||||||||||||||||||||||||||||||||||||||||||||||||||||||||||||||||||||||||||
| Analysis 1.74 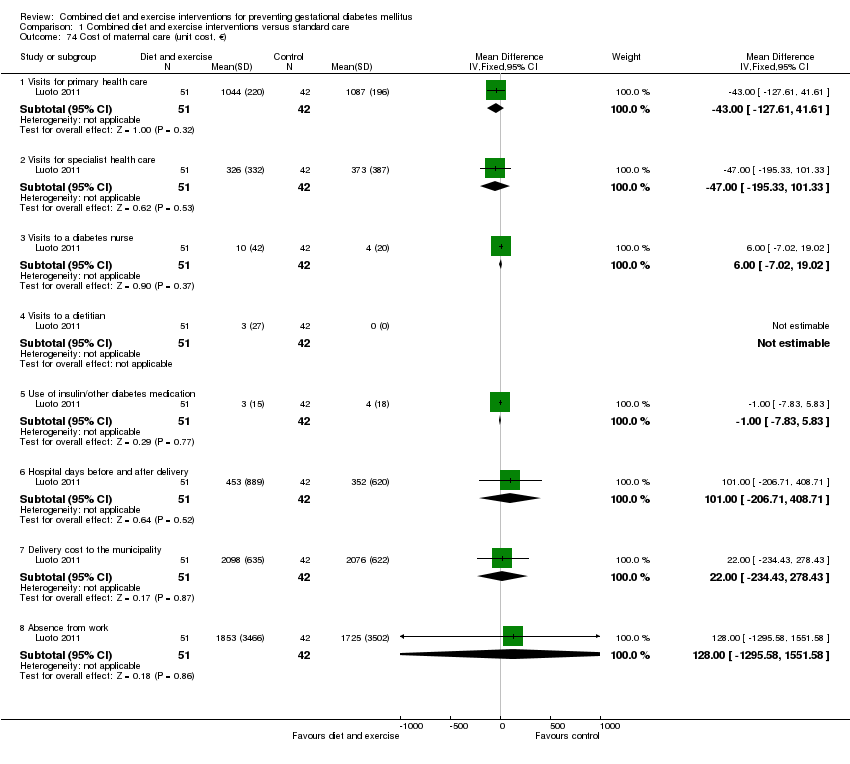 Comparison 1 Combined diet and exercise interventions versus standard care, Outcome 74 Cost of maternal care (unit cost, €). | |||||||||||||||||||||||||||||||||||||||||||||||||||||||||||||||||||||||||||||||||||||||||||||||||||
| 74.1 Visits for primary health care | 1 | 93 | Mean Difference (IV, Fixed, 95% CI) | ‐43.0 [‐127.61, 41.61] | |||||||||||||||||||||||||||||||||||||||||||||||||||||||||||||||||||||||||||||||||||||||||||||||
| 74.2 Visits for specialist health care | 1 | 93 | Mean Difference (IV, Fixed, 95% CI) | ‐47.0 [‐195.33, 101.33] | |||||||||||||||||||||||||||||||||||||||||||||||||||||||||||||||||||||||||||||||||||||||||||||||
| 74.3 Visits to a diabetes nurse | 1 | 93 | Mean Difference (IV, Fixed, 95% CI) | 6.00 [‐7.02, 19.02] | |||||||||||||||||||||||||||||||||||||||||||||||||||||||||||||||||||||||||||||||||||||||||||||||
| 74.4 Visits to a dietitian | 1 | 93 | Mean Difference (IV, Fixed, 95% CI) | 0.0 [0.0, 0.0] | |||||||||||||||||||||||||||||||||||||||||||||||||||||||||||||||||||||||||||||||||||||||||||||||
| 74.5 Use of insulin/other diabetes medication | 1 | 93 | Mean Difference (IV, Fixed, 95% CI) | ‐1.0 [‐7.83, 5.83] | |||||||||||||||||||||||||||||||||||||||||||||||||||||||||||||||||||||||||||||||||||||||||||||||
| 74.6 Hospital days before and after delivery | 1 | 93 | Mean Difference (IV, Fixed, 95% CI) | 101.00 [‐206.71, 408.71] | |||||||||||||||||||||||||||||||||||||||||||||||||||||||||||||||||||||||||||||||||||||||||||||||
| 74.7 Delivery cost to the municipality | 1 | 93 | Mean Difference (IV, Fixed, 95% CI) | 22.0 [‐234.43, 278.43] | |||||||||||||||||||||||||||||||||||||||||||||||||||||||||||||||||||||||||||||||||||||||||||||||
| 74.8 Absence from work | 1 | 93 | Mean Difference (IV, Fixed, 95% CI) | 128.0 [‐1295.58, 1551.58] | |||||||||||||||||||||||||||||||||||||||||||||||||||||||||||||||||||||||||||||||||||||||||||||||
| 75 Cost of infant care (unit cost, €) Show forest plot | 1 | 93 | Mean Difference (IV, Fixed, 95% CI) | 453.0 [‐298.20, 1204.20] | |||||||||||||||||||||||||||||||||||||||||||||||||||||||||||||||||||||||||||||||||||||||||||||||
| Analysis 1.75  Comparison 1 Combined diet and exercise interventions versus standard care, Outcome 75 Cost of infant care (unit cost, €). | |||||||||||||||||||||||||||||||||||||||||||||||||||||||||||||||||||||||||||||||||||||||||||||||||||
| 75.1 Neonatal care cost to municipality | 1 | 93 | Mean Difference (IV, Fixed, 95% CI) | 453.0 [‐298.20, 1204.20] | |||||||||||||||||||||||||||||||||||||||||||||||||||||||||||||||||||||||||||||||||||||||||||||||
| Outcome or subgroup title | No. of studies | No. of participants | Statistical method | Effect size |
| 1 Gestational diabetes Show forest plot | 19 | 6633 | Risk Ratio (M‐H, Random, 95% CI) | 0.85 [0.71, 1.01] |
| Analysis 2.1  Comparison 2 Combined diet and exercise interventions versus standard care: subgroups based on study design, Outcome 1 Gestational diabetes. | ||||
| 1.1 Individually‐randomised | 17 | 6492 | Risk Ratio (M‐H, Random, 95% CI) | 0.84 [0.70, 1.01] |
| 1.2 Cluster‐randomised | 2 | 141 | Risk Ratio (M‐H, Random, 95% CI) | 1.05 [0.42, 2.60] |
| 2 Pre‐eclampsia Show forest plot | 8 | 5366 | Risk Ratio (M‐H, Fixed, 95% CI) | 0.98 [0.79, 1.22] |
| Analysis 2.2  Comparison 2 Combined diet and exercise interventions versus standard care: subgroups based on study design, Outcome 2 Pre‐eclampsia. | ||||
| 2.1 Individually‐randomised | 7 | 5273 | Risk Ratio (M‐H, Fixed, 95% CI) | 0.97 [0.78, 1.21] |
| 2.2 Cluster‐randomised | 1 | 93 | Risk Ratio (M‐H, Fixed, 95% CI) | 1.24 [0.22, 7.05] |
| 3 Caesarean section Show forest plot | 14 | 6089 | Risk Ratio (M‐H, Fixed, 95% CI) | 0.95 [0.88, 1.02] |
| Analysis 2.3  Comparison 2 Combined diet and exercise interventions versus standard care: subgroups based on study design, Outcome 3 Caesarean section. | ||||
| 3.1 Individually‐randomised | 13 | 6038 | Risk Ratio (M‐H, Fixed, 95% CI) | 0.95 [0.88, 1.02] |
| 3.2 Cluster‐randomised | 1 | 51 | Risk Ratio (M‐H, Fixed, 95% CI) | 0.71 [0.33, 1.54] |
| 4 Large‐for‐gestational age Show forest plot | 11 | 5353 | Risk Ratio (M‐H, Fixed, 95% CI) | 0.93 [0.81, 1.07] |
| Analysis 2.4 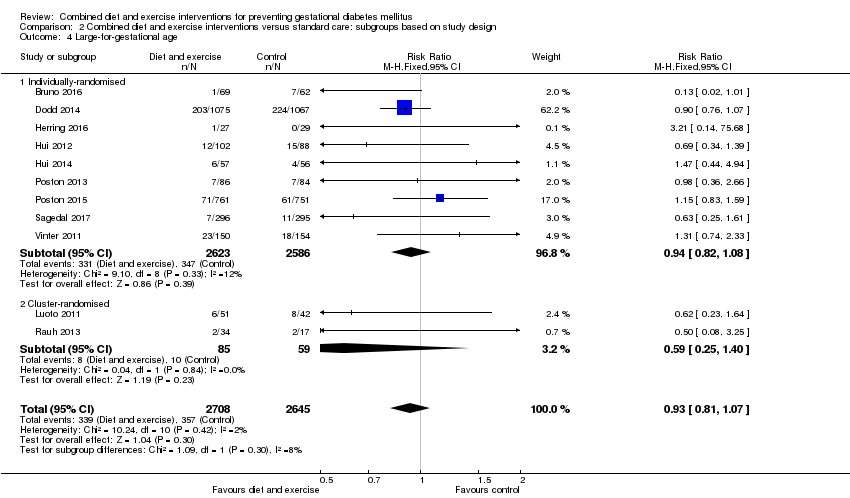 Comparison 2 Combined diet and exercise interventions versus standard care: subgroups based on study design, Outcome 4 Large‐for‐gestational age. | ||||
| 4.1 Individually‐randomised | 9 | 5209 | Risk Ratio (M‐H, Fixed, 95% CI) | 0.94 [0.82, 1.08] |
| 4.2 Cluster‐randomised | 2 | 144 | Risk Ratio (M‐H, Fixed, 95% CI) | 0.59 [0.25, 1.40] |
| Outcome or subgroup title | No. of studies | No. of participants | Statistical method | Effect size |
| 1 Gestational diabetes Show forest plot | 19 | 6633 | Risk Ratio (M‐H, Random, 95% CI) | 0.86 [0.72, 1.02] |
| Analysis 3.1 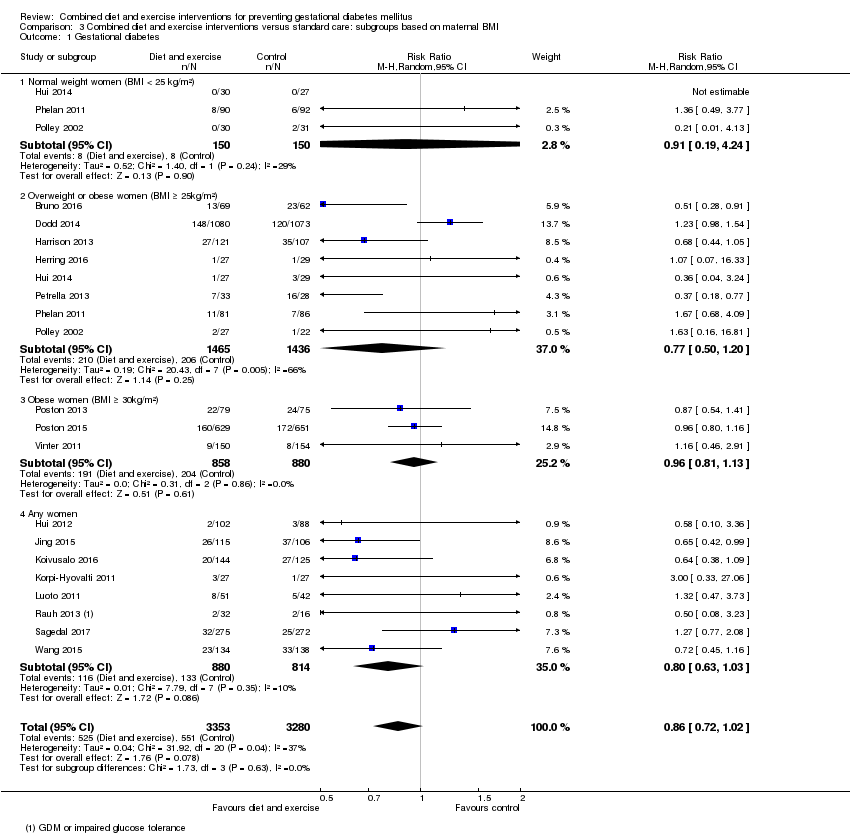 Comparison 3 Combined diet and exercise interventions versus standard care: subgroups based on maternal BMI, Outcome 1 Gestational diabetes. | ||||
| 1.1 Normal weight women (BMI < 25 kg/m²) | 3 | 300 | Risk Ratio (M‐H, Random, 95% CI) | 0.91 [0.19, 4.24] |
| 1.2 Overweight or obese women (BMI ≥ 25kg/m²) | 8 | 2901 | Risk Ratio (M‐H, Random, 95% CI) | 0.77 [0.50, 1.20] |
| 1.3 Obese women (BMI ≥ 30kg/m²) | 3 | 1738 | Risk Ratio (M‐H, Random, 95% CI) | 0.96 [0.81, 1.13] |
| 1.4 Any women | 8 | 1694 | Risk Ratio (M‐H, Random, 95% CI) | 0.80 [0.63, 1.03] |
| 2 Pre‐eclampsia Show forest plot | 8 | 5366 | Risk Ratio (M‐H, Fixed, 95% CI) | 0.98 [0.79, 1.21] |
| Analysis 3.2  Comparison 3 Combined diet and exercise interventions versus standard care: subgroups based on maternal BMI, Outcome 2 Pre‐eclampsia. | ||||
| 2.1 Normal weight women (BMI < 25 kg/m²) | 2 | 243 | Risk Ratio (M‐H, Fixed, 95% CI) | 0.34 [0.10, 1.22] |
| 2.2 Overweight or obese women (BMI ≥ 25kg/m²) | 3 | 2369 | Risk Ratio (M‐H, Fixed, 95% CI) | 1.12 [0.82, 1.54] |
| 2.3 Obese women (BMI ≥ 30kg/m²) | 2 | 1809 | Risk Ratio (M‐H, Fixed, 95% CI) | 0.92 [0.64, 1.32] |
| 2.4 Any women | 3 | 945 | Risk Ratio (M‐H, Fixed, 95% CI) | 0.94 [0.51, 1.73] |
| 3 Pregnancy‐induced hypertension or hypertension Show forest plot | 6 | 3073 | Risk Ratio (M‐H, Random, 95% CI) | 0.71 [0.41, 1.25] |
| Analysis 3.3 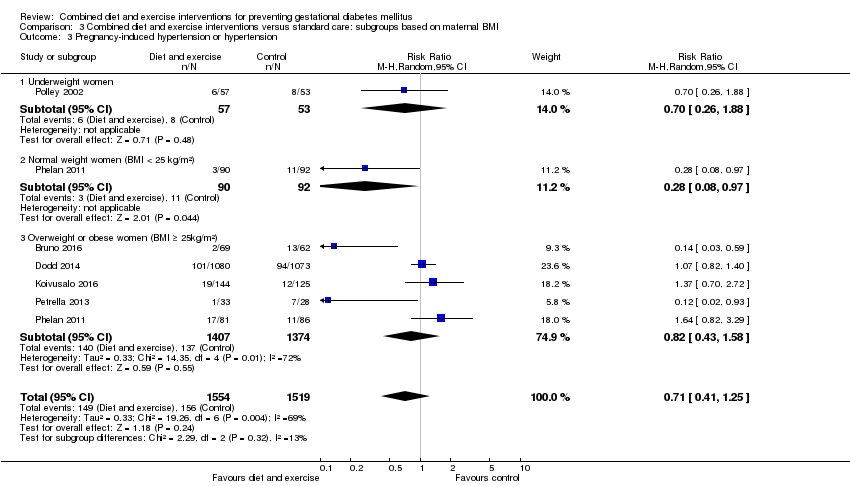 Comparison 3 Combined diet and exercise interventions versus standard care: subgroups based on maternal BMI, Outcome 3 Pregnancy‐induced hypertension or hypertension. | ||||
| 3.1 Underweight women | 1 | 110 | Risk Ratio (M‐H, Random, 95% CI) | 0.70 [0.26, 1.88] |
| 3.2 Normal weight women (BMI < 25 kg/m²) | 1 | 182 | Risk Ratio (M‐H, Random, 95% CI) | 0.28 [0.08, 0.97] |
| 3.3 Overweight or obese women (BMI ≥ 25kg/m²) | 5 | 2781 | Risk Ratio (M‐H, Random, 95% CI) | 0.82 [0.43, 1.58] |
| 4 Caesarean section Show forest plot | 14 | 6089 | Risk Ratio (M‐H, Fixed, 95% CI) | 0.95 [0.88, 1.02] |
| Analysis 3.4 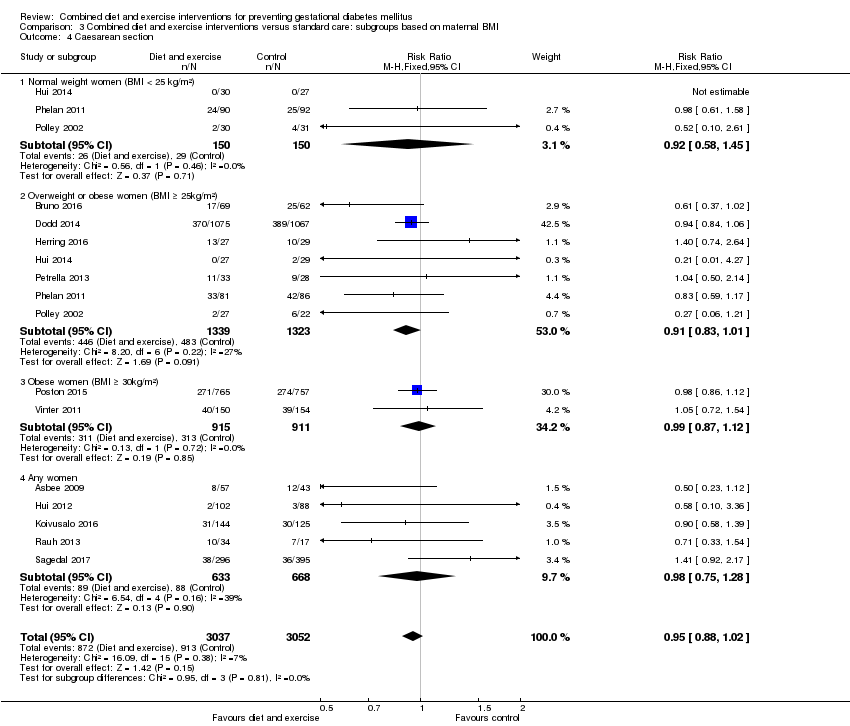 Comparison 3 Combined diet and exercise interventions versus standard care: subgroups based on maternal BMI, Outcome 4 Caesarean section. | ||||
| 4.1 Normal weight women (BMI < 25 kg/m²) | 3 | 300 | Risk Ratio (M‐H, Fixed, 95% CI) | 0.92 [0.58, 1.45] |
| 4.2 Overweight or obese women (BMI ≥ 25kg/m²) | 7 | 2662 | Risk Ratio (M‐H, Fixed, 95% CI) | 0.91 [0.83, 1.01] |
| 4.3 Obese women (BMI ≥ 30kg/m²) | 2 | 1826 | Risk Ratio (M‐H, Fixed, 95% CI) | 0.99 [0.87, 1.12] |
| 4.4 Any women | 5 | 1301 | Risk Ratio (M‐H, Fixed, 95% CI) | 0.98 [0.75, 1.28] |
| 5 Perinatal mortality Show forest plot | 2 | 3757 | Risk Ratio (M‐H, Fixed, 95% CI) | 0.82 [0.42, 1.63] |
| Analysis 3.5  Comparison 3 Combined diet and exercise interventions versus standard care: subgroups based on maternal BMI, Outcome 5 Perinatal mortality. | ||||
| 5.1 Overweight or obese women (BMI ≥ 25kg/m²) | 1 | 2202 | Risk Ratio (M‐H, Fixed, 95% CI) | 0.99 [0.32, 3.07] |
| 5.2 Obese women (BMI ≥ 30 kg/m²) | 1 | 1555 | Risk Ratio (M‐H, Fixed, 95% CI) | 0.74 [0.31, 1.74] |
| 6 Large‐for‐gestational age Show forest plot | 11 | 5353 | Risk Ratio (M‐H, Fixed, 95% CI) | 0.93 [0.81, 1.07] |
| Analysis 3.6  Comparison 3 Combined diet and exercise interventions versus standard care: subgroups based on maternal BMI, Outcome 6 Large‐for‐gestational age. | ||||
| 6.1 Normal weight women (BMI < 25 kg/m²) | 1 | 57 | Risk Ratio (M‐H, Fixed, 95% CI) | 0.6 [0.11, 3.32] |
| 6.2 Overweight or obese women (BMI ≥ 25kg/m²) | 4 | 2385 | Risk Ratio (M‐H, Fixed, 95% CI) | 0.89 [0.76, 1.06] |
| 6.3 Obese women (BMI ≥ 30kg/m²) | 3 | 1986 | Risk Ratio (M‐H, Fixed, 95% CI) | 1.17 [0.89, 1.54] |
| 6.4 Any women | 4 | 925 | Risk Ratio (M‐H, Fixed, 95% CI) | 0.64 [0.40, 1.03] |
| Outcome or subgroup title | No. of studies | No. of participants | Statistical method | Effect size |
| 1 Gestational diabetes Show forest plot | 19 | 6633 | Risk Ratio (M‐H, Random, 95% CI) | 0.85 [0.71, 1.01] |
| Analysis 4.1 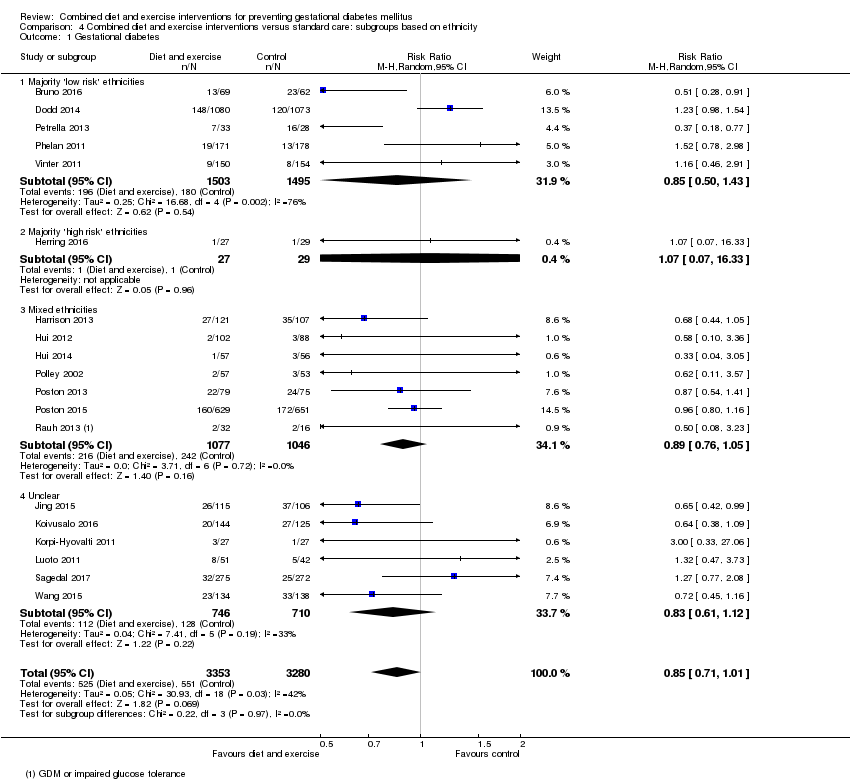 Comparison 4 Combined diet and exercise interventions versus standard care: subgroups based on ethnicity, Outcome 1 Gestational diabetes. | ||||
| 1.1 Majority 'low risk' ethnicities | 5 | 2998 | Risk Ratio (M‐H, Random, 95% CI) | 0.85 [0.50, 1.43] |
| 1.2 Majority 'high risk' ethnicities | 1 | 56 | Risk Ratio (M‐H, Random, 95% CI) | 1.07 [0.07, 16.33] |
| 1.3 Mixed ethnicities | 7 | 2123 | Risk Ratio (M‐H, Random, 95% CI) | 0.89 [0.76, 1.05] |
| 1.4 Unclear | 6 | 1456 | Risk Ratio (M‐H, Random, 95% CI) | 0.83 [0.61, 1.12] |
| 2 Pre‐eclampsia Show forest plot | 8 | 5366 | Risk Ratio (M‐H, Fixed, 95% CI) | 0.98 [0.79, 1.22] |
| Analysis 4.2  Comparison 4 Combined diet and exercise interventions versus standard care: subgroups based on ethnicity, Outcome 2 Pre‐eclampsia. | ||||
| 2.1 Majority 'low risk' ethnicities | 3 | 2806 | Risk Ratio (M‐H, Fixed, 95% CI) | 0.99 [0.76, 1.29] |
| 2.2 Mixed ethnicities | 2 | 1615 | Risk Ratio (M‐H, Fixed, 95% CI) | 0.96 [0.58, 1.58] |
| 2.3 Unclear | 3 | 945 | Risk Ratio (M‐H, Fixed, 95% CI) | 0.94 [0.51, 1.73] |
| 3 Pregnancy‐induced hypertension or hypertension Show forest plot | 6 | 3073 | Risk Ratio (M‐H, Random, 95% CI) | 0.78 [0.47, 1.27] |
| Analysis 4.3  Comparison 4 Combined diet and exercise interventions versus standard care: subgroups based on ethnicity, Outcome 3 Pregnancy‐induced hypertension or hypertension. | ||||
| 3.1 Majority 'low risk' ethnicities | 5 | 2804 | Risk Ratio (M‐H, Random, 95% CI) | 0.64 [0.34, 1.17] |
| 3.2 Unclear | 1 | 269 | Risk Ratio (M‐H, Random, 95% CI) | 1.37 [0.70, 2.72] |
| 4 Caesarean section Show forest plot | 14 | 6089 | Risk Ratio (M‐H, Fixed, 95% CI) | 0.95 [0.88, 1.02] |
| Analysis 4.4 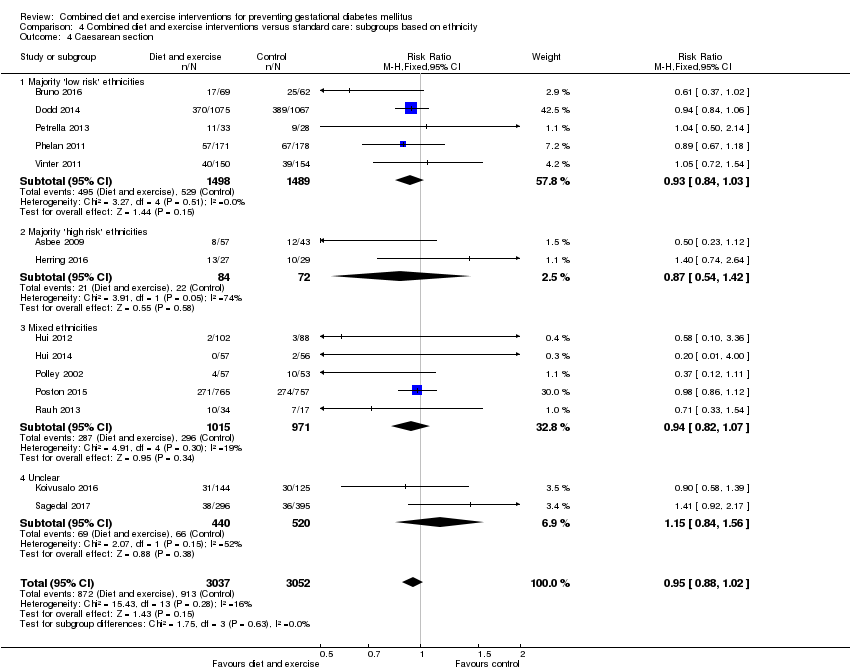 Comparison 4 Combined diet and exercise interventions versus standard care: subgroups based on ethnicity, Outcome 4 Caesarean section. | ||||
| 4.1 Majority 'low risk' ethnicities | 5 | 2987 | Risk Ratio (M‐H, Fixed, 95% CI) | 0.93 [0.84, 1.03] |
| 4.2 Majority 'high risk' ethnicities | 2 | 156 | Risk Ratio (M‐H, Fixed, 95% CI) | 0.87 [0.54, 1.42] |
| 4.3 Mixed ethnicities | 5 | 1986 | Risk Ratio (M‐H, Fixed, 95% CI) | 0.94 [0.82, 1.07] |
| 4.4 Unclear | 2 | 960 | Risk Ratio (M‐H, Fixed, 95% CI) | 1.15 [0.84, 1.56] |
| 5 Perinatal mortality Show forest plot | 2 | 3757 | Risk Ratio (M‐H, Fixed, 95% CI) | 0.82 [0.42, 1.63] |
| Analysis 4.5 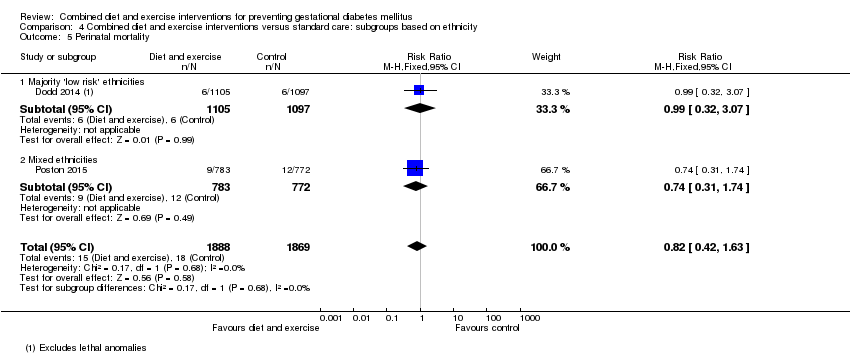 Comparison 4 Combined diet and exercise interventions versus standard care: subgroups based on ethnicity, Outcome 5 Perinatal mortality. | ||||
| 5.1 Majority 'low risk' ethnicities | 1 | 2202 | Risk Ratio (M‐H, Fixed, 95% CI) | 0.99 [0.32, 3.07] |
| 5.2 Mixed ethnicities | 1 | 1555 | Risk Ratio (M‐H, Fixed, 95% CI) | 0.74 [0.31, 1.74] |
| 6 Large‐for‐gestational age Show forest plot | 11 | 5353 | Risk Ratio (M‐H, Fixed, 95% CI) | 0.93 [0.81, 1.07] |
| Analysis 4.6  Comparison 4 Combined diet and exercise interventions versus standard care: subgroups based on ethnicity, Outcome 6 Large‐for‐gestational age. | ||||
| 6.1 Majority 'low risk' ethnicities | 3 | 2577 | Risk Ratio (M‐H, Fixed, 95% CI) | 0.91 [0.77, 1.07] |
| 6.2 Majority 'high risk' ethnicities | 1 | 56 | Risk Ratio (M‐H, Fixed, 95% CI) | 3.21 [0.14, 75.68] |
| 6.3 Mixed ethnicities | 5 | 2036 | Risk Ratio (M‐H, Fixed, 95% CI) | 1.05 [0.80, 1.38] |
| 6.4 Unclear | 2 | 684 | Risk Ratio (M‐H, Fixed, 95% CI) | 0.63 [0.32, 1.23] |
| Outcome or subgroup title | No. of studies | No. of participants | Statistical method | Effect size |
| 1 Gestational diabetes Show forest plot | 11 | 5019 | Risk Ratio (M‐H, Random, 95% CI) | 0.86 [0.68, 1.09] |
| Analysis 5.1 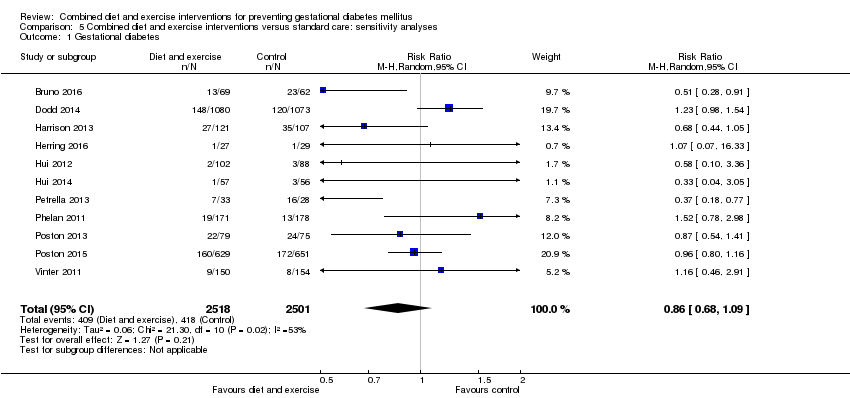 Comparison 5 Combined diet and exercise interventions versus standard care: sensitivity analyses, Outcome 1 Gestational diabetes. | ||||
| 2 Pre‐eclampsia Show forest plot | 4 | 4311 | Risk Ratio (M‐H, Fixed, 95% CI) | 0.99 [0.78, 1.26] |
| Analysis 5.2 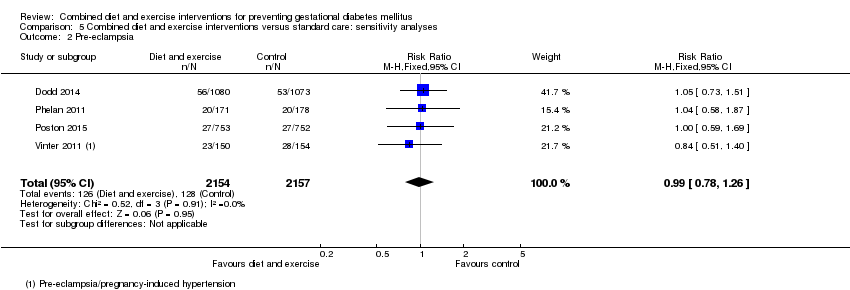 Comparison 5 Combined diet and exercise interventions versus standard care: sensitivity analyses, Outcome 2 Pre‐eclampsia. | ||||
| 3 Pregnancy‐induced hypertension Show forest plot | 4 | 2694 | Risk Ratio (M‐H, Random, 95% CI) | 0.58 [0.27, 1.25] |
| Analysis 5.3  Comparison 5 Combined diet and exercise interventions versus standard care: sensitivity analyses, Outcome 3 Pregnancy‐induced hypertension. | ||||
| 4 Caesarean section Show forest plot | 10 | 4968 | Risk Ratio (M‐H, Fixed, 95% CI) | 0.94 [0.87, 1.02] |
| Analysis 5.4  Comparison 5 Combined diet and exercise interventions versus standard care: sensitivity analyses, Outcome 4 Caesarean section. | ||||
| 5 Perinatal mortality Show forest plot | 2 | 3757 | Risk Ratio (M‐H, Fixed, 95% CI) | 0.82 [0.42, 1.63] |
| Analysis 5.5 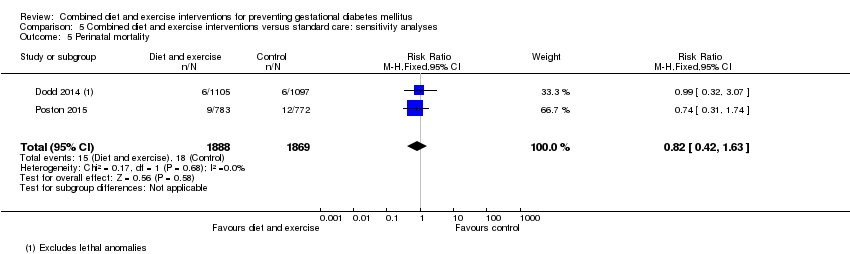 Comparison 5 Combined diet and exercise interventions versus standard care: sensitivity analyses, Outcome 5 Perinatal mortality. | ||||
| 6 Large‐for‐gestational age Show forest plot | 8 | 4618 | Risk Ratio (M‐H, Fixed, 95% CI) | 0.95 [0.83, 1.09] |
| Analysis 5.6  Comparison 5 Combined diet and exercise interventions versus standard care: sensitivity analyses, Outcome 6 Large‐for‐gestational age. | ||||

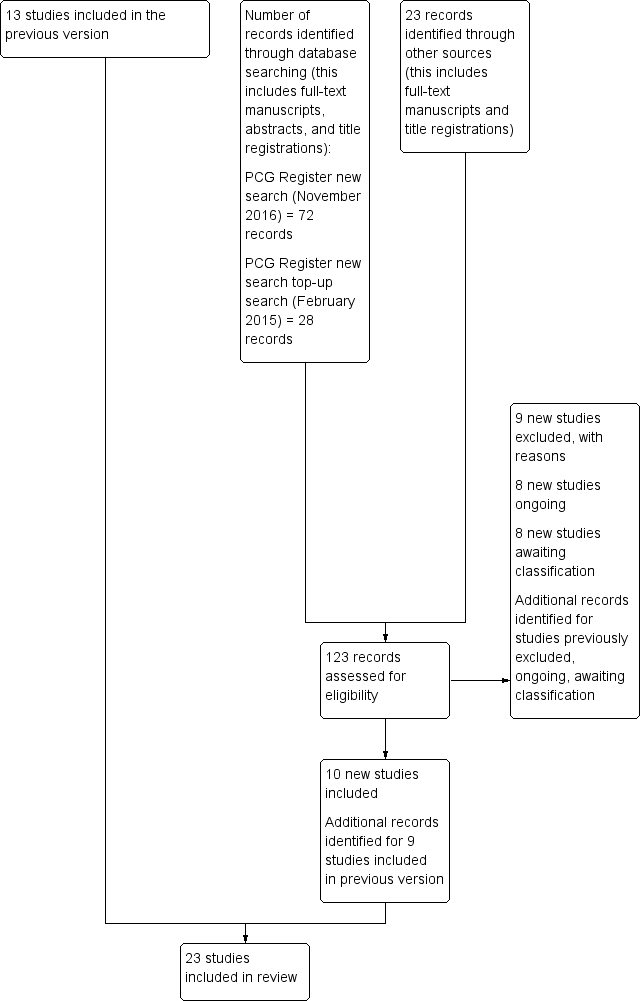
Update study flow diagram.

'Risk of bias' graph: review authors' judgements about each risk of bias item presented as percentages across all included trials.
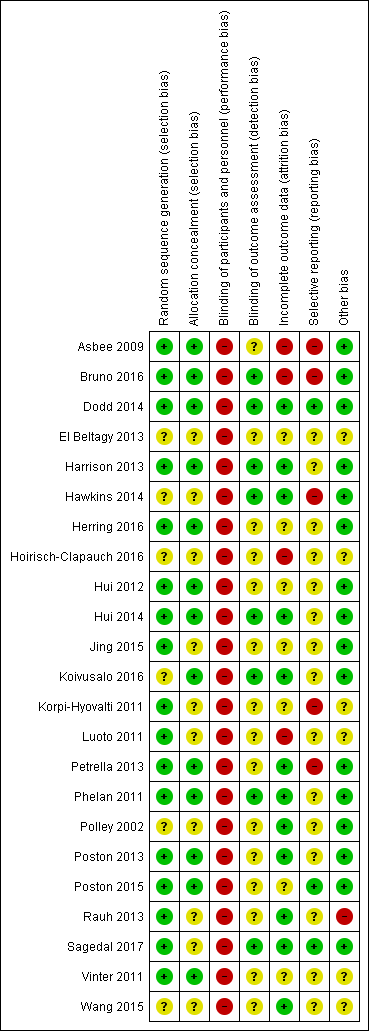
'Risk of bias' summary: review authors' judgements about each risk of bias item for each included trial.

Funnel plot of comparison: 1 Diet and exercise interventions versus control, outcome: 1.1 Gestational diabetes.
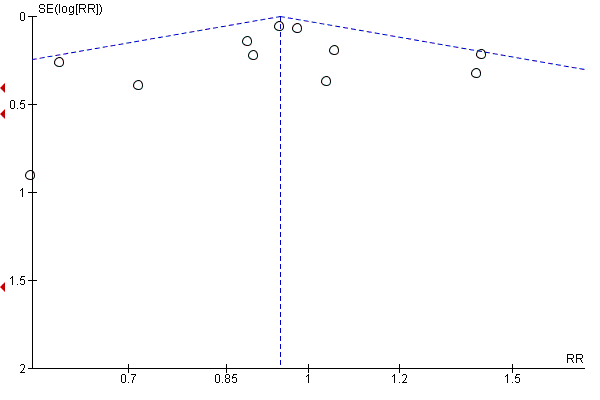
Funnel plot of comparison: 1 Diet and exercise interventions versus control, outcome: 1.4 Caesarean section.
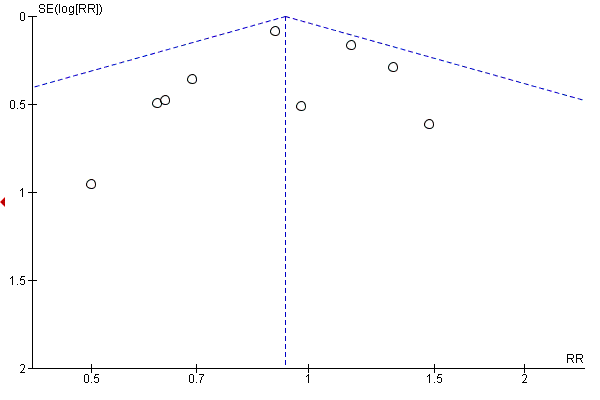
Funnel plot of comparison: 1 Diet and exercise interventions versus control, outcome: 1.6 Large‐for‐gestational age.
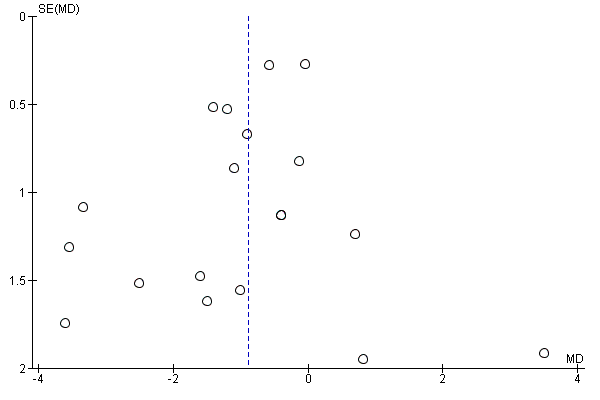
Funnel plot of comparison: 1 Diet and exercise interventions versus control, outcome: 1.13 Gestational weight gain (kg).
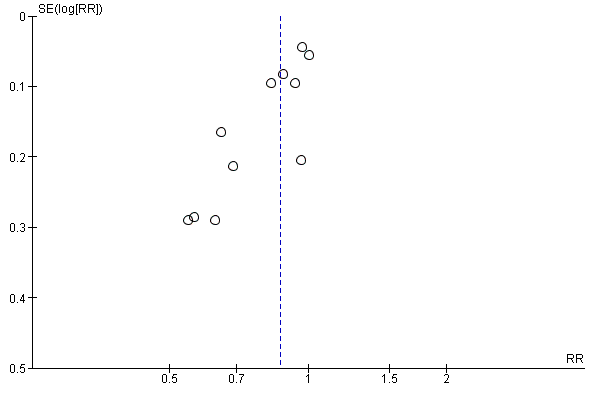
Funnel plot of comparison: 1 Diet and exercise interventions versus control, outcome: 1.16 Gestational weight gain (above IOM recommendations).

Funnel plot of comparison: 1 Diet and exercise interventions versus control, outcome: 1.31 Gestational age at birth (weeks).
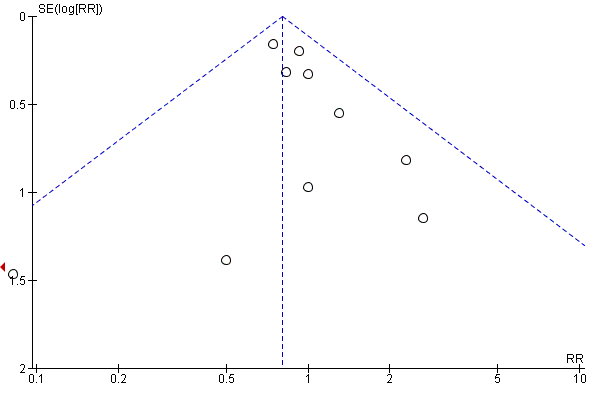
Funnel plot of comparison: 1 Diet and exercise interventions versus control, outcome: 1.33 Preterm birth.

Funnel plot of comparison: 1 Diet and exercise interventions versus control, outcome: 1.35 Macrosomia.

Funnel plot of comparison: 1 Diet and exercise interventions versus control, outcome: 1.37 Birthweight (g).
Comparison 1 Combined diet and exercise interventions versus standard care, Outcome 1 Gestational diabetes.
Comparison 1 Combined diet and exercise interventions versus standard care, Outcome 2 Pre‐eclampsia.
Comparison 1 Combined diet and exercise interventions versus standard care, Outcome 3 Pregnancy‐induced hypertension and/or hypertension.
Comparison 1 Combined diet and exercise interventions versus standard care, Outcome 4 Caesarean section.
Comparison 1 Combined diet and exercise interventions versus standard care, Outcome 5 Perinatal mortality.
Comparison 1 Combined diet and exercise interventions versus standard care, Outcome 6 Large‐for‐gestational age.
Comparison 1 Combined diet and exercise interventions versus standard care, Outcome 7 Operative vaginal birth.
Comparison 1 Combined diet and exercise interventions versus standard care, Outcome 8 Induction of labour.
Comparison 1 Combined diet and exercise interventions versus standard care, Outcome 9 Perineal trauma.
Comparison 1 Combined diet and exercise interventions versus standard care, Outcome 10 Placental abruption.
Comparison 1 Combined diet and exercise interventions versus standard care, Outcome 11 Postpartum haemorrhage.
Comparison 1 Combined diet and exercise interventions versus standard care, Outcome 12 Postpartum infection.
Comparison 1 Combined diet and exercise interventions versus standard care, Outcome 13 Gestational weight gain (kg).
Comparison 1 Combined diet and exercise interventions versus standard care, Outcome 14 Gestational weight gain (various times reported) (kg).
Comparison 1 Combined diet and exercise interventions versus standard care, Outcome 15 Gestational weight gain (kg/week).
Comparison 1 Combined diet and exercise interventions versus standard care, Outcome 16 Gestational weight gain (above IOM recommendations).
Comparison 1 Combined diet and exercise interventions versus standard care, Outcome 17 Gestational weight gain (within IOM recommendations).
Comparison 1 Combined diet and exercise interventions versus standard care, Outcome 18 Gestational weight gain (below IOM recommendations).
| Study | Diet | Exercise | Benefit in favour of intervention | Benefit in favour of control |
| Bruno 2016 | Higher proportion of women in intervention group, compared with the control group, with Food Frequency Questionnaire score ≥ 2 at 36th week (P = 0.028). No clear difference between groups in ≥ 2 servings of vegetables/day (P = 0.400) or ≤ 3 times/week of food rich in saturated fat; higher proportion of women in intervention group, compared with the control group, having ≤ 30 g sugar/day (P = 0.026). | No clear difference between groups in number of steps/day or duration of physical activity in minutes at the 20th week. Women in the intervention group, compared with the control group, were less active at the 36th week (fewer steps/day (P = 0.016) and had a shorter duration of physical activity (P = 0.039)). | Some (diet) | Some (exercise) |
| Dodd 2014 | Macronutrient consumption and food groups Micronutrient consumption Healthy Eating Index (HEI) Glycaemic index and glycaemic load No clear difference between groups (from trial entry to 28 weeks, 36 weeks, 4 months) in glycaemic load (P = 0.15) or glycaemic index (P = 0.10). Changes in diet and knowledge of healthy food choices "women receiving lifestyle advice were more likely to indicate that the approach to participate in the trial prompted changes to... their diet [... p < 0.0001]... Women who received the intervention indicated greater knowledge about healthy food choices [... p < 0.0001]... compared with women who received Standard Care." | Physical activity Women in the intervention group, compared with the control group (from trial entry, to 28 weeks, 36 weeks, 4 months) had an increase in total activity (P = 0.01); and specifically an increase in household activity (P = 0.01). No clear differences between groups for commuting activity (P = 0.55), leisure activity (P = 0.06) or work activity (P = 0.52). Changes in lifestyle and knowledge of healthy exercise during pregnancy "women receiving lifestyle advice were more likely to indicate that the approach to participate in the trial prompted changes to... their lifestyle [...p < 0.0001]. Women who received the intervention indicated greater knowledge about... exercise during pregnancy [... p < 0.0001] compared with women who received Standard Care." | Some (diet and exercise) | No |
| Harrison 2013 | Not reported | The intervention group had higher steps/day at 28 weeks gestation compared with the control group (P < 0.05); no clear difference between groups in MET minutes‐1/day estimated by the The International Physical Activity Questionnaire (P value not reported). No clear difference between groups at 6 weeks postpartum in physical activity (steps/day) (P = 0.6). | Some (exercise) | No |
| Hawkins 2014 | No clear differences between groups in change from baseline to mid‐pregnancy and baseline to postpartum for total caloric intake (P = 0.78; P = 0.44), calories from fat (%) (P = 0.66; P = 0.14), and fibre (g) (P = 0.20; P = 0.23). | No clear differences between groups in change from baseline to mid‐pregnancy and baseline to postpartum for moderate‐intensity (P = 0.17; P = 0.78), moderate and vigorous‐intensity (P = 0.80; P = 0.82), or sports/exercise (P = 0.72; P = 0.63) physical activity; though significant increase in vigorous‐intensity physical activity in the intervention compared with control group (P = 0.04; P = 0.046) (MET hours/week). | No (diet) Some (exercise) | No |
| Hui 2012 | At 2 months after enrolment, the intervention group, compared with the control group, had lower daily intakes of total calories (P = 0.002*), carbohydrate (g) (P = 0.04), fat (g) (P = 0.0001*), saturated fat (g) (P = 0.00004*), cholesterol (mg) (P = P = 0.001*) and fat ratio (%) (P = 0.001*); and higher carbohydrate ratio (%) (P = 0.02) and protein ratio (%) (P = 0.04); no clear differences between groups for intakes of protein (g) (P = 0.11), and fibre (g) (P = 0.63). At 2 months after enrolment, the intervention group, compared with the control group, had lower daily servings of medium‐fat meat (P = 0.01), 1‐2% fat milk (P = 0.02) and oil and fats (P = 0.02), and higher daily servings of skim milk (P = 0.02); no clear differences between groups for starch (P = 0.66), very lean meat (P = 0.66), lean meat (P = 0.17), high‐fat meat (P = 0.50), vegetables (P = 0.43), fruits (P = 0.39), or whole fat milk (P = 0.15). *P values with statistical significance after Bonferroni | At 2 months after enrolment, the physical activity index was higher in the intervention group compared with the control group (P = 0.00002). | Some (diet) Yes (exercise) | No |
| Hui 2014 | Pre‐pregnancy BMI < 25 At 2 months after the onset of the intervention, women in the intervention group compared with the control group had lower intakes of total calorie (P = 0.01), carbohydrate (g) (P = 0.03), total fat (g) (P = 0.008), saturated fat (g) (P = 0.008), and cholesterol (mg) (P = 0.02); no clear difference between groups for intake of protein (g) (P = 0.36). Pre‐pregnancy BMI ≥ 25 At 2 months after the onset of the intervention, women in the intervention group compared with the control group had lower intakes of total calorie (P = 0.05), total fat (g) (P = 0.02), saturated fat (g) (P = 0.01), and cholesterol (mg) (P = 0.03); no clear differences between groups for intakes of carbohydrate (g) (P = 0.44) or protein (g) (P = 0.17). | Pre‐pregnancy BMI < 25 At 2 months after the onset of the intervention, women in the intervention group compared with the control group had higher physical activity index (units) (P < 0.01). Pre‐pregnancy BMI ≥ 25 At 2 months after the onset of the intervention, no clear difference between groups for physical activity index (units) (P value not reported) | Some (diet and exercise) | No |
| Jing 2015 | No clear differences between groups at 20‐24 weeks gestation for intake of carbohydrate (g) (P = 0.058), fat (g) (P = 0.216), meat (g) (P = 0.235), vegetables (g) (P = 0.637), eggs (g) (P = 0.962), milk (g) (P = 0.060), beans (g) (P = 0.982). Higher intake of energy (kcal) (P = 0.024), protein (g) (P = 0.003), grain (g) (P = 0.013), fruit (g) (P = 0.048), seafood (P = 0.031), and nuts (P = 0.036) for women in intervention group compared with control group. | No clear difference between groups at 20‐24 weeks for time spent (hours/day) doing moderate activity (P = 0.824) [and no clear difference between groups for time spent (hours/day) on intensities A, B, C, E, F, G, H]. Less time spent resting (P = 0.033) and more time doing mild activity (P = 0.016) among women in the intervention group compared with control group [and more time spent (hours/day) on intensity D]. | Some (diet and exercise) | No |
| Koivusalo 2016 | The dietary index score improved more among women in the intervention group, compared with the control group (P = 0.16 unadjusted, P = 0.037 adjusted). No clear differences between groups in changes in food intake from the first to second trimester for low‐fat milk (times/day) (P = 0.726), whole‐grain cereal (times/day) (P = 0.182), fruits and berries (times/day) (P = 0.865), vegetables and legumes (times/day) (P = 0.419), animal protein (times/day) (P = 0.658), snacks (times/week) (P = 0.112), sugar sweetened beverages (times/week) (P = 0.750), fast food (times/week) (P = 0.731), spread fat (score) (P = 0.103), cooking fat (score) (P = 0.937). Intakes of low‐fat cheese (P = 0.040) and fish (P = 0.011) increased in the intervention group compared with the control group. | Women in the intervention group increased their median weekly leisure time physical activity while the physical activities of women in the control group remained unchanged (P = 0.17 unadjusted, P = 0.029 adjusted). No clear difference between groups in proportion of women meeting the physical activity goal (150 minutes/week in the second trimester). | Some (diet and exercise) | No |
| Luoto 2011 | Dietary changes Compared with the control group, from baseline to 26‐28 weeks, the intervention group reduced their intake of saccharose (E%) (P = 0.04), and saturated fatty acids (E%) (P = 0.005); no clear differences between groups seen for intakes of total energy (MJ/day) (P = 0.97), total energy (kcal/day) (P = 0.97), protein (E%) (P = 0.094), carbohydrates (E%) (P = 0.76), dietary fibre (g/day) (P = 0.44), total fat (E%) (P = 0.15), trans fatty acids (E%) (P = 0.65), mono saturated fatty acids (E%) (P = 0.99), or polyunsaturated fatty acids (E%) (P = 0.21). Compared with the control group, from baseline to 36‐37 weeks, the intervention group reduced their intake of saccharose (E%) (P = 0.023) and saturated fatty acids (E%) (P = 0.01) and increased their intake of dietary fibre (g/day) (P = 0.019) and polyunsaturated fatty acids (E%) (P < 0.001); no clear differences between groups seen for intakes of total energy (MJ/day) (P = 0.90), total energy (kcal/day) (P = 0.90), protein (E%) (P = 0.29), carbohydrates (E%) (P = 0.60), total fat (E%) (P = 0.86), trans fatty acids (E%) (P = 0.30), or mono saturated fatty acids (E%) (P = 0.51). Food habits related to the objectives of dietary counselling From baseline to 26‐28 weeks, the intervention group, compared with the control group, increased their proportion of high‐fibre bread (% of all bread) (P = 0.001) and vegetable fats (% of all dietary fat) (P = 0.001), while the control group decreased their proportion of low‐fat cheeses (% of all cheese) (P = 0.001), and increased intake of snacks high in sugar and/or fat (g/day) (P = 0.022); no clear differences between groups in intake of vegetables, fruits and berries (g/day) (P = 0.117), fat‐free or low‐fat milk (% of all milk) (P = 0.093), frequency of eating fish (per week) (P = 0.120), or high‐fat foods (g/day) (0.664). From baseline to 36‐37 weeks, the intervention group, compared with the control group, increased their intake of vegetables, fruits and berries (g/day) (P = 0.001), proportion of high‐fibre bread (% of all bread) (P = 0.003) and vegetable fats (% of all dietary fat) (P = 0.003), while the control group decreased their proportion of low‐fat cheeses (% of all cheese) (P = 0.009); no clear differences between groups in proportion of fat‐free or low‐fat milk (% of all milk) (P = 0.630), frequency of eating fish (per week) (P = 0.068), intake of high‐fat foods (g/day) (0.108), or snacks high in sugar and/or fat (g/day) (P = 0.551). Consumption of the main food groups and foods From baseline to 26‐28 weeks gestation, the intervention group, compared with the control group, increased total intake of milk (P = 0.025), fish (P = 0.041), vegetable oils (P = 0.002) and oil based salad dressings (P = 0.002); while the control group, compared with the intervention group, increased consumption of porridge and breakfast cereals (P = 0.003) and candies and chocolates (P = 0.008) (all g/day); no clear differences between groups for intake of fruits and berries (P = 0.575), cooked potato or in dishes (P = 0.686), french fries, chips and other fatty potato products (P = 0.995), total bread (P = 0.459), rice and pasta (P = 0.118), total cheese (P = 0.318), red meat and game (P = 0.851), poultry (P = 0.252), sausages (P = 0.896), vegetable spreads (P = 0.071), butter and butter mixtures (P = 0.128), solid baking margarines (P = 0.194), sweet pastries and other sugary food items (P = 0.055), pizza and hamburgers (P = 0.703), tea (P = 0.464), coffee (P = 0.976), sugary soft drinks (P = 0.088) or juice (P = 0.096) (all g/day). From baseline to 36‐37 weeks gestation, the intervention group, compared with the control group, increased total intake of fish (P = 0.044), vegetable oils (P = 0.002) and oil based salad dressings (P = 0.010); while the control group, compared with the intervention group, decreased consumption of vegetables (P = 0.005); no clear differences between groups for intake of fruits and berries (P = 0.134), cooked potato or in dishes (P = 0.157), french fries, chips and other fatty potato products (P = 0.388), total bread (P = 0.175), porridge and breakfast cereals (P = 0.811), rice and pasta (P = 0.187), total milk (P = 0.878), total cheese (P = 0.364), red meat and game (P = 0.806), poultry (P = 0.482), sausages (P = 0.444), vegetable spreads (P = 0.215), butter and butter mixtures (P = 0.417), solid baking margarines (P = 0.208), candies and chocolates (P = 0.133), sweet pastries and other sugary food items (P = 0.104), pizza and hamburgers (P = 0.755), tea (P = 0.235), coffee (P = 0.481), sugary soft drinks (P = 0.730) or juice (P = 0.094) (all g/day). | Physical activity changes No clear differences between baseline to 26‐28 weeks or baseline to 36‐37 weeks for total MET minutes/week (P = 0.36; P = 0.63), MET minutes/week for at least moderate activity (P = 0.17; P = 0.82), MET minutes/week for light activity (P = 0.57; P = 0.17), or ≥ 800 MET minutes/week (%) (P = 0.27; P = 0.51). At 26‐28 weeks, the decreases in total leisure‐time physical activity (LTPA) (days/week) and moderate‐to‐vigorous LTPA (days/week) were smaller in the intervention group compared with the control group (P = 0.040; P = 0.016); though no clear differences between group/days in total LTPA (minutes/week) (P = 0.58), moderate‐to‐vigorous LTPA (minutes/week) (P = 0.11), light LTPA (days/week) (P = 0.80), light LTPA (minutes/week) (P = 0.65), or meeting physical activity recommendations for health (%) (P = 0.060) were observed. No clear differences between groups from baseline to 36‐37 weeks in total LTPA (days/week: P = 0.80; minutes/week: P = 0.60), moderate‐to‐vigorous LTPA (days/week: P = 0.16; minutes/week: P = 0.96), or light LTPA (days/week: P = 0.21; minutes/week: P = 0.75), or meeting physical activity recommendations for health (%: P = 0.70). "From 26‐28 weeks’ gestation to 36‐37 weeks’ gestation the number of weekly days with light‐intensity LTPA decreased significantly less in INT than in UC (0.1 vs. 0.6 days, p = 0.05, not shown in Table 4)." | Some (diet and exercise) | No |
| Petrella 2013 | "Significant changes in eating habits occurred in the Therapeutic Lifestyle Changes group, increasing the number of snacks/day, the consumption of vegetables and fruits. Moreover, intervention also decreased the consumption of sugar. No differences in the number of daily spoons of oil, red meat and complex carbohydrates intake were found." | "The step numbers for each walking session was constant during pregnancy (3267 ± 1683 at 36th week and 3755 ± 1816 at 28th week)." | Not applicable (only reported for intervention group) | Not applicable (only reported for intervention group) |
| Phelan 2011 | "No significant treatment... interaction effects over time were observed... for dietary factors." Repeated‐measures ANOVA of time (early pregnancy, late pregnancy, 6 months postpartum, 12 months postpartum) x treatment group interactions for dietary changes in calorie intake, percentage of calories from fat, percentage of calories from carbohydrate, percentage of calories from protein, percentage of calories from sweets, daily calories from soft drinks, daily saturated fat (g), daily servings of vegetables, daily servings of fruit and fruit juices, daily servings of bread, cereals, rice, pasta, daily servings of milk, yogurt, cheese, daily frequency of fats and oils, sweets, sodas, weekly fast food, daily iron from food (mg), daily calcium from food (mg), total daily dietary fibre (g), daily vitamin D from food (IU), daily folate from food (μg): P values all "NS." | "A trend was observed for an effect of the intervention on physical activity... which suggested a small intervention‐related increase in calories expended in physical activity during the postpartum period." Repeated‐measures ANOVA of time (early pregnancy, late pregnancy, 6 months postpartum, 12 months postpartum) x treatment group interaction for kcal (F = 2.5, P = 0.06, hp2 = 0.02). | No (diet) Yes (exercise) | No |
| Polley 2002 | "All groups decreased their fat consumption from these foods from baseline to 30 weeks, except normal‐weight women in the control condition. There was no effect of treatment on changes in fat intake from these foods from recruitment to 30 weeks (P>0.2)." | "Changes in exercise level from recruitment to 30 weeks (P>0.8) were not related to treatment condition." | No | No |
| Poston 2013 | At 28 weeks gestation, the intervention group had lower intakes of total energy (MJ/day) (P = 0.016), dietary glycaemic load (g/day) (P = < 0.001), glycaemic load (%E) (P = 0.013), total fat (%E) (P = 0.010) and saturated fatty acids (%E) (P = 0.015), and higher protein (%E) (P = 0.034), and fibre (non‐starch polysaccharides) (g) (P = 0.040) compared with the control group; no clear differences between groups for dietary glycaemic index (%) (P = 0.054), carbohydrate (%E) (P = 0.207), protein (g) (P = 0.204), monounsaturated fatty acids (%E) (P = 0.088), polyunsaturated fatty acids (%E) (P = 0.075), or polyunsaturated fatty acid, saturated fatty acid ratio (P = 0.075). "A principal component analysis (PCA) of Food Frequency Questionnaire (FFQ) data from the UPBEAT pilot study database was performed to derive three diet patterns: two with high coefficients for high‐sugar and/or highfat food groups defined as ‘Western’ and ‘Healthy‐unhealthy choices’ and a ‘traditional’ African or African‐Caribbean diet pattern…. The ‘Western’ and ‘Healthy‐unhealthy choices’ patterns scores were reduced in those who received the intervention." | At 28 weeks gestation, no clear differences between groups for physical activity, as measured by accelerometer (minutes/day of sedentary, active, light, moderate to vigorous activity) (P values not reported; mean differences with 95% confidence intervals indicate no clear differences), and Recent Physical Activity Questionnaire (minutes/day of sedentary, activity, light activity); self‐reported moderate to vigorous activity (minutes/day) was higher in the intervention group compared with the control group (P value not reported; mean difference with 95% confidence interval indicates difference), and women in the intervention group self‐reported walking (minutes/day) for leisure more than those in the control group (P = 0.003). | Some (diet and exercise) | No |
| Poston 2015 | At 27‐28 weeks and 6 days, women in the intervention group, compared with the control group, had lower mean total energy (MJ/day) (P < 0.0001), glycaemic index (0‐100) (P < 0.0001), glycaemic load per day (P < 0.0001), and intake carbohydrate (% energy) (P = 0.0011), total fat (% energy) (P = 0.0011), saturated fat (g/day) (P < 0.0001) and saturated fat (% energy) (P < 0.0001); and higher intake of protein (% energy) (P < 0.0001), and fibre (g/day) (P = 0.013). At 6 months postpartum, women in the intervention group, compared with the control group, had lower glycaemic load per day (P < 0.001), glycaemic index (0‐100) (P < 0.001), intakes of total energy (kcal per day) (P < 0.001), saturated fat (% energy) (P < 0.001), and total fat (% energy) (P < 0.001), and higher intake of protein (% energy) (P < 0.001); no clear differences between groups for intakes of carbohydrates (% energy) (P = 0.835) and fibre (g/day) (P = 0.873). | At 27‐28 weeks and 6 days, women in the intervention group, compared with the control group, were more physically active: MET (minutes/week) (P = 0.0015); attributed to more time spent walking (minutes/week) (P = 0.0018), with no clear difference seen between groups for moderate or vigorous activity (minutes/week) (P > 0.99). At 6 months postpartum, no clear differences between groups for measures of physical activity: MET (minutes/week) (P = 0.607), moderate or vigorous activity (minutes/week) (P = 0.681), or walking (minutes/week) (P = 1.00). | Some (diet and exercise) | No |
| Rauh 2013 | The intervention group had a lower change from baseline to 36‐38th week gestation energy intake compared with the control group (kcal/day) (P = 0.035). | No clear difference between groups in change from baseline to 36‐38th week gestation total activity (MET‐min/week) (P = 0.425). | Yes (diet) No (exercise) | No |
| Sagedal 2017 | At 36 weeks gestation the intervention group had a higher (more favourable) diet score compared with the control group (P = 0.013); dietary differences favouring the intervention group were identified in 7 domains: ‘drinking water when thirsty’ (P = 0.002), ‘vegetables with dinner’ (P = 0.027), ‘fruits and vegetables for between‐meal snacks’ (P = 0.023), ‘package size of unhealthy foods’ (P = 0.010), ‘added sugar' (P = 0.005), ‘eating beyond satiety’ (P = 0.009) and ‘food labels’ (P = 0.011); no clear differences between groups for 'meal regularity' (P = 0.176), 'eating sweets or snacks without appreciation' (P = 0.446), 'added salt' (P = 0.680). | At 36 weeks gestation the intervention group compared with the control group had higher weekly energy expenditure (MET‐minutes/week) (P = 0.009), and according to the International Physical Activity Questionnaire, fewer had 'low activity', and more had 'moderate activity' and 'high activity' (P = 0.013). | Some (diet) Yes (exercise) | No |
| Vinter 2011 | "When asked at 35 weeks’ gestation whether participation in the LiP study had resulted in more healthy eating habits, 85% of women in the intervention group responded affirmatively. In addition, 21% of women in the control group thought that their dietary habits in pregnancy were positively influenced by their participation." At 35 weeks' gestation, women in the intervention group had higher self‐reported physical activity levels compared with those in the control group (physical activity ≥ 2 hours/week (P = 0.001); physical activity making them sweaty or short of breath ≥ 2 hours/week (P < 0.001)); no clear differences between groups at 6 months postpartum (physical activity ≥ 2 hours/week (P = 0.620); physical activity making them sweaty or short of breath ≥ 2 hours/week (P = 0.961)). | "Among women in the intervention group, 77.5% undertook leisure time sporting activities in addition to the aerobic classes. In addition, 65% of women in the control group engaged in some type of leisure time sporting activities during pregnancy (P = 0.016)." At 35 weeks' gestation, women in the intervention group had improved eating habits compared with those in the control group (considered themselves as in the most healthy eating habit groups (P = 0.003)); no clear differences between groups at 6 months postpartum (considered themselves as in the most healthy eating habit groups (P = 0.609)). | Some (diet and exercise) | No |
Comparison 1 Combined diet and exercise interventions versus standard care, Outcome 19 Behaviour changes associated with the intervention.
| Study | Results | Benefit in favour of intervention | Benefit in favour of control |
| Hawkins 2014 | No clear differences between groups in change in biomarkers of insulin resistance from baseline to mid‐pregnancy: glucose (mmol/L) (P = 0.63); insulin (pmol/L) (P = 0.39); leptin (pmol/L) (P = 0.73); adiponectin (nmol/L) (P = 0.51); resistin (nmol/L) (P = 0.19); tumour necrosis factor‐alpha (pmol/L) (P = 0.11); c‐reactive protein (nmol/L) (P = 0.19). | No | No |
| Koivusalo 2016 | Women in the intervention group compared with the control group had a greater change (reduction) in fasting plasma glucose from baseline to the third trimester (P = 0.026 unadjusted; P = 0.011 adjusted). No clear difference between groups in change (increase) in 2‐hour glucose from baseline to second trimester (P = 0.92 unadjusted, P = 0.42 adjusted). | Some | No |
| Korpi‐Hyovalti 2011 | No clear difference between groups in fasting glucose (mmol/L), OGTT 1‐hour glucose (mmol/L), OGTT 2‐hour glucose (mmol/L), or area under the curve (mmol/L/2 hour) (all reported to be P = NS) at weeks 26‐28. | No | No |
| Luoto 2011 | There were no clear differences between groups in glucose intolerance measurements at 26‐28 weeks (glucose concentrations in 2‐hour OGTT (mg/L): fasting (P = 0.44), 1‐hour (P = 0.23), 2‐hour (P = 0.99); insulin (P = 0.10), or HOMA‐IR (P = 0.13)); or in the change from baseline (8‐12 weeks) to 26‐28 week values for insulin (P = 0.23), or HOMA‐IR (P = 0.24). | No | No |
| Poston 2015 | At 27‐28 weeks and 6 days gestation, no clear differences between groups in fasting blood glucose (mmol/L) (P = 0.49), 1‐hour blood glucose (mmol/L) (P = 0.43), 2‐hour blood glucose (mmol/L) (P = 0.81), plasma fasting insulin (mU/L) (P = 0.57), HOMA‐IR (units) (P = 0.60), plasma triglycerides (mmol/L) (P = 0.39), plasma LDL cholesterol (mmol/L) (P = 0.27), plasma HDL cholesterol (mmol/L) (0.93), plasma VLDL (mmol/L) (P = 0.39). | No | No |
| Vinter 2011 | Glucose metabolism and insulin sensitivity No clear differences between groups in fasting plasma glucose (mmol/L) at 28‐30 weeks (P = 0.060) or 34‐36 weeks (P = 0.431). No clear differences between groups in 2‐hour oral glucose tolerance test (mmol/L) at 28‐30 weeks (P = 0.459) or 34‐36 weeks (P = 0.723). No clear differences between groups in fasting insulin (mU/L) at 34‐36 weeks (P = 0.065) or change from baseline to 34‐36 weeks fasting insulin (P = 0.063); women in the intervention group had lower fasting insulin at 28‐30 weeks (P = 0.040), and lower change from baseline to 28‐30 weeks fasting insulin (P = 0.015). No clear differences between groups in HOMA‐IR at 34‐36 weeks (P = 0.062) or change from baseline to 34‐36 weeks fasting insulin (P = 0.079); women in the intervention group had lower fasting insulin at 28‐30 weeks (P = 0.032), and lower change from baseline to 28‐30 weeks fasting insulin (P = 0.022). No clear differences between groups at 28‐30 weeks or 34‐36 weeks for fasting cholesterol (mmol/L) (P = 0.332; P = 0.484), fasting HDL (mmol/L) (P = 0.781; P = 0.871), fasting LDL (mmol/L) (P = 0.148; P = 0.183), or fasting triglycerides (mmol/L) (P = 0.385; P = 0.399). | Some | No |
Comparison 1 Combined diet and exercise interventions versus standard care, Outcome 20 Relevant biomarker changes associated with the intervention.
| Study | Results | Benefits in favour of intervention | Benefits in favour of control |
| Dodd 2014 | There were no clear differences between groups (from trial entry, to 28 weeks, 36 weeks and 4 months postpartum) in mean depressive scores (Edinburgh Postnatal Depression Scale (EPDS) mean scores) (adjusted P = 0.25), risk of depression (EPDS score > 12, %) (adjusted P = 0.95), symptoms of anxiety (Spielberger State‐Trait Anxiety Inventory (STAI) mean scores) (adjusted P = 0.51), or risk of high level anxiety (STAI score ≥ 15, %) (adjusted P = 0.31). There were no clear differences between groups for any of the domains assessing health related quality of life (from trial entry, to 28 weeks, 36 weeks and 4 months postpartum) (mean scores: physical functioning adjusted P = 0.53; physical role adjusted P = 0.59; bodily pain adjusted P = 0.27; general health adjusted P = 1.00; vitality adjusted P = 0.48; social functioning adjusted P = 0.52; emotional role adjusted P > 0.11; mental health adjusted P = 0.07; physical component adjusted P = 0.47; mental component adjusted P = 0.36). For emotional role and mental health domains there were significant interactions between treatment group and time point (P = 0.03; P = 0.007); although there were no significant differences between treatment groups at any individual time point, the pattern of change over pregnancy differed according to treatment group. "All women reported a high degree of satisfaction with their pregnancy... p = 0.8722... and with birth... p = 0.9235... Most women agreed or strongly agreed that they felt in control during their pregnancy... p = 0.9945... and birth... p = 0.4510... and they liked their care providers... p = 0.1530... There were no differences with regard to the proportion of women who felt healthy during pregnancy... p = 0.3517... women who received the intervention were more likely to feel reassured about their own health... p = 0.0112... and that of their baby... p = 0.0143... In the postpartum period, most women felt healthy... p = 0.5942... and were not concerned about their future health... p = 0.9444... or the future health of their baby or child... p = 0.9467" | Some (reassurance about own health and health of baby) | No |
| Luoto 2011 | No clear difference between groups from 8‐13 weeks to 36‐37 weeks in change in health related quality of life (15D questionnaire) (P = 0.24), or perceived health (VAS scale of 0–10 cm) (P = 0.061). | No | No |
| Phelan 2011 | "The intervention group... had a significantly greater increase in scores on the Edinburgh Depression Scale during the postpartum period than did the standard‐care group (F = 23.2, P = 0.0001, hp2 = 0.094); however, multiple logistic regression analyses indicated no significant effects of the intervention compared with standard care on the prevalence of depression (defined as a score ≥13) at 30 wk of gestation (6.4% compared with 7.2%, respectively), 6 mo (3.4% compared with 3.6%, respectively), or 12 mo (5.2% compared with 6.3%, respectively) postpartum. Both groups reported very low depression scores overall... No significant treatment... interaction effects over time were observed for dietary disinhibition, stress or sleep." Repeated‐measures ANOVA of time (early pregnancy, late pregnancy, 6 months postpartum, 12 months postpartum) x treatment group interactions for disinhibition, stress, and sleep score: P values all reported to be "NS." | No | Some (Edinburgh Depression Scale scores) |
| Poston 2013 | At 28 weeks gestation, there was no clear difference between groups in the numbers of women reporting problems in each of the EuroQol quality of life (EQ‐5D) questionnaire domains: mobility, self‐care, usual activities, pain and discomfort, anxiety and depression; or in the time trade‐off health state rating and visual analogue scale of health related quality of life (0 to 100) (P values not reported, however treatment effects indicate no clear differences). At 28 weeks gestation there were also no clear differences between groups in Edinburgh Postnatal Depression Score total, total score > 9, and total score > 12 (P values not reported, however treatment effects indicate no clear differences). | No | No |
Comparison 1 Combined diet and exercise interventions versus standard care, Outcome 21 Sense of well‐being and quality of life.
Comparison 1 Combined diet and exercise interventions versus standard care, Outcome 22 Breastfeeding (exclusive).
Comparison 1 Combined diet and exercise interventions versus standard care, Outcome 23 Breastfeeding (partial).
| Study | Diet and exercise | Control | P value |
| Rauh 2013 | Mean (SD not reported) (N = 148, unadjusted) Exclusive breastfeeding duration (days): 130.7 Total breastfeeding duration (days): 232.1 | Mean (SD not reported) (N = 65, unadjusted) Exclusive breastfeeding duration (days): 116.3 Total breastfeeding duration (days): 219.4 | P = 0.180 P = 0.465 |
Comparison 1 Combined diet and exercise interventions versus standard care, Outcome 24 Breastfeeding.
Comparison 1 Combined diet and exercise interventions versus standard care, Outcome 25 Postnatal weight retention (latest time reported) (kg).
Comparison 1 Combined diet and exercise interventions versus standard care, Outcome 26 Return to pre‐pregnancy weight (latest time reported).
Comparison 1 Combined diet and exercise interventions versus standard care, Outcome 27 Postnatal BMI (latest time reported).
| Study | Intervention | Control | P value |
| Vinter 2011 | 6 months postpartum (median (IQR)) (N = 123) Systolic blood pressure (mm Hg): 122 (116–129) Diastolic blood pressure (mm Hg): 83.5 (78–88) | 6 months postpartum (median (IQR)) (N = 115) Systolic blood pressure (mm Hg): 122 (115–128) Diastolic blood pressure (mm Hg): 82 (78–88) | 0.770 0.733 |
Comparison 1 Combined diet and exercise interventions versus standard care, Outcome 28 Maternal cardiovascular health (latest time reported).
Comparison 1 Combined diet and exercise interventions versus standard care, Outcome 29 Stillbirth.
Comparison 1 Combined diet and exercise interventions versus standard care, Outcome 30 Neonatal mortality.
Comparison 1 Combined diet and exercise interventions versus standard care, Outcome 31 Gestational age at birth (weeks).
| Study | Intervention group | Control group | P value |
| Polley 2002 | Mean (SD not reported) Normal weight women (N = 30) 39.1 weeks Overweight women (N = 27) 39.4 weeks | Mean (SD not reported) Normal weight women (N = 31) 39.5 weeks Overweight women (N = 22) 39.1 weeks | Not reported |
| Vinter 2011 | Median (IQR) (N = 150) 283 days (273‐290) | Median (IQR) (n = 154) 283 days (274‐289) | 0.952 |
Comparison 1 Combined diet and exercise interventions versus standard care, Outcome 32 Gestational age at birth (days or weeks).
Comparison 1 Combined diet and exercise interventions versus standard care, Outcome 33 Preterm birth.
Comparison 1 Combined diet and exercise interventions versus standard care, Outcome 34 Apgar score less than seven at five minutes.
Comparison 1 Combined diet and exercise interventions versus standard care, Outcome 35 Macrosomia.
Comparison 1 Combined diet and exercise interventions versus standard care, Outcome 36 Small‐for‐gestational age.
Comparison 1 Combined diet and exercise interventions versus standard care, Outcome 37 Birthweight (g).
| Study | Intervention group | Control group | P value |
| Herring 2016 | Mean (SD not reported) (N = 27) 3147 | Mean (SD not reported) (N = 29) 3361 | Mean difference: ‐213 (95% CI: ‐431 to 3.7) |
| Polley 2002 | Mean (SD not reported) Born to normal weight women (N = 30) 3133.0 Born to overweight women (N = 27) 3282.8 | Mean (SD not reported) Born to normal weight women (N = 31) 3226.4 Born to overweight women (N = 22) 3349.0 | Not reported |
| Vinter 2011 | Median (IQR) (N = 150) 3742 (3464‐4070) | Median (IQR) (N = 154) 3593 (3335‐3930) | 0.039 |
Comparison 1 Combined diet and exercise interventions versus standard care, Outcome 38 Birthweight (g).
Comparison 1 Combined diet and exercise interventions versus standard care, Outcome 39 Birthweight z score.
Comparison 1 Combined diet and exercise interventions versus standard care, Outcome 40 Head circumference (cm).
Comparison 1 Combined diet and exercise interventions versus standard care, Outcome 41 Head circumference z score.
Comparison 1 Combined diet and exercise interventions versus standard care, Outcome 42 Length (cm).
Comparison 1 Combined diet and exercise interventions versus standard care, Outcome 43 Length z score.
Comparison 1 Combined diet and exercise interventions versus standard care, Outcome 44 Ponderal index (kg/m3).
Comparison 1 Combined diet and exercise interventions versus standard care, Outcome 45 Adiposity (sum of skinfold thickness) (mm).
Comparison 1 Combined diet and exercise interventions versus standard care, Outcome 46 Adiposity (abdominal circumference) (cm).
| Study | Intervention | Control | P value |
| Dodd 2014 | Neonatal anthropometric measures Mean (SD) (N = 488) Chest circumference Arm circumference Biceps SFTM (mm): 4.37 (1.12) Triceps SFTM (mm): 5.45 (1.30) Subscapular SFTM (mm): 5.15 (1.30) Suprailiac SFTM (mm): 5.76 (1.83) Abdominal SFTM (mm): 3.85 (1.02) Thigh SFTM (mm): 6.99 (1.85) Abdominal circumference to length ratio: 0.65 (0.04) Fat mass (g): 522.72 (180.70) Fat‐free mass (g): 3026.64 (339.96) Percentage body fat: 14.41 (3.39) Percentage fat‐free mass: 85.59 (3.39) (N = 215) Fat‐free mass R0 (g): 3096.62 (320.97) Percentage fat‐free mass R0: 88.98 (2.98) | Neonatal anthropometric measures Mean (SD) (N = 482) Chest circumference Arm circumference Biceps SFTM (mm): 4.31 (1.13) Triceps SFTM (mm): 5.41 (1.44) Subscapular SFTM (mm): 5.11 (1.21) Suprailiac SFTM (mm): 5.75 (1.92) Abdominal SFTM (mm): 3.82 (1.06) Thigh SFTM (mm): 7.02 (1.90) Abdominal circumference to length ratio: 0.65 (0.04) Fat mass (g): 523.48 (189.05) Fat‐free mass (g): 3030.07 (362.54) Percentage body fat: 14.37 (3.44) Percentage fat‐free mass: 85.63 (3.44) (N = 179) Fat‐free mass R0 (g): 3133.15 (348.92) Percentage fat‐free mass R0: 89.10 (3.40) | "Average body circumferences, SFTM and calculated body fat measures were similar between the treatment groups, with no statistically significant differences identified... There were also no statistically significant differences identified between the two groups, with regard to fat‐free mass (R0) and percentage fat‐free mass (R0) obtained using bio‐impedance analysis" (P value: 0.94; 0.60; 0.45; 0.85; 0.90; 0.97; 0.85; 0.74; 0.90; 0.94; 0.97; 0.91; 0.91; 0.56; 0.79) |
| Poston 2015 | Mean (SD) (N = 249) Triceps SFTM (mm): 5.3 (1.4) (N = 244) Subscapular SFTM (mm): 5.7 (1.4) | Mean (SD) (N = 268) Triceps SFTM (mm): 5.3 (1.6) (N = 258) Subscapular SFTM (mm): 5.6 (1.4) | "Neonatal anthropometric measures were evaluated in a subgroup of infants and did not differ between groups" (P values: 0.72; 0.66) |
Comparison 1 Combined diet and exercise interventions versus standard care, Outcome 47 Adiposity.
Comparison 1 Combined diet and exercise interventions versus standard care, Outcome 48 Shoulder dystocia.
Comparison 1 Combined diet and exercise interventions versus standard care, Outcome 49 Nerve palsy.
Comparison 1 Combined diet and exercise interventions versus standard care, Outcome 50 Bone fracture.
Comparison 1 Combined diet and exercise interventions versus standard care, Outcome 51 Respiratory distress syndrome.
Comparison 1 Combined diet and exercise interventions versus standard care, Outcome 52 Hypoglycaemia.
Comparison 1 Combined diet and exercise interventions versus standard care, Outcome 53 Hyperbilirubinaemia.
Comparison 1 Combined diet and exercise interventions versus standard care, Outcome 54 Childhood weight (latest time reported) (kg).
Comparison 1 Combined diet and exercise interventions versus standard care, Outcome 55 Childhood weight z score (latest time reported).
Comparison 1 Combined diet and exercise interventions versus standard care, Outcome 56 Childhood height (latest time reported) (cm).
Comparison 1 Combined diet and exercise interventions versus standard care, Outcome 57 Childhood height z score (latest time reported).
Comparison 1 Combined diet and exercise interventions versus standard care, Outcome 58 Childhood head circumference (latest time reported) (cm).
Comparison 1 Combined diet and exercise interventions versus standard care, Outcome 59 Childhood adiposity (latest time reported) (BMI z score).
Comparison 1 Combined diet and exercise interventions versus standard care, Outcome 60 Childhood adiposity (latest time reported) (abdominal circumference) (cm).
Comparison 1 Combined diet and exercise interventions versus standard care, Outcome 61 Childhood adiposity (latest time reported) (subscapular skinfold thickness) (mm).
Comparison 1 Combined diet and exercise interventions versus standard care, Outcome 62 Childhood adiposity (latest time reported) (triceps skinfold thickness) (mm).
Comparison 1 Combined diet and exercise interventions versus standard care, Outcome 63 Childhood adiposity (latest time reported) (total body fat) (%).
| Study | Intervention | Control | P value |
| Poston 2015 | Anthropometric measures at 6 months Mean (SD) (N = 267) Subscapular SFTM z score: 0.08 (1.37) (N = 296) Triceps SFTM z score: 0.10 (1.56) (N = 267) Sum of SFTM (mm): 17.08 (3.93) (N = 267) Subscapular triceps ratio: 0.83 (0.22) (N = 315) Waist length ratio: 0.64 (0.08) (N = 314) Weight for length z score: ‐0.08 (1.79) (N = 329) Mid upper arm circumference (cm): 15.30 (1.49) | Anthropometric measures at 6 months Mean (SD) (N = 280) Subscapular SFTM z score: 0.36 (1.37) (N = 298) Triceps SFTM z score: 0.24 (1.43) (N = 280) Sum of SFTM (mm): 17.71 (3.97) (N = 280) Subscapular triceps ratio: 0.85 (0.23) (N = 328) Waist length ratio: 0.64 (0.10) (N = 324) Weight for length z score: 0.08 (1.63) (N = 347) Mid upper arm circumference (cm): 15.39 (2.08) | "There was no statistical difference in triceps skinfold thickness... but subscapular skinfold thickness z‐score was... lower in the intervention arm... The infant sum of skinfold thickness... did not reach statistical significance... There were no differences... in other anthropometric measures between the two arms" (P values: 0.021; 0.246; 0.058; 0.423; 0.928; 0.184; 0.511) |
| Vinter 2011 | Anthropometric measures at 2.8 years Mean (95% CI) or N (%) (N = 82) Overweight or obese: 9 (10.9%) BMI (kg/m²): 16.4 (16.1; 16.7) Hip (cm): 50.8 (50.1; 51.5) Abdominal circumference/hip ratio: 0.97 (0.95; 0.97) Dual Energy X‐ray scan results at 2.8 years Mean (95% CI) (N = 37) Total fat (g): 2463 (2147; 2779) Lean body mass (g): 11,336 (10,942; 11,730) | Anthropometric measures at 2.8 years Mean (95% CI) or N (%) (N = 75) Overweight or obese: 5 (6.7%) BMI (kg/m²): 16.1 (15.8; 16.4) Hip (cm): 50.2 (49.4; 51.0) Abdominal circumference/hip ratio: 0.96 (0.95; 0.97) Dual Energy X‐ray scan results at 2.8 years Mean (95% CI) (N = 30) Total fat (g): 2442 (2189; 2696) Lean body mass (g): 11,236 (10,797; 11,675) | "At a significance level of 0.05 (two‐sided), there were no statistically significant differences in any variables between the LiP intervention and control groups." (Individual P values not reported) |
Comparison 1 Combined diet and exercise interventions versus standard care, Outcome 64 Childhood adiposity (latest time reported).
| Study | Intervention | Control | P value |
| Vinter 2011 | Metabolic risk factors at 2.8 years Mean (95% CI) or N (%) (N = 63) Systolic blood pressure (mm Hg): 98.3 (93.7–105.3) Systolic blood pressure ≥ 90th percentile: 16 (25.4) Diastolic blood pressure (mm Hg): 64.3 (61.0–67.3) Diastolic blood pressure ≥ 90th percentile: 16 (25.4) (N = 59) Fasting plasma glucose (mmol/L): 5.2 (4.6 –5.6) Fasting plasma glucose ≥ 5.6 mmol/L: 16 (20.8) (N = 39) Fasting insulin (pmol/L): 16 (8–33) Fasting insulin ≥ 55 pmol/L: 3 (7.7) Fasting HDL (mmol/L): 1.2 (1.1–1.4) Fasting HDL ≥ 1.03 mmol/L: 6 (17.1) Fasting triglycerides (mmol/L): 0.7 (0.6 –1.1) Fasting triglycerides ≥ 1.7 mmol/L: 1 (2.9) Metabolic syndrome (a high abdominal circumference plus 2 or more of the following: low HDL, high triglycerides, high fasting glucose, and high systolic and/or diastolic blood pressure): 0 (0) | Metabolic risk factors at 2.8 years Mean (95% CI) or N (%) (N = 54) Systolic blood pressure (mm Hg): 97.3 (94.3–101.3) Systolic blood pressure ≥ 90th percentile: 12 (22.0) Diastolic blood pressure (mm Hg): 62.0 (60.3– 65.3) Diastolic blood pressure ≥ 90th percentile: 12 (22.0) (N = 59) Fasting plasma glucose (mmol/L): 5.1 (4.7–5.5) Fasting plasma glucose ≥ 5.6 mmol/L: 13 (18.1) (N = 51) Fasting insulin (pmol/L): 12 (8–18) Fasting insulin ≥ 55 pmol/L: 3 (5.9) Fasting HDL (mmol/L): 1.3 (1.1–1.5) Fasting HDL ≥ 1.03 mmol/L: 6 (12.2) Fasting triglycerides (mmol/L): 0.9 (0.6 –1.0) Fasting triglycerides ≥ 1.7 mmol/L: 3 (6.1) Metabolic syndrome (a high abdominal circumference plus 2 or more of the following: low HDL, high triglycerides, high fasting glucose, and high systolic and/or diastolic blood pressure): 0 (0) | "At a significance level of .05 (two‐sided), there were no statistically |
Comparison 1 Combined diet and exercise interventions versus standard care, Outcome 65 Childhood cardiovascular health (latest time reported).
Comparison 1 Combined diet and exercise interventions versus standard care, Outcome 66 Antenatal visits.
Comparison 1 Combined diet and exercise interventions versus standard care, Outcome 67 Antenatal admissions.
Comparison 1 Combined diet and exercise interventions versus standard care, Outcome 68 Length of antenatal stay (days).
Comparison 1 Combined diet and exercise interventions versus standard care, Outcome 69 Neonatal intensive care unit admission.
Comparison 1 Combined diet and exercise interventions versus standard care, Outcome 70 Length of postnatal stay (mother) (days).
Comparison 1 Combined diet and exercise interventions versus standard care, Outcome 71 Length of postnatal stay (baby) (days).
Comparison 1 Combined diet and exercise interventions versus standard care, Outcome 72 Costs to families associated with the management provided (unit cost, €).
Comparison 1 Combined diet and exercise interventions versus standard care, Outcome 73 Costs associated with the intervention (unit cost, €).
Comparison 1 Combined diet and exercise interventions versus standard care, Outcome 74 Cost of maternal care (unit cost, €).
Comparison 1 Combined diet and exercise interventions versus standard care, Outcome 75 Cost of infant care (unit cost, €).
Comparison 2 Combined diet and exercise interventions versus standard care: subgroups based on study design, Outcome 1 Gestational diabetes.
Comparison 2 Combined diet and exercise interventions versus standard care: subgroups based on study design, Outcome 2 Pre‐eclampsia.
Comparison 2 Combined diet and exercise interventions versus standard care: subgroups based on study design, Outcome 3 Caesarean section.
Comparison 2 Combined diet and exercise interventions versus standard care: subgroups based on study design, Outcome 4 Large‐for‐gestational age.
Comparison 3 Combined diet and exercise interventions versus standard care: subgroups based on maternal BMI, Outcome 1 Gestational diabetes.
Comparison 3 Combined diet and exercise interventions versus standard care: subgroups based on maternal BMI, Outcome 2 Pre‐eclampsia.
Comparison 3 Combined diet and exercise interventions versus standard care: subgroups based on maternal BMI, Outcome 3 Pregnancy‐induced hypertension or hypertension.
Comparison 3 Combined diet and exercise interventions versus standard care: subgroups based on maternal BMI, Outcome 4 Caesarean section.
Comparison 3 Combined diet and exercise interventions versus standard care: subgroups based on maternal BMI, Outcome 5 Perinatal mortality.
Comparison 3 Combined diet and exercise interventions versus standard care: subgroups based on maternal BMI, Outcome 6 Large‐for‐gestational age.
Comparison 4 Combined diet and exercise interventions versus standard care: subgroups based on ethnicity, Outcome 1 Gestational diabetes.
Comparison 4 Combined diet and exercise interventions versus standard care: subgroups based on ethnicity, Outcome 2 Pre‐eclampsia.
Comparison 4 Combined diet and exercise interventions versus standard care: subgroups based on ethnicity, Outcome 3 Pregnancy‐induced hypertension or hypertension.
Comparison 4 Combined diet and exercise interventions versus standard care: subgroups based on ethnicity, Outcome 4 Caesarean section.
Comparison 4 Combined diet and exercise interventions versus standard care: subgroups based on ethnicity, Outcome 5 Perinatal mortality.
Comparison 4 Combined diet and exercise interventions versus standard care: subgroups based on ethnicity, Outcome 6 Large‐for‐gestational age.
Comparison 5 Combined diet and exercise interventions versus standard care: sensitivity analyses, Outcome 1 Gestational diabetes.
Comparison 5 Combined diet and exercise interventions versus standard care: sensitivity analyses, Outcome 2 Pre‐eclampsia.
Comparison 5 Combined diet and exercise interventions versus standard care: sensitivity analyses, Outcome 3 Pregnancy‐induced hypertension.
Comparison 5 Combined diet and exercise interventions versus standard care: sensitivity analyses, Outcome 4 Caesarean section.
Comparison 5 Combined diet and exercise interventions versus standard care: sensitivity analyses, Outcome 5 Perinatal mortality.
Comparison 5 Combined diet and exercise interventions versus standard care: sensitivity analyses, Outcome 6 Large‐for‐gestational age.
| Combined diet and exercise interventions for preventing GDM | ||||||
| Population: pregnant women, excluding women already diagnosed with GDM, type 1 or type 2 diabetes Setting: Australia (2 RCTs), Brazil (1 RCT), Canada (2 RCTs), China (2 RCTs), Denmark (1 RCT), Egypt (1 RCT), Finland (3 RCTs), Germany (1 RCT), Italy (2 RCTs), Norway (1 RCT), UK (2 RCTs), USA (5 RCTs) | ||||||
| Outcomes | Anticipated absolute effects* (95% CI) | Relative effect | № of participants | Quality of the evidence | Comments | |
| Risk with control | Risk with diet and exercise interventions | |||||
| GDM | Trial population | average RR 0.85 (0.71 to 1.01) | 6633 (19 RCTs) | ⊕⊕⊕⊝ MODERATE1,3 | ||
| 168 per 1000 | 143 per 1000 (119 to 170) | |||||
| Hypertensive disorders of pregnancy (pre‐eclampsia) | Trial population | RR 0.98 (0.79 to 1.22) | 5366 (8 RCTs) | ⊕⊕⊝⊝ LOW2,4 | Eclampsia was not reported by any trials (Sagedal 2017 reports combined severe pre‐eclampsia, HELLP and eclampsia) | |
| 57 per 1000 | 55 per 1000 (45 to 69) | |||||
| Hypertensive disorders of pregnancy (pregnancy‐induced hypertension/hypertension) | Trial population | average RR 0.78 | 3073 | ⊕⊝⊝⊝ VERY LOW2,5,6 | ||
| 103 per 1000 | 80 per 1000 (48 to 130) | |||||
| Caesarean section | Trial population | RR 0.95 (0.88 to 1.02) | 6089 (14 RCTs) | ⊕⊕⊕⊝ MODERATE7 | ||
| 299 per 1000 | 284 per 1000 (263 to 305) | |||||
| Perineal trauma | Trial population | RR 1.27 (0.78 to 2.05) | 2733 (2 RCTs) | ⊕⊕⊕⊝ MODERATE2 | ||
| 21 per 1000 | 27 per 1000 (17 to 44) | |||||
| Gestational weight gain (kg) | Trial population | MD ‐ 0.89 (‐1.39 to ‐ 0.40) | 5052 | ⊕⊕⊕⊝ MODERATE8,9 | ||
| The mean gestational weight gain in the intervention group was 0.89 kg less (1.39 kg less to 0.40 kg less) | ||||||
| Postnatal depression | Not estimable | (0 RCTs) | No data reported for postnatal depression in any of the included RCTs | |||
| Type 2 diabetes mellitus | Not estimable | (0 RCTs) | No data reported for type 2 diabetes mellitus in any of the included RCTs | |||
| *The risk in the intervention group (and its 95% confidence interval) is based on the assumed risk in the comparison group and the relative effect of the intervention (and its 95% CI) | ||||||
| GRADE Working Group grades of evidence | ||||||
| 1Trial limitations (‐1): 19 RCTs, intervention unable to be blinded (not downgraded for this as outcome is objective); some RCTS with potentially serious design limitations (unclear randomisation, attrition bias) | ||||||
| Combined diet and exercise interventions for preventing GDM | ||||||
| Population: pregnant women, excluding women already diagnosed with GDM, type 1 or type 2 diabetes Setting: Australia (2 RCTs), Brazil (1 RCT), Canada (2 RCTs), China (2 RCTs), Denmark (1 RCT), Egypt (1 RCT), Finland (3 RCTs), Germany (1 RCT), Italy (2 RCTs), Norway (1 RCT), UK (2 RCTs), USA (5 RCTs) | ||||||
| Outcomes | Anticipated absolute effects* (95% CI) | Relative effect | № of participants | Quality of the evidence | Comments | |
| Risk with control | Risk with diet and exercise interventions | |||||
| Perinatal mortality | Trial population | RR 0.82 (0.42 to 1.63) | 3757 (2 RCTs) | ⊕⊕⊝⊝ LOW1 | ||
| 10 per 1000 | 8 per 1000 (4 to 16) | |||||
| Large‐for‐gestational age | Trial population | RR 0.93 (0.81 to 1.07) | 5353 (11 RCTs) | ⊕⊕⊝⊝ LOW2,3 | ||
| 135 per 1000 | 126 per 1000 (109 to 144) | |||||
| Mortality or morbidity composite | Not estimable | (0 RCTs) | No data reported for mortality or morbidity composite in any of the included RCTs | |||
| Neonatal hypoglycaemia | Trial population | average RR 1.42 (0.67 to 2.98) | 3653 (2 RCTs) | ⊕⊕⊝⊝ LOW3,4 | ||
| 63 per 1000 | 90 per 1000 (42 to 189) | |||||
| Childhood adiposity (latest time reported) (BMI z score) | Trial population | MD 0.05 (‐0.29 to 0.40) | 794 (2 RCTs) | ⊕⊕⊝⊝ LOW3,5,6 | Additional meta‐analyses presented in review for: abdominal circumference, subscapular skinfold thickness, triceps skinfold thickness and total body fat | |
| The mean BMI z score in the intervention group was 0.05 higher (0.29 lower to 0.40 higher) | ||||||
| Type 2 diabetes mellitus | Not estimable | (0 RCTs) | No data reported for type 2 diabetes mellitus in any of the included RCTs | |||
| Neurosensory disability | Not estimable | (0 RCTs) | No data reported for neurosensory disability in any of the included RCTs | |||
| *The risk in the intervention group (and its 95% confidence interval) is based on the assumed risk in the comparison group and the relative effect of the intervention (and its 95% CI). | ||||||
| GRADE Working Group grades of evidence | ||||||
| 1Imprecision (‐2): confidence interval crossing the line of no effect and few events | ||||||
| Study ID | Diet and exercise intervention | Control |
| Mean (SD): 26.7 (6.0) | Mean (SD): 26.4 (5.0) | |
| Mean (SD): 31.5 (5) | Mean (SD): 30.8 (5.5) | |
| Mean (SD): 29.3 (5.4) | Mean (SD): 29.6 (5.6) | |
| Not reported | Not reported | |
| Mean (SD): 32.4 (4.6) | Mean (SD): 31.7 (4.5) | |
| N (%) | N (%) | |
| Mean (SD): 25.9 (4.9) | Mean (SD): 25.0 (5.7) | |
| Not reported | Not reported | |
| Mean (SD): 30.1 (5.2) | Mean (SD): 28.7 (5.9) | |
| Mean (SD) BMI ≤ 24.9 kg/m²: 31 (3) BMI ≥ 25 kg/m²: 31 (4) | Mean (SD) BMI ≤ 24.9 kg/m²: 29 (6) BMI ≥ 25 kg/m²: 32 (5) | |
| Mean (SD): 29.57 (4.13) | Mean (SD): 29.89 (3.86) | |
| Mean (SD): 32.3 (4.9) | Mean (SD): 32.6 (4.5) | |
| Mean (SD): 29.1 (5.4) | Mean (SD): 29.8 (5.4) | |
| Mean (SD): 29.5 (4.8) | Mean (SD): 30.0 (4.7) | |
| Mean (SD): 31.5 (4.2) | Mean (SD): 32.4 (5.9) | |
| Mean (SD): 28.6 (5.2) | Mean (SD): 28.8 (5.2) | |
| Mean (SD): 25.5 (4.8) | ||
| Mean (SD): 30.4 (5.7) | Mean (SD): 30.7 (4.9) | |
| Mean (SD): 30.5 (5.5) | Mean (SD): 30.4 (5.6) | |
| Mean (SD): 32.2 (4.4) | Mean (SD): 30.8 (4.9) | |
| Mean (SD): 27.9 (4.2) | Mean (SD): 28.1 (4.5) | |
| Median (IQR): 29 (27 ‐ 32) | Median (IQR): 29 (26 ‐ 31) | |
| Mean (SD): 31.0 (3.8) | Mean (SD): 30.27 (3.64) | |
| Abbreviations: BMI: body mass index; IQR: interquartile range; N: number; SD: standard deviation | ||
| Study ID | Diet and exercise intervention | Control |
| Mean (SD): 25.5 (6.0) [pre‐pregnancy] | Mean (SD): 25.6 (5.1) [pre‐pregnancy] | |
| Mean (SD): 33.3 (6) [pre‐pregnancy] Mean (SD): 34.5 (6.8) [baseline] | Mean (SD): 33.4 (5.5) [pre‐pregnancy] Mean (SD): 33.9 (5.7) [baseline] | |
| Median (IQR): 31.0 (28.1‐35.9) [baseline] | Median (IQR): 31.1 (27.7‐35.6) [baseline] | |
| Not reported (all women were obese) | Not reported (all women were obese) | |
| Mean (SD): 30.4 (5.6) [baseline] | Mean (SD): 30.3 (5.9) [baseline] | |
| N (%) [pre‐pregnancy] | N (%) [pre‐pregnancy] | |
| Mean (SD): 33.5 (5.8) [early pregnancy] | Mean (SD): 32.2 (5.4) [early pregnancy] | |
| Not reported | Not reported | |
| Mean (SD): 25.7 (5.1) [pre‐pregnancy] | Mean (SD): 24.9 (5.4) [pre‐pregnancy] | |
| Mean (SD) [pre‐pregnancy] BMI ≤ 24.9 kg/m²: 21.6 (2.2) BMI ≥ 25 kg/m²: 29.5 (5.1) | Mean (SD) [pre‐pregnancy] BMI ≤ 24.9 kg/m²: 22.6 (1.9) BMI ≥ 25 kg/m²: 29.7 (1.3) | |
| Mean (SD): 20.44 (2.54) [pre‐pregnancy] | Mean (SD): 20.44 (2.54); 20.74 (2.43) [pre‐pregnancy] | |
| Mean (SD): 31.5 (6.0) [pre‐pregnancy] Mean (SD): 32.2 (5.9) [baseline] | Mean (SD): 32.0 (5.5) [pre‐pregnancy] Mean (SD): 32.3 (5.4) [baseline] | |
| Mean (SD): 27.3 (6.0) [baseline] | Mean (SD): 25.5 (3.4) [baseline] | |
| Mean (SD): 26.3 (4.9) [pre‐pregnancy] | Mean (SD): 26.4 (4.3) [pre‐pregnancy] | |
| Mean (SD): 32.1 (5) [baseline] | Mean (SD): 32.9 (6.2) [baseline] | |
| Mean (SD): 26.32 (5.6) [baseline] | Mean (SD): 26.48 (5.9) [baseline] | |
| Mean (SD) [pre‐pregnancy] Normal weight: 22.8 (1.9) Overweight: 31.4 (6.0) | Mean (SD) [pre‐pregnancy] Normal weight: 22.5 (2.0) Overweight: 34.1 (7.2) | |
| Mean (SD): 36.5 (4.7) [baseline] | Mean (SD): 36.1 (4.8) [baseline] | |
| Mean (SD): 36.3 (5.0) [baseline] | Mean (SD): 36.3 (4.6) [baseline] | |
| Median (IQR): 21.7 (19.9 ‐ 23.7) [pre‐pregnancy] Median (IQR): 22.2 (20.7 ‐ 24.3) [booking] | Median (IQR): 22.8 (20.6 ‐ 26.6) [pre‐pregnancy] Median (IQR): 23.3 (21.2 ‐ 26.8) [booking] | |
| Mean (SD): 23.8 (4.1) [pre‐pregnancy] | Mean (SD): 23.5 (3.7) [pre‐pregnancy] | |
| Median (IQR): 33.4 (31.7 ‐ 36.5) | Median (IQR): 33.3 (31.7 ‐ 36.9) | |
| Mean (SD): 22.95 (3.65) [pre‐pregnancy] | Mean (SD): 23.06 (3.63) [pre‐pregnancy] | |
| Abbreviations: BMI: body mass index; IQR: interquartile range; N: number; SD: standard deviation | ||
| Study ID | Diet and exercise intervention | Control |
| N (%) | N (%) | |
| N (%) Caucasian: 79 (82.3) | N (%) Caucasian: 78 (82.1) | |
| N (%) | N (%) White: 998 (91.0) | |
| Not reported (conducted in Egypt) | Not reported (conducted in Egypt) | |
| Country of birth, N (%) | Country of birth, N (%) | |
| N (%) Hispanic: 33 (100) | N (%) Hispanic: 35 (100) | |
| N (%) African American: 33 (100) | N (%) African American: 33 (100) | |
| Not reported | Not reported | |
| N (%) | N (%) | |
| First Nations (Canadian Aboriginals with First Nations status), N (%) BMI ≤ 24.9 kg/m²: 2 (6.7) BMI ≥ 25 kg/m²: 3 (11.1) | First Nations (Canadian Aboriginals with First Nations status), N (%) BMI ≤ 24.9 kg/m²: 1 (3.7) BMI ≥ 25 kg/m²: 4 (13.8) | |
| Not reported (conducted in China) | Not reported (conducted in China) | |
| Not reported (conducted in Finland) | Not reported (conducted in Finland) | |
| Not reported (conducted in Norway) | Not reported (conducted in Norway) | |
| Not reported (conducted in Finland) | Not reported (conducted in Finland) | |
| N (%) Caucasian: 28 (84.9) Maghreb: 4 (12.1) Other: 1 (3.0) | Caucasian: 20 (66.7) Maghreb: 6 (20) Other: 4 (13.3) | |
| N (%) Non‐Hispanic White: 138 (68.7) Latina and Hispanic: 39 (19.6) Non‐Hispanic African American: 14 (7.1) Other: 9 (4.6) | N (%) Latina and Hispanic: 39 (19.6) Non‐Hispanic African American: 19 (9.6) Other: 7 (3.3) | |
| N (%) Black: 47 (39) White 73 (61) | ||
| N (%) White: 52 (55) Black: 38 (40) Asian: 2 (2) Other: 2 (2) | N (%) White: 51 (57) Black: 32 (26) Asian: 1 (1) Other: 5 (6) | |
| N (%) White: 490 (63) Black: 202 (26) Asian: 47 (6) Other: 44 (6) | N (%) Black: 200 (26) Asian: 48 (6) Other: 41 (5) | |
| Country of birth, N (%) Germany: 140 (83.8) Others: 27 (16.2) | Country of birth, N (%) Germany: 68 (81.9) Others: 15 (18.1) | |
| Not reported (conducted in Norway) | Not reported (conducted in Norway) | |
| N (%) | N (%) Caucasian: 154 (100) | |
| Not reported (conducted in China) | Not reported (conducted in China) | |
| Abbreviations: N: number | ||
| Study ID | Diet and exercise intervention | Control |
| N (%) | N (%) | |
| N (%) 0: 53 (55.2) | N (%) 0: 59 (62.1) | |
| N (%) 0: 441 (40.2) | N (%) 0: 441 (40.2) | |
| Not reported | Not reported | |
| N (%) | N (%) | |
| N (%) | N (%) | |
| N (%): 0: 9 (27) | N (%): 0: 10 (30) | |
| Not reported | Not reported | |
| Not reported | Not reported | |
| Not reported | Not reported | |
| Not reported | Not reported | |
| Previous deliveries, N (%) | Previous deliveries, N (%) | |
| N (%) 0: 13 (50) | N (%) 0: 17 (63) | |
| N (%) 0: 103 (47.0) | N (%) 0: 73 (40.6) | |
| N (%) 0: 13 (39.4) | N (%) 0: 13 (43.3) | |
| N (%) 0: 153 (76.3) ≥ 1: 48 (23.7) | N (%) 0: 153 (76.6) ≥ 1: 47 (23.4) | |
| N (%) First pregnancy: 56 (47) Second pregnancy: 36 (30) Third pregnancy: 20 (17) > third pregnancy: 7 (6) | ||
| N (%) 0: 42 (45) 1: 29 (31) ≥ 2: 23 (24) | N (%) 0: 38 (43) 1: 36 (40) ≥ 2: 15 (17) | |
| N (%) 0: 336 (43) ≥ 1: 447 (57) | N (%) 0: 338 (44) ≥ 1: 434 (56) | |
| N (%) 0: 110 (65.9) 1: 50 (29.9) ≥ 2: 7 (4.2) | N (%) 0: 53 (63.9) 1: 23 (27.7) ≥ 2: 7 (8.4) | |
| N (%) 0: 303 (100) | N (%) 0: 303 (100) | |
| N (%) 0: 79 (52.7) | N (%) 0: 84 (54.6) | |
| Not reported | Not reported | |
| Abbreviations: N: number | ||
| Study ID | Timing | Screening/diagnosis test(s) and glucose threshold(s) used for diagnosis | Reference(s) | Notes |
| Not reported | Not reported | Not provided | Data not provided in format suitable for meta‐analysis | |
| 16th to 18th weeks; repeated in 24th to 28th weeks for women negative at first test | 75 g 2‐hour OGTT Thresholds: fasting ≥ 5.1 mmol/L and/or 1‐hour ≥ 10.0 mmol/L and/or 2‐hour ≥ 8.5 mmol/L | "IADPSG criteria" (no reference provided) | ||
| Not reported | "all women were encouraged to undergo screening" 75 g 2‐hour OGTT Thresholds: fasting ≥ 5.5 mmol/L or 2‐hour ≥ 7.8 mmol/L | South Australian Perinatal Practice Guidelines 2013 (South Australian Perinatal Practice Guidelines: diabetes mellitus and abnormal glucose tolerance Government of Australia, SA Health, 2013. www.health.sa.gov.au/ppg/Default. | ||
| 24 to 28 weeks | "All women underwent routine GDM screening" | Not provided | Data not provided in format suitable for meta‐analysis | |
| 28 weeks | 2‐hour OGTT Thresholds: fasting ≥ 5.5 mmol/L and/or 2‐hour ≥ 8.0 mmol/L OR Thresholds: fasting ≥ 5.1 mmol/L and/or 1‐hour ≥ 10.0 mmol/L and/or 2‐hour ≥ 8.5 mmol/L | ADIPS 1998 (Hoffmann L, Nolan C, Wilson JD, Oats JJN, Simmons D. Gestational diabetes mellitus: management guidelines. MJA 1998;169:93–7.) OR IADPSG 2010 (Metzger BE, Gabbe SG, Persson B, et al. International association of diabetes and pregnancy study groups recommendations on the diagnosis and classification of hyperglycaemia in pregnancy. Diabetes Care 2010;33:676–82.) | Data in meta‐analysis according to IADPSG 2010 criteria [groups Ns not reported for ADIPS 1998 criteria] | |
| 24 to 28 weeks gestation | 50 g 1‐hour OGTT Thresholds: 1‐hour > 7.493 mmol/L 100 g 3‐hour OGTT Thresholds: not reported | American Diabetes Association 2012 (American Diabetes Association. Standards of medical care in diabetes–2012. Diabetes Care 2012; 35(Suppl. 1): S11–63.) | Data not provided in format suitable for meta‐analysis | |
| Not reported | Not reported | Not provided | ||
| Not reported | Not reported | Not provided | Data not provided in format suitable for meta‐analysis | |
| Not reported | Not reported | Canadian Diabetes Association 2008 (Canadian Diabetes Association. 2008 Clinical practice guidelines for the prevention and management of diabetes in Canada. Can J Diabetes 2008;32:S168–80.) | ||
| Not reported | Not reported | Canadian Diabetes Association 2008 (Canadian Diabetes Association, Clinical Practice Guidelines Committee, Canadian Diabetes Association: 2008 Clinical Practice Guidelines for the Prevention and Management of Diabetes in Canada. Can J Diabetes Care 2008, 32:S1:171.) | ||
| Not reported | Not reported | Not provided | ||
| 24 to 28 weeks | 75 g 2‐hour OGTT Thresholds: fasting ≥ 5.3 mmol/L and/or 1‐hour ≥ 10.0 mmol/L and/or 2‐hour ≥ 8.6 mmol/L | American Diabetes Association 2008 (Holcomb SS; American Diabetes Association. Update: standards of medical care in diabetes. Nurse Pract 2008;33:12–5.) | ||
| 26 to 28 weeks | 75 g 2‐hour OGTT Thresholds: fasting ≥ 5.6 mmol/L or 2‐hour ≥ 7.8 mmol/L | Modified from the World Health Organization 1998 (Alberti KG, Zimmet PZ: Definition, diagnosis and classification of diabetes mellitus and its complications. Part 1: diagnosis and classification of diabetes mellitus: provisional report of WHO consultation. Diabet Med 1998, 15:539‐53.) | All women also underwent 75 g 2 hour OGTT at 8 to 12 weeks; those diagnosed with GDM were excluded from the trial | |
| 26 to 28 weeks | 2‐hour OGTT Thresholds: fasting ≥ 5.3 mmol/L and/or 1‐hour > 10.0 mmol/L and/or 2‐hour > 8.6 mmol/L OR 1) Any of the above thresholds or newborn birthweight ≥ 4500 g or use of insulin or other diabetic medication 2) Any of the above thresholds or newborn birthweight ≥ 4000 g or use of insulin or other diabetic medication 3) Any of the above thresholds or use of insulin or other diabetic medication | American Diabetes Association 2010 ((2010) Diagnosis and classification of diabetes mellitus. Diabetes Care 33: S62–9.) | Data in meta‐analysis according to American Diabetes Association 2010 criteria [use of data according to other criteria did not change results] | |
| 16th to 18th week or 24th to 28th week "as recommend" | 75 g 2‐hour OGTT Thresholds: not reported | American Diabetes Association 2011 (American Diabetes Association. Standards of medical care in diabetes‐2011. Diabetes Care 2011;34:S11–61.) | ||
| Not reported | Not reported | Not provided | ||
| Not reported | Not reported | Not provided | ||
| 27 + 0 to 28 + 6 weeks | 75 g 2‐hour OGTT Thresholds: fasting ≥ 5.1 mmol/L and/or 1‐hour ≥ 10.0 mmol/L and/or 2‐hour ≥ 8.5 mmol/L | IADPSG 2010 (Metzger B, Gabbe SG, Persson B, Buchanan TA, Catalano PA, Damm P, Dyer AR, Leiva A, Hod M, Kitzmiler JL, Lowe LP, McIntyre HD, Oats JJ, Omori Y, Schmidt MI: International association of diabetes and pregnancy study groups recommendations on the diagnosis and classification of hyperglycaemia in pregnancy. Diabetes Care 2010, 33:676–82.) | ||
| 27 + 0 to 28 + 6 weeks | 75 g 2‐hour OGTT Thresholds: fasting ≥ 5.1 mmol/L and/or 1‐hour ≥ 10.0 mmol/L and/or 2‐hour ≥ 8.5 mmol/L | IADPSG 2010 (Metzger BE, Gabbe SG, Persson B, et al. International Association of Diabetes and Pregnancy Study Groups recommendations on the diagnosis and classification of hyperglycaemia in pregnancy. Diabetes Care 2010; 33: 676–82.) | ||
| 24th to 28th week | 2‐hour OGTT Thresholds: not reported | German Society of Gynecology and Obstetrics 2010 (Deutsche Gesellschaft für Gynäkologie und Geburtshilfe e.V.: Diagnostik und Therapie des Gestationsdiabetes. [http://www.dggg.de/leitlinien/].) | ||
| 30 weeks | 75 g 2‐hour OGTT Thresholds: 2‐hour ≥ 7.8 mmol/L | Norway national criteria 2008 (Tore HH, Torun C. Veileder i Fødselshjelp 2008 In) NGFNSfGaO, editor. Veileder i Fødselshjelp 2008; 2008. p. 112.); World Health Organization 2006 (World Health Organization. Definition and Diagnosis of Diabetes Mellitus and Intermediate Hyperglycaemia: Report of a WHO/IDF Consultation. Geneva, Switzerland: World Health Organization, 2006.) | ||
| 28 to 30 weeks and 34 to 36 weeks | 75 g 2‐hour OGTT Thresholds: 2‐hour ≥ 9 mmol/L OR Thresholds: 2‐hour ≥ 8.5 mmol/L | "Danish national recommendations" (no reference provided) OR IADPSG 2010 (Metzger BE, Gabbe SG, Persson B, Buchanan TA, Catalano PA, Damm P et al. International Association of Diabetes and Pregnancy Study Group’s recommendations on the diagnosis and classification of hyperglycaemia in pregnancy. Diabetes Care 2010; 33: 676–82.) | All women also underwent an OGTT at baseline (12 to 15 weeks); those diagnosed with GDM were excluded from the trial Data in meta‐analysis according to Danish national recommendations [use of data according to IADPSG 2010 criteria did not change results] | |
| 24 to 28 weeks | 75 g OGTT | "The International Association of Diabetes and Pregnancy Study Groups (IADPSG) criterion was used" (no reference provided) | ||
| Abbreviations: ADIPS: Australasian Diabetes in Pregnancy Society; g: gram; GDM: gestational diabetes mellitus; IADPSG: International Association of the Diabetes and Pregnancy Study Group; OGTT: oral glucose tolerance test; | ||||
| Outcome or subgroup title | No. of studies | No. of participants | Statistical method | Effect size |
| 1 Gestational diabetes Show forest plot | 19 | 6633 | Risk Ratio (M‐H, Random, 95% CI) | 0.85 [0.71, 1.01] |
| 2 Pre‐eclampsia Show forest plot | 8 | Risk Ratio (M‐H, Fixed, 95% CI) | Subtotals only | |
| 2.1 Pre‐eclampsia | 8 | 5366 | Risk Ratio (M‐H, Fixed, 95% CI) | 0.98 [0.79, 1.22] |
| 2.2 Severe pre‐eclampsia/HELLP/eclampsia | 2 | 2088 | Risk Ratio (M‐H, Fixed, 95% CI) | 0.72 [0.35, 1.46] |
| 3 Pregnancy‐induced hypertension and/or hypertension Show forest plot | 6 | Risk Ratio (M‐H, Random, 95% CI) | Subtotals only | |
| 3.1 Pregnancy‐induced hypertension and/or hypertension | 6 | 3073 | Risk Ratio (M‐H, Random, 95% CI) | 0.78 [0.47, 1.27] |
| 3.2 Pregnancy‐induced hypertension | 4 | 810 | Risk Ratio (M‐H, Random, 95% CI) | 0.46 [0.16, 1.29] |
| 3.3 Hypertension | 3 | 2532 | Risk Ratio (M‐H, Random, 95% CI) | 1.07 [0.84, 1.38] |
| 4 Caesarean section Show forest plot | 14 | 6089 | Risk Ratio (M‐H, Fixed, 95% CI) | 0.95 [0.88, 1.02] |
| 5 Perinatal mortality Show forest plot | 2 | 3757 | Risk Ratio (M‐H, Fixed, 95% CI) | 0.82 [0.42, 1.63] |
| 6 Large‐for‐gestational age Show forest plot | 11 | 5353 | Risk Ratio (M‐H, Fixed, 95% CI) | 0.93 [0.81, 1.07] |
| 7 Operative vaginal birth Show forest plot | 3 | 2164 | Risk Ratio (M‐H, Fixed, 95% CI) | 1.07 [0.86, 1.34] |
| 8 Induction of labour Show forest plot | 5 | 3907 | Risk Ratio (M‐H, Random, 95% CI) | 0.92 [0.79, 1.06] |
| 9 Perineal trauma Show forest plot | 2 | 2733 | Risk Ratio (M‐H, Fixed, 95% CI) | 1.27 [0.78, 2.05] |
| 10 Placental abruption Show forest plot | 1 | 1555 | Risk Ratio (M‐H, Fixed, 95% CI) | 2.96 [0.12, 72.50] |
| 11 Postpartum haemorrhage Show forest plot | 3 | 4235 | Risk Ratio (M‐H, Fixed, 95% CI) | 1.03 [0.89, 1.18] |
| 12 Postpartum infection Show forest plot | 2 | Risk Ratio (M‐H, Fixed, 95% CI) | Subtotals only | |
| 12.1 Endometritis | 1 | 2142 | Risk Ratio (M‐H, Fixed, 95% CI) | 1.19 [0.52, 2.74] |
| 12.2 Wound infection | 1 | 2142 | Risk Ratio (M‐H, Fixed, 95% CI) | 1.06 [0.65, 1.73] |
| 12.3 Postpartum antibiotics | 1 | 2142 | Risk Ratio (M‐H, Fixed, 95% CI) | 1.00 [0.77, 1.31] |
| 12.4 Postpartum sepsis | 1 | 1555 | Risk Ratio (M‐H, Fixed, 95% CI) | 0.33 [0.01, 8.06] |
| 13 Gestational weight gain (kg) Show forest plot | 16 | 5052 | Mean Difference (IV, Random, 95% CI) | ‐0.89 [‐1.39, ‐0.40] |
| 14 Gestational weight gain (various times reported) (kg) Show forest plot | 4 | Mean Difference (IV, Fixed, 95% CI) | Subtotals only | |
| 14.1 First trimester | 1 | 272 | Mean Difference (IV, Fixed, 95% CI) | ‐0.03 [‐0.62, 0.56] |
| 14.2 Second trimester | 2 | 541 | Mean Difference (IV, Fixed, 95% CI) | ‐0.38 [‐0.77, 0.02] |
| 14.3 Third trimester | 1 | 269 | Mean Difference (IV, Fixed, 95% CI) | ‐0.10 [‐1.17, 0.97] |
| 14.4 At 20‐24 weeks gestation | 1 | 221 | Mean Difference (IV, Fixed, 95% CI) | ‐0.45 [‐1.48, 0.58] |
| 14.5 At 26‐28 weeks gestation | 1 | 203 | Mean Difference (IV, Fixed, 95% CI) | ‐0.90 [‐1.75, ‐0.05] |
| 15 Gestational weight gain (kg/week) Show forest plot | 4 | 2772 | Mean Difference (IV, Random, 95% CI) | ‐0.03 [‐0.06, ‐0.00] |
| 16 Gestational weight gain (above IOM recommendations) Show forest plot | 11 | 4556 | Risk Ratio (M‐H, Random, 95% CI) | 0.87 [0.79, 0.96] |
| 17 Gestational weight gain (within IOM recommendations) Show forest plot | 9 | 3730 | Risk Ratio (M‐H, Fixed, 95% CI) | 1.02 [0.93, 1.11] |
| 18 Gestational weight gain (below IOM recommendations) Show forest plot | 7 | 3499 | Risk Ratio (M‐H, Fixed, 95% CI) | 1.10 [0.98, 1.24] |
| 19 Behaviour changes associated with the intervention Show forest plot | Other data | No numeric data | ||
| 20 Relevant biomarker changes associated with the intervention Show forest plot | Other data | No numeric data | ||
| 21 Sense of well‐being and quality of life Show forest plot | Other data | No numeric data | ||
| 22 Breastfeeding (exclusive) Show forest plot | 3 | Risk Ratio (M‐H, Fixed, 95% CI) | Subtotals only | |
| 22.1 3 days postpartum | 1 | 695 | Risk Ratio (M‐H, Fixed, 95% CI) | 1.02 [0.91, 1.15] |
| 22.2 6 weeks postpartum | 1 | 202 | Risk Ratio (M‐H, Fixed, 95% CI) | 0.93 [0.76, 1.13] |
| 22.3 6 months postpartum | 2 | 921 | Risk Ratio (M‐H, Fixed, 95% CI) | 0.91 [0.61, 1.36] |
| 23 Breastfeeding (partial) Show forest plot | 3 | Risk Ratio (M‐H, Fixed, 95% CI) | Subtotals only | |
| 23.1 3 days postpartum | 1 | 695 | Risk Ratio (M‐H, Fixed, 95% CI) | 0.51 [0.40, 0.66] |
| 23.2 6 weeks postpartum | 1 | 202 | Risk Ratio (M‐H, Fixed, 95% CI) | 1.44 [0.80, 2.60] |
| 23.3 6 months postpartum | 2 | 921 | Risk Ratio (M‐H, Fixed, 95% CI) | 0.98 [0.82, 1.18] |
| 24 Breastfeeding Show forest plot | Other data | No numeric data | ||
| 25 Postnatal weight retention (latest time reported) (kg) Show forest plot | 6 | 1673 | Mean Difference (IV, Fixed, 95% CI) | ‐0.94 [‐1.52, ‐0.37] |
| 26 Return to pre‐pregnancy weight (latest time reported) Show forest plot | 3 | 960 | Risk Ratio (M‐H, Fixed, 95% CI) | 1.25 [1.08, 1.45] |
| 27 Postnatal BMI (latest time reported) Show forest plot | 2 | Mean Difference (IV, Fixed, 95% CI) | Subtotals only | |
| 27.1 BMI | 2 | 902 | Mean Difference (IV, Fixed, 95% CI) | ‐0.15 [‐0.85, 0.55] |
| 27.2 BMI change from baseline to 6 weeks postpartum | 1 | 202 | Mean Difference (IV, Fixed, 95% CI) | ‐0.56 [‐1.12, ‐0.00] |
| 28 Maternal cardiovascular health (latest time reported) Show forest plot | Other data | No numeric data | ||
| 29 Stillbirth Show forest plot | 5 | 4783 | Risk Ratio (M‐H, Fixed, 95% CI) | 0.69 [0.35, 1.36] |
| 30 Neonatal mortality Show forest plot | 2 | Risk Ratio (M‐H, Fixed, 95% CI) | Subtotals only | |
| 30.1 Total | 2 | 3756 | Risk Ratio (M‐H, Fixed, 95% CI) | 2.31 [0.60, 8.90] |
| 30.2 No lethal anomalies | 1 | 2202 | Risk Ratio (M‐H, Fixed, 95% CI) | 0.99 [0.06, 15.85] |
| 30.3 Lethal anomalies | 1 | 2202 | Risk Ratio (M‐H, Fixed, 95% CI) | 6.95 [0.36, 134.38] |
| 31 Gestational age at birth (weeks) Show forest plot | 11 | 5658 | Mean Difference (IV, Fixed, 95% CI) | 0.05 [‐0.05, 0.15] |
| 32 Gestational age at birth (days or weeks) Show forest plot | Other data | No numeric data | ||
| 33 Preterm birth Show forest plot | 11 | 5398 | Risk Ratio (M‐H, Fixed, 95% CI) | 0.80 [0.65, 0.98] |
| 34 Apgar score less than seven at five minutes Show forest plot | 3 | 2864 | Risk Ratio (M‐H, Fixed, 95% CI) | 0.80 [0.48, 1.32] |
| 35 Macrosomia Show forest plot | 10 | Risk Ratio (M‐H, Fixed, 95% CI) | Subtotals only | |
| 35.1 > 4000 g | 9 | 5368 | Risk Ratio (M‐H, Fixed, 95% CI) | 0.89 [0.78, 1.01] |
| 35.2 > 4500 g | 4 | 3061 | Risk Ratio (M‐H, Fixed, 95% CI) | 0.63 [0.42, 0.94] |
| 36 Small‐for‐gestational age Show forest plot | 6 | 2434 | Risk Ratio (M‐H, Fixed, 95% CI) | 1.20 [0.95, 1.52] |
| 37 Birthweight (g) Show forest plot | 13 | 5763 | Mean Difference (IV, Fixed, 95% CI) | ‐17.67 [‐46.28, 10.94] |
| 38 Birthweight (g) Show forest plot | Other data | No numeric data | ||
| 39 Birthweight z score Show forest plot | 4 | 2661 | Mean Difference (IV, Fixed, 95% CI) | ‐0.05 [‐0.13, 0.03] |
| 40 Head circumference (cm) Show forest plot | 4 | 4229 | Mean Difference (IV, Fixed, 95% CI) | ‐0.01 [‐0.11, 0.10] |
| 41 Head circumference z score Show forest plot | 1 | 2142 | Mean Difference (IV, Fixed, 95% CI) | ‐0.05 [‐0.14, 0.04] |
| 42 Length (cm) Show forest plot | 6 | 3303 | Mean Difference (IV, Fixed, 95% CI) | ‐0.09 [‐0.26, 0.09] |
| 43 Length z score Show forest plot | 2 | 2235 | Mean Difference (IV, Fixed, 95% CI) | ‐0.08 [‐0.15, ‐0.02] |
| 44 Ponderal index (kg/m3) Show forest plot | 3 | 2826 | Mean Difference (IV, Fixed, 95% CI) | 0.04 [‐0.16, 0.25] |
| 45 Adiposity (sum of skinfold thickness) (mm) Show forest plot | 2 | 1472 | Mean Difference (IV, Fixed, 95% CI) | 0.09 [‐0.33, 0.50] |
| 45.1 Sum of biceps, triceps, subscapular, suprailiac, abdominal and thigh skinfold thickness | 1 | 970 | Mean Difference (IV, Fixed, 95% CI) | 0.03 [‐0.86, 0.92] |
| 45.2 Sum of triceps and subscapular skinfold thickness (mm) | 1 | 502 | Mean Difference (IV, Fixed, 95% CI) | 0.10 [‐0.36, 0.56] |
| 46 Adiposity (abdominal circumference) (cm) Show forest plot | 2 | 1566 | Mean Difference (IV, Fixed, 95% CI) | ‐0.01 [‐0.23, 0.22] |
| 47 Adiposity Show forest plot | Other data | No numeric data | ||
| 48 Shoulder dystocia Show forest plot | 2 | 2733 | Risk Ratio (M‐H, Fixed, 95% CI) | 1.20 [0.79, 1.83] |
| 49 Nerve palsy Show forest plot | 1 | 2142 | Risk Ratio (M‐H, Fixed, 95% CI) | 1.99 [0.36, 10.82] |
| 50 Bone fracture Show forest plot | 1 | 2142 | Risk Ratio (M‐H, Fixed, 95% CI) | 1.99 [0.36, 10.82] |
| 51 Respiratory distress syndrome Show forest plot | 2 | 2411 | Risk Ratio (M‐H, Fixed, 95% CI) | 0.56 [0.33, 0.97] |
| 52 Hypoglycaemia Show forest plot | 2 | 3653 | Risk Ratio (M‐H, Random, 95% CI) | 1.42 [0.67, 2.98] |
| 53 Hyperbilirubinaemia Show forest plot | 1 | 2142 | Risk Ratio (M‐H, Fixed, 95% CI) | 0.82 [0.61, 1.11] |
| 54 Childhood weight (latest time reported) (kg) Show forest plot | 3 | 882 | Mean Difference (IV, Random, 95% CI) | ‐0.05 [‐0.33, 0.22] |
| 54.1 6 months | 1 | 677 | Mean Difference (IV, Random, 95% CI) | ‐0.10 [‐0.26, 0.06] |
| 54.2 10‐12 months | 1 | 48 | Mean Difference (IV, Random, 95% CI) | ‐0.36 [‐0.96, 0.24] |
| 54.3 2.8 years | 1 | 157 | Mean Difference (IV, Random, 95% CI) | 0.30 [‐0.19, 0.79] |
| 55 Childhood weight z score (latest time reported) Show forest plot | 1 | 643 | Mean Difference (IV, Fixed, 95% CI) | ‐0.09 [‐0.26, 0.08] |
| 56 Childhood height (latest time reported) (cm) Show forest plot | 2 | 816 | Mean Difference (IV, Fixed, 95% CI) | 0.33 [‐0.58, 1.25] |
| 56.1 6 months | 1 | 659 | Mean Difference (IV, Fixed, 95% CI) | 1.04 [‐0.58, 2.66] |
| 56.2 2.8 years | 1 | 157 | Mean Difference (IV, Fixed, 95% CI) | 0.0 [‐1.11, 1.11] |
| 57 Childhood height z score (latest time reported) Show forest plot | 1 | 622 | Mean Difference (IV, Fixed, 95% CI) | ‐0.02 [‐0.31, 0.27] |
| 58 Childhood head circumference (latest time reported) (cm) Show forest plot | 1 | 670 | Mean Difference (IV, Fixed, 95% CI) | ‐0.12 [‐0.70, 0.46] |
| 59 Childhood adiposity (latest time reported) (BMI z score) Show forest plot | 2 | 794 | Mean Difference (IV, Random, 95% CI) | 0.05 [‐0.29, 0.40] |
| 59.1 6 months | 1 | 637 | Mean Difference (IV, Random, 95% CI) | ‐0.11 [‐0.39, 0.17] |
| 59.2 2.8 years | 1 | 157 | Mean Difference (IV, Random, 95% CI) | 0.24 [‐0.10, 0.58] |
| 60 Childhood adiposity (latest time reported) (abdominal circumference) (cm) Show forest plot | 2 | 833 | Mean Difference (IV, Fixed, 95% CI) | 0.26 [‐0.37, 0.90] |
| 60.1 6 months | 1 | 676 | Mean Difference (IV, Fixed, 95% CI) | 0.02 [‐0.81, 0.85] |
| 60.2 2.8 years | 1 | 157 | Mean Difference (IV, Fixed, 95% CI) | 0.60 [‐0.38, 1.58] |
| 61 Childhood adiposity (latest time reported) (subscapular skinfold thickness) (mm) Show forest plot | 2 | 705 | Mean Difference (IV, Random, 95% CI) | ‐0.17 [‐0.66, 0.32] |
| 61.1 6 months | 1 | 548 | Mean Difference (IV, Random, 95% CI) | ‐0.40 [‐0.73, ‐0.07] |
| 61.2 2.8 years | 1 | 157 | Mean Difference (IV, Random, 95% CI) | 0.10 [‐0.33, 0.53] |
| 62 Childhood adiposity (latest time reported) (triceps skinfold thickness) (mm) Show forest plot | 2 | 784 | Mean Difference (IV, Fixed, 95% CI) | ‐0.12 [‐0.48, 0.23] |
| 62.1 6 months | 1 | 627 | Mean Difference (IV, Fixed, 95% CI) | ‐0.18 [‐0.61, 0.25] |
| 62.2 2.8 years | 1 | 157 | Mean Difference (IV, Fixed, 95% CI) | 0.0 [‐0.63, 0.63] |
| 63 Childhood adiposity (latest time reported) (total body fat) (%) Show forest plot | 2 | 614 | Mean Difference (IV, Fixed, 95% CI) | ‐0.74 [‐1.56, 0.07] |
| 63.1 6 months | 1 | 547 | Mean Difference (IV, Fixed, 95% CI) | ‐0.80 [‐1.64, 0.04] |
| 63.2 2.8 years | 1 | 67 | Mean Difference (IV, Fixed, 95% CI) | 0.0 [‐3.03, 3.03] |
| 64 Childhood adiposity (latest time reported) Show forest plot | Other data | No numeric data | ||
| 65 Childhood cardiovascular health (latest time reported) Show forest plot | Other data | No numeric data | ||
| 66 Antenatal visits Show forest plot | 1 | 269 | Mean Difference (IV, Fixed, 95% CI) | 0.0 [‐0.36, 0.36] |
| 67 Antenatal admissions Show forest plot | 1 | 2153 | Risk Ratio (M‐H, Fixed, 95% CI) | 0.86 [0.71, 1.04] |
| 68 Length of antenatal stay (days) Show forest plot | 2 | Mean Difference (IV, Fixed, 95% CI) | Subtotals only | |
| 68.1 Antenatal stay (days) | 1 | 2153 | Mean Difference (IV, Fixed, 95% CI) | ‐0.27 [‐0.49, ‐0.05] |
| 68.2 Antenatal inpatient stay (nights), if admitted | 1 | 139 | Mean Difference (IV, Fixed, 95% CI) | 0.0 [‐1.00, 1.00] |
| 69 Neonatal intensive care unit admission Show forest plot | 4 | 4549 | Risk Ratio (M‐H, Fixed, 95% CI) | 1.03 [0.93, 1.14] |
| 70 Length of postnatal stay (mother) (days) Show forest plot | 2 | 3511 | Mean Difference (IV, Random, 95% CI) | 0.01 [‐0.14, 0.17] |
| 71 Length of postnatal stay (baby) (days) Show forest plot | 2 | 3618 | Mean Difference (IV, Fixed, 95% CI) | ‐0.35 [‐0.90, 0.20] |
| 72 Costs to families associated with the management provided (unit cost, €) Show forest plot | 1 | Mean Difference (IV, Fixed, 95% CI) | Subtotals only | |
| 72.1 Delivery cost to the patient | 1 | 93 | Mean Difference (IV, Fixed, 95% CI) | 3.0 [‐10.82, 16.82] |
| 72.2 Neonatal care cost to the patient | 1 | 93 | Mean Difference (IV, Fixed, 95% CI) | 3.00 [‐13.67, 19.67] |
| 73 Costs associated with the intervention (unit cost, €) Show forest plot | 1 | 93 | Mean Difference (IV, Fixed, 95% CI) | 769.0 [‐1032.23, 2570.23] |
| 73.1 Total costs | 1 | 93 | Mean Difference (IV, Fixed, 95% CI) | 769.0 [‐1032.23, 2570.23] |
| 74 Cost of maternal care (unit cost, €) Show forest plot | 1 | Mean Difference (IV, Fixed, 95% CI) | Subtotals only | |
| 74.1 Visits for primary health care | 1 | 93 | Mean Difference (IV, Fixed, 95% CI) | ‐43.0 [‐127.61, 41.61] |
| 74.2 Visits for specialist health care | 1 | 93 | Mean Difference (IV, Fixed, 95% CI) | ‐47.0 [‐195.33, 101.33] |
| 74.3 Visits to a diabetes nurse | 1 | 93 | Mean Difference (IV, Fixed, 95% CI) | 6.00 [‐7.02, 19.02] |
| 74.4 Visits to a dietitian | 1 | 93 | Mean Difference (IV, Fixed, 95% CI) | 0.0 [0.0, 0.0] |
| 74.5 Use of insulin/other diabetes medication | 1 | 93 | Mean Difference (IV, Fixed, 95% CI) | ‐1.0 [‐7.83, 5.83] |
| 74.6 Hospital days before and after delivery | 1 | 93 | Mean Difference (IV, Fixed, 95% CI) | 101.00 [‐206.71, 408.71] |
| 74.7 Delivery cost to the municipality | 1 | 93 | Mean Difference (IV, Fixed, 95% CI) | 22.0 [‐234.43, 278.43] |
| 74.8 Absence from work | 1 | 93 | Mean Difference (IV, Fixed, 95% CI) | 128.0 [‐1295.58, 1551.58] |
| 75 Cost of infant care (unit cost, €) Show forest plot | 1 | 93 | Mean Difference (IV, Fixed, 95% CI) | 453.0 [‐298.20, 1204.20] |
| 75.1 Neonatal care cost to municipality | 1 | 93 | Mean Difference (IV, Fixed, 95% CI) | 453.0 [‐298.20, 1204.20] |
| Outcome or subgroup title | No. of studies | No. of participants | Statistical method | Effect size |
| 1 Gestational diabetes Show forest plot | 19 | 6633 | Risk Ratio (M‐H, Random, 95% CI) | 0.85 [0.71, 1.01] |
| 1.1 Individually‐randomised | 17 | 6492 | Risk Ratio (M‐H, Random, 95% CI) | 0.84 [0.70, 1.01] |
| 1.2 Cluster‐randomised | 2 | 141 | Risk Ratio (M‐H, Random, 95% CI) | 1.05 [0.42, 2.60] |
| 2 Pre‐eclampsia Show forest plot | 8 | 5366 | Risk Ratio (M‐H, Fixed, 95% CI) | 0.98 [0.79, 1.22] |
| 2.1 Individually‐randomised | 7 | 5273 | Risk Ratio (M‐H, Fixed, 95% CI) | 0.97 [0.78, 1.21] |
| 2.2 Cluster‐randomised | 1 | 93 | Risk Ratio (M‐H, Fixed, 95% CI) | 1.24 [0.22, 7.05] |
| 3 Caesarean section Show forest plot | 14 | 6089 | Risk Ratio (M‐H, Fixed, 95% CI) | 0.95 [0.88, 1.02] |
| 3.1 Individually‐randomised | 13 | 6038 | Risk Ratio (M‐H, Fixed, 95% CI) | 0.95 [0.88, 1.02] |
| 3.2 Cluster‐randomised | 1 | 51 | Risk Ratio (M‐H, Fixed, 95% CI) | 0.71 [0.33, 1.54] |
| 4 Large‐for‐gestational age Show forest plot | 11 | 5353 | Risk Ratio (M‐H, Fixed, 95% CI) | 0.93 [0.81, 1.07] |
| 4.1 Individually‐randomised | 9 | 5209 | Risk Ratio (M‐H, Fixed, 95% CI) | 0.94 [0.82, 1.08] |
| 4.2 Cluster‐randomised | 2 | 144 | Risk Ratio (M‐H, Fixed, 95% CI) | 0.59 [0.25, 1.40] |
| Outcome or subgroup title | No. of studies | No. of participants | Statistical method | Effect size |
| 1 Gestational diabetes Show forest plot | 19 | 6633 | Risk Ratio (M‐H, Random, 95% CI) | 0.86 [0.72, 1.02] |
| 1.1 Normal weight women (BMI < 25 kg/m²) | 3 | 300 | Risk Ratio (M‐H, Random, 95% CI) | 0.91 [0.19, 4.24] |
| 1.2 Overweight or obese women (BMI ≥ 25kg/m²) | 8 | 2901 | Risk Ratio (M‐H, Random, 95% CI) | 0.77 [0.50, 1.20] |
| 1.3 Obese women (BMI ≥ 30kg/m²) | 3 | 1738 | Risk Ratio (M‐H, Random, 95% CI) | 0.96 [0.81, 1.13] |
| 1.4 Any women | 8 | 1694 | Risk Ratio (M‐H, Random, 95% CI) | 0.80 [0.63, 1.03] |
| 2 Pre‐eclampsia Show forest plot | 8 | 5366 | Risk Ratio (M‐H, Fixed, 95% CI) | 0.98 [0.79, 1.21] |
| 2.1 Normal weight women (BMI < 25 kg/m²) | 2 | 243 | Risk Ratio (M‐H, Fixed, 95% CI) | 0.34 [0.10, 1.22] |
| 2.2 Overweight or obese women (BMI ≥ 25kg/m²) | 3 | 2369 | Risk Ratio (M‐H, Fixed, 95% CI) | 1.12 [0.82, 1.54] |
| 2.3 Obese women (BMI ≥ 30kg/m²) | 2 | 1809 | Risk Ratio (M‐H, Fixed, 95% CI) | 0.92 [0.64, 1.32] |
| 2.4 Any women | 3 | 945 | Risk Ratio (M‐H, Fixed, 95% CI) | 0.94 [0.51, 1.73] |
| 3 Pregnancy‐induced hypertension or hypertension Show forest plot | 6 | 3073 | Risk Ratio (M‐H, Random, 95% CI) | 0.71 [0.41, 1.25] |
| 3.1 Underweight women | 1 | 110 | Risk Ratio (M‐H, Random, 95% CI) | 0.70 [0.26, 1.88] |
| 3.2 Normal weight women (BMI < 25 kg/m²) | 1 | 182 | Risk Ratio (M‐H, Random, 95% CI) | 0.28 [0.08, 0.97] |
| 3.3 Overweight or obese women (BMI ≥ 25kg/m²) | 5 | 2781 | Risk Ratio (M‐H, Random, 95% CI) | 0.82 [0.43, 1.58] |
| 4 Caesarean section Show forest plot | 14 | 6089 | Risk Ratio (M‐H, Fixed, 95% CI) | 0.95 [0.88, 1.02] |
| 4.1 Normal weight women (BMI < 25 kg/m²) | 3 | 300 | Risk Ratio (M‐H, Fixed, 95% CI) | 0.92 [0.58, 1.45] |
| 4.2 Overweight or obese women (BMI ≥ 25kg/m²) | 7 | 2662 | Risk Ratio (M‐H, Fixed, 95% CI) | 0.91 [0.83, 1.01] |
| 4.3 Obese women (BMI ≥ 30kg/m²) | 2 | 1826 | Risk Ratio (M‐H, Fixed, 95% CI) | 0.99 [0.87, 1.12] |
| 4.4 Any women | 5 | 1301 | Risk Ratio (M‐H, Fixed, 95% CI) | 0.98 [0.75, 1.28] |
| 5 Perinatal mortality Show forest plot | 2 | 3757 | Risk Ratio (M‐H, Fixed, 95% CI) | 0.82 [0.42, 1.63] |
| 5.1 Overweight or obese women (BMI ≥ 25kg/m²) | 1 | 2202 | Risk Ratio (M‐H, Fixed, 95% CI) | 0.99 [0.32, 3.07] |
| 5.2 Obese women (BMI ≥ 30 kg/m²) | 1 | 1555 | Risk Ratio (M‐H, Fixed, 95% CI) | 0.74 [0.31, 1.74] |
| 6 Large‐for‐gestational age Show forest plot | 11 | 5353 | Risk Ratio (M‐H, Fixed, 95% CI) | 0.93 [0.81, 1.07] |
| 6.1 Normal weight women (BMI < 25 kg/m²) | 1 | 57 | Risk Ratio (M‐H, Fixed, 95% CI) | 0.6 [0.11, 3.32] |
| 6.2 Overweight or obese women (BMI ≥ 25kg/m²) | 4 | 2385 | Risk Ratio (M‐H, Fixed, 95% CI) | 0.89 [0.76, 1.06] |
| 6.3 Obese women (BMI ≥ 30kg/m²) | 3 | 1986 | Risk Ratio (M‐H, Fixed, 95% CI) | 1.17 [0.89, 1.54] |
| 6.4 Any women | 4 | 925 | Risk Ratio (M‐H, Fixed, 95% CI) | 0.64 [0.40, 1.03] |
| Outcome or subgroup title | No. of studies | No. of participants | Statistical method | Effect size |
| 1 Gestational diabetes Show forest plot | 19 | 6633 | Risk Ratio (M‐H, Random, 95% CI) | 0.85 [0.71, 1.01] |
| 1.1 Majority 'low risk' ethnicities | 5 | 2998 | Risk Ratio (M‐H, Random, 95% CI) | 0.85 [0.50, 1.43] |
| 1.2 Majority 'high risk' ethnicities | 1 | 56 | Risk Ratio (M‐H, Random, 95% CI) | 1.07 [0.07, 16.33] |
| 1.3 Mixed ethnicities | 7 | 2123 | Risk Ratio (M‐H, Random, 95% CI) | 0.89 [0.76, 1.05] |
| 1.4 Unclear | 6 | 1456 | Risk Ratio (M‐H, Random, 95% CI) | 0.83 [0.61, 1.12] |
| 2 Pre‐eclampsia Show forest plot | 8 | 5366 | Risk Ratio (M‐H, Fixed, 95% CI) | 0.98 [0.79, 1.22] |
| 2.1 Majority 'low risk' ethnicities | 3 | 2806 | Risk Ratio (M‐H, Fixed, 95% CI) | 0.99 [0.76, 1.29] |
| 2.2 Mixed ethnicities | 2 | 1615 | Risk Ratio (M‐H, Fixed, 95% CI) | 0.96 [0.58, 1.58] |
| 2.3 Unclear | 3 | 945 | Risk Ratio (M‐H, Fixed, 95% CI) | 0.94 [0.51, 1.73] |
| 3 Pregnancy‐induced hypertension or hypertension Show forest plot | 6 | 3073 | Risk Ratio (M‐H, Random, 95% CI) | 0.78 [0.47, 1.27] |
| 3.1 Majority 'low risk' ethnicities | 5 | 2804 | Risk Ratio (M‐H, Random, 95% CI) | 0.64 [0.34, 1.17] |
| 3.2 Unclear | 1 | 269 | Risk Ratio (M‐H, Random, 95% CI) | 1.37 [0.70, 2.72] |
| 4 Caesarean section Show forest plot | 14 | 6089 | Risk Ratio (M‐H, Fixed, 95% CI) | 0.95 [0.88, 1.02] |
| 4.1 Majority 'low risk' ethnicities | 5 | 2987 | Risk Ratio (M‐H, Fixed, 95% CI) | 0.93 [0.84, 1.03] |
| 4.2 Majority 'high risk' ethnicities | 2 | 156 | Risk Ratio (M‐H, Fixed, 95% CI) | 0.87 [0.54, 1.42] |
| 4.3 Mixed ethnicities | 5 | 1986 | Risk Ratio (M‐H, Fixed, 95% CI) | 0.94 [0.82, 1.07] |
| 4.4 Unclear | 2 | 960 | Risk Ratio (M‐H, Fixed, 95% CI) | 1.15 [0.84, 1.56] |
| 5 Perinatal mortality Show forest plot | 2 | 3757 | Risk Ratio (M‐H, Fixed, 95% CI) | 0.82 [0.42, 1.63] |
| 5.1 Majority 'low risk' ethnicities | 1 | 2202 | Risk Ratio (M‐H, Fixed, 95% CI) | 0.99 [0.32, 3.07] |
| 5.2 Mixed ethnicities | 1 | 1555 | Risk Ratio (M‐H, Fixed, 95% CI) | 0.74 [0.31, 1.74] |
| 6 Large‐for‐gestational age Show forest plot | 11 | 5353 | Risk Ratio (M‐H, Fixed, 95% CI) | 0.93 [0.81, 1.07] |
| 6.1 Majority 'low risk' ethnicities | 3 | 2577 | Risk Ratio (M‐H, Fixed, 95% CI) | 0.91 [0.77, 1.07] |
| 6.2 Majority 'high risk' ethnicities | 1 | 56 | Risk Ratio (M‐H, Fixed, 95% CI) | 3.21 [0.14, 75.68] |
| 6.3 Mixed ethnicities | 5 | 2036 | Risk Ratio (M‐H, Fixed, 95% CI) | 1.05 [0.80, 1.38] |
| 6.4 Unclear | 2 | 684 | Risk Ratio (M‐H, Fixed, 95% CI) | 0.63 [0.32, 1.23] |
| Outcome or subgroup title | No. of studies | No. of participants | Statistical method | Effect size |
| 1 Gestational diabetes Show forest plot | 11 | 5019 | Risk Ratio (M‐H, Random, 95% CI) | 0.86 [0.68, 1.09] |
| 2 Pre‐eclampsia Show forest plot | 4 | 4311 | Risk Ratio (M‐H, Fixed, 95% CI) | 0.99 [0.78, 1.26] |
| 3 Pregnancy‐induced hypertension Show forest plot | 4 | 2694 | Risk Ratio (M‐H, Random, 95% CI) | 0.58 [0.27, 1.25] |
| 4 Caesarean section Show forest plot | 10 | 4968 | Risk Ratio (M‐H, Fixed, 95% CI) | 0.94 [0.87, 1.02] |
| 5 Perinatal mortality Show forest plot | 2 | 3757 | Risk Ratio (M‐H, Fixed, 95% CI) | 0.82 [0.42, 1.63] |
| 6 Large‐for‐gestational age Show forest plot | 8 | 4618 | Risk Ratio (M‐H, Fixed, 95% CI) | 0.95 [0.83, 1.09] |