Yoga para el asma
Appendices
Appendix 1. Sources and search methods for the Cochrane Airways Group Register of Trials (CAGR)
Electronic searches: core databases
| Database | Frequency of search |
| MEDLINE (Ovid) | Weekly |
| EMBASE (Ovid) | Weekly |
| CENTRAL (Cochrane Library) | Quarterly |
| PsycINFO (Ovid) | Monthly |
| CINAHL (EBSCO) | Monthly |
| AMED (EBSCO) | Monthly |
Handsearches: core respiratory conference abstracts
| Conference | Years searched |
| American Academy of Allergy, Asthma and Immunology (AAAAI) | 2001 onwards |
| American Thoracic Society (ATS) | 2001 onwards |
| Asia Pacific Society of Respirology (APSR) | 2004 onwards |
| British Thoracic Society Winter Meeting (BTS) | 2000 onwards |
| Chest Meeting | 2003 onwards |
| European Respiratory Society (ERS) | 1992, 1994, 2000 onwards |
| International Primary Care Respiratory Group Congress (IPCRG) | 2002 onwards |
| Thoracic Society of Australia and New Zealand (TSANZ) | 1999 onwards |
MEDLINE search strategy used to identify trials for the CAGR
Asthma search
1. exp Asthma/
2. asthma$.MP.
3. (antiasthma$ or anti‐asthma$).mp.
4. Respiratory Sounds/
5. wheez$.mp.
6. Bronchial Spasm/
7. bronchospas$.mp.
8. (bronch$ adj3 spasm$).mp.
9. bronchoconstrict$.mp.
10. exp Bronchoconstriction/
11. (bronch$ adj3 constrict$).mp.
12. Bronchial Hyperreactivity/
13. Respiratory Hypersensitivity/
14. ((bronchial$ or respiratory or airway$ or lung$) adj3 (hypersensitiv$ or hyperreactiv$ or allerg$ or insufficiency)).mp.
15. ((dust or mite$) adj3 (allerg$ or hypersensitiv$)).mp.
16. or/1‐15
Filter to identify randomised controlled trials (RCTs)
1. exp "clinical trial [publication type]"/
2. (randomised or randomised).ab,ti.
3. placebo.ab,ti.
4. dt.fs.
5. randomly.ab,ti.
6. trial.ab,ti.
7. groups.ab,ti.
8. or/1‐7
9. Animals/
10. Humans/
11. 9 not (9 and 10)
12. 8 not 11
The MEDLINE strategy and RCT filter are adapted to identify trials in other electronic databases.
Appendix 2. Search strategy to identify trials from the CAGR
#1 AST:MISC1
#2 MeSH DESCRIPTOR Asthma Explode All
#3 asthma*:ti,ab
#4 #1 or #2 or #3
#5 MeSH DESCRIPTOR Yoga
#6 MeSH DESCRIPTOR Mind‐Body Therapies
#7 yoga*
#8 meditat*
#9 relaxation*
#10 hatha OR ashtanga OR bikram OR iyengar OR kripalu OR kundalini OR sivananda OR vinyasa OR raja OR radja OR bhakti OR jnana OR kriya OR karma OR yama OR niyama OR asana OR pranayama OR pratyahara OR dharana OR dhyana OR samadhi OR bandha OR mudra
#11 #5 or #6 or #7 or #8 or #9 or #10
#12 #4 and #11
[Note: in search line #1, MISC1 denotes the field in which the reference has been coded for condition, in this case, asthma]
Appendix 3. AMED search strategy
1. Yoga/
2. yog*.af.
3. Meditation/
4. meditat*.af.
5. Relaxation/
6. relax*.af.
7. (hatha or ashtanga or bikram or iyengar or kripalu or kundalini or sivananda or vinyasa or raja or radja or bhakti or jnana or kriya or karma or yama or niyama or asana or pranayama or pratyahara or dharana or dhyana or samadhi or bandha or mudra).af.
8. Asthma/
9. asthma*.af.
10. wheez*.af.
11. spasm/ or respiratory tract disease/
12. bronchospas*.af.
13. (bronch* adj3 spasm*).af.
14. bronchoconstrict*.af.
15. (bronch* adj3 constrict*).af.
16. Respiratory hypersensitivity/
17. ((bronchial* or respiratory or airway* or lung*) adj3 (hypersensitiv* or hyperreactiv* or allerg* or insufficiency)).af.
18. 1 or 2 or 3 or 4 or 5 or 6 or 7
19. 8 or 9 or 10 or 11 or 12 or 13 or 14 or 15 or 16 or 17
20. 18 AND 19
Appendix 4. Raw data for analyses of standardised mean difference
| Study | Scale/Unit | Group | Baseline: mean (SD) | Post‐intervention: mean (SD) | Change from baseline: mean (SD) | Change from baseline: SD | Pre‐post difference: SD of MD | SMD (SE) | Notes |
| Analysis 1.1 (Quality of life) | |||||||||
| SGRQ | Yoga | 29.50 (17.32) | 16.01 (10.39) | ‐13.49* (‐) | ‐ | ‐ | ‐ | ‐ | |
| Control | 27.00 (5.66) | 31.85 (14.14) | 4.85* (‐) | ‐ | ‐ | ‐ | ‐ | ||
| AQLQ | Yoga | ‐ | ‐ | ‐ | ‐ | ‐ | ‐ | Medians and IQR: 0.57 (0.07 to 1.10), cannot be used for meta‐analysis | |
| Control | ‐ | ‐ | ‐ | ‐ | ‐ | ‐ | Medians and IQR: 0.61 (–0.11 to 0.95), cannot be used for meta‐analysis | ||
| AQLQ | Yoga | 4.49 (1.02) | ‐ | 0.64 (1.07) | 1.07 | ‐ | ‐ | SD of change calculated by RevMan calculator based on the difference in change from baseline between groups, its 95% CI, and the P value (0.042) from paper | |
| Control | 4.19 (0.95) | ‐ | 0.14 (1.07) | 1.07 | ‐ | ‐ | |||
| Mini AQLQ | Yoga | ‐ | ‐ | 0.57 (1.99) | 1.99 | ‐ | ‐ | ‐ | |
| Control | ‐ | ‐ | 0.35 (0.92) | 0.92 | ‐ | ‐ | ‐ | ||
| AQLQ | Yoga | 4.34 (‐) | 5.86 (‐) | 1.53 (1.07) | 1.07 | ‐ | ‐ | SD 'borrowed' from Prem 2013 | |
| Control | 3.97 (‐) | 4.37 (‐) | 0.41 (1.07) | 1.07 | ‐ | ‐ | |||
| AQLQ | Yoga | 3.99 (0.53) | 4.46 (0.61) | 0.47 (0.74) | 0.74 | ‐ | ‐ | SD of change calculated by RevMan calculator based on the change from baseline and 8 week paired t value (3.34) from paper | |
| Control | 4.05 (0.55) | 4.06 (0.69) | 0.02 (0.74) | 0.74 | ‐ | ‐ | |||
| AQLQ | Yoga | 3.72 (1.20) | 5.46 (1.10) | 1.74 (1.30) | 1.30 | ‐ | ‐ | SD of change calculated by RevMan calculator based on the change from baseline and P value (0.013) from paper | |
| Control | 3.64 (1.10) | 4.50 (1.50) | 0.86 (1.30) | 1.30 | ‐ | ‐ | |||
| Analysis 1.2 (Symptoms) | |||||||||
| Symptom score | Yoga | ‐ | ‐ | ‐ | ‐ | ‐ | ‐ | Medians and IQR: –1 (–2 to 0.75), cannot be used for meta‐analysis | |
| Control | ‐ | ‐ | ‐ | ‐ | ‐ | ‐ | Medians and IQR: 0 (–1 to 1), cannot be used for meta‐analysis | ||
| Severity score | Yoga | 1.47 (0.66) | 0.75 (0.80) | ‐0.72* (0.76) | 0.76 | ‐ | 0.18 (0.23) | SD of change, SMD, and SE of SMD calculated by RevMan calculator based on the change from baseline and the exact t values for within‐group differences (5.016 and 4.006) from the paper. The number of participants for yoga group in this analysis was 28, rather than 53, due to loss to follow‐up of 25 participants | |
| Control | 1.60 (0.75) | 1.05 (0.85) | ‐0.55* (1.00) | 1.00 | ‐ | ‐ | |||
| Log2 Doubling Increments (symptom score) | Yoga | ‐ | ‐ | ‐ | ‐ | 0.76 | ‐ | This is a geometric mean and cannot be used for meta‐analysis | |
| Control | ‐ | ‐ | ‐ | ‐ | ‐ | ‐ | |||
| Severity score | Yoga | 0.70 (0.77) | 0.50 (0.70) | ‐0.20* (0.48) | 0.48 | ‐ | 0.51 (0.19) | SD of change, SMD, and SE of SMD calculated by RevMan calculator based on the change from baseline and the t values for within‐group differences (‐3.23 and 0.77) from paper | |
| Control | 0.78 (0.80) | 0.83 (0.83) | 0.05* (0.50) | 0.50 | ‐ | ||||
| Severity score | Yoga | ‐ | ‐ | 7.00 (10.16) | 10.16 | ‐ | 0.28 (0.49) | ‐ | |
| Control | ‐ | ‐ | 1.75 (24.14) | 24.14 | ‐ | ‐ | ‐ | ||
| Asthma control (not meta‐analysed) | |||||||||
| No. of attacks | Yoga | 3.55 (2.98) | 0.83 (2.49) | ‐2.72* (1.06) | 1.06 | ‐ | ‐ | SD of change calculated by RevMan calculator based on the change from baseline, assuming a within‐group correlation coefficient of 0.94 (same as with Analysis 1.2) | |
| Control | 2.90 (3.01) | 2.10 (2.70) | ‐0.80* (1.04) | 1.04 | ‐ | ‐ | |||
| ACQ | Yoga | ‐ | ‐ | 0.13 (0.86) | 0.86 | ‐ | ‐ | Not included in meta‐analysis as ACQ and attack rate measure different things | |
| Control | ‐ | ‐ | 0.11 (0.82) | 0.82 | ‐ | ‐ | |||
| No. of attacks | Yoga | 0.53 (0.53) | 0.38 (0.48) | ‐0.15* (0.36) | 0.36 | ‐ | ‐ | SD of change calculated by RevMan calculator based on the change from baseline and the t values for within‐group differences (‐3.23 and 1.14) from paper | |
| Control | 0.53 (0.50) | 0.58 (0.53) | 0.05* (0.34) | 0.34 | ‐ | ||||
| Analysis 1.3 (FEV1) | |||||||||
| L | Yoga | ‐ | ‐ | 0.00 (0.14) | 0.14 | ‐ | ‐0.02 (0.26) | ‐ | |
| Control | ‐ | ‐ | 0.00 (0.14) | 0.14 | ‐ | ‐ | ‐ | ||
| mL | Yoga | ‐ | ‐ | 22.60 (488.78) | 488.78 | ‐ | ‐0.05 (0.41) | ‐ | |
| Control | ‐ | ‐ | 46.80 (457.95) | 457.95 | ‐ | ‐ | |||
| L | Yoga | 2.05 (0.52) | 2.62 (0.45) | 0.57 (0.49) | 0.49 | ‐ | 1.27 (0.32) | SD of change, SMD, and SE of SMD calculated by RevMan calculator based on the change from baseline, assuming a within‐group correlation coefficient of 0.5 | |
| Control | 2.24 (0.39) | 2.24 (0.39) | 0.00 (0.39) | 0.39 | ‐ | ‐ | |||
| L | Yoga | ‐ | ‐ | 0.11* (0.50) | 0.50 | ‐ | ‐0.63 (0.24) | ‐ | |
| Control | ‐ | ‐ | ‐0.17* (0.38) | 0.38 | ‐ | ‐ | |||
| L | Yoga | 2.52 (‐) | 2.96 (‐) | 0.44 (0.13) | 0.13 | ‐ | 0.37 (0.24) | ‐ | |
| Control | 2.87 (‐) | 3.19 (‐) | 0.32 (0.45) | 0.45 | ‐ | ‐ | ‐ | ||
| L | Yoga | ‐ | ‐ | ‐ | ‐ | 0.85 | 0.04 (0.33) | SD should be between 0.83 and 0.87. SMD was calculated from the SD of the baseline and final scores (cross‐over study) | |
| Control | ‐ | ‐ | ‐ | ‐ | ‐ | ‐ | |||
| L | Yoga | 2.62 (0.67) | 2.80 (0.71) | 0.18 (0.69) | 0.69 | ‐ | 0.22 (0.26) | SD of change, SMD, and SE of SMD calculated by RevMan calculator based on the change from baseline, assuming a within‐group correlation coefficient of 0.5 | |
| Control | 2.76 (0.59) | 2.80 (0.58) | 0.04 (0.59) | 0.59 | ‐ | ‐ | |||
| % of predicted | Yoga | 79.63 (10.35) | 83.16 (10.49) | 3.53 (4.35) | 4.35 | ‐ | 1.08 (0.20) | SD of change calculated by RevMan calculator based on the change from baseline and the t values for within‐group differences (6.28 and ‐0.77) from paper | |
| Control | 77.48 (9.67) | 77.26 (9.86) | ‐0.22 (2.21) | 2.21 | ‐ | ‐ | |||
| L | Yoga | 3.22 (0.68) | 3.29 (0.82) | 0.07 (0.76) | 0.76 | ‐ | ‐0.08 (0.49) | SD of change, SMD, and SE of SMD calculated by RevMan calculator based on the change from baseline, assuming a within‐group correlation coefficient of 0.5 | |
| Control | 4.02 (1.64) | 4.19 (1.05) | 0.17 (1.44) | 1.44 | ‐ | ||||
| % of predicted | Yoga | 70.20 (17.40) | 77.90 (17.20) | 7.70 (13.40) | 13.40 | ‐ | 0.71 (0.27) | SD of change calculated by RevMan calculator based on the change from baseline and P value (0.009) from paper | |
| Control | 62.50 (19.20) | 59.90 (19.10) | ‐2.60 (15.30) | 15.30 | ‐ | ||||
| Analysis 1.5 (FVC) | |||||||||
| L | Yoga | 2.55 (0.70) | 3.07 (0.54) | 0.52 (0.64) | 0.64 | ‐ | 0.89 (0.30) | SD of change, SMD, and SE of SMD calculated by RevMan calculator based on the change from baseline, assuming a within‐group correlation coefficient of 0.5 | |
| Control | 2.76 (0.53) | 2.75 (0.53) | ‐0.01 (0.53) | 0.53 | ‐ | ‐ | |||
| L | Yoga | 4.23 (‐) | 4.33 (‐) | 0.10 (0.05) | 0.05 | ‐ | 1.61 (0.28) | ‐ | |
| Control | 4.01 (‐) | 4.05 (‐) | 0.04 (0.01) | 0.01 | ‐ | ‐ | ‐ | ||
| L | Yoga | 3.23 (0.93) | 3.43 (0.93) | 0.20 (0.93) | 0.93 | ‐ | 0.17 (0.26) | SD of change, SMD, and SE of SMD calculated by RevMan calculator based on the change from baseline, assuming a within‐group correlation coefficient of 0.5 | |
| Control | 3.55 (0.79) | 3.60 (0.81) | 0.05 (0.80) | 0.80 | ‐ | ‐ | |||
| % of predicted | Yoga | 84.33 (11.05) | 86.67 (10.72) | 2.34 (2.93) | 2.93 | ‐ | 0.94 (0.19) | SD of change calculated by RevMan calculator based on the change from baseline and the t values for within‐group differences (3.69 and ‐0.51) from paper | |
| Control | 83.52 (9.77) | 83.37 (10.00) | ‐0.15 (2.28) | 2.28 | ‐ | ‐ | |||
| L | Yoga | 4.31 (1.06) | 4.51 (1.18) | 0.20 (1.12) | 1.12 | ‐ | ‐0.32 (0.49) | SD of change, SMD, and SE of SMD calculated by RevMan calculator based on the change from baseline, assuming a within‐group correlation coefficient of 0.5 | |
| Control | 4.99 (1.55) | 5.63 (1.40) | 0.64 (1.48) | 1.48 | ‐ | ‐ | |||
| % of predicted | Yoga | 78.70 (13.40) | 82.20 (10.70) | 3.50 (12.27) | 12.27 | ‐ | 0.41 (0.27) | SD of change, SMD, and SE of SMD calculated by RevMan calculator based on the change from baseline, assuming a within‐group correlation coefficient of 0.5 | |
| Control | 75.00 (15.00) | 72.50 (17.50) | ‐2.50 (16.39) | 16.39 | ‐ | ‐ | |||
| Analysis 1.6 (FEV1/FVC) | |||||||||
| % of predicted | Yoga | 75.27 (5.64) | 76.78 (5.20) | 1.51 (5.43) | 5.43 | ‐ | ‐ | SD of change calculated by RevMan calculator based on the change from baseline, assuming a within‐group correlation coefficient of 0.5 | |
| Control | 69.90 (1.80) | 70.00 (1.90) | 0.10 (1.85) | 1.85 | ‐ | ‐ | |||
| % of predicted | Yoga | ‐ | ‐ | 4.00* (9.44) | 9.44 | ‐ | ‐ | ‐ | |
| Control | ‐ | ‐ | ‐2.38* (9.58) | 9.58 | ‐ | ‐ | ‐ | ||
| % of predicted | Yoga | 64.85 (‐) | 73.96 (‐) | 9.11 (3.04) | 3.04 | ‐ | ‐ | ‐ | |
| Control | 68.42 (‐) | 75.91 (‐) | 7.49 (10.66) | 10.66 | ‐ | ‐ | ‐ | ||
| % of predicted | Yoga | 81.35 (7.08) | 82.19 (5.24) | 0.84 (6.36) | 6.36 | ‐ | ‐ | SD of change calculated by RevMan calculator based on the change from baseline, assuming a within‐group correlation coefficient of 0.5 | |
| Control | 77.32 (3.31) | 79.41 (3.56) | 2.09 (3.44) | 3.44 | ‐ | ‐ | |||
| % of predicted | Yoga | 94.15 (10.81) | 96.60 (9.67) | 2.45 (6.20) | 6.20 | ‐ | ‐ | SD of change calculated by RevMan calculator based on the change from baseline and the t values for within‐group differences (3.06 and ‐0.88) from paper | |
| Control | 93.67 (8.78) | 93.13 (8.97) | ‐0.54 (4.75) | 4.75 | ‐ | ‐ | |||
| % of predicted | Yoga | 80.40 (11.50) | 83.10 (12.20) | 2.70 (3.60) | 3.60 | ‐ | ‐ | SD of change calculated by RevMan calculator based on the change from baseline and P value (0.011) from paper | |
| Control | 73.70 (14.90) | 73.30 (13.80) | ‐0.40 (5.20) | 5.20 | ‐ | ‐ | |||
| Analysis 1.7 (PEFR) | |||||||||
| L | Yoga | 4.90 (1.08) | 6.42 (0.97) | 1.52 (1.03) | 1.03 | ‐ | 1.45 (0.33) | SD of change, SMD, and SE of SMD calculated by RevMan calculator based on the change from baseline, assuming a within‐group correlation coefficient of 0.5 | |
| Control | 4.89 (1.03) | 4.89 (1.03) | 0.00 (1.03) | 1.03 | ‐ | ||||
| L/minute | Yoga | 290.10 (93.10) | 362.80 (107.60) | 72.70 (101.13) | 101.13 | ‐ | 0.42 (0.20) | SD of change calculated by RevMan calculator based on the change from baseline and P value (0.03) from paper, assuming a within‐group correlation coefficient of 0.5 | |
| Control | 264.20 (117.20) | 290.80 (120.20) | 26.60 (118.73) | 118.73 | ‐ | ‐ | |||
| L/minute | Yoga | ‐ | ‐ | ‐ | ‐ | 96.50 | 0.14 (0.33) | SD should be between 94 and 99. SMD was calculated from the SD of the baseline and final scores (cross‐over study) | |
| Control | ‐ | ‐ | ‐ | ‐ | ‐ | ‐ | |||
| L/s | Yoga | 5.53 (1.46) | 6.41 (1.03) | 0.88 (1.30) | 1.30 | ‐ | 0.42 (0.26) | SD of change, SMD, and SE of SMD calculated by RevMan calculator based on the change from baseline, assuming a within‐group correlation coefficient of 0.5 | |
| Control | 6.00 (1.74) | 6.26 (1.48) | 0.26 (1.63) | 1.63 | ‐ | ‐ | |||
| % | Yoga | 79.81 (10.78) | 82.45 (10.17) | 2.64 (2.76) | 2.76 | ‐ | 1.22 (0.20) | SD of change, SMD, and SE of SMD calculated by RevMan calculator based on the change from baseline and the t values for within‐group differences (7.40 and ‐0.55) from paper | |
| Control | 79.53 (8.29) | 79.42 (8.26) | ‐0.11 (1.55) | 1.55 | ‐ | ‐ | |||
| L/minute | Yoga | 413.00 (48.00) | 412.00 (60.00) | ‐1.00 (54.99) | 54.99 | ‐ | 0.34 (0.49) | SD of change, SMD, and SE of SMD calculated by RevMan calculator based on the change from baseline, assuming a within‐group correlation coefficient of 0.5 | |
| Control | 420.00 (79.00) | 397.00 (48.00) | ‐23.00 (68.94) | 68.94 | ‐ | ‐ | |||
| % | Yoga | 68.60 (18.40) | 85.30 (20.70) | 16.70 (18.40) | 18.40 | ‐ | 0.93 (0.28) | SD of change, SMD, and SE of SMD calculated by RevMan calculator based on the change from baseline and P value (0.000) from paper | |
| Control | 57.40 (19.70) | 56.20 (22.00) | ‐1.20 (19.70) | 19.70 | ‐ | ‐ | |||
| Analysis 1.8 (FEF25‐75%) | |||||||||
| % of predicted | Yoga | 75.41 (10.42) | 79.50 (11.75) | 4.09 (5.85) | 5.85 | ‐ | 1.01 (0.19) | SD of change, SMD, and SE of SMD calculated by RevMan calculator based on the change from baseline and the t values for within‐group differences (5.42 and ‐1.32) from paper | |
| Control | 75.88 (10.53) | 75.56 (10.84) | ‐0.32 (1.88) | 1.88 | ‐ | ‐ | |||
| L/s | Yoga | 2.95 (1.26) | 2.57 (0.98) | ‐0.38 (1.15) | 1.15 | ‐ | ‐0.61 (0.50) | SD of change, SMD, and SE of SMD calculated by RevMan calculator based on the change from baseline, assuming a within‐group correlation coefficient of 0.5 | |
| Control | 3.11 (1.30) | 3.64 (1.86) | 0.53 (1.65) | 1.65 | ‐ | ‐ | |||
| % of predicted | Yoga | 38.40 (14.60) | 45.00 (19.70) | 6.60 (14.60) | 14.60 | ‐ | 0.57 (0.27) | SD of change, SMD, and SE of SMD calculated by RevMan calculator based on the change from baseline and P value (0.035) from paper | |
| Control | 34.00 (18.30) | 31.10 (17.10) | ‐2.90 (18.40) | 18.40 | ‐ | ‐ | |||
| Analysis 1.9 (Medication usage) | |||||||||
| Puffs/day (beta2 agonist) | Yoga | ‐ | ‐ | ‐ | ‐ | ‐ | ‐ | Medians and IQR: 0 (‐2 to 0), cannot be used for meta‐analysis | |
| Control | ‐ | ‐ | ‐ | ‐ | ‐ | ‐ | Medians and IQR: 0 (‐2 to 0), cannot be used for meta‐analysis | ||
| Drug treatment score (bronchodilators) | Yoga | 10.26 (13.16) | 2.08 (4.09) | ‐8.18* (11.67) | 11.67 | ‐ | 0.94 (0.21) | SD of change, SMD, and SE of SMD calculated by RevMan calculator based on the change from baseline and P values for within‐group and between‐group differences, assuming a within‐group correlation coefficient of 0.5 | |
| Control | 6.22 (7.18) | 7.90 (9.90) | 1.68* (8.86) | 8.86 | ‐ | ‐ | |||
| Times/day (rescue inhaler use) | Yoga | ‐ | ‐ | ‐0.31* (2.15) | 2.15 | ‐ | 0.43 (0.26) | ‐ | |
| Control | ‐ | ‐ | 0.45* (1.26) | 1.26 | ‐ | ‐ | ‐ | ||
| Log2 Doubling Increments (inhaler use) | Yoga | ‐ | ‐ | ‐ | ‐ | 0.55 | ‐ | This is a geometric mean and cannot be used for meta‐analysis | |
| Control | ‐ | ‐ | ‐ | ‐ | ‐ | ‐ | |||
| Puffs/day (beta2 agonist) | Yoga | 2.25 (1.55) | 0.81 (1.03) | ‐1.44* (1.36) | 1.36 | ‐ | 0.55 (0.27) | SD of change, SMD, and SE of SMD calculated by RevMan calculator based on the change from baseline, assuming a within‐group correlation coefficient of 0.5 | |
| Control | 2.00 (2.11) | 1.56 (2.19) | ‐0.44* (2.15) | 2.15 | ‐ | ‐ | |||
| Analysis 1.10 (Medication usage) | |||||||||
| Proportion of participants with reduced use of salbutamol tablet | Yoga | 7 (numerator) | 12 (denominator) | ‐ | ‐ | ‐ | ‐ | ‐ | |
| Control | 1 (numerator) | 12 (denominator) | ‐ | ‐ | ‐ | ‐ | ‐ | ||
| Proportion of participants with reduced use of 4 types of drugs | Yoga | 3 (numerator) | 11 (denominator) | ‐ | ‐ | ‐ | ‐ | ‐ | |
| Control | 1 (numerator) | 13 (denominator) | ‐ | ‐ | ‐ | ‐ | ‐ | ||
| Footnotes: ACQ: asthma control questionnaire; AQLQ: asthma quality of life questionnaire; CI: confidence interval; IQR: interquartile range; MD: mean difference; SD: standard deviation; SE: standard error; SGRQ: St George's respiratory questionnaire; SMD: standardised mean difference. | |||||||||
| *smaller value represents better outcome | |||||||||

Risk of bias summary: review authors' judgements about each risk of bias item for each included study.

![Forest plot of comparison: 1 Yoga vs usual care/sham intervention, outcome: 1.1 Change in AQLQ score [7 pt scale].](/cdsr/doi/10.1002/14651858.CD010346.pub2/media/CDSR/CD010346/image_n/nCD010346-AFig-FIG03.png)
Forest plot of comparison: 1 Yoga vs usual care/sham intervention, outcome: 1.1 Change in AQLQ score [7 pt scale].

Forest plot of comparison: 1 Yoga vs usual care/sham intervention, outcome: 1.2 Asthma symptom.
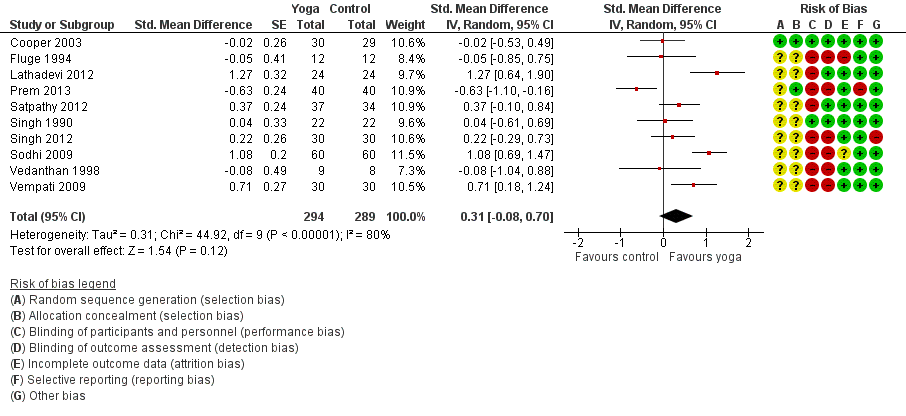
Forest plot of comparison: 1 Yoga vs usual care/sham intervention, outcome: 1.3 FEV1.
![Forest plot of comparison: 1 Yoga vs usual care/sham intervention, outcome: 1.4 FEV1 change from baseline [litres].](/cdsr/doi/10.1002/14651858.CD010346.pub2/media/CDSR/CD010346/image_n/nCD010346-AFig-FIG06.png)
Forest plot of comparison: 1 Yoga vs usual care/sham intervention, outcome: 1.4 FEV1 change from baseline [litres].

Comparison 1 Yoga vs usual care/sham intervention, Outcome 1 Change in AQLQ score.
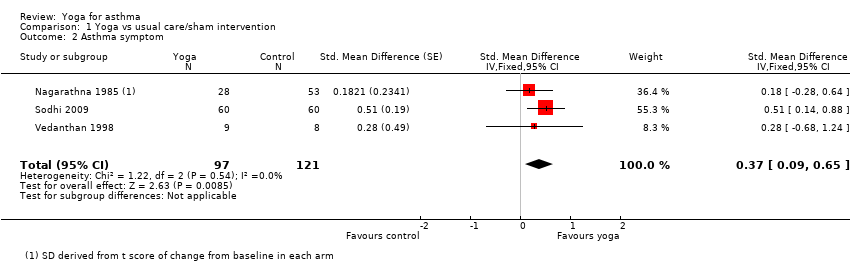
Comparison 1 Yoga vs usual care/sham intervention, Outcome 2 Asthma symptom.

Comparison 1 Yoga vs usual care/sham intervention, Outcome 3 FEV1.

Comparison 1 Yoga vs usual care/sham intervention, Outcome 4 FEV1 change from baseline.

Comparison 1 Yoga vs usual care/sham intervention, Outcome 5 FVC.

Comparison 1 Yoga vs usual care/sham intervention, Outcome 6 FEV1/FVC.

Comparison 1 Yoga vs usual care/sham intervention, Outcome 7 PEFR.

Comparison 1 Yoga vs usual care/sham intervention, Outcome 8 FEF25‐75%.
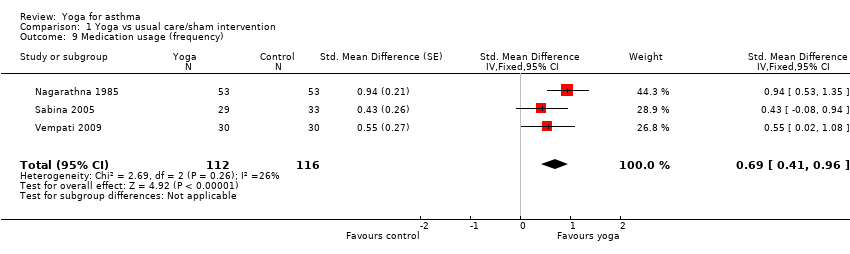
Comparison 1 Yoga vs usual care/sham intervention, Outcome 9 Medication usage (frequency).
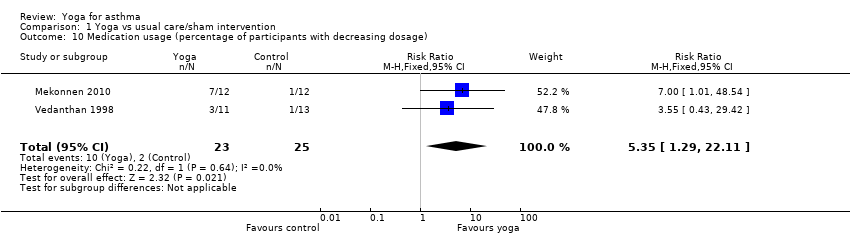
Comparison 1 Yoga vs usual care/sham intervention, Outcome 10 Medication usage (percentage of participants with decreasing dosage).
| Yoga compared with usual care or sham intervention for asthma | ||||||
| Patient or population: People with asthma (mostly mild or moderate) Settings: Outpatient clinic and at home (studies conducted in Ethiopia, Germany, India, UK, and USA) Intervention: Yoga (duration no more than 6 months on average; range 2 weeks to 54 months) Comparison: Usual care or sham intervention | ||||||
| Outcomes | Illustrative comparative risks* (95% CI) | Relative effect | No of Participants | Quality of the evidence | Comments | |
| Assumed risk | Corresponding risk | |||||
| Usual care or sham intervention | Yoga | |||||
| Quality of life (Asthma Quality of Life Questionnaire, with 32 items, 0 to 7 points per item) | The mean points per item of Asthma Quality of Life Questionnaire ranged from 4.06 to 4.50 points across control groups | The mean change from baseline in the intervention groups was on average 0.57 units higher (95% CI 0.37 to 0.77) | ‐ | 375 (5) | ⊕⊕⊕⊖ moderate1 | Minimal clinically important difference: 0.5 |
| Asthma symptoms (different severity scores; change from baseline) | The mean severity score ranged from 0.83 to 1.05 points across control groups on different scales | The mean severity score in the intervention groups was on average 0.37 SD units lower (95% CI 0.09 to 0.65) | ‐ | 243 (3) | ⊕⊕⊕⊖ moderate2 | Lower score indicates improvement Nagarathna 1985 and Sodhi 2009a used a 3‐point scoring system for severity of asthma symptoms from 1 (mild) to 3 (severe) Vedanthan 1998 used a 5‐point scoring system from A (no symptoms) to E (very severe symptoms). No established minimal clinically important difference in these scores is available |
| Asthma control (weekly number of attacks) | The mean weekly number of attacks ranged cross control groups from 0.58 to 2.10 | See comment | ‐ | 226 (2) | ⊕⊕⊖⊖ low3 | Two studies showed benefit, but the results were not combined due to very high heterogeneity between them |
| Forced expiratory volume in one second (change from baseline FEV1 (L)) | The mean FEV1 ranged across control groups from 2.24 to 4.19 L | The mean FEV1 in the intervention groups was on average 0.04 L higher (95% CI ‐0.10 to 0.19) | ‐ | 340 (7) | ⊕⊖⊖⊖ very low4 | ‐ |
| Reduced asthma medication usage | 8 per 100 | 43 per 100 (11 to 100) | RR 5.35 (1.29 to 22.11) | 48 (2) | ⊕⊕⊖⊖ low5 | ‐ |
| Adverse events | ‐ | ‐ | ‐ | 108 (3) | ⊕⊖⊖⊖ very low6 | Fluge 1994 reported 3 participants from the control group required oral steroids treatment due to acute exacerbations of their asthma, as compared with none in the yoga group. Sabina 2005 reported no adverse events associated with yoga or the control. In Singh 1990, 1 participant in the yoga group reported mild dyspnoea during yoga using the Pink City Lung Exerciser |
| *The basis for the assumed risk (e.g. the median control group risk across studies) is provided in footnotes. The corresponding risk (and its 95% confidence interval) is based on the assumed risk in the comparison group and the relative effect of the intervention (and its 95% CI). | ||||||
| GRADE Working Group grades of evidence | ||||||
| 1Downgraded once for study limitations; four out of five studies contributing to this outcome are at high risk of performance and detection bias, and one study is at high risk of attrition bias (see Figure 1). 2Downgraded once for study limitations; all three studies contributing to this outcome are at high risk of performance and detection bias, and one study is at high risk of selection bias (see Figure 1). 3Downgraded for (1) study limitations: both studies contributing to this outcome are at high risk of performance and detection bias, and one study is also at high risk of selection bias (see Figure 1), and (2) inconsistency: the studies could not be combined in a meta‐analysis due to very high levels of heterogeneity. 4Downgraded for (1) study limitations: six out of the seven studies contributing to this outcome are at unclear risk of selection bias (see Figure 1), (2) inconsistency: we detected substantial heterogeneity (I² = 68%) in the meta‐analysis, and (3) imprecision: the confidence intervals include both the possibility of harm or benefit of the intervention. 5Downgraded for (1) study limitations: both studies contributing to this outcome are at high risk of performance and detection bias and at unclear risk of selection bias, and one study is at high risk of other biases (see Figure 1), and (2) imprecision: despite the confidence intervals excluding no difference, the breadth of the confidence intervals and the small numbers of participants in the analysis reduces our confidence in the estimate. 6Downgraded for (1) study limitations: one study reporting adverse events is at high risk of performance, detection, and attrition bias, another is at high risk of attrition and reporting bias, and a third is at unclear risk of selection bias (see Figure 1), (2) imprecision: the very small number of studies reporting very rare events reduced our confidence in this outcome, and (3) potential publication bias due to no mention of adverse events (which were specified explicitly as one of the outcomes of interest in their research protocol) in Prem 2013. We decided not to pool these results. | ||||||
| Outcome or subgroup title | No. of studies | No. of participants | Statistical method | Effect size |
| 1 Change in AQLQ score Show forest plot | 5 | 375 | Mean Difference (IV, Fixed, 95% CI) | 0.57 [0.37, 0.77] |
| 1.1 Yoga breathing alone vs. control | 2 | 196 | Mean Difference (IV, Fixed, 95% CI) | 0.46 [0.23, 0.69] |
| 1.2 Combination of yoga breathing, postures and meditation vs. control | 3 | 179 | Mean Difference (IV, Fixed, 95% CI) | 0.85 [0.47, 1.22] |
| 2 Asthma symptom Show forest plot | 3 | 218 | Std. Mean Difference (Fixed, 95% CI) | 0.37 [0.09, 0.65] |
| 3 FEV1 Show forest plot | 10 | 583 | Std. Mean Difference (Random, 95% CI) | 0.31 [‐0.08, 0.70] |
| 4 FEV1 change from baseline Show forest plot | 7 | 340 | Mean Difference (IV, Random, 95% CI) | 0.04 [‐0.10, 0.19] |
| 5 FVC Show forest plot | 6 | 376 | Std. Mean Difference (Random, 95% CI) | 0.67 [0.20, 1.14] |
| 6 FEV1/FVC Show forest plot | 6 | 435 | Mean Difference (IV, Random, 95% CI) | 0.62 [‐1.63, 2.87] |
| 7 PEFR Show forest plot | 7 | 455 | Std. Mean Difference (Random, 95% CI) | 0.73 [0.36, 1.09] |
| 8 FEF25‐75% Show forest plot | 3 | 197 | Std. Mean Difference (Random, 95% CI) | 0.45 [‐0.28, 1.19] |
| 9 Medication usage (frequency) Show forest plot | 3 | 228 | Std. Mean Difference (Fixed, 95% CI) | 0.69 [0.41, 0.96] |
| 10 Medication usage (percentage of participants with decreasing dosage) Show forest plot | 2 | 48 | Risk Ratio (M‐H, Fixed, 95% CI) | 5.35 [1.29, 22.11] |