Administración de suplementos de ácidos grasos poliinsaturados a los lactantes para la prevención de la alergia
Appendices
Appendix 1. CENTRAL search strategy
All MeSH terms exploded
#1 MeSH descriptor: (Infant)
#2 neonat*:ti,ab,kw
#3 infant*:ti,ab,kw
#4 newborn*:ti,ab,kw
#5 pediatric*:ti,ab,kw
#6 paediatric*:ti,ab,kw
#7 #1 or #2 or #3 or #4 or #5 or #6
#8 MeSH descriptor: [Fatty Acids, Unsaturated]
#9 MeSH descriptor: [Fatty Acids, Omega‐3]
#10 MeSH descriptor: [Fatty Acids, Omega‐6]
#11 MeSH descriptor: [Dietary Fats, Unsaturated]
#12 MeSH descriptor: [Linolenic Acids]
#13 MeSH descriptor: [Linoleic Acids]
#14 MeSH descriptor: [Docosahexaenoic Acids]
#15 MeSH descriptor: [Eicosapentaenoic Acid]
#16 pufa:ti,ab,kw
#17 polyunsaturated*:ti,ab,kw
#18 omega‐3:ti,ab,kw
#19 omega‐6:ti,ab,kw
#20 linolenic*:ti,ab,kw
#21 linoleic*:ti,ab,kw
#22 docosahexaenoic*:ti,ab,kw
#23 eicosapentaenoic*:ti,ab,kw
#24 #8 or #9 or #10 or #11 or #12 or #13 or #14 or #15 or #16 or #17 or #18 or #19 or #20 or #21 or #22 or #23
#25 #7 and #24=1079 records
Appendix 2. MEDLINE search strategy
All MeSH terms exploded
1. infant$.mp
2. infant.me
3. newborn$.mp
4. neonat$.mp
5. pediatric$.mp
6. paediatric$.mp
7. #1 OR #2 OR #3 OR #4 OR #5 OR #6
8. PUFA.mp
9. polyunsaturated$.mp
10. fatty acids, unsaturated.me
11. dietary fats, unsaturated.me
12. omega‐3.mp
13. fatty acids, omega‐3.me
14. omega‐6.mp
15. fatty acids, omega‐6.me
16. linolenic$.mp
17. linolenic acids.me
18. linoleic$.mp
19. linoleic acid.me
20. docosahexaenoic$.mp
21. docosahexaenoic acids.me
22. eicosapentaenoic$.mp
23. eicosapentaenoic acid.me
24. #8 OR #9 OR #10 OR #11 OR #12 OR #13 OR #14 OR #15 OR #16 OR #17 OR #18 OR #19 OR #20 OR #22 OR #23
25. #7 AND #24
26. limit 25 to 'randomised controlled trial'=875 records
Appendix 3. EMBASE search strategy
All MeSH terms exploded
1. infant$.mp
2. newborn$.mp
3. neonat$.mp
4. pediatric$.mp
5. paediatric$.mp
6. exp pediatrics
7. #1 OR #2 OR #3 OR #4 OR #5 OR #6
8. PUFA.mp
9. polyunsaturated$.mp
10. exp polyunsaturated fatty acid
11. exp unsaturated fatty acid
12. omega‐3.mp
13. exp omega 3 fatty acid
14. omega‐6.mp
15. exp omega 6 fatty acid
16. linolenic$.mp
17.exp linolenic acid
18. linoleic$.mp
19.exp linoleic acid
20. docosahexaenoic$.mp
21. exp docosahexaenoic acid
22. eicosapentaenoic$.mp
23. exp icosapentaenoic acid
24. exp fish oil
25. #8 OR #9 OR #10 OR #11 OR #12 OR #13 OR #14 OR #15 OR #16 OR #17 OR #18 OR #19 OR #20 OR #21 OR #22 OR #23 OR #24
26. #7 AND #25
27. limit 41 to 'randomised controlled trial'
Appendix 4. Risk of bias tool
1. Sequence generation (checking for possible selection bias)
For each included study, we described the method used to generate the allocation sequence in sufficient detail to allow an assessment of whether it should produce comparable groups. We assessed the method as:
-
low risk (any truly random process, e.g. random number table; computer random number generator);
-
high risk (any non‐random process, e.g. odd or even date of birth; hospital or clinic record number);
-
unclear risk.
2. Allocation concealment (checking for possible selection bias)
For each included study, we described the method used to conceal the allocation sequence in sufficient detail and determined whether intervention allocation could have been foreseen in advance of, or during recruitment, or changed after assignment.
We assessed the methods as:
-
low risk (e.g. telephone or central randomisation; consecutively numbered sealed opaque envelopes);
-
high risk (open random allocation; unsealed or non‐opaque envelopes, alternation; date of birth);
-
unclear risk.
3. Blinding of participants and personnel (checking for possible performance bias)
For each included study, we described the methods used, if any, to blind study participants and personnel from knowledge of which intervention a participant received. We judged studies to be at low risk of bias if they were blinded, or if we judged that the lack of blinding could not have affected the results.
We assessed the methods as:
-
low risk, high risk or unclear risk for participants;
-
low risk, high risk or unclear risk for personnel.
4. Blinding of outcome assessment (checking for possible detection bias)
For each included study, we described the methods used, if any, to blind outcome assessors from knowledge of which intervention a participant received. We judged studies to be at low risk of bias if they were blinded, or if we judged that the lack of blinding could not have affected the results.
We assessed the methods as:
-
low risk, high risk or unclear risk for blinding of outcome assessors.
5. Incomplete outcome data (checking for possible attrition bias through withdrawals, drop‐outs, protocol deviations)
For each included study and for each outcome or class of outcomes, we described the completeness of data including attrition and exclusions from the analysis. We stated whether attrition and exclusions were reported, the numbers included in the analysis at each stage (compared with the total randomised participants), reasons for attrition or exclusion where reported, and whether missing data were balanced across groups or were related to outcomes.
Where sufficient information was reported or could be supplied by the trial authors, we included missing data in the analyses. We assessed the methods as:
-
low risk (< 10% missing data);
-
high risk;
-
unclear risk.
6. Outcome reporting bias
For each included study, we assessed the possibility of selective outcome reporting bias by assessing the reported methodology in the trial publication and, when necessary, compared with the entry in the clinical trial registries, the original trial protocols, or both obtained by contacting study authors.
We assessed the methods as:
-
low risk (where it was clear that all of the study's prespecified outcomes and all expected outcomes of interest to the review were reported);
-
high risk (where not all the study's prespecified outcomes were reported; one or more reported primary outcomes were not prespecified; outcomes of interest were reported incompletely and so could not be used; study did not include results of a key outcome that would have been expected to have been reported);
-
unclear risk.
7. Other sources of bias
For each included study, we described any important concern we had about other possible sources of bias. We assessed whether each study was free of other problems that could put it at risk of bias. We assessed the methods as:
-
low risk;
-
high risk;
-
unclear risk.
Overall risk of bias
We made explicit judgements about whether studies were at high risk of bias, according to the criteria given in the Cochrane Handbook for Systematic Reviews of Interventions (Higgins 2011). With reference to 1. to 7. above, we assessed the likely magnitude and direction of the bias and whether we considered it was likely to impact on the findings. We explored the impact of the level of bias through undertaking sensitivity analyses ‐ see Sensitivity analysis.

Risk of bias summary: review authors' judgements about each risk of bias item for each included study.
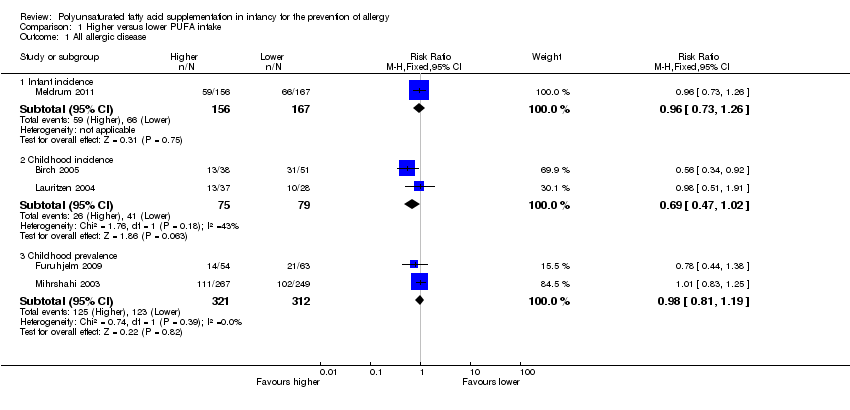
Comparison 1 Higher versus lower PUFA intake, Outcome 1 All allergic disease.

Comparison 1 Higher versus lower PUFA intake, Outcome 2 Asthma.
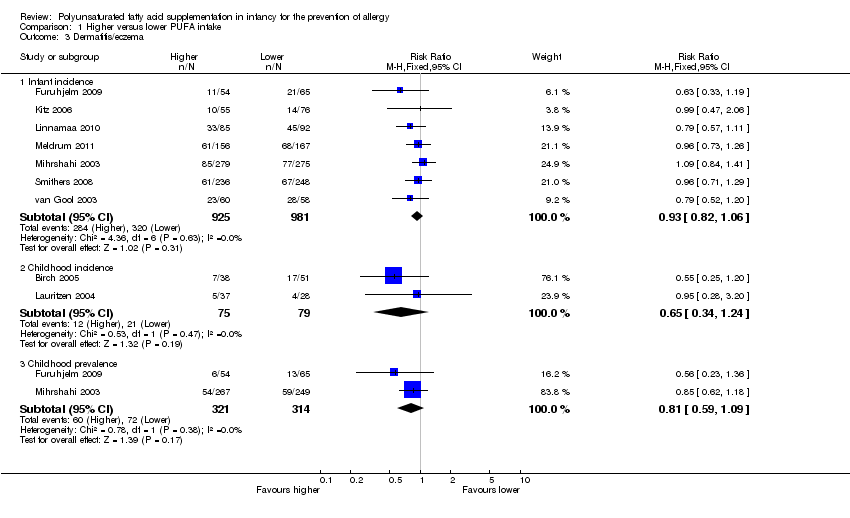
Comparison 1 Higher versus lower PUFA intake, Outcome 3 Dermatitis/eczema.
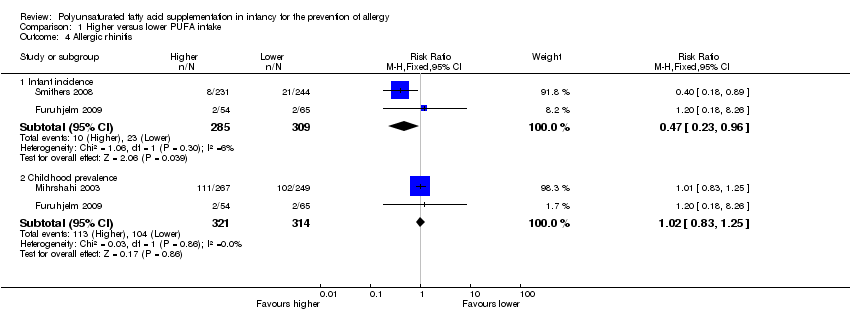
Comparison 1 Higher versus lower PUFA intake, Outcome 4 Allergic rhinitis.

Comparison 1 Higher versus lower PUFA intake, Outcome 5 Food allergy.
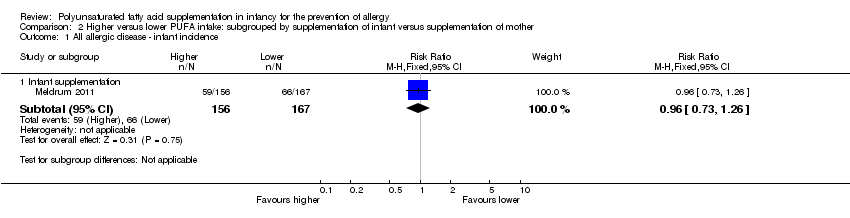
Comparison 2 Higher versus lower PUFA intake: subgrouped by supplementation of infant versus supplementation of mother, Outcome 1 All allergic disease ‐ infant incidence.

Comparison 2 Higher versus lower PUFA intake: subgrouped by supplementation of infant versus supplementation of mother, Outcome 2 All allergic disease ‐ childhood incidence.

Comparison 2 Higher versus lower PUFA intake: subgrouped by supplementation of infant versus supplementation of mother, Outcome 3 All allergic disease ‐ childhood prevalence.

Comparison 2 Higher versus lower PUFA intake: subgrouped by supplementation of infant versus supplementation of mother, Outcome 4 Asthma ‐ infant incidence.

Comparison 2 Higher versus lower PUFA intake: subgrouped by supplementation of infant versus supplementation of mother, Outcome 5 Asthma ‐ childhood incidence.

Comparison 2 Higher versus lower PUFA intake: subgrouped by supplementation of infant versus supplementation of mother, Outcome 6 Asthma ‐ childhood prevalence.

Comparison 2 Higher versus lower PUFA intake: subgrouped by supplementation of infant versus supplementation of mother, Outcome 7 Dermatitis/eczema ‐ infant incidence.
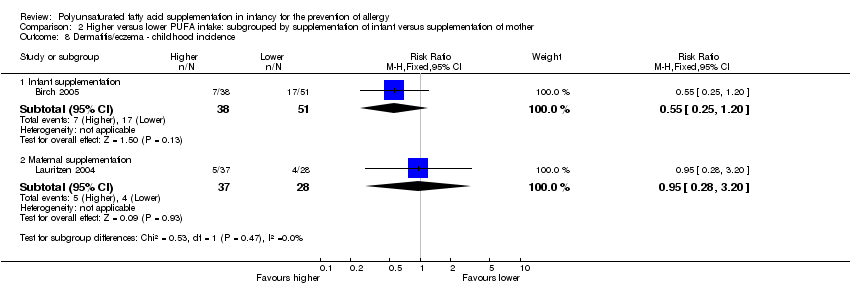
Comparison 2 Higher versus lower PUFA intake: subgrouped by supplementation of infant versus supplementation of mother, Outcome 8 Dermatitis/eczema ‐ childhood incidence.

Comparison 2 Higher versus lower PUFA intake: subgrouped by supplementation of infant versus supplementation of mother, Outcome 9 Dermatitis/eczema ‐ childhood prevalence.

Comparison 2 Higher versus lower PUFA intake: subgrouped by supplementation of infant versus supplementation of mother, Outcome 10 Allergic rhinitis ‐ infant incidence.

Comparison 2 Higher versus lower PUFA intake: subgrouped by supplementation of infant versus supplementation of mother, Outcome 11 Allergic rhinitis ‐ childhood prevalence.

Comparison 2 Higher versus lower PUFA intake: subgrouped by supplementation of infant versus supplementation of mother, Outcome 12 Food allergy ‐ infant incidence.

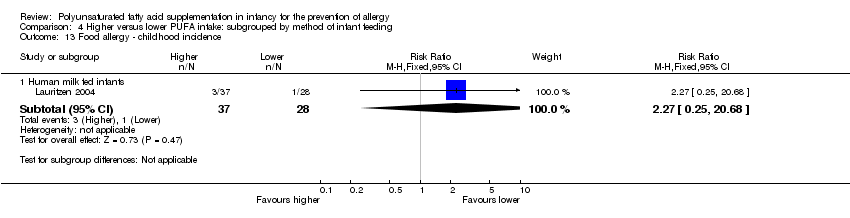
Comparison 2 Higher versus lower PUFA intake: subgrouped by supplementation of infant versus supplementation of mother, Outcome 13 Food allergy ‐ childhood incidence.

Comparison 2 Higher versus lower PUFA intake: subgrouped by supplementation of infant versus supplementation of mother, Outcome 14 Food allergy ‐ childhood prevalence.
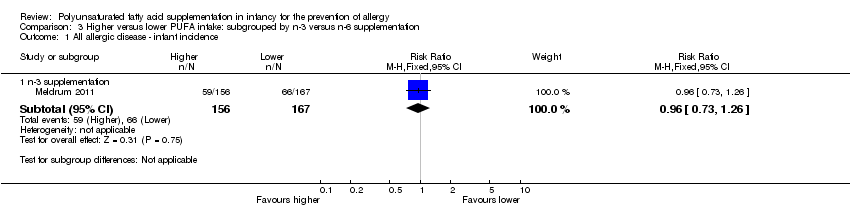
Comparison 3 Higher versus lower PUFA intake: subgrouped by n‐3 versus n‐6 supplementation, Outcome 1 All allergic disease ‐ infant incidence.

Comparison 3 Higher versus lower PUFA intake: subgrouped by n‐3 versus n‐6 supplementation, Outcome 2 All allergic disease ‐ childhood incidence.

Comparison 3 Higher versus lower PUFA intake: subgrouped by n‐3 versus n‐6 supplementation, Outcome 3 All allergic disease ‐ childhood prevalence.

Comparison 3 Higher versus lower PUFA intake: subgrouped by n‐3 versus n‐6 supplementation, Outcome 4 Asthma ‐ infant incidence.
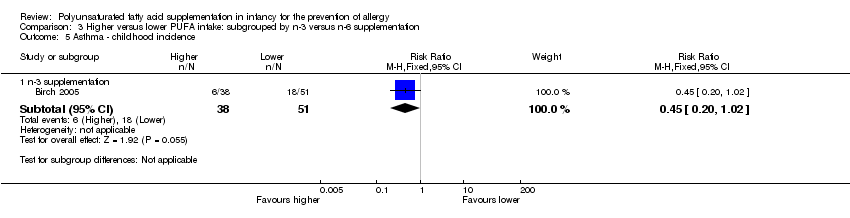
Comparison 3 Higher versus lower PUFA intake: subgrouped by n‐3 versus n‐6 supplementation, Outcome 5 Asthma ‐ childhood incidence.

Comparison 3 Higher versus lower PUFA intake: subgrouped by n‐3 versus n‐6 supplementation, Outcome 6 Asthma ‐ childhood prevalence.
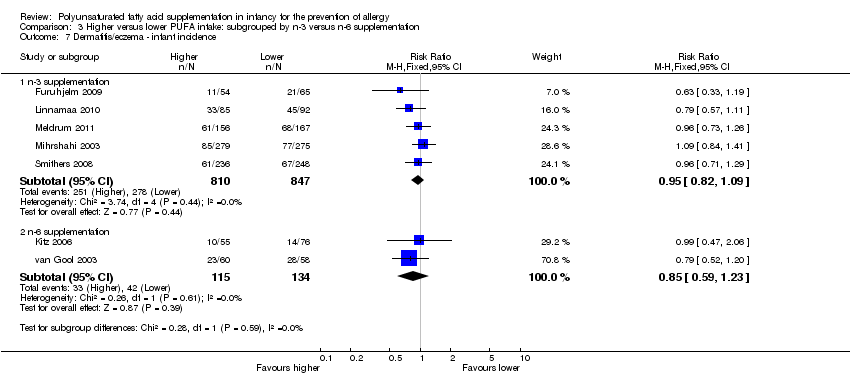
Comparison 3 Higher versus lower PUFA intake: subgrouped by n‐3 versus n‐6 supplementation, Outcome 7 Dermatitis/eczema ‐ infant incidence.
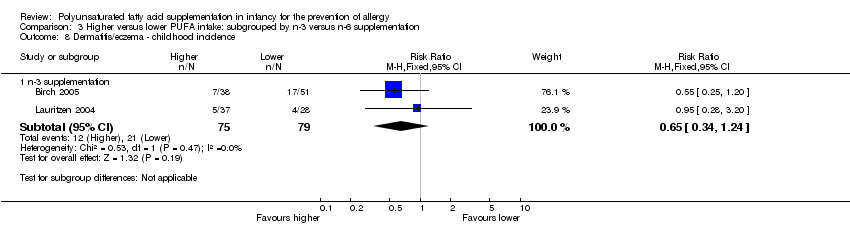
Comparison 3 Higher versus lower PUFA intake: subgrouped by n‐3 versus n‐6 supplementation, Outcome 8 Dermatitis/eczema ‐ childhood incidence.
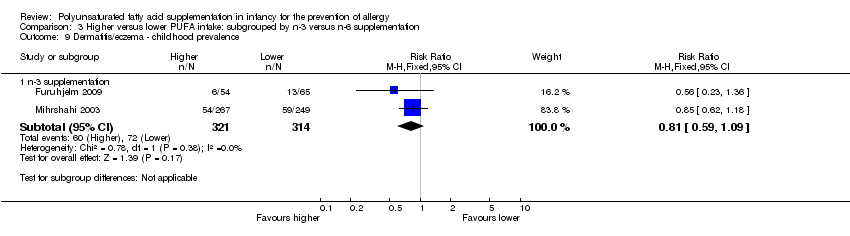
Comparison 3 Higher versus lower PUFA intake: subgrouped by n‐3 versus n‐6 supplementation, Outcome 9 Dermatitis/eczema ‐ childhood prevalence.
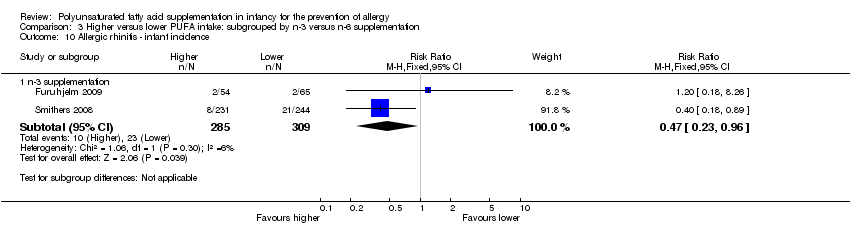
Comparison 3 Higher versus lower PUFA intake: subgrouped by n‐3 versus n‐6 supplementation, Outcome 10 Allergic rhinitis ‐ infant incidence.

Comparison 3 Higher versus lower PUFA intake: subgrouped by n‐3 versus n‐6 supplementation, Outcome 11 Allergic rhinitis ‐ childhood prevalence.

Comparison 3 Higher versus lower PUFA intake: subgrouped by n‐3 versus n‐6 supplementation, Outcome 12 Food allergy ‐ infant incidence.
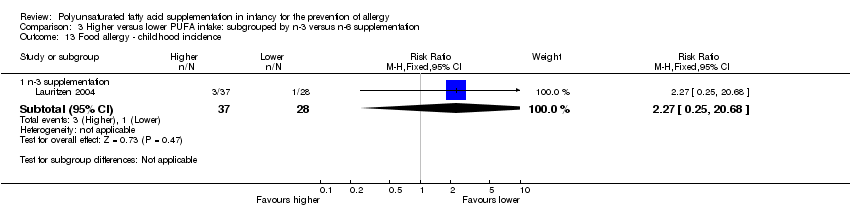
Comparison 3 Higher versus lower PUFA intake: subgrouped by n‐3 versus n‐6 supplementation, Outcome 13 Food allergy ‐ childhood incidence.

Comparison 3 Higher versus lower PUFA intake: subgrouped by n‐3 versus n‐6 supplementation, Outcome 14 Food allergy ‐ childhood prevalence.

Comparison 4 Higher versus lower PUFA intake: subgrouped by method of infant feeding, Outcome 1 All allergic disease ‐ infant incidence.

Comparison 4 Higher versus lower PUFA intake: subgrouped by method of infant feeding, Outcome 2 All allergic disease ‐ childhood incidence.
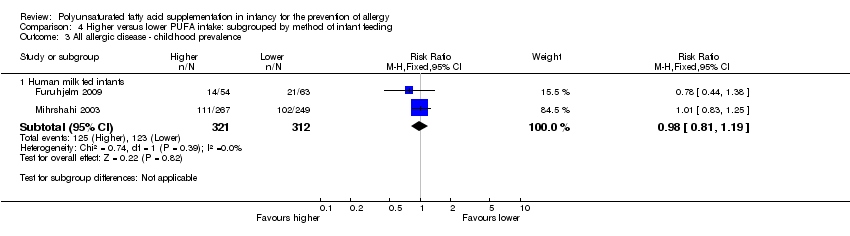
Comparison 4 Higher versus lower PUFA intake: subgrouped by method of infant feeding, Outcome 3 All allergic disease ‐ childhood prevalence.
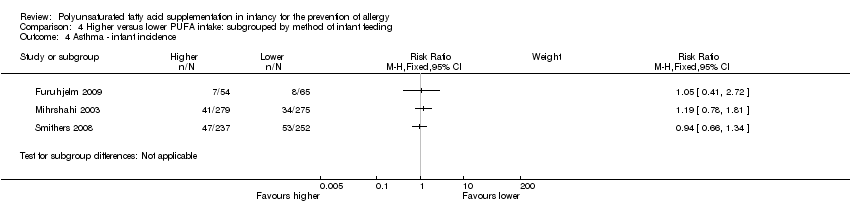
Comparison 4 Higher versus lower PUFA intake: subgrouped by method of infant feeding, Outcome 4 Asthma ‐ infant incidence.

Comparison 4 Higher versus lower PUFA intake: subgrouped by method of infant feeding, Outcome 5 Asthma ‐ childhood incidence.
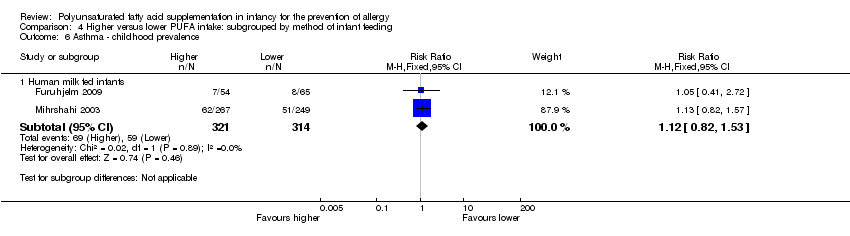
Comparison 4 Higher versus lower PUFA intake: subgrouped by method of infant feeding, Outcome 6 Asthma ‐ childhood prevalence.

Comparison 4 Higher versus lower PUFA intake: subgrouped by method of infant feeding, Outcome 7 Dermatitis/eczema ‐ infant incidence.

Comparison 4 Higher versus lower PUFA intake: subgrouped by method of infant feeding, Outcome 8 Dermatitis/eczema ‐ childhood incidence.

Comparison 4 Higher versus lower PUFA intake: subgrouped by method of infant feeding, Outcome 9 Dermatitis/eczema ‐ childhood prevalence.

Comparison 4 Higher versus lower PUFA intake: subgrouped by method of infant feeding, Outcome 10 Allergic rhinitis ‐ infant incidence.
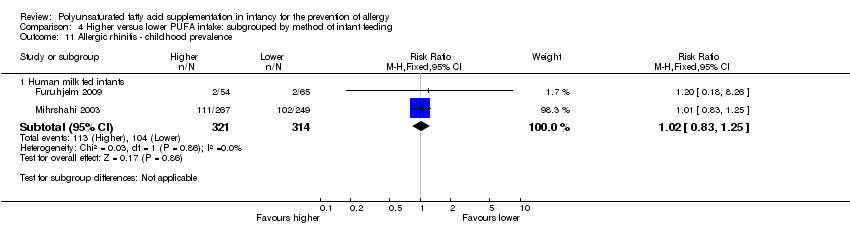
Comparison 4 Higher versus lower PUFA intake: subgrouped by method of infant feeding, Outcome 11 Allergic rhinitis ‐ childhood prevalence.

Comparison 4 Higher versus lower PUFA intake: subgrouped by method of infant feeding, Outcome 12 Food allergy ‐ infant incidence.
Comparison 4 Higher versus lower PUFA intake: subgrouped by method of infant feeding, Outcome 13 Food allergy ‐ childhood incidence.

Comparison 4 Higher versus lower PUFA intake: subgrouped by method of infant feeding, Outcome 14 Food allergy ‐ childhood prevalence.

Comparison 5 Higher versus lower PUFA intake: subgrouped by infant heredity for allergy, Outcome 1 All allergic disease ‐ infant incidence.

Comparison 5 Higher versus lower PUFA intake: subgrouped by infant heredity for allergy, Outcome 2 All allergic disease ‐ childhood incidence.

Comparison 5 Higher versus lower PUFA intake: subgrouped by infant heredity for allergy, Outcome 3 All allergic disease ‐ childhood prevalence.

Comparison 5 Higher versus lower PUFA intake: subgrouped by infant heredity for allergy, Outcome 4 Asthma ‐ infant incidence.
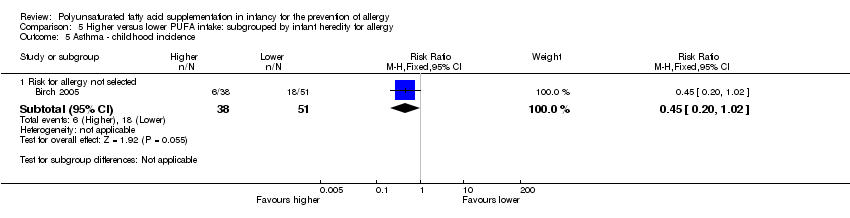
Comparison 5 Higher versus lower PUFA intake: subgrouped by infant heredity for allergy, Outcome 5 Asthma ‐ childhood incidence.

Comparison 5 Higher versus lower PUFA intake: subgrouped by infant heredity for allergy, Outcome 6 Asthma ‐ childhood prevalence.
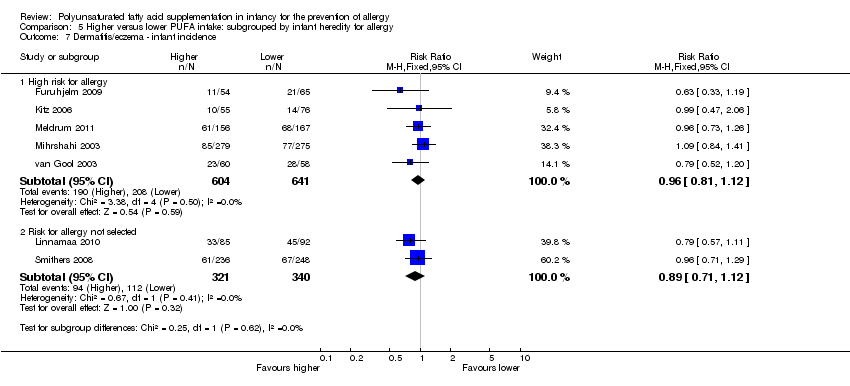
Comparison 5 Higher versus lower PUFA intake: subgrouped by infant heredity for allergy, Outcome 7 Dermatitis/eczema ‐ infant incidence.

Comparison 5 Higher versus lower PUFA intake: subgrouped by infant heredity for allergy, Outcome 8 Dermatitis/eczema ‐ childhood incidence.

Comparison 5 Higher versus lower PUFA intake: subgrouped by infant heredity for allergy, Outcome 9 Dermatitis/eczema ‐ childhood prevalence.
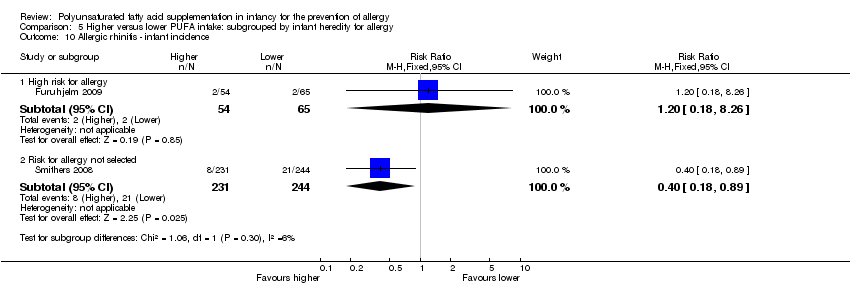
Comparison 5 Higher versus lower PUFA intake: subgrouped by infant heredity for allergy, Outcome 10 Allergic rhinitis ‐ infant incidence.

Comparison 5 Higher versus lower PUFA intake: subgrouped by infant heredity for allergy, Outcome 11 Allergic rhinitis ‐ childhood prevalence.
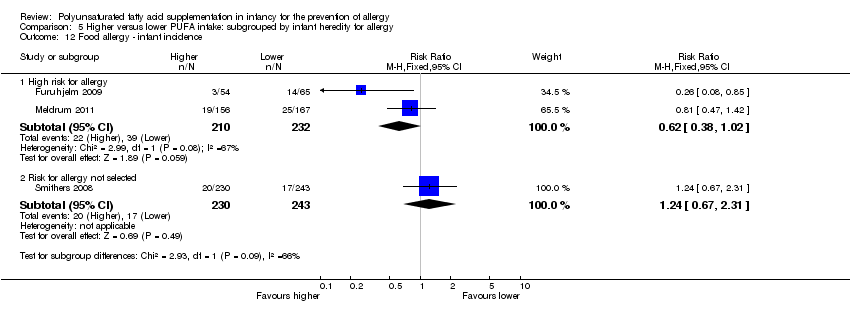
Comparison 5 Higher versus lower PUFA intake: subgrouped by infant heredity for allergy, Outcome 12 Food allergy ‐ infant incidence.

Comparison 5 Higher versus lower PUFA intake: subgrouped by infant heredity for allergy, Outcome 13 Food allergy ‐ childhood incidence.
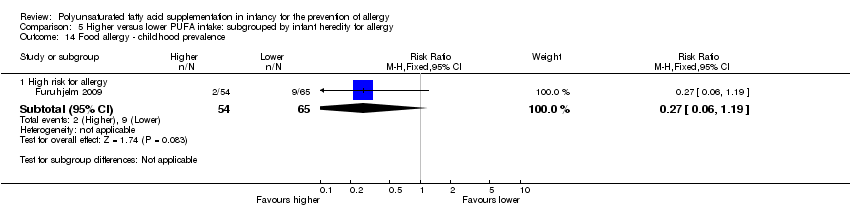
Comparison 5 Higher versus lower PUFA intake: subgrouped by infant heredity for allergy, Outcome 14 Food allergy ‐ childhood prevalence.
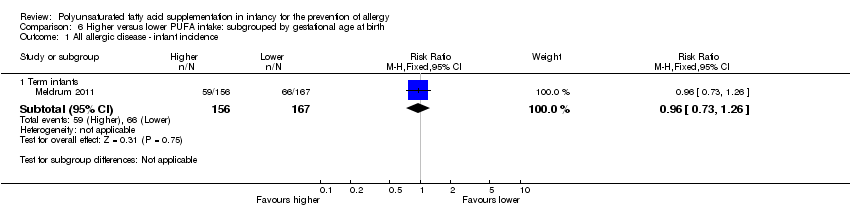
Comparison 6 Higher versus lower PUFA intake: subgrouped by gestational age at birth, Outcome 1 All allergic disease ‐ infant incidence.

Comparison 6 Higher versus lower PUFA intake: subgrouped by gestational age at birth, Outcome 2 All allergic disease ‐ childhood incidence.

Comparison 6 Higher versus lower PUFA intake: subgrouped by gestational age at birth, Outcome 3 All allergic disease ‐ childhood prevalence.
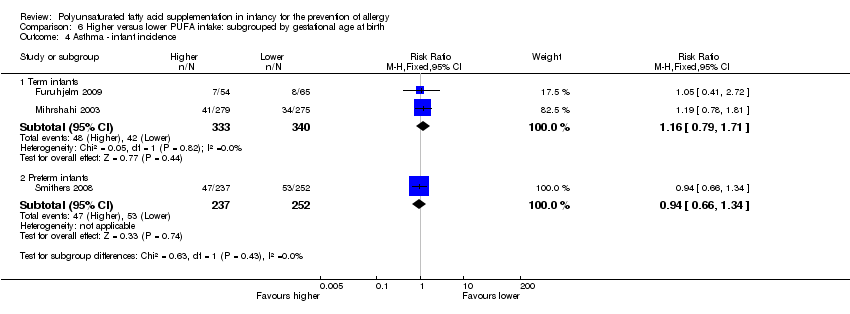
Comparison 6 Higher versus lower PUFA intake: subgrouped by gestational age at birth, Outcome 4 Asthma ‐ infant incidence.

Comparison 6 Higher versus lower PUFA intake: subgrouped by gestational age at birth, Outcome 5 Asthma ‐ childhood incidence.
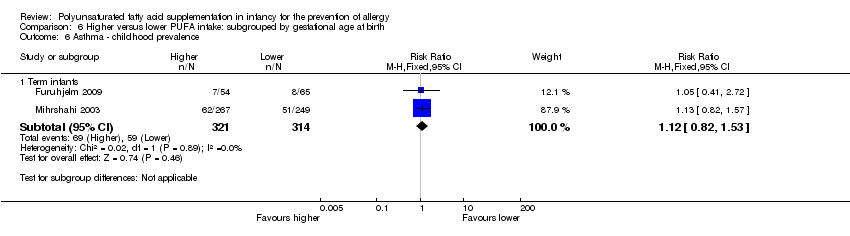
Comparison 6 Higher versus lower PUFA intake: subgrouped by gestational age at birth, Outcome 6 Asthma ‐ childhood prevalence.
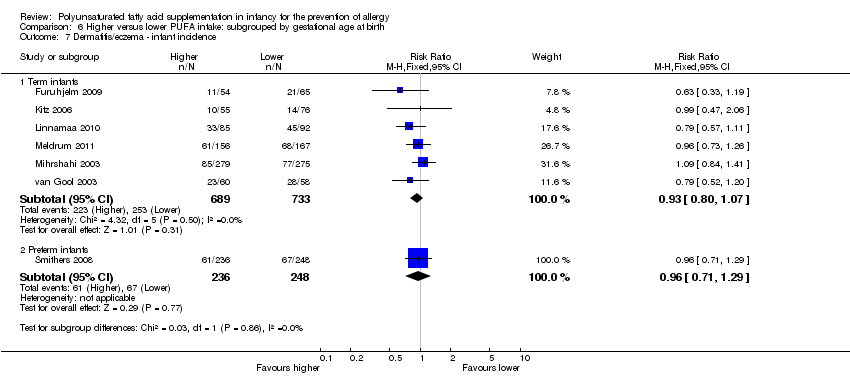
Comparison 6 Higher versus lower PUFA intake: subgrouped by gestational age at birth, Outcome 7 Dermatitis/eczema ‐ infant incidence.

Comparison 6 Higher versus lower PUFA intake: subgrouped by gestational age at birth, Outcome 8 Dermatitis/eczema ‐ childhood incidence.

Comparison 6 Higher versus lower PUFA intake: subgrouped by gestational age at birth, Outcome 9 Dermatitis/eczema ‐ childhood prevalence.

Comparison 6 Higher versus lower PUFA intake: subgrouped by gestational age at birth, Outcome 10 Allergic rhinitis ‐ infant incidence.
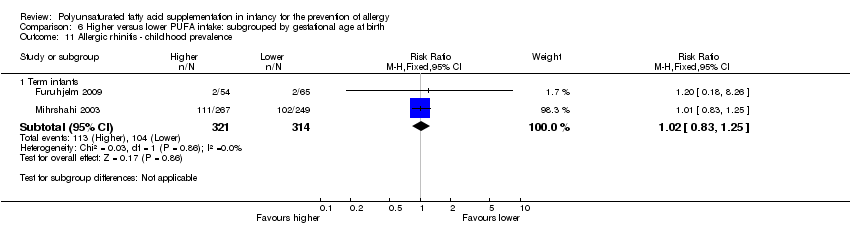
Comparison 6 Higher versus lower PUFA intake: subgrouped by gestational age at birth, Outcome 11 Allergic rhinitis ‐ childhood prevalence.

Comparison 6 Higher versus lower PUFA intake: subgrouped by gestational age at birth, Outcome 12 Food allergy ‐ infant incidence.

Comparison 6 Higher versus lower PUFA intake: subgrouped by gestational age at birth, Outcome 13 Food allergy ‐ childhood incidence.

Comparison 6 Higher versus lower PUFA intake: subgrouped by gestational age at birth, Outcome 14 Food allergy ‐ childhood prevalence.
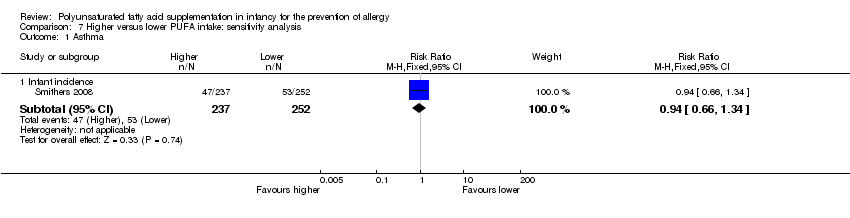
Comparison 7 Higher versus lower PUFA intake: sensitivity analysis, Outcome 1 Asthma.

Comparison 7 Higher versus lower PUFA intake: sensitivity analysis, Outcome 2 Dermatitis/eczema.
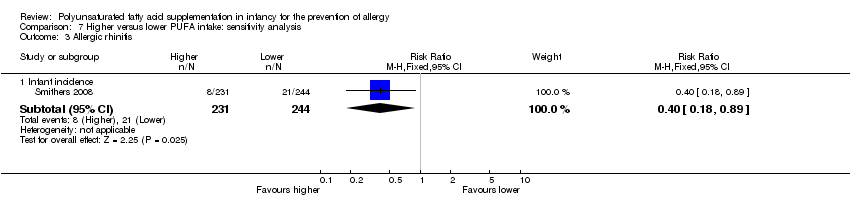
Comparison 7 Higher versus lower PUFA intake: sensitivity analysis, Outcome 3 Allergic rhinitis.

Comparison 7 Higher versus lower PUFA intake: sensitivity analysis, Outcome 4 Food allergy.
| Higher versus lower PUFA intake for the prevention of allergy ‐ infant incidence | ||||||
| Patient or population: infants | ||||||
| Outcomes | Illustrative comparative risks* (95% CI) | Relative effect | No of participants | Quality of the evidence | Comments | |
| Assumed risk | Corresponding risk | |||||
| Lower PUFA intake | Higher PUFA intake | |||||
| All allergic disease ‐ infant incidence | Study population | RR 0.96 | 323 | ⊕⊝⊝⊝ | ‐ | |
| 395 per 1000 | 379 per 1000 | |||||
| Moderate | ||||||
| 395 per 1000 | 379 per 1000 | |||||
| Asthma ‐ infant incidence | Study population | RR 1.04 | 1162 | ⊕⊕⊝⊝ | ‐ | |
| 160 per 1000 | 167 per 1000 | |||||
| Moderate | ||||||
| 124 per 1000 | 129 per 1000 | |||||
| Dermatitis/eczema ‐ infant incidence | Study population | RR 0.93 | 1906 | ⊕⊝⊝⊝ | ‐ | |
| 326 per 1000 | 303 per 1000 | |||||
| Moderate | ||||||
| 323 per 1000 | 300 per 1000 | |||||
| Allergic rhinitis ‐ infant incidence | Study population | RR 0.47 | 594 | ⊕⊝⊝⊝ | ‐ | |
| 74 per 1000 | 35 per 1000 | |||||
| Moderate | ||||||
| 58 per 1000 | 27 per 1000 | |||||
| Food allergy ‐ infant incidence | Study population | RR 0.81 | 915 | ⊕⊝⊝⊝ | ‐ | |
| 118 per 1000 | 95 per 1000 | |||||
| Moderate | ||||||
| 150 per 1000 | 121 per 1000 | |||||
| *The basis for the assumed risk (e.g. the median control group risk across studies) is provided in footnotes. The corresponding risk (and its 95% confidence interval) is based on the assumed risk in the comparison group and the relative effect of the intervention (and its 95% CI). | ||||||
| GRADE Working Group grades of evidence | ||||||
| 1 Losses to follow‐up | ||||||
| Higher versus lower PUFA intake for the prevention of allergy ‐ childhood incidence | ||||||
| Patient or population: infants | ||||||
| Outcomes | Illustrative comparative risks* (95% CI) | Relative effect | No of participants | Quality of the evidence | Comments | |
| Assumed risk | Corresponding risk | |||||
| Lower PUFA intake | Higher PUFA intake | |||||
| All allergic disease ‐ childhood incidence | Study population | RR 0.69 | 154 | ⊕⊝⊝⊝ | ‐ | |
| 519 per 1000 | 358 per 1000 | |||||
| Moderate | ||||||
| 483 per 1000 | 333 per 1000 | |||||
| Asthma ‐ childhood incidence | Study population | RR 0.45 | 89 | ⊕⊝⊝⊝ | ‐ | |
| 353 per 1000 | 159 per 1000 | |||||
| Moderate | ||||||
| 353 per 1000 | 159 per 1000 | |||||
| Dermatitis/eczema ‐ childhood incidence | Study population | RR 0.65 | 154 | ⊕⊝⊝⊝ | ‐ | |
| 266 per 1000 | 173 per 1000 | |||||
| Moderate | ||||||
| 238 per 1000 | 155 per 1000 | |||||
| Food allergy ‐ childhood incidence | Study population | RR 2.27 | 65 | ⊕⊝⊝⊝ | ‐ | |
| 36 per 1000 | 81 per 1000 | |||||
| Moderate | ||||||
| 36 per 1000 | 82 per 1000 | |||||
| *The basis for the assumed risk (e.g. the median control group risk across studies) is provided in footnotes. The corresponding risk (and its 95% confidence interval) is based on the assumed risk in the comparison group and the relative effect of the intervention (and its 95% CI). | ||||||
| GRADE Working Group grades of evidence | ||||||
| 1 Very high losses to follow‐up. | ||||||
| Higher versus lower PUFA intake for the prevention of allergy ‐ childhood prevalence | ||||||
| Patient or population: infants | ||||||
| Outcomes | Illustrative comparative risks* (95% CI) | Relative effect | No of participants | Quality of the evidence | Comments | |
| Assumed risk | Corresponding risk | |||||
| Lower PUFA intake | Higher PUFA intake | |||||
| All allergic disease ‐ childhood prevalence | Study population | RR 0.98 | 633 | ⊕⊝⊝⊝ | ‐ | |
| 394 per 1000 | 386 per 1000 | |||||
| Moderate | ||||||
| 372 per 1000 | 365 per 1000 | |||||
| Asthma ‐ childhood prevalence | Study population | RR 1.12 | 635 | ⊕⊝⊝⊝ | ‐ | |
| 188 per 1000 | 210 per 1000 | |||||
| Moderate | ||||||
| 164 per 1000 | 184 per 1000 | |||||
| Dermatitis/eczema ‐ childhood prevalence | Study population | RR 0.81 | 635 | ⊕⊝⊝⊝ | ‐ | |
| 229 per 1000 | 186 per 1000 | |||||
| Moderate | ||||||
| 219 per 1000 | 177 per 1000 | |||||
| Allergic rhinitis ‐ childhood prevalence | Study population | RR 1.02 | 635 | ⊕⊝⊝⊝ | ‐ | |
| 331 per 1000 | 338 per 1000 | |||||
| Moderate | ||||||
| 220 per 1000 | 224 per 1000 | |||||
| Food allergy ‐ childhood prevalence | Study population | RR 0.27 | 119 | ⊕⊝⊝⊝ | ‐ | |
| 138 per 1000 | 37 per 1000 | |||||
| Moderate | ||||||
| 139 per 1000 | 38 per 1000 | |||||
| *The basis for the assumed risk (e.g. the median control group risk across studies) is provided in footnotes. The corresponding risk (and its 95% confidence interval) is based on the assumed risk in the comparison group and the relative effect of the intervention (and its 95% CI). | ||||||
| GRADE Working Group grades of evidence | ||||||
| 1 Losses to follow‐up > 10%. | ||||||
| Outcome or subgroup title | No. of studies | No. of participants | Statistical method | Effect size |
| 1 All allergic disease Show forest plot | 5 | Risk Ratio (M‐H, Fixed, 95% CI) | Subtotals only | |
| 1.1 Infant incidence | 1 | 323 | Risk Ratio (M‐H, Fixed, 95% CI) | 0.96 [0.73, 1.26] |
| 1.2 Childhood incidence | 2 | 154 | Risk Ratio (M‐H, Fixed, 95% CI) | 0.69 [0.47, 1.02] |
| 1.3 Childhood prevalence | 2 | 633 | Risk Ratio (M‐H, Fixed, 95% CI) | 0.98 [0.81, 1.19] |
| 2 Asthma Show forest plot | 4 | Risk Ratio (M‐H, Fixed, 95% CI) | Subtotals only | |
| 2.1 Infant incidence | 3 | 1162 | Risk Ratio (M‐H, Fixed, 95% CI) | 1.04 [0.80, 1.35] |
| 2.2 Childhood incidence | 1 | 89 | Risk Ratio (M‐H, Fixed, 95% CI) | 0.45 [0.20, 1.02] |
| 2.3 Childhood prevalence | 2 | 635 | Risk Ratio (M‐H, Fixed, 95% CI) | 1.12 [0.82, 1.53] |
| 3 Dermatitis/eczema Show forest plot | 9 | Risk Ratio (M‐H, Fixed, 95% CI) | Subtotals only | |
| 3.1 Infant incidence | 7 | 1906 | Risk Ratio (M‐H, Fixed, 95% CI) | 0.93 [0.82, 1.06] |
| 3.2 Childhood incidence | 2 | 154 | Risk Ratio (M‐H, Fixed, 95% CI) | 0.65 [0.34, 1.24] |
| 3.3 Childhood prevalence | 2 | 635 | Risk Ratio (M‐H, Fixed, 95% CI) | 0.81 [0.59, 1.09] |
| 4 Allergic rhinitis Show forest plot | 3 | Risk Ratio (M‐H, Fixed, 95% CI) | Subtotals only | |
| 4.1 Infant incidence | 2 | 594 | Risk Ratio (M‐H, Fixed, 95% CI) | 0.47 [0.23, 0.96] |
| 4.2 Childhood prevalence | 2 | 635 | Risk Ratio (M‐H, Fixed, 95% CI) | 1.02 [0.83, 1.25] |
| 5 Food allergy Show forest plot | 4 | Risk Ratio (M‐H, Fixed, 95% CI) | Subtotals only | |
| 5.1 Infant incidence | 3 | 915 | Risk Ratio (M‐H, Fixed, 95% CI) | 0.81 [0.56, 1.19] |
| 5.2 Childhood incidence | 1 | 65 | Risk Ratio (M‐H, Fixed, 95% CI) | 2.27 [0.25, 20.68] |
| 5.3 Childhood prevalence | 1 | 119 | Risk Ratio (M‐H, Fixed, 95% CI) | 0.27 [0.06, 1.19] |
| Outcome or subgroup title | No. of studies | No. of participants | Statistical method | Effect size |
| 1 All allergic disease ‐ infant incidence Show forest plot | 1 | Risk Ratio (M‐H, Fixed, 95% CI) | Subtotals only | |
| 1.1 Infant supplementation | 1 | 323 | Risk Ratio (M‐H, Fixed, 95% CI) | 0.96 [0.73, 1.26] |
| 2 All allergic disease ‐ childhood incidence Show forest plot | 2 | Risk Ratio (M‐H, Fixed, 95% CI) | Subtotals only | |
| 2.1 Infant supplementation | 1 | 89 | Risk Ratio (M‐H, Fixed, 95% CI) | 0.56 [0.34, 0.92] |
| 2.2 Maternal supplementation | 1 | 65 | Risk Ratio (M‐H, Fixed, 95% CI) | 0.98 [0.51, 1.91] |
| 3 All allergic disease ‐ childhood prevalence Show forest plot | 2 | Risk Ratio (M‐H, Fixed, 95% CI) | Subtotals only | |
| 3.1 Infant supplementation | 1 | 516 | Risk Ratio (M‐H, Fixed, 95% CI) | 1.01 [0.83, 1.25] |
| 3.2 Maternal supplementation | 1 | 117 | Risk Ratio (M‐H, Fixed, 95% CI) | 0.78 [0.44, 1.38] |
| 4 Asthma ‐ infant incidence Show forest plot | 3 | Risk Ratio (M‐H, Fixed, 95% CI) | Subtotals only | |
| 4.1 Infant supplementation | 1 | 554 | Risk Ratio (M‐H, Fixed, 95% CI) | 1.19 [0.78, 1.81] |
| 4.2 Maternal supplementation | 2 | 608 | Risk Ratio (M‐H, Fixed, 95% CI) | 0.96 [0.69, 1.33] |
| 5 Asthma ‐ childhood incidence Show forest plot | 1 | Risk Ratio (M‐H, Fixed, 95% CI) | Subtotals only | |
| 5.1 Infant supplementation | 1 | 89 | Risk Ratio (M‐H, Fixed, 95% CI) | 0.45 [0.20, 1.02] |
| 6 Asthma ‐ childhood prevalence Show forest plot | 2 | Risk Ratio (M‐H, Fixed, 95% CI) | Subtotals only | |
| 6.1 Infant supplementation | 1 | 516 | Risk Ratio (M‐H, Fixed, 95% CI) | 1.13 [0.82, 1.57] |
| 6.2 Maternal supplementation | 1 | 119 | Risk Ratio (M‐H, Fixed, 95% CI) | 1.05 [0.41, 2.72] |
| 7 Dermatitis/eczema ‐ infant incidence Show forest plot | 7 | Risk Ratio (M‐H, Fixed, 95% CI) | Subtotals only | |
| 7.1 Infant supplementation | 5 | 1245 | Risk Ratio (M‐H, Fixed, 95% CI) | 0.95 [0.82, 1.11] |
| 7.2 Maternal supplementation | 3 | 661 | Risk Ratio (M‐H, Fixed, 95% CI) | 0.88 [0.68, 1.15] |
| 8 Dermatitis/eczema ‐ childhood incidence Show forest plot | 2 | Risk Ratio (M‐H, Fixed, 95% CI) | Subtotals only | |
| 8.1 Infant supplementation | 1 | 89 | Risk Ratio (M‐H, Fixed, 95% CI) | 0.55 [0.25, 1.20] |
| 8.2 Maternal supplementation | 1 | 65 | Risk Ratio (M‐H, Fixed, 95% CI) | 0.95 [0.28, 3.20] |
| 9 Dermatitis/eczema ‐ childhood prevalence Show forest plot | 2 | Risk Ratio (M‐H, Fixed, 95% CI) | Subtotals only | |
| 9.1 Infant supplementation | 1 | 516 | Risk Ratio (M‐H, Fixed, 95% CI) | 0.85 [0.62, 1.18] |
| 9.2 Maternal supplementation | 1 | 119 | Risk Ratio (M‐H, Fixed, 95% CI) | 0.56 [0.23, 1.36] |
| 10 Allergic rhinitis ‐ infant incidence Show forest plot | 2 | Risk Ratio (M‐H, Fixed, 95% CI) | Subtotals only | |
| 10.1 Maternal supplementation | 2 | 594 | Risk Ratio (M‐H, Fixed, 95% CI) | 0.47 [0.23, 0.96] |
| 11 Allergic rhinitis ‐ childhood prevalence Show forest plot | 2 | Risk Ratio (M‐H, Fixed, 95% CI) | Subtotals only | |
| 11.1 Infant supplementation | 1 | 516 | Risk Ratio (M‐H, Fixed, 95% CI) | 1.01 [0.83, 1.25] |
| 11.2 Maternal supplementation | 1 | 119 | Risk Ratio (M‐H, Fixed, 95% CI) | 1.20 [0.18, 8.26] |
| 12 Food allergy ‐ infant incidence Show forest plot | 3 | Risk Ratio (M‐H, Fixed, 95% CI) | Subtotals only | |
| 12.1 Infant supplementation | 1 | 323 | Risk Ratio (M‐H, Fixed, 95% CI) | 0.81 [0.47, 1.42] |
| 12.2 Maternal supplementation | 2 | 592 | Risk Ratio (M‐H, Fixed, 95% CI) | 0.81 [0.48, 1.37] |
| 13 Food allergy ‐ childhood incidence Show forest plot | 1 | Risk Ratio (M‐H, Fixed, 95% CI) | Subtotals only | |
| 13.1 Maternal supplementation | 1 | 65 | Risk Ratio (M‐H, Fixed, 95% CI) | 2.27 [0.25, 20.68] |
| 14 Food allergy ‐ childhood prevalence Show forest plot | 1 | Risk Ratio (M‐H, Fixed, 95% CI) | Subtotals only | |
| 14.1 Maternal supplementation | 1 | 119 | Risk Ratio (M‐H, Fixed, 95% CI) | 0.27 [0.06, 1.19] |
| Outcome or subgroup title | No. of studies | No. of participants | Statistical method | Effect size |
| 1 All allergic disease ‐ infant incidence Show forest plot | 1 | Risk Ratio (M‐H, Fixed, 95% CI) | Subtotals only | |
| 1.1 n‐3 supplementation | 1 | 323 | Risk Ratio (M‐H, Fixed, 95% CI) | 0.96 [0.73, 1.26] |
| 2 All allergic disease ‐ childhood incidence Show forest plot | 2 | Risk Ratio (M‐H, Fixed, 95% CI) | Subtotals only | |
| 2.1 n‐3 supplementation | 2 | 154 | Risk Ratio (M‐H, Fixed, 95% CI) | 0.69 [0.47, 1.02] |
| 3 All allergic disease ‐ childhood prevalence Show forest plot | 2 | Risk Ratio (M‐H, Fixed, 95% CI) | Subtotals only | |
| 3.1 n‐3 supplementation | 2 | 633 | Risk Ratio (M‐H, Fixed, 95% CI) | 0.98 [0.81, 1.19] |
| 4 Asthma ‐ infant incidence Show forest plot | 3 | Risk Ratio (M‐H, Fixed, 95% CI) | Subtotals only | |
| 4.1 n‐3 supplementation | 3 | 1162 | Risk Ratio (M‐H, Fixed, 95% CI) | 1.04 [0.80, 1.35] |
| 5 Asthma ‐ childhood incidence Show forest plot | 1 | Risk Ratio (M‐H, Fixed, 95% CI) | Subtotals only | |
| 5.1 n‐3 supplementation | 1 | 89 | Risk Ratio (M‐H, Fixed, 95% CI) | 0.45 [0.20, 1.02] |
| 6 Asthma ‐ childhood prevalence Show forest plot | 2 | Risk Ratio (M‐H, Fixed, 95% CI) | Subtotals only | |
| 6.1 n‐3 supplementation | 2 | 635 | Risk Ratio (M‐H, Fixed, 95% CI) | 1.12 [0.82, 1.53] |
| 7 Dermatitis/eczema ‐ infant incidence Show forest plot | 7 | Risk Ratio (M‐H, Fixed, 95% CI) | Subtotals only | |
| 7.1 n‐3 supplementation | 5 | 1657 | Risk Ratio (M‐H, Fixed, 95% CI) | 0.95 [0.82, 1.09] |
| 7.2 n‐6 supplementation | 2 | 249 | Risk Ratio (M‐H, Fixed, 95% CI) | 0.85 [0.59, 1.23] |
| 8 Dermatitis/eczema ‐ childhood incidence Show forest plot | 2 | Risk Ratio (M‐H, Fixed, 95% CI) | Subtotals only | |
| 8.1 n‐3 supplementation | 2 | 154 | Risk Ratio (M‐H, Fixed, 95% CI) | 0.65 [0.34, 1.24] |
| 9 Dermatitis/eczema ‐ childhood prevalence Show forest plot | 2 | Risk Ratio (M‐H, Fixed, 95% CI) | Subtotals only | |
| 9.1 n‐3 supplementation | 2 | 635 | Risk Ratio (M‐H, Fixed, 95% CI) | 0.81 [0.59, 1.09] |
| 10 Allergic rhinitis ‐ infant incidence Show forest plot | 2 | Risk Ratio (M‐H, Fixed, 95% CI) | Subtotals only | |
| 10.1 n‐3 supplementation | 2 | 594 | Risk Ratio (M‐H, Fixed, 95% CI) | 0.47 [0.23, 0.96] |
| 11 Allergic rhinitis ‐ childhood prevalence Show forest plot | 2 | Risk Ratio (M‐H, Fixed, 95% CI) | Subtotals only | |
| 11.1 n‐3 supplementation | 2 | 635 | Risk Ratio (M‐H, Fixed, 95% CI) | 1.02 [0.83, 1.25] |
| 12 Food allergy ‐ infant incidence Show forest plot | 3 | Risk Ratio (M‐H, Fixed, 95% CI) | Subtotals only | |
| 12.1 n‐3 supplementation | 3 | 915 | Risk Ratio (M‐H, Fixed, 95% CI) | 0.81 [0.56, 1.19] |
| 13 Food allergy ‐ childhood incidence Show forest plot | 1 | Risk Ratio (M‐H, Fixed, 95% CI) | Subtotals only | |
| 13.1 n‐3 supplementation | 1 | 65 | Risk Ratio (M‐H, Fixed, 95% CI) | 2.27 [0.25, 20.68] |
| 14 Food allergy ‐ childhood prevalence Show forest plot | 1 | Risk Ratio (M‐H, Fixed, 95% CI) | Subtotals only | |
| 14.1 n‐3 supplementation | 1 | 119 | Risk Ratio (M‐H, Fixed, 95% CI) | 0.27 [0.06, 1.19] |
| Outcome or subgroup title | No. of studies | No. of participants | Statistical method | Effect size |
| 1 All allergic disease ‐ infant incidence Show forest plot | 1 | Risk Ratio (M‐H, Fixed, 95% CI) | Subtotals only | |
| 1.1 Human milk fed infants | 1 | 323 | Risk Ratio (M‐H, Fixed, 95% CI) | 0.96 [0.73, 1.26] |
| 2 All allergic disease ‐ childhood incidence Show forest plot | 2 | Risk Ratio (M‐H, Fixed, 95% CI) | Subtotals only | |
| 2.1 Human milk fed infants | 1 | 65 | Risk Ratio (M‐H, Fixed, 95% CI) | 0.98 [0.51, 1.91] |
| 2.2 Formula fed infants | 1 | 89 | Risk Ratio (M‐H, Fixed, 95% CI) | 0.56 [0.34, 0.92] |
| 3 All allergic disease ‐ childhood prevalence Show forest plot | 2 | Risk Ratio (M‐H, Fixed, 95% CI) | Subtotals only | |
| 3.1 Human milk fed infants | 2 | 633 | Risk Ratio (M‐H, Fixed, 95% CI) | 0.98 [0.81, 1.19] |
| 4 Asthma ‐ infant incidence Show forest plot | 3 | Risk Ratio (M‐H, Fixed, 95% CI) | Subtotals only | |
| 5 Asthma ‐ childhood incidence Show forest plot | 1 | Risk Ratio (M‐H, Fixed, 95% CI) | Subtotals only | |
| 5.1 Formula fed infants | 1 | 89 | Risk Ratio (M‐H, Fixed, 95% CI) | 0.45 [0.20, 1.02] |
| 6 Asthma ‐ childhood prevalence Show forest plot | 2 | Risk Ratio (M‐H, Fixed, 95% CI) | Subtotals only | |
| 6.1 Human milk fed infants | 2 | 635 | Risk Ratio (M‐H, Fixed, 95% CI) | 1.12 [0.82, 1.53] |
| 7 Dermatitis/eczema ‐ infant incidence Show forest plot | 7 | Risk Ratio (M‐H, Fixed, 95% CI) | Subtotals only | |
| 7.1 Human milk fed infants | 6 | 1715 | Risk Ratio (M‐H, Fixed, 95% CI) | 0.95 [0.82, 1.09] |
| 7.2 Formula fed infants | 2 | 191 | Risk Ratio (M‐H, Fixed, 95% CI) | 0.84 [0.57, 1.23] |
| 8 Dermatitis/eczema ‐ childhood incidence Show forest plot | 2 | Risk Ratio (M‐H, Fixed, 95% CI) | Subtotals only | |
| 8.1 Human milk fed infants | 1 | 65 | Risk Ratio (M‐H, Fixed, 95% CI) | 0.95 [0.28, 3.20] |
| 8.2 Formula fed infants | 1 | 89 | Risk Ratio (M‐H, Fixed, 95% CI) | 0.55 [0.25, 1.20] |
| 9 Dermatitis/eczema ‐ childhood prevalence Show forest plot | 2 | Risk Ratio (M‐H, Fixed, 95% CI) | Subtotals only | |
| 9.1 Human milk fed infants | 2 | 635 | Risk Ratio (M‐H, Fixed, 95% CI) | 0.81 [0.59, 1.09] |
| 10 Allergic rhinitis ‐ infant incidence Show forest plot | 2 | Risk Ratio (M‐H, Fixed, 95% CI) | Subtotals only | |
| 10.1 Human milk fed infants | 2 | 594 | Risk Ratio (M‐H, Fixed, 95% CI) | 0.47 [0.23, 0.96] |
| 11 Allergic rhinitis ‐ childhood prevalence Show forest plot | 2 | Risk Ratio (M‐H, Fixed, 95% CI) | Subtotals only | |
| 11.1 Human milk fed infants | 2 | 635 | Risk Ratio (M‐H, Fixed, 95% CI) | 1.02 [0.83, 1.25] |
| 12 Food allergy ‐ infant incidence Show forest plot | 3 | Risk Ratio (M‐H, Fixed, 95% CI) | Subtotals only | |
| 12.1 Human milk fed infants | 3 | 915 | Risk Ratio (M‐H, Fixed, 95% CI) | 0.81 [0.56, 1.19] |
| 13 Food allergy ‐ childhood incidence Show forest plot | 1 | Risk Ratio (M‐H, Fixed, 95% CI) | Subtotals only | |
| 13.1 Human milk fed infants | 1 | 65 | Risk Ratio (M‐H, Fixed, 95% CI) | 2.27 [0.25, 20.68] |
| 14 Food allergy ‐ childhood prevalence Show forest plot | 1 | Risk Ratio (M‐H, Fixed, 95% CI) | Subtotals only | |
| 14.1 Human milk fed infants | 1 | 119 | Risk Ratio (M‐H, Fixed, 95% CI) | 0.27 [0.06, 1.19] |
| Outcome or subgroup title | No. of studies | No. of participants | Statistical method | Effect size |
| 1 All allergic disease ‐ infant incidence Show forest plot | 1 | Risk Ratio (M‐H, Fixed, 95% CI) | Subtotals only | |
| 1.1 High risk for allergy | 1 | 323 | Risk Ratio (M‐H, Fixed, 95% CI) | 0.96 [0.73, 1.26] |
| 2 All allergic disease ‐ childhood incidence Show forest plot | 2 | Risk Ratio (M‐H, Fixed, 95% CI) | Subtotals only | |
| 2.1 Risk for allergy not selected | 2 | 154 | Risk Ratio (M‐H, Fixed, 95% CI) | 0.69 [0.47, 1.02] |
| 3 All allergic disease ‐ childhood prevalence Show forest plot | 2 | Risk Ratio (M‐H, Fixed, 95% CI) | Subtotals only | |
| 3.1 High risk for allergy | 2 | 633 | Risk Ratio (M‐H, Fixed, 95% CI) | 0.98 [0.81, 1.19] |
| 4 Asthma ‐ infant incidence Show forest plot | 3 | Risk Ratio (M‐H, Fixed, 95% CI) | Subtotals only | |
| 4.1 High risk for allergy | 2 | 673 | Risk Ratio (M‐H, Fixed, 95% CI) | 1.16 [0.79, 1.71] |
| 4.2 Risk for allergy not selected | 1 | 489 | Risk Ratio (M‐H, Fixed, 95% CI) | 0.94 [0.66, 1.34] |
| 5 Asthma ‐ childhood incidence Show forest plot | 1 | Risk Ratio (M‐H, Fixed, 95% CI) | Subtotals only | |
| 5.1 Risk for allergy not selected | 1 | 89 | Risk Ratio (M‐H, Fixed, 95% CI) | 0.45 [0.20, 1.02] |
| 6 Asthma ‐ childhood prevalence Show forest plot | 2 | Risk Ratio (M‐H, Fixed, 95% CI) | Subtotals only | |
| 6.1 High risk for allergy | 2 | 635 | Risk Ratio (M‐H, Fixed, 95% CI) | 1.12 [0.82, 1.53] |
| 7 Dermatitis/eczema ‐ infant incidence Show forest plot | 7 | Risk Ratio (M‐H, Fixed, 95% CI) | Subtotals only | |
| 7.1 High risk for allergy | 5 | 1245 | Risk Ratio (M‐H, Fixed, 95% CI) | 0.96 [0.81, 1.12] |
| 7.2 Risk for allergy not selected | 2 | 661 | Risk Ratio (M‐H, Fixed, 95% CI) | 0.89 [0.71, 1.12] |
| 8 Dermatitis/eczema ‐ childhood incidence Show forest plot | 2 | Risk Ratio (M‐H, Fixed, 95% CI) | Subtotals only | |
| 8.1 Risk for allergy not selected | 2 | 154 | Risk Ratio (M‐H, Fixed, 95% CI) | 0.65 [0.34, 1.24] |
| 9 Dermatitis/eczema ‐ childhood prevalence Show forest plot | 2 | Risk Ratio (M‐H, Fixed, 95% CI) | Subtotals only | |
| 9.1 High risk for allergy | 2 | 635 | Risk Ratio (M‐H, Fixed, 95% CI) | 0.81 [0.59, 1.09] |
| 10 Allergic rhinitis ‐ infant incidence Show forest plot | 2 | Risk Ratio (M‐H, Fixed, 95% CI) | Subtotals only | |
| 10.1 High risk for allergy | 1 | 119 | Risk Ratio (M‐H, Fixed, 95% CI) | 1.20 [0.18, 8.26] |
| 10.2 Risk for allergy not selected | 1 | 475 | Risk Ratio (M‐H, Fixed, 95% CI) | 0.40 [0.18, 0.89] |
| 11 Allergic rhinitis ‐ childhood prevalence Show forest plot | 2 | Risk Ratio (M‐H, Fixed, 95% CI) | Subtotals only | |
| 11.1 High risk for allergy | 2 | 635 | Risk Ratio (M‐H, Fixed, 95% CI) | 1.02 [0.83, 1.25] |
| 12 Food allergy ‐ infant incidence Show forest plot | 3 | Risk Ratio (M‐H, Fixed, 95% CI) | Subtotals only | |
| 12.1 High risk for allergy | 2 | 442 | Risk Ratio (M‐H, Fixed, 95% CI) | 0.62 [0.38, 1.02] |
| 12.2 Risk for allergy not selected | 1 | 473 | Risk Ratio (M‐H, Fixed, 95% CI) | 1.24 [0.67, 2.31] |
| 13 Food allergy ‐ childhood incidence Show forest plot | 1 | Risk Ratio (M‐H, Fixed, 95% CI) | Subtotals only | |
| 13.1 Risk for allergy not selected | 1 | 65 | Risk Ratio (M‐H, Fixed, 95% CI) | 2.27 [0.25, 20.68] |
| 14 Food allergy ‐ childhood prevalence Show forest plot | 1 | Risk Ratio (M‐H, Fixed, 95% CI) | Subtotals only | |
| 14.1 High risk for allergy | 1 | 119 | Risk Ratio (M‐H, Fixed, 95% CI) | 0.27 [0.06, 1.19] |
| Outcome or subgroup title | No. of studies | No. of participants | Statistical method | Effect size |
| 1 All allergic disease ‐ infant incidence Show forest plot | 1 | Risk Ratio (M‐H, Fixed, 95% CI) | Subtotals only | |
| 1.1 Term infants | 1 | 323 | Risk Ratio (M‐H, Fixed, 95% CI) | 0.96 [0.73, 1.26] |
| 2 All allergic disease ‐ childhood incidence Show forest plot | 2 | Risk Ratio (M‐H, Fixed, 95% CI) | Subtotals only | |
| 2.1 Term infants | 2 | 154 | Risk Ratio (M‐H, Fixed, 95% CI) | 0.69 [0.47, 1.02] |
| 3 All allergic disease ‐ childhood prevalence Show forest plot | 2 | Risk Ratio (M‐H, Fixed, 95% CI) | Subtotals only | |
| 3.1 Term infants | 2 | 633 | Risk Ratio (M‐H, Fixed, 95% CI) | 0.98 [0.81, 1.19] |
| 4 Asthma ‐ infant incidence Show forest plot | 3 | Risk Ratio (M‐H, Fixed, 95% CI) | Subtotals only | |
| 4.1 Term infants | 2 | 673 | Risk Ratio (M‐H, Fixed, 95% CI) | 1.16 [0.79, 1.71] |
| 4.2 Preterm infants | 1 | 489 | Risk Ratio (M‐H, Fixed, 95% CI) | 0.94 [0.66, 1.34] |
| 5 Asthma ‐ childhood incidence Show forest plot | 1 | Risk Ratio (M‐H, Fixed, 95% CI) | Subtotals only | |
| 5.1 Term infants | 1 | 89 | Risk Ratio (M‐H, Fixed, 95% CI) | 0.45 [0.20, 1.02] |
| 6 Asthma ‐ childhood prevalence Show forest plot | 2 | Risk Ratio (M‐H, Fixed, 95% CI) | Subtotals only | |
| 6.1 Term infants | 2 | 635 | Risk Ratio (M‐H, Fixed, 95% CI) | 1.12 [0.82, 1.53] |
| 7 Dermatitis/eczema ‐ infant incidence Show forest plot | 7 | Risk Ratio (M‐H, Fixed, 95% CI) | Subtotals only | |
| 7.1 Term infants | 6 | 1422 | Risk Ratio (M‐H, Fixed, 95% CI) | 0.93 [0.80, 1.07] |
| 7.2 Preterm infants | 1 | 484 | Risk Ratio (M‐H, Fixed, 95% CI) | 0.96 [0.71, 1.29] |
| 8 Dermatitis/eczema ‐ childhood incidence Show forest plot | 2 | Risk Ratio (M‐H, Fixed, 95% CI) | Subtotals only | |
| 8.1 Term infants | 2 | 154 | Risk Ratio (M‐H, Fixed, 95% CI) | 0.65 [0.34, 1.24] |
| 9 Dermatitis/eczema ‐ childhood prevalence Show forest plot | 2 | Risk Ratio (M‐H, Fixed, 95% CI) | Subtotals only | |
| 9.1 Term infants | 2 | 635 | Risk Ratio (M‐H, Fixed, 95% CI) | 0.81 [0.59, 1.09] |
| 10 Allergic rhinitis ‐ infant incidence Show forest plot | 2 | Risk Ratio (M‐H, Fixed, 95% CI) | Subtotals only | |
| 10.1 Term infants | 1 | 119 | Risk Ratio (M‐H, Fixed, 95% CI) | 1.20 [0.18, 8.26] |
| 10.2 Preterm infants | 1 | 475 | Risk Ratio (M‐H, Fixed, 95% CI) | 0.40 [0.18, 0.89] |
| 11 Allergic rhinitis ‐ childhood prevalence Show forest plot | 2 | Risk Ratio (M‐H, Fixed, 95% CI) | Subtotals only | |
| 11.1 Term infants | 2 | 635 | Risk Ratio (M‐H, Fixed, 95% CI) | 1.02 [0.83, 1.25] |
| 12 Food allergy ‐ infant incidence Show forest plot | 3 | Risk Ratio (M‐H, Fixed, 95% CI) | Subtotals only | |
| 12.1 Term infants | 2 | 442 | Risk Ratio (M‐H, Fixed, 95% CI) | 0.62 [0.38, 1.02] |
| 12.2 Preterm infants | 1 | 473 | Risk Ratio (M‐H, Fixed, 95% CI) | 1.24 [0.67, 2.31] |
| 13 Food allergy ‐ childhood incidence Show forest plot | 1 | Risk Ratio (M‐H, Fixed, 95% CI) | Subtotals only | |
| 13.1 Term infants | 1 | 65 | Risk Ratio (M‐H, Fixed, 95% CI) | 2.27 [0.25, 20.68] |
| 14 Food allergy ‐ childhood prevalence Show forest plot | 1 | Risk Ratio (M‐H, Fixed, 95% CI) | Subtotals only | |
| 14.1 Term infants | 1 | 119 | Risk Ratio (M‐H, Fixed, 95% CI) | 0.27 [0.06, 1.19] |
| Outcome or subgroup title | No. of studies | No. of participants | Statistical method | Effect size |
| 1 Asthma Show forest plot | 1 | Risk Ratio (M‐H, Fixed, 95% CI) | Subtotals only | |
| 1.1 Infant incidence | 1 | 489 | Risk Ratio (M‐H, Fixed, 95% CI) | 0.94 [0.66, 1.34] |
| 2 Dermatitis/eczema Show forest plot | 1 | Risk Ratio (M‐H, Fixed, 95% CI) | Subtotals only | |
| 2.1 Infant incidence | 1 | 484 | Risk Ratio (M‐H, Fixed, 95% CI) | 0.96 [0.71, 1.29] |
| 3 Allergic rhinitis Show forest plot | 1 | Risk Ratio (M‐H, Fixed, 95% CI) | Subtotals only | |
| 3.1 Infant incidence | 1 | 475 | Risk Ratio (M‐H, Fixed, 95% CI) | 0.40 [0.18, 0.89] |
| 4 Food allergy Show forest plot | 1 | Risk Ratio (M‐H, Fixed, 95% CI) | Subtotals only | |
| 4.1 Infant incidence | 1 | 473 | Risk Ratio (M‐H, Fixed, 95% CI) | 1.24 [0.67, 2.31] |