Anfetaminas para el trastorno de déficit de atención e hiperactividad (TDAH) en niños y adolescentes
References
Referencias de los estudios incluidos en esta revisión
Referencias de los estudios excluidos de esta revisión
Referencias de los estudios en espera de evaluación
Referencias de los estudios en curso
Referencias adicionales
Referencias de otras versiones publicadas de esta revisión
Characteristics of studies
Characteristics of included studies [ordered by study ID]
| Methods | Randomized, double‐blind, placebo‐controlled, cross‐over trial Number of study sites: 1 | |
| Participants | Sample size: 46* children/adolescents with an ADHD diagnosis according to the DSM‐IV criteria | |
| Interventions | Five interventions (all 46 children/adolescents participated in each of the five interventions):
Duration: 35 days (5 x 7‐day treatment periods) | |
| Outcomes | Relevant outcomes:
Other outcomes:
| |
| Notes | ClinicalTrials.gov identifier: not available Authors' affiliation: university | |
| Risk of bias | ||
| Bias | Authors' judgement | Support for judgement |
| Random sequence generation (selection bias) | Unclear risk | Method of sequence generation not described |
| Allocation concealment (selection bias) | Unclear risk | Method of allocation concealment not described |
| Incomplete outcome data (attrition bias) | High risk | Only data for completers included in analysis. For one of the primary outcomes, only 37% of randomized children/adolescents included in analysis |
| Selective reporting (reporting bias) | Unclear risk | Study protocol not available and the possibility of reporting bias could not be assessed |
| Other bias | Low risk | Study appears to be free of other biases |
| Blinding of participants and personnel (performance bias) | Unclear risk | Blinding of participants and personnel not adequately described |
| Blinding of outcome assessment (detection bias) | Unclear risk | Blinding of outcome assessment not described |
| Methods | Multi‐center, randomized, double‐blind, placebo‐controlled, parallel‐group trial Statistical methods: modified ITT (last observation carried forward) | |
| Participants | Sample size: 584* children/adolescents with an ADHD diagnosis according to DSM‐IV criteria | |
| Interventions | Four interventions (584 children/adolescents participated in one of four interventions):
Duration: 21 days | |
| Outcomes | Relevant outcomes:
| |
| Notes | ClinicalTrials.gov identifier: not available Authors' affiliations: university *Clinical characteristics are only provided on those children included in the primary efficacy analysis (n = 563) | |
| Risk of bias | ||
| Bias | Authors' judgement | Support for judgement |
| Random sequence generation (selection bias) | Unclear risk | Method of sequence generation not described |
| Allocation concealment (selection bias) | Unclear risk | Method of allocation concealment not described |
| Incomplete outcome data (attrition bias) | Low risk | Moderate attrition (13%). Reasons for attrition reported and 96% of randomized children/adolescents included in primary analysis |
| Selective reporting (reporting bias) | Unclear risk | Study protocol not available and the possibility of reporting bias could not be assessed |
| Other bias | Low risk | Study appears to be free of other biases |
| Blinding of participants and personnel (performance bias) | Unclear risk | Blinding of participants and personnel not described |
| Blinding of outcome assessment (detection bias) | Unclear risk | Blinding of outcome assessment not described |
| Methods | Multi‐center, randomized, double‐blind, placebo‐controlled, cross‐over trial | |
| Participants | Sample size: 52 children/adolescents with an ADHD diagnosis according to the DSM‐IV‐TR criteria | |
| Interventions | Three interventions (all 52 children/adolescents participated in each of the three interventions):
Duration: 21 days (3 x 7‐day treatment periods) | |
| Outcomes | Relevant outcomes:
Other outcomes:
| |
| Notes | ClinicalTrials.gov identifier: NCT00557011 | |
| Risk of bias | ||
| Bias | Authors' judgement | Support for judgement |
| Random sequence generation (selection bias) | Unclear risk | Method of sequence generation not described |
| Allocation concealment (selection bias) | Low risk | Method of allocation concealment involved pre‐packaged, serially‐numbered drug kits, in which the next participant enrolled received the next available drug kit. Drug kits prepared by a third party |
| Incomplete outcome data (attrition bias) | Low risk | Although the primary analysis only included trial completers, attrition was low at 4% |
| Selective reporting (reporting bias) | Low risk | Data provided on all outcomes listed in the registered protocol. Study appears to be free of selective reporting |
| Other bias | Low risk | Study appears to be free of other biases |
| Blinding of participants and personnel (performance bias) | Unclear risk | Blinding of participants and personnel not described |
| Blinding of outcome assessment (detection bias) | Unclear risk | Blinding of outcome assessment not described |
| Methods | Multi‐center, randomized, double‐blind, placebo‐controlled, parallel‐group trial | |
| Participants | Sample size: 290 children/adolescents with an ADHD diagnosis according to the DSM‐IV‐TR criteria | |
| Interventions | Four interventions (290 children/adolescents participated in one of four interventions):
Duration: 28 days | |
| Outcomes | Relevant outcomes:
| |
| Notes | ClinicalTrials.gov identifier: not available Authors' affiliation: university | |
| Risk of bias | ||
| Bias | Authors' judgement | Support for judgement |
| Random sequence generation (selection bias) | Low risk | Sequence generated by a computer program |
| Allocation concealment (selection bias) | Unclear risk | Method of allocation concealment not described |
| Incomplete outcome data (attrition bias) | Low risk | Moderate attrition (21%). However, 98% of randomized children/adolescents included in primary analysis. Reasons for dropouts provided |
| Selective reporting (reporting bias) | Unclear risk | Study protocol not available and the possibility of reporting bias could not be assessed |
| Other bias | Low risk | Study appears to be free of other biases |
| Blinding of participants and personnel (performance bias) | Low risk | Intervention and placebo are described as identical |
| Blinding of outcome assessment (detection bias) | Unclear risk | Blinding of outcome assessment not described |
| Methods | Single‐center, randomized, double‐blind, placebo‐controlled, cross‐over trial | |
| Participants | Sample size: 46 children/adolescents with an ADHD diagnosis according to DSM‐III criteria | |
| Interventions | Three interventions (all 46 children/adolescents participated in each of the three interventions):
Duration: 63 days (3 x 21‐day treatment periods) | |
| Outcomes | Relevant outcomes:
Other outcomes:
| |
| Notes | ClinicalTrials.gov identifier: not available Outcomes were presented across four publications with varying sample sizes | |
| Risk of bias | ||
| Bias | Authors' judgement | Support for judgement |
| Random sequence generation (selection bias) | Unclear risk | Method of sequence generation not described |
| Allocation concealment (selection bias) | Unclear risk | Method of allocation concealment not described |
| Incomplete outcome data (attrition bias) | High risk | This study has four associated publications, and all reports have varying numbers of participants. Upon communication with the corresponding author of these reports, it was confirmed that the numbers of participants vary in the four publications due to missing data and dropouts. Reasons for missing data not provided |
| Selective reporting (reporting bias) | Unclear risk | Study protocol not available and the possibility of reporting bias could not be assessed |
| Other bias | Unclear risk | No information on the validity of the primary outcome measure provided |
| Blinding of participants and personnel (performance bias) | Unclear risk | Blinding of participants and personnel not described |
| Blinding of outcome assessment (detection bias) | Unclear risk | Blinding of outcome assessment not described |
| Methods | Multi‐center, randomized, double‐blinded, placebo‐controlled, cross‐over trial | |
| Participants | Sample size: 97 children/adolescents with an ADHD diagnosis according to DSM‐IV‐TR criteria | |
| Interventions | Two interventions (all 97 children/adolescents participated in both interventions):
Duration: 14 days (2 x 7‐day treatment periods) | |
| Outcomes | Relevant outcomes:
| |
| Notes | ClinicalTrials.gov identifier: NCT01986062 | |
| Risk of bias | ||
| Bias | Authors' judgement | Support for judgement |
| Random sequence generation (selection bias) | Low risk | Sequence generated using an interactive web‐based response system |
| Allocation concealment (selection bias) | Unclear risk | Method of allocation concealment not described |
| Incomplete outcome data (attrition bias) | Low risk | Very low attrition (2%) |
| Selective reporting (reporting bias) | Low risk | Data provided on all outcomes listed in the registered protocol. Study appears to be free of selective reporting |
| Other bias | Low risk | Study appears to be free of other biases |
| Blinding of participants and personnel (performance bias) | Unclear risk | Blinding of participants and personnel not described |
| Blinding of outcome assessment (detection bias) | Unclear risk | Blinding of outcome assessment not described |
| Methods | Multi‐center, randomized, double‐blind, placebo‐controlled, parallel‐group trial | |
| Participants | Sample size: 336* children/adolescents with an ADHD diagnosis according to DSM‐IV‐TR criteria | |
| Interventions | Three interventions (336 children/adolescents participated in one of three interventions):
Duration: 49 days | |
| Outcomes | Relevant outcomes:
| |
| Notes | ClinicalTrials.gov identifier: NCT00763971 *Clinical characteristics were only reported on those who received at least one dose of the intervention to which they were randomized (n = 332) | |
| Risk of bias | ||
| Bias | Authors' judgement | Support for judgement |
| Random sequence generation (selection bias) | Unclear risk | Method of sequence generation not described |
| Allocation concealment (selection bias) | Low risk | Study utilized an interactive voice/web response system, which automatically generated a unique randomization number for each child/adolescent |
| Incomplete outcome data (attrition bias) | High risk | High attrition (58%). 14 (4%) children/adolescents excluded from the efficacy analysis with no reasons provided |
| Selective reporting (reporting bias) | High risk | Outcomes listed in the registered protocol are not reported in any of the three publications |
| Other bias | Low risk | Study appears to be free of other biases |
| Blinding of participants and personnel (performance bias) | Low risk | Intervention and placebo are described as identical |
| Blinding of outcome assessment (detection bias) | Unclear risk | Blinding of outcome assessment is not described |
| Methods | Single‐center, randomized, double‐blind, placebo‐controlled, cross‐over trial Number of study sites: 1 | |
| Participants | Sample size: 20 children/adolescents with an ADHD diagnosis according to DSM‐III criteria | |
| Interventions | Three interventions (all 20 children/adolescents participated in each of the three interventions):
Duration: 63 days (3 x 21‐day treatment periods) | |
| Outcomes | Relevant outcomes:
Other outcomes:
| |
| Notes | ClinicalTrials identifier: not available Authors' affiliation: university and National Institute of Mental Health Donnelly 1986 is a pilot study of Donnelly 1989 and therefore have overlapping data *Unpublished data on the Clinical Global Impression scale sought on three separate occasions but not obtained | |
| Risk of bias | ||
| Bias | Authors' judgement | Support for judgement |
| Random sequence generation (selection bias) | Unclear risk | Method of sequence generation not described |
| Allocation concealment (selection bias) | Unclear risk | Method of allocation concealment not described |
| Incomplete outcome data (attrition bias) | Low risk | All recruited children/adolescents included in analyses. Only one dropout, with reasons provided |
| Selective reporting (reporting bias) | Unclear risk | Study protocol not available and the possibility of reporting bias could not be assessed |
| Other bias | Unclear risk | No information on the validity of the primary outcome measure provided |
| Blinding of participants and personnel (performance bias) | Unclear risk | Blinding of participants and personnel not described |
| Blinding of outcome assessment (detection bias) | Unclear risk | Blinding of outcome assessment not described |
| Methods | Multi‐center, randomized, double‐blind, placebo‐controlled, parallel‐group trial | |
| Participants | Sample size: 314 children/adolescents with an ADHD diagnosis according to DSM‐IV‐TR criteria | |
| Interventions | Four interventions (312 children/adolescents participated in one of four interventions):
Duration: 28 days | |
| Outcomes | Relevant outcomes:
| |
| Notes | ClinicalTrials.gov identifier: NCT00735371 Authors' affiliation: university and pharmaceutical industry | |
| Risk of bias | ||
| Bias | Authors' judgement | Support for judgement |
| Random sequence generation (selection bias) | Low risk | Sequence generated by a web‐based computer system |
| Allocation concealment (selection bias) | Low risk | Allocation concealment ensured using the web‐based computer system and third party, which serially numbered treatment bottles for each participant |
| Incomplete outcome data (attrition bias) | Low risk | Moderate attrition (16%). However, 98% of randomized children/adolescents included in primary efficacy analysis. Reasons for dropouts provided |
| Selective reporting (reporting bias) | Low risk | Data provided on all outcomes listed in the registered protocol. Study appears to be free of selective reporting |
| Other bias | Low risk | Study appears to be free of other biases |
| Blinding of participants and personnel (performance bias) | Unclear risk | Blinding of participants and personnel not described |
| Blinding of outcome assessment (detection bias) | Unclear risk | Blinding of outcome assessment not described |
| Methods | Single‐center, randomized, double‐blind, placebo‐controlled, parallel‐group trial Number of study sites: 1 | |
| Participants | Sample size: 24 children/adolescents with an ADHD diagnosis according to DSM‐IV‐TR criteria | |
| Interventions | Four interventions (24 children/adolescents participated in one of four interventions):
Duration: 28 days | |
| Outcomes | Relevant outcomes:
Other outcomes:
| |
| Notes | ClinicalTrials.gov identifier: not available Authors' affiliation: private organization and pharmaceutical industry | |
| Risk of bias | ||
| Bias | Authors' judgement | Support for judgement |
| Random sequence generation (selection bias) | Unclear risk | Method of random sequence generation not described |
| Allocation concealment (selection bias) | Unclear risk | Method of allocation concealment not described |
| Incomplete outcome data (attrition bias) | Unclear risk | Incomplete outcome data not addressed; number of completers not reported |
| Selective reporting (reporting bias) | Unclear risk | Study protocol not available and the possibility of reporting bias could not be assessed |
| Other bias | Low risk | Study appears to be free of other biases |
| Blinding of participants and personnel (performance bias) | Unclear risk | Blinding of participants and personnel not described |
| Blinding of outcome assessment (detection bias) | Unclear risk | Blinding of outcome assessment not described |
| Methods | Multi‐center, randomized, double‐blind, placebo‐controlled, parallel‐group trial | |
| Participants | Sample size: 62 children/adolescents with an ADHD diagnosis according to DSM‐III‐R criteria | |
| Interventions | Two interventions (62 children/adolescents participated in one of two interventions):
Duration: 365 days | |
| Outcomes | Relevant outcomes:
Other outcomes:
| |
| Notes | ClinicalTrials.gov identifier: not available Authors' affiliation: university and pharmaceutical industry | |
| Risk of bias | ||
| Bias | Authors' judgement | Support for judgement |
| Random sequence generation (selection bias) | Unclear risk | Method of sequence generation not described |
| Allocation concealment (selection bias) | Unclear risk | Method of allocation concealment not described |
| Incomplete outcome data (attrition bias) | Low risk | Moderate attrition (14%). However, all dropouts occurred prior to randomization. Reasons for dropout provided. All randomized children/adolescents included in primary analysis |
| Selective reporting (reporting bias) | Unclear risk | Study protocol not available and the possibility of reporting bias could not be assessed |
| Other bias | Low risk | Study appears to be free of other biases |
| Blinding of participants and personnel (performance bias) | Unclear risk | Blinding of participants and personnel not described |
| Blinding of outcome assessment (detection bias) | Unclear risk | Blinding of outcome assessment not described |
| Methods | Single‐center, randomized, double‐blind, placebo‐controlled, cross‐over trial Number of study sites: 1 | |
| Participants | Sample size: 35 children/adolescents with an ADHD diagnosis according to DSM‐IV criteria | |
| Interventions | 4 interventions:*
Duration: 56 days (4 x 14‐day treatment periods) | |
| Outcomes | Relevant outcomes:
Other outcomes:
| |
| Notes | ClinicalTrial.gov identifier: not available Authors' affiliation: National Insitute of Mental Health | |
| Risk of bias | ||
| Bias | Authors' judgement | Support for judgement |
| Random sequence generation (selection bias) | Unclear risk | Method of sequence generation not described |
| Allocation concealment (selection bias) | Unclear risk | Method of allocation concealment not described |
| Incomplete outcome data (attrition bias) | Low risk | Low attrition (7%), and reasons provided. All dropouts occurred prior to randomization. All randomized children/adolescents completed the trial and included in primary analysis |
| Selective reporting (reporting bias) | Unclear risk | Study protocol not available and the possibility of reporting bias could not be assessed |
| Other bias | Low risk | Study appears to be free of other biases |
| Blinding of participants and personnel (performance bias) | Low risk | Intervention and placebo described as identical |
| Blinding of outcome assessment (detection bias) | Unclear risk | Blinding of outcome assessment not described |
| Methods | Single‐center, randomized, double‐blind, placebo‐controlled, cross‐over trial Number of study sites: 1 | |
| Participants | Sample size: 84 children/adolescents with an ADHD diagnosis according to DSM‐IV criteria | |
| Interventions | Two conditions (84 children/adolescents participated in one of two conditions):
Children/adolescents received either the four mixed amphetamine salt OR methylphenidate conditions (determined by his or her physician) in a randomly assigned sequence | |
| Outcomes | Relevant outcomes:
Other outcomes:
| |
| Notes | ClinicalTrial.gov identifier: not available Authors' affiliations: university | |
| Risk of bias | ||
| Bias | Authors' judgement | Support for judgement |
| Random sequence generation (selection bias) | Unclear risk | Method of sequence generation not described |
| Allocation concealment (selection bias) | Low risk | A third party pharmacist prepared individually sealed bottles dated by week |
| Incomplete outcome data (attrition bias) | Unclear risk | Study did not describe if any children/adolescents dropped out from the trial |
| Selective reporting (reporting bias) | Unclear risk | Study protocol not available and the possibility of reporting bias could not be assessed |
| Other bias | Low risk | Study appears to be free of other biases |
| Blinding of participants and personnel (performance bias) | Low risk | Intervention and placebo are described as identical |
| Blinding of outcome assessment (detection bias) | Low risk | Clinician, teacher and parent (outcome assessors) were blinded to treatment order |
| Methods | Multi‐center, randomized, double‐blind, placebo‐controlled, cross‐over trial | |
| Participants | Sample size: 51 children/adolescents with an ADHD diagnosis according to DSM‐IV criteria | |
| Interventions | Five interventions (all 51 children/adolescents participated in each of the five interventions):
Duration: 35 days (5 x 7‐day treatment periods) | |
| Outcomes | Relevant outcomes:
Other outcomes:
| |
| Notes | ClinicalTrial.gov identifier: not available | |
| Risk of bias | ||
| Bias | Authors' judgement | Support for judgement |
| Random sequence generation (selection bias) | Unclear risk | Method of sequence generation not described |
| Allocation concealment (selection bias) | Unclear risk | Method of allocation concealment not described |
| Incomplete outcome data (attrition bias) | Low risk | Low attrition (4%) and reasons provided. All randomized children/adolescents included in primary analysis |
| Selective reporting (reporting bias) | Unclear risk | Study protocol not available and the possibility of reporting bias could not be assessed |
| Other bias | Low risk | Study appears to be free of other biases |
| Blinding of participants and personnel (performance bias) | Unclear risk | Blinding of participants and personnel not described |
| Blinding of outcome assessment (detection bias) | Unclear risk | Blinding of outcome assessment not described |
| Methods | Single‐center, randomized, double‐blind, placebo‐controlled, cross‐over trial Number of study sites: 1 | |
| Participants | Sample size: 14 children/adolescents with an ADHD diagnosis according to DSM‐III criteria Dropouts: NR | |
| Interventions | Four interventions (all 14 children/adolescents participated in each of the four interventions):
Duration: 28 days (4 x 7‐day treatment periods) | |
| Outcomes | Relevant outcomes:
Other outcomes:
| |
| Notes | ClinicalTrials.gov identifier: not available Authors' affiliation: university | |
| Risk of bias | ||
| Bias | Authors' judgement | Support for judgement |
| Random sequence generation (selection bias) | Unclear risk | Method of sequence generation not described |
| Allocation concealment (selection bias) | Unclear risk | Method of allocation concealment not described |
| Incomplete outcome data (attrition bias) | Unclear risk | Dropouts not discussed |
| Selective reporting (reporting bias) | Unclear risk | Study protocol not available and the possibility of reporting bias could not be assessed |
| Other bias | Low risk | Study appears to be free of other biases |
| Blinding of participants and personnel (performance bias) | Low risk | Intervention and placebo are described as identical |
| Blinding of outcome assessment (detection bias) | Unclear risk | Blinding of outcome assessment not described |
| Methods | Single‐center, randomized, double‐blind, placebo‐controlled, parallel‐group trial Number of study sites: 1 | |
| Participants | Sample size: 59* children/adolescents with an ADHD diagnosis according to the Diagnostic Interview Schedule for Children | |
| Interventions | Three interventions (58 children/adolescents participated in one of three interventions):
Duration: 21 days | |
| Outcomes | Relevant outcomes:
Other outcomes:
| |
| Notes | ClinicalTrials.gov identifier: not available Author's affiliation: university and pharmaceutical industry | |
| Risk of bias | ||
| Bias | Authors' judgement | Support for judgement |
| Random sequence generation (selection bias) | Unclear risk | Method of sequence generation not described |
| Allocation concealment (selection bias) | Unclear risk | Method of allocation concealment not described |
| Incomplete outcome data (attrition bias) | Low risk | Low attrition (10%), and reasons provided. All randomized children/adolescents included in primary analysis |
| Selective reporting (reporting bias) | Unclear risk | Study protocol not available and the possibility of reporting bias could not be assessed |
| Other bias | Low risk | Study appears to be free of other biases |
| Blinding of participants and personnel (performance bias) | Low risk | Intervention and placebo are described as identical |
| Blinding of outcome assessment (detection bias) | Unclear risk | Blinding of outcome assessment not described |
| Methods | Multi‐center, randomized, placebo‐controlled, cross‐over trial | |
| Participants | Sample size: 36* children/adolescents with an ADHD diagnosis according to DMS‐IV‐TR criteria | |
| Interventions | Three interventions (all 36 children/adolescents participated in each of the three interventions):
Duration: 42 days (3 x 14‐day treatment periods) | |
| Outcomes | Relevant outcomes:
Other outcomes:
| |
| Notes | ClinicalTrials.gov identifier: NCT01220440 *Data only provided on those children/adolescents who completed the trial; no information provided regarding number of children/adolescents randomized | |
| Risk of bias | ||
| Bias | Authors' judgement | Support for judgement |
| Random sequence generation (selection bias) | Unclear risk | Method of sequence generation not described |
| Allocation concealment (selection bias) | Unclear risk | Method of allocation concealment not described |
| Incomplete outcome data (attrition bias) | High risk | Primary analysis only included a subset of completers without any reason provided. No information on non‐completers provided |
| Selective reporting (reporting bias) | High risk | Although the registered protocol stated that they would collect adverse events using the Side‐Effects Rating Scale, this was not reported in the published manuscript |
| Other bias | Unclear risk | No information on the validity of the primary outcome measure provided |
| Blinding of participants and personnel (performance bias) | High risk | Interventions and placebo were not identical |
| Blinding of outcome assessment (detection bias) | Unclear risk | Blinding of outcome assessment not described |
| Methods | Single‐center, randomized, double‐blind, placebo‐controlled, cross‐over trial Number of study sites: 1 | |
| Participants | Sample size: 32* children/adolescents with an ADHD diagnosis according to DSM‐IV criteria | |
| Interventions | Three interventions (all 32 children/adolescents participated in each of the three interventions):
Duration: 63 days (3 x 21‐day treatment periods) | |
| Outcomes | Relevant outcomes:
| |
| Notes | ClinicalTrial.gov identifier: not available Authors' affiliation: university and National Institute for Mental Health *Clinical characteristics were presented on 42 children/adolescents, 10 of whom participated in a separate pilot program | |
| Risk of bias | ||
| Bias | Authors' judgement | Support for judgement |
| Random sequence generation (selection bias) | Unclear risk | Method of sequence generation not described |
| Allocation concealment (selection bias) | Unclear risk | Method of allocation concealment not described |
| Incomplete outcome data (attrition bias) | Low risk | Moderate attrition (14%), with reasons provided |
| Selective reporting (reporting bias) | Unclear risk | Study protocol not available and the possibility of reporting bias could not be assessed |
| Other bias | Low risk | Study appears to be free of other biases |
| Blinding of participants and personnel (performance bias) | Low risk | Intervention and placebo are described as identical |
| Blinding of outcome assessment (detection bias) | Unclear risk | Blinding of outcome assessment not described |
| Methods | Single‐center, randomized, double‐blind, placebo‐controlled, cross‐over trial Number of study sites: 1 | |
| Participants | Sample size: 22 children/adolescents with an ADHD diagnosis according to DSM‐III criteria | |
| Interventions | Two interventions (all 22 children/adolescents participated in both interventions):
Duration: 28 days (2 x 14‐day treatment periods) | |
| Outcomes | Relevant outcomes:
Other outcomes:
| |
| Notes | ClinicalTrials.gov identifier: not available Authors' affiliation: university | |
| Risk of bias | ||
| Bias | Authors' judgement | Support for judgement |
| Random sequence generation (selection bias) | Unclear risk | Method of sequence generation not described |
| Allocation concealment (selection bias) | Unclear risk | Method of allocation concealment not described |
| Incomplete outcome data (attrition bias) | High risk | Reasons for exclusions from the analysis not provided. Methods of analysis not described. Number of individuals included in the analyses not reported |
| Selective reporting (reporting bias) | Unclear risk | Study protocol not available and the possibility of reporting bias could not be assessed |
| Other bias | Low risk | Study appears to be free of other biases |
| Blinding of participants and personnel (performance bias) | Unclear risk | Blinding of participants and personnel not described |
| Blinding of outcome assessment (detection bias) | Unclear risk | Blinding of outcome assessment not described |
| Methods | Single‐center, randomized, double‐blind, placebo‐controlled, cross‐over trial Number of study sites: 1 | |
| Participants | Sample size: 34* children/adolescents with an ADHD diagnosis according to DSM‐IV criteria | |
| Interventions | Two conditions (28 children/adolescents participated in one of two conditions)*:
Amphetamine or methylphenidate determined by a physician | |
| Outcomes | Relevant outcomes:
| |
| Notes | ClinicalTrial.gov identifier: not available Authors' affiliations: university | |
| Risk of bias | ||
| Bias | Authors' judgement | Support for judgement |
| Random sequence generation (selection bias) | Unclear risk | Method of sequence generation not described |
| Allocation concealment (selection bias) | Unclear risk | Method of allocation concealment not sufficiently described |
| Incomplete outcome data (attrition bias) | High risk | Reasons for attrition not described. In addition, six participants were dropped from the analysis, and their last data point was not carried forward |
| Selective reporting (reporting bias) | Unclear risk | Study protocol not available and the possibility of reporting bias could not be assessed |
| Other bias | Low risk | Study appears to be free of other biases |
| Blinding of participants and personnel (performance bias) | Low risk | Intervention and placebo described as identical |
| Blinding of outcome assessment (detection bias) | Low risk | Outcome assessors blinded to order of trial interventions |
| Methods | Multi‐center, randomized, double‐blind, placebo‐controlled, parallel‐group trial | |
| Participants | Sample size: 287* children/adolescents with an ADHD diagnosis according to DSM‐IV‐TR criteria | |
| Interventions | Five interventions (287 children/adolescents participated in one of five interventions):
Duration: 28 days (4 x 7‐day treatment periods) | |
| Outcomes | Relevant outcomes:
Other outcomes:
| |
| Notes | ClinicalTrials.gov Identifier: NCT00507065 Authors' affiliation: university and pharmaceutical industry | |
| Risk of bias | ||
| Bias | Authors' judgement | Support for judgement |
| Random sequence generation (selection bias) | Unclear risk | Method of sequence generation not described |
| Allocation concealment (selection bias) | Unclear risk | Method of allocation concealment not described |
| Incomplete outcome data (attrition bias) | Low risk | Low attrition (10%), and reasons provided. Only 3% of children/adolescents excluded from analysis due to no post‐baseline primary efficacy assessment |
| Selective reporting (reporting bias) | Low risk | Data provided on all outcomes listed in the registered protocol. Study appears to be free of selective reporting |
| Other bias | Low risk | Study appears to be free of other biases |
| Blinding of participants and personnel (performance bias) | Unclear risk | Blinding of participants and personnel not described |
| Blinding of outcome assessment (detection bias) | Unclear risk | Blinding of outcome assessment not described |
| Methods | Single‐center, randomized, double‐blind, placebo‐controlled, cross‐over trial Number of study sites: 1 | |
| Participants | Sample size: 33 children/adolescents with an ADHD diagnosis according to DSM‐IV criteria | |
| Interventions | Six interventions (all 33 children/adolescents participated in each of the six interventions):
Duration: 49 days (6 x 7‐day treatment periods defined by the six medication conditions above, plus an extra seven‐day period to provide an opportunity to make‐up any missed weeks) | |
| Outcomes | Relevant outcomes:
Other outcomes:
| |
| Notes | ClinicalTrials identifier: not available Authors' affiliation: university and pharmaceutical industry | |
| Risk of bias | ||
| Bias | Authors' judgement | Support for judgement |
| Random sequence generation (selection bias) | Unclear risk | Method of sequence generation not described |
| Allocation concealment (selection bias) | Unclear risk | Method of allocation concealment not described |
| Incomplete outcome data (attrition bias) | High risk | Low attrition (8%), but reasons for dropout not provided, and only 88% of children/adolescents contributed to primary analysis |
| Selective reporting (reporting bias) | Unclear risk | Study protocol not available and the possibility of reporting bias could not be assessed |
| Other bias | Low risk | Study appears to be free of other biases |
| Blinding of participants and personnel (performance bias) | Low risk | Intervention and placebo described as identical |
| Blinding of outcome assessment (detection bias) | Unclear risk | Blinding of outcome assessment not described |
| Methods | Multi‐center, randomized, double‐blind, placebo‐controlled, cross‐over trial | |
| Participants | Sample size: 117* children/adolescents with an ADHD diagnosis according to DSM‐IV‐TR criteria | |
| Interventions | Two interventions (all 117 children/adolescents participated in both interventions):
Duration: 14 days (2 x 7‐day treatment periods) | |
| Outcomes | Relevant outcomes:
| |
| Notes | ClinicalTrials.gov Identifier: NCT00500149 Authors' affiliation: university and pharmaceutical industry *Clinical characteristics provided on 129 children/adolescents first enrolled into an open‐label dose‐optimisation phase. Of these, 117 children/adolescents randomized to the double‐blind phase | |
| Risk of bias | ||
| Bias | Authors' judgement | Support for judgement |
| Random sequence generation (selection bias) | Unclear risk | Method of sequence generation not described |
| Allocation concealment (selection bias) | Unclear risk | Method of allocation concealment not described |
| Incomplete outcome data (attrition bias) | Low risk | Low attrition (9%), and reasons provided; 97% of randomized children/adolescents included in primary analysis. Four individuals not included due to no post‐baseline efficacy measure |
| Selective reporting (reporting bias) | Unclear risk | Data provided on all outcomes listed in the registered protocol. However, also reported on additional outcomes not listed in protocol |
| Other bias | Low risk | Study appears to be free of other biases |
| Blinding of participants and personnel (performance bias) | Low risk | Intervention and placebo described as identical |
| Blinding of outcome assessment (detection bias) | Unclear risk | Blinding of outcome assessment not described |
ADHD: attention deficit hyperactivity disorder.
DSM‐III: Diagnostic and Statistical Manual of Mental Disorders, Third Edition.
DSM‐III‐R: Diagnostic and Statistical Manual of Mental Disorders, Third Edition, Revised.
DSM‐IV: Diagnostic and Statistical Manual of Mental Disorders, Fourth Edition.
DSM‐IV‐TR: Diagnostic and Statistical Manual of Mental Disorders, Fourth Edition, Text Revision.
ITT: intention‐to‐treat.
NR: not reported.
Characteristics of excluded studies [ordered by study ID]
| Study | Reason for exclusion |
| No placebo comparison assessed | |
| ADHD diagnosis not confirmed using formal diagnostic criteria | |
| No direct amphetamine ‐ placebo comparison | |
| Not a randomized controlled trial | |
| Not a randomized controlled trial | |
| Not a randomized controlled trial | |
| Not a randomized controlled trial | |
| ADHD diagnosis not confirmed using formal diagnostic criteria | |
| Not a randomized controlled trial | |
| No placebo comparison assessed | |
| Not a randomized controlled trial | |
| No placebo comparison assessed | |
| Study design was a series of multiple, cross‐over, randomized controlled trials; our review included only single, cross‐over, randomized controlled trials | |
| Not a randomized controlled trial | |
| Not a randomized controlled trial | |
| Not a randomized controlled trial | |
| Study design was a series of multiple, cross‐over, randomized controlled trials; our review included only single, cross‐over, randomized controlled trials | |
| Not a randomized controlled trial | |
| Included children/adolescents who had comorbid bipolar disorder and were treated with mood stabilizers (divalproex sodium) | |
| Not a randomized controlled trial | |
| Not a randomized controlled trial | |
| ADHD diagnosis not confirmed using formal diagnostic criteria | |
| Not a randomized controlled trial | |
| Not a randomized controlled trial | |
| Not a randomized controlled trial | |
| Study participants were adults with ADHD |
ADHD: attention deficit hyperactivity disorder.
Characteristics of studies awaiting assessment [ordered by study ID]
| Methods | Double‐blind, controlled trial* |
| Participants | Sample size: 20 hyperactive children** |
| Interventions | Amphetamine and placebo |
| Outcomes | |
| Notes | *Information on whether or not the trial was randomized is necessary for inclusion into this review |
| Methods | Double‐blind, three‐way study design |
| Participants | Children with hyperactivity |
| Interventions | Thioridazine, dextroamphetamine and placebo |
| Outcomes | Global behavior evaluation |
| Notes | Only abstract available. Detailed outcome data not in abstract. Unsure:
Author has been contacted three times but no response received as yet |
ADHD: attention deficit hyperactivity disorder.
Characteristics of ongoing studies [ordered by study ID]
| Trial name or title | Effectiveness of an extended‐release stimulant medication in treating preschool children with attention deficit hyperactivity disorder |
| Methods | Six‐week, placebo‐controlled, cross‐over trial |
| Participants | Children aged 3 years to 6 years with ADHD |
| Interventions | Mixed amphetamine salts (long acting) and placebo |
| Outcomes | Primary
Secondary
|
| Starting date | June 2008 |
| Contact information | Dr. John Fanton, Baystate Medical Center |
| Notes | Clinicaltrials.gov identifier: NCT00712699. States that recruitment period ended in August 2010. However, no results have been published as yet. Currently, only abstract available |
| Trial name or title | A randomized, double‐blind, placebo‐controlled, cross‐over, laboratory, classroom study to evaluate the safety and efficacy of d‐amphetamine transdermal drug delivery system (d‐ATS) compared to placebo in children and adolescents with ADHD |
| Methods | Two‐week, double‐blind, randomized cross‐over trial |
| Participants | Children and adolescents aged 6 years to 17 years with ADHD |
| Interventions | D‐Amphetamine Transdermal System and placebo patch |
| Outcomes | Primary
|
| Starting date | October 2012 |
| Contact information | Dr. James Waxmonsky (affiliation not stated) |
| Notes | ClinicalTrials.gov identifier: NCT01711021. States that recruitment period ended in March 2013. However, no results have been published as yet. No abstract available |
ADHD: attention deficit hyperactivity disorder.
Data and analyses
| Outcome or subgroup title | No. of studies | No. of participants | Statistical method | Effect size |
| 1 Total ADHD symptom score ‐ parent ratings Show forest plot | 7 | 1247 | Std. Mean Difference (IV, Random, 95% CI) | ‐0.57 [‐0.86, ‐0.27] |
| Analysis 1.1 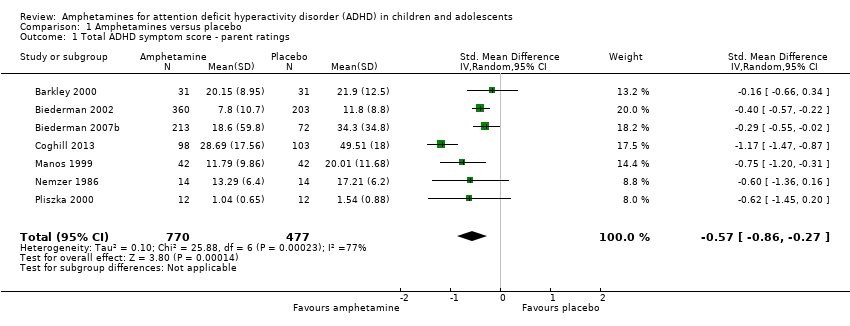 Comparison 1 Amphetamines versus placebo, Outcome 1 Total ADHD symptom score ‐ parent ratings. | ||||
| 2 Hyperactivity/impulsivity ‐ parent ratings Show forest plot | 2 | 132 | Std. Mean Difference (IV, Random, 95% CI) | ‐0.54 [‐0.89, ‐0.19] |
| Analysis 1.2  Comparison 1 Amphetamines versus placebo, Outcome 2 Hyperactivity/impulsivity ‐ parent ratings. | ||||
| 3 Total ADHD symptom score ‐ teacher ratings Show forest plot | 5 | 745 | Std. Mean Difference (IV, Random, 95% CI) | ‐0.55 [‐0.83, ‐0.27] |
| Analysis 1.3  Comparison 1 Amphetamines versus placebo, Outcome 3 Total ADHD symptom score ‐ teacher ratings. | ||||
| 4 Hyperactivity/impulsivity ‐ teacher ratings Show forest plot | 1 | Std. Mean Difference (IV, Random, 95% CI) | Subtotals only | |
| Analysis 1.4  Comparison 1 Amphetamines versus placebo, Outcome 4 Hyperactivity/impulsivity ‐ teacher ratings. | ||||
| 5 Inattention ‐ teacher ratings Show forest plot | 1 | Std. Mean Difference (IV, Random, 95% CI) | Subtotals only | |
| Analysis 1.5  Comparison 1 Amphetamines versus placebo, Outcome 5 Inattention ‐ teacher ratings. | ||||
| 6 Total ADHD symptom score ‐ clinician ratings Show forest plot | 3 | 813 | Std. Mean Difference (IV, Random, 95% CI) | ‐0.84 [‐1.32, ‐0.36] |
| Analysis 1.6  Comparison 1 Amphetamines versus placebo, Outcome 6 Total ADHD symptom score ‐ clinician ratings. | ||||
| 7 Hyperactivity/impulsivity ‐ clinician ratings Show forest plot | 3 | 813 | Std. Mean Difference (IV, Random, 95% CI) | ‐0.75 [‐1.28, ‐0.23] |
| Analysis 1.7 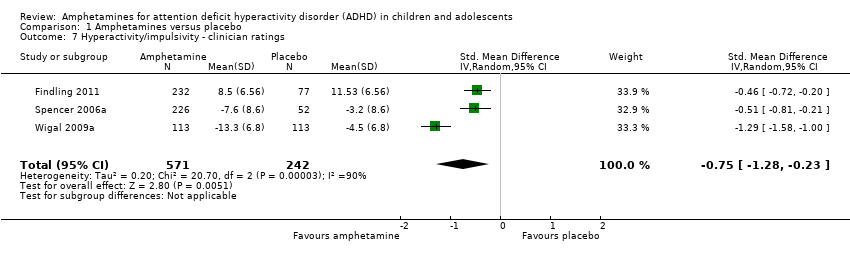 Comparison 1 Amphetamines versus placebo, Outcome 7 Hyperactivity/impulsivity ‐ clinician ratings. | ||||
| 8 Inattention ‐ clinician ratings Show forest plot | 3 | 813 | Std. Mean Difference (IV, Random, 95% CI) | ‐0.78 [‐1.26, ‐0.30] |
| Analysis 1.8  Comparison 1 Amphetamines versus placebo, Outcome 8 Inattention ‐ clinician ratings. | ||||
| 9 Total ADHD symptom score ‐ investigator/research personnel ratings Show forest plot | 3 | 630 | Std. Mean Difference (IV, Random, 95% CI) | ‐1.15 [‐1.87, ‐0.44] |
| Analysis 1.9  Comparison 1 Amphetamines versus placebo, Outcome 9 Total ADHD symptom score ‐ investigator/research personnel ratings. | ||||
| 10 Hyperactivity/impulsivity ‐ investigator/research personnel ratings Show forest plot | 2 | 280 | Std. Mean Difference (IV, Random, 95% CI) | ‐1.46 [‐1.83, ‐1.08] |
| Analysis 1.10 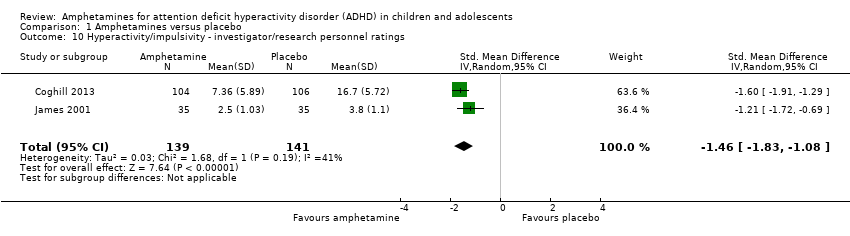 Comparison 1 Amphetamines versus placebo, Outcome 10 Hyperactivity/impulsivity ‐ investigator/research personnel ratings. | ||||
| 11 Inattention ‐ investigator/research personnel ratings Show forest plot | 4 | 634 | Std. Mean Difference (IV, Random, 95% CI) | ‐0.73 [‐1.42, ‐0.04] |
| Analysis 1.11  Comparison 1 Amphetamines versus placebo, Outcome 11 Inattention ‐ investigator/research personnel ratings. | ||||
| 12 Proportion of responders (Clinical Global Impression ‐ Improvement; CGI ‐ I) Show forest plot | 9 | 2207 | Risk Ratio (M‐H, Random, 95% CI) | 3.36 [2.48, 4.55] |
| Analysis 1.12  Comparison 1 Amphetamines versus placebo, Outcome 12 Proportion of responders (Clinical Global Impression ‐ Improvement; CGI ‐ I). | ||||
| 13 Clinical Global Impression ‐ Severity (CGI ‐ S) score Show forest plot | 2 | 86 | Std. Mean Difference (IV, Random, 95% CI) | ‐0.86 [‐1.72, ‐0.01] |
| Analysis 1.13 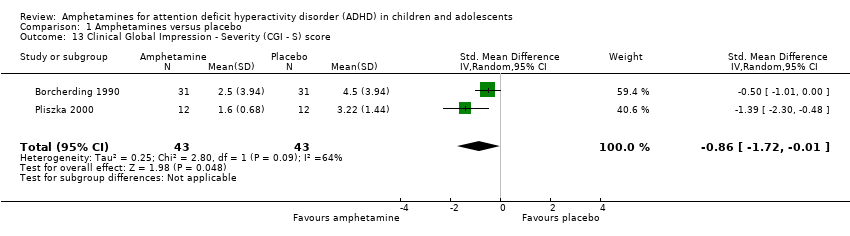 Comparison 1 Amphetamines versus placebo, Outcome 13 Clinical Global Impression ‐ Severity (CGI ‐ S) score. | ||||
| 14 Academic performance Show forest plot | 8 | 826 | Std. Mean Difference (IV, Random, 95% CI) | 0.56 [0.39, 0.73] |
| Analysis 1.14 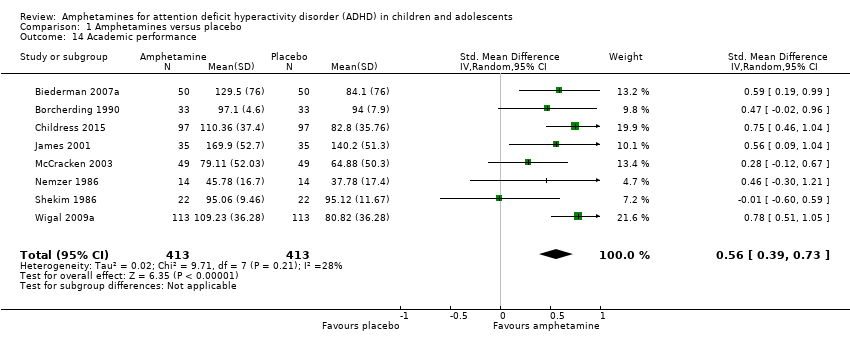 Comparison 1 Amphetamines versus placebo, Outcome 14 Academic performance. | ||||
| 15 Quality of life Show forest plot | 1 | Std. Mean Difference (IV, Random, 95% CI) | Subtotals only | |
| Analysis 1.15  Comparison 1 Amphetamines versus placebo, Outcome 15 Quality of life. | ||||
| 16 Retention: proportion of participants who completed the trial Show forest plot | 11 | 2381 | Risk Ratio (M‐H, Random, 95% CI) | 1.03 [0.97, 1.10] |
| Analysis 1.16  Comparison 1 Amphetamines versus placebo, Outcome 16 Retention: proportion of participants who completed the trial. | ||||
| 17 Proportion of participants experiencing decreased appetite Show forest plot | 11 | 2467 | Risk Ratio (M‐H, Random, 95% CI) | 6.31 [2.58, 15.46] |
| Analysis 1.17  Comparison 1 Amphetamines versus placebo, Outcome 17 Proportion of participants experiencing decreased appetite. | ||||
| 18 Proportion of participants experiencing insomnia/trouble sleeping Show forest plot | 10 | 2429 | Risk Ratio (M‐H, Random, 95% CI) | 3.80 [2.12, 6.83] |
| Analysis 1.18  Comparison 1 Amphetamines versus placebo, Outcome 18 Proportion of participants experiencing insomnia/trouble sleeping. | ||||
| 19 Proportion of participants experiencing abdominal pain Show forest plot | 10 | 2155 | Risk Ratio (M‐H, Random, 95% CI) | 1.44 [1.03, 2.00] |
| Analysis 1.19  Comparison 1 Amphetamines versus placebo, Outcome 19 Proportion of participants experiencing abdominal pain. | ||||
| 20 Proportion of participants experiencing nausea/vomiting Show forest plot | 6 | 1579 | Risk Ratio (M‐H, Random, 95% CI) | 1.63 [1.04, 2.56] |
| Analysis 1.20  Comparison 1 Amphetamines versus placebo, Outcome 20 Proportion of participants experiencing nausea/vomiting. | ||||
| 21 Proportion of participants experiencing headaches Show forest plot | 9 | 2091 | Risk Ratio (M‐H, Random, 95% CI) | 0.93 [0.75, 1.16] |
| Analysis 1.21 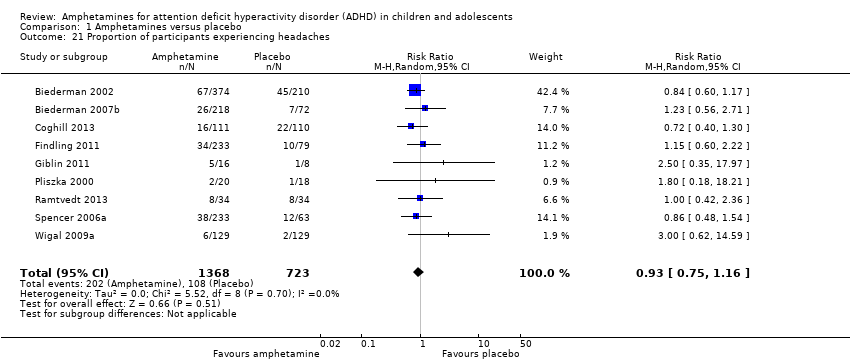 Comparison 1 Amphetamines versus placebo, Outcome 21 Proportion of participants experiencing headaches. | ||||
| 22 Proportion of participants experiencing anxiety/nervousness Show forest plot | 5 | 1088 | Risk Ratio (M‐H, Random, 95% CI) | 1.22 [0.78, 1.93] |
| Analysis 1.22  Comparison 1 Amphetamines versus placebo, Outcome 22 Proportion of participants experiencing anxiety/nervousness. | ||||
| 23 Proportion of participants who experienced at least one adverse event Show forest plot | 6 | 1742 | Risk Ratio (M‐H, Random, 95% CI) | 1.30 [1.18, 1.44] |
| Analysis 1.23 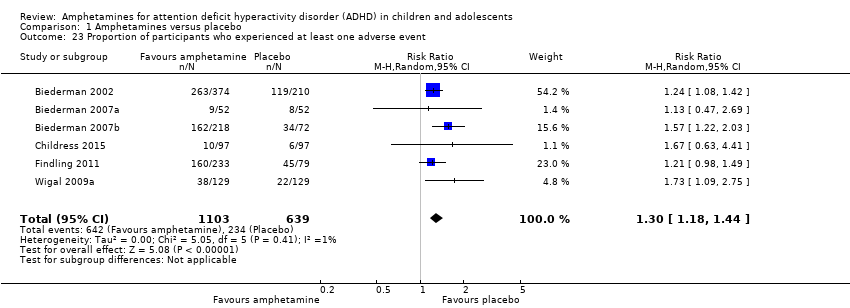 Comparison 1 Amphetamines versus placebo, Outcome 23 Proportion of participants who experienced at least one adverse event. | ||||
| 24 Proportion of participants who dropped out/withdrew due to an adverse event Show forest plot | 9 | 2160 | Risk Ratio (M‐H, Random, 95% CI) | 1.60 [0.86, 2.98] |
| Analysis 1.24  Comparison 1 Amphetamines versus placebo, Outcome 24 Proportion of participants who dropped out/withdrew due to an adverse event. | ||||
| Outcome or subgroup title | No. of studies | No. of participants | Statistical method | Effect size |
| 1 Total ADHD symptom score ‐ parent ratings Show forest plot | 7 | 1247 | Std. Mean Difference (IV, Random, 95% CI) | ‐0.57 [‐0.86, ‐0.27] |
| Analysis 2.1  Comparison 2 Subgroup analysis 1: Type of amphetamine, Outcome 1 Total ADHD symptom score ‐ parent ratings. | ||||
| 1.1 Dexamphetamine | 1 | 28 | Std. Mean Difference (IV, Random, 95% CI) | ‐0.60 [‐1.36, 0.16] |
| 1.2 Lisdexamphetamine | 2 | 486 | Std. Mean Difference (IV, Random, 95% CI) | ‐0.72 [‐1.59, 0.14] |
| 1.3 Mixed amphetamine salts | 4 | 733 | Std. Mean Difference (IV, Random, 95% CI) | ‐0.44 [‐0.63, ‐0.24] |
| 2 Proportion of responders (CGI ‐ I) Show forest plot | 9 | 2205 | Risk Ratio (M‐H, Random, 95% CI) | 3.38 [2.51, 4.55] |
| Analysis 2.2  Comparison 2 Subgroup analysis 1: Type of amphetamine, Outcome 2 Proportion of responders (CGI ‐ I). | ||||
| 2.1 Dexamphetamine | 1 | 64 | Risk Ratio (M‐H, Random, 95% CI) | 5.4 [2.38, 12.25] |
| 2.2 Lisdexamphetamine | 4 | 1065 | Risk Ratio (M‐H, Random, 95% CI) | 3.62 [2.04, 6.41] |
| 2.3 Mixed amphetamine salts | 4 | 1076 | Risk Ratio (M‐H, Random, 95% CI) | 2.72 [2.14, 3.45] |
| 3 Academic performance Show forest plot | 8 | 826 | Std. Mean Difference (IV, Random, 95% CI) | 0.56 [0.39, 0.73] |
| Analysis 2.3  Comparison 2 Subgroup analysis 1: Type of amphetamine, Outcome 3 Academic performance. | ||||
| 3.1 Dexamphetamine | 4 | 208 | Std. Mean Difference (IV, Random, 95% CI) | 0.40 [0.12, 0.67] |
| 3.2 Lisdexamphetamine | 1 | 226 | Std. Mean Difference (IV, Random, 95% CI) | 0.78 [0.51, 1.05] |
| 3.3 Mixed amphetamine salts | 3 | 392 | Std. Mean Difference (IV, Random, 95% CI) | 0.56 [0.29, 0.84] |
| 4 Retention: proportion of participants who completed the trial Show forest plot | 10 | 2364 | Risk Ratio (M‐H, Random, 95% CI) | 1.05 [0.99, 1.12] |
| Analysis 2.4 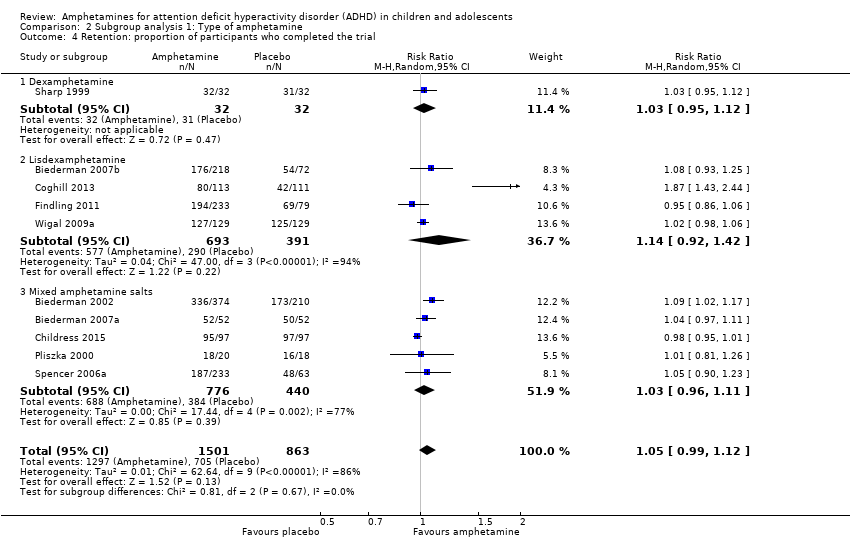 Comparison 2 Subgroup analysis 1: Type of amphetamine, Outcome 4 Retention: proportion of participants who completed the trial. | ||||
| 4.1 Dexamphetamine | 1 | 64 | Risk Ratio (M‐H, Random, 95% CI) | 1.03 [0.95, 1.12] |
| 4.2 Lisdexamphetamine | 4 | 1084 | Risk Ratio (M‐H, Random, 95% CI) | 1.14 [0.92, 1.42] |
| 4.3 Mixed amphetamine salts | 5 | 1216 | Risk Ratio (M‐H, Random, 95% CI) | 1.03 [0.96, 1.11] |
| 5 Proportion of participants who dropped out/withdrew due to an adverse event Show forest plot | 9 | 2161 | Risk Ratio (M‐H, Random, 95% CI) | 1.61 [0.86, 2.98] |
| Analysis 2.5  Comparison 2 Subgroup analysis 1: Type of amphetamine, Outcome 5 Proportion of participants who dropped out/withdrew due to an adverse event. | ||||
| 5.1 Dexamphetamine | 1 | 92 | Risk Ratio (M‐H, Random, 95% CI) | 3.0 [0.13, 71.78] |
| 5.2 Lisdexamphetamine | 4 | 1085 | Risk Ratio (M‐H, Random, 95% CI) | 2.03 [0.70, 5.91] |
| 5.3 Mixed amphetamine salts | 4 | 984 | Risk Ratio (M‐H, Random, 95% CI) | 1.27 [0.53, 3.06] |
| 6 Proportion of participants experiencing decreased appetite Show forest plot | 10 | 2273 | Risk Ratio (M‐H, Random, 95% CI) | 6.20 [2.44, 15.71] |
| Analysis 2.6 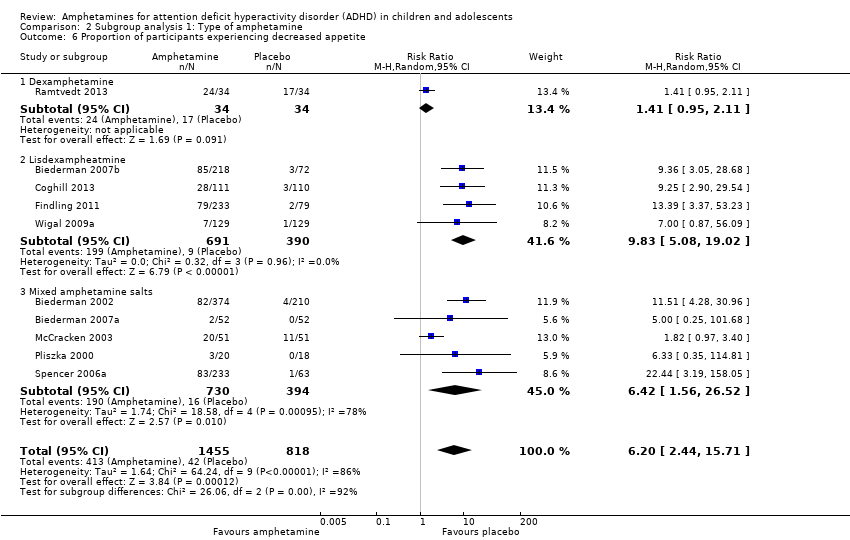 Comparison 2 Subgroup analysis 1: Type of amphetamine, Outcome 6 Proportion of participants experiencing decreased appetite. | ||||
| 6.1 Dexamphetamine | 1 | 68 | Risk Ratio (M‐H, Random, 95% CI) | 1.41 [0.95, 2.11] |
| 6.2 Lisdexampheatmine | 4 | 1081 | Risk Ratio (M‐H, Random, 95% CI) | 9.83 [5.08, 19.02] |
| 6.3 Mixed amphetamine salts | 5 | 1124 | Risk Ratio (M‐H, Random, 95% CI) | 6.42 [1.56, 26.52] |
| 7 Proportion of participants experiencing insomnia/trouble sleeping Show forest plot | 10 | 2429 | Risk Ratio (M‐H, Random, 95% CI) | 3.80 [2.12, 6.83] |
| Analysis 2.7 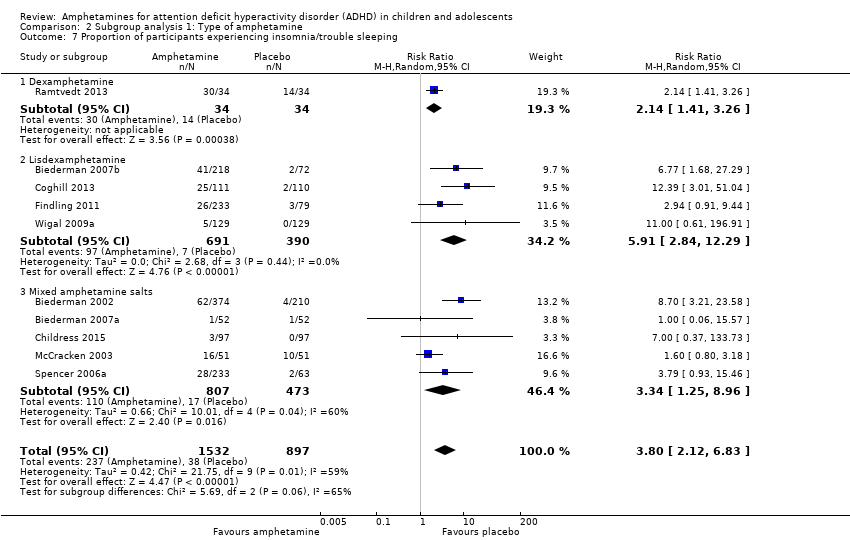 Comparison 2 Subgroup analysis 1: Type of amphetamine, Outcome 7 Proportion of participants experiencing insomnia/trouble sleeping. | ||||
| 7.1 Dexamphetamine | 1 | 68 | Risk Ratio (M‐H, Random, 95% CI) | 2.14 [1.41, 3.26] |
| 7.2 Lisdexamphetamine | 4 | 1081 | Risk Ratio (M‐H, Random, 95% CI) | 5.91 [2.84, 12.29] |
| 7.3 Mixed amphetamine salts | 5 | 1280 | Risk Ratio (M‐H, Random, 95% CI) | 3.34 [1.25, 8.96] |
| 8 Proportion of participants experiencing abdominal pain Show forest plot | 10 | 2155 | Risk Ratio (M‐H, Random, 95% CI) | 1.44 [1.03, 2.00] |
| Analysis 2.8 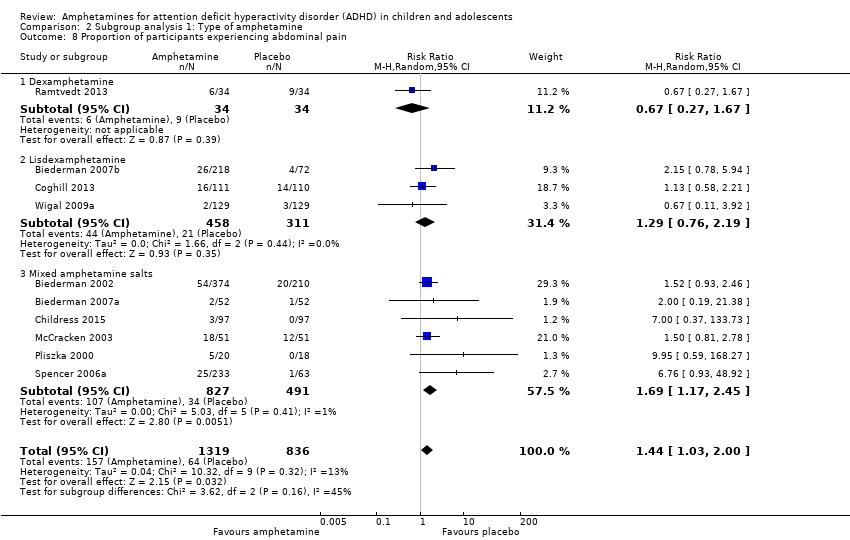 Comparison 2 Subgroup analysis 1: Type of amphetamine, Outcome 8 Proportion of participants experiencing abdominal pain. | ||||
| 8.1 Dexamphetamine | 1 | 68 | Risk Ratio (M‐H, Random, 95% CI) | 0.67 [0.27, 1.67] |
| 8.2 Lisdexamphetamine | 3 | 769 | Risk Ratio (M‐H, Random, 95% CI) | 1.29 [0.76, 2.19] |
| 8.3 Mixed amphetamine salts | 6 | 1318 | Risk Ratio (M‐H, Random, 95% CI) | 1.69 [1.17, 2.45] |
| 9 Proportion of participants experiencing headaches Show forest plot | 9 | 2063 | Risk Ratio (M‐H, Random, 95% CI) | 0.93 [0.75, 1.16] |
| Analysis 2.9  Comparison 2 Subgroup analysis 1: Type of amphetamine, Outcome 9 Proportion of participants experiencing headaches. | ||||
| 9.1 Dexamphetamine | 1 | 68 | Risk Ratio (M‐H, Random, 95% CI) | 1.0 [0.42, 2.36] |
| 9.2 Lisdexamphetamine | 5 | 1077 | Risk Ratio (M‐H, Random, 95% CI) | 1.07 [0.73, 1.57] |
| 9.3 Mixed amphetamine salts | 3 | 918 | Risk Ratio (M‐H, Random, 95% CI) | 0.85 [0.64, 1.14] |
| 10 Proportion of participants experiencing nausea/vomiting Show forest plot | 6 | 1579 | Risk Ratio (M‐H, Random, 95% CI) | 1.63 [1.04, 2.56] |
| Analysis 2.10  Comparison 2 Subgroup analysis 1: Type of amphetamine, Outcome 10 Proportion of participants experiencing nausea/vomiting. | ||||
| 10.1 Dexamphetamine | 1 | 68 | Risk Ratio (M‐H, Random, 95% CI) | 1.67 [0.68, 4.07] |
| 10.2 Lisdexamphetamine | 4 | 927 | Risk Ratio (M‐H, Random, 95% CI) | 1.48 [0.61, 3.61] |
| 10.3 Mixed amphetamine salts | 1 | 584 | Risk Ratio (M‐H, Random, 95% CI) | 1.84 [1.04, 3.27] |
| Outcome or subgroup title | No. of studies | No. of participants | Statistical method | Effect size |
| 1 Total ADHD symptom score ‐ parent ratings Show forest plot | 7 | 1247 | Std. Mean Difference (IV, Random, 95% CI) | ‐0.57 [‐0.86, ‐0.27] |
| Analysis 3.1  Comparison 3 Subgroup analysis 2: Type of amphetamine release formulation, Outcome 1 Total ADHD symptom score ‐ parent ratings. | ||||
| 1.1 Long acting | 3 | 1049 | Std. Mean Difference (IV, Random, 95% CI) | ‐0.61 [‐1.08, ‐0.13] |
| 1.2 Short acting | 4 | 198 | Std. Mean Difference (IV, Random, 95% CI) | ‐0.52 [‐0.82, ‐0.23] |
| 2 Proportion of responders (CGI ‐ I) Show forest plot | 9 | 2105 | Risk Ratio (M‐H, Random, 95% CI) | 3.31 [2.44, 4.49] |
| Analysis 3.2  Comparison 3 Subgroup analysis 2: Type of amphetamine release formulation, Outcome 2 Proportion of responders (CGI ‐ I). | ||||
| 2.1 Long acting | 6 | 1662 | Risk Ratio (M‐H, Random, 95% CI) | 3.55 [2.63, 4.79] |
| 2.2 Short acting | 3 | 443 | Risk Ratio (M‐H, Random, 95% CI) | 2.89 [1.39, 6.02] |
| 3 Academic performance Show forest plot | 8 | 826 | Std. Mean Difference (IV, Random, 95% CI) | 0.56 [0.39, 0.73] |
| Analysis 3.3 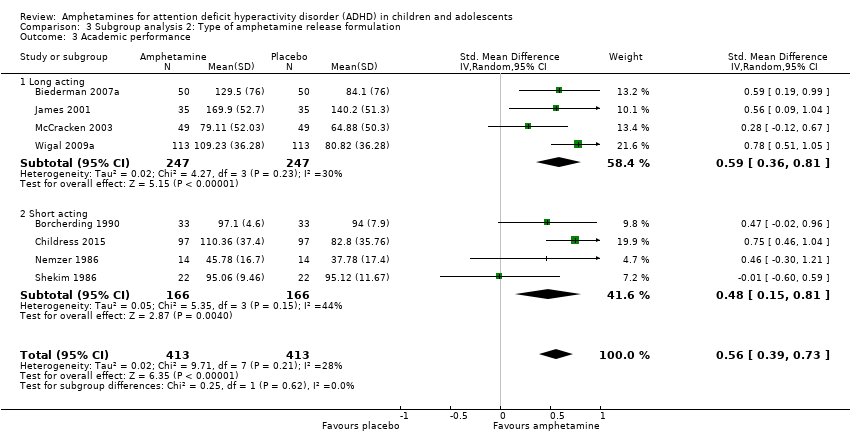 Comparison 3 Subgroup analysis 2: Type of amphetamine release formulation, Outcome 3 Academic performance. | ||||
| 3.1 Long acting | 4 | 494 | Std. Mean Difference (IV, Random, 95% CI) | 0.59 [0.36, 0.81] |
| 3.2 Short acting | 4 | 332 | Std. Mean Difference (IV, Random, 95% CI) | 0.48 [0.15, 0.81] |
| 4 Retention: proportion of participants who completed the trial Show forest plot | 10 | 2364 | Risk Ratio (M‐H, Random, 95% CI) | 1.05 [0.99, 1.12] |
| Analysis 3.4  Comparison 3 Subgroup analysis 2: Type of amphetamine release formulation, Outcome 4 Retention: proportion of participants who completed the trial. | ||||
| 4.1 Long acting | 6 | 1756 | Risk Ratio (M‐H, Random, 95% CI) | 1.11 [1.00, 1.24] |
| 4.2 Short acting | 4 | 608 | Risk Ratio (M‐H, Random, 95% CI) | 0.98 [0.95, 1.01] |
| 5 Proportion of participants experiencing decreased appetite Show forest plot | 10 | 2271 | Risk Ratio (M‐H, Random, 95% CI) | 6.18 [2.44, 15.63] |
| Analysis 3.5  Comparison 3 Subgroup analysis 2: Type of amphetamine release formulation, Outcome 5 Proportion of participants experiencing decreased appetite. | ||||
| 5.1 Long acting | 8 | 2165 | Risk Ratio (M‐H, Random, 95% CI) | 7.67 [3.33, 17.65] |
| 5.2 Short acting | 2 | 106 | Risk Ratio (M‐H, Random, 95% CI) | 1.58 [0.69, 3.62] |
| 6 Proportion of participants experiencing abdominal pain Show forest plot | 10 | 2155 | Risk Ratio (M‐H, Random, 95% CI) | 1.44 [1.03, 2.00] |
| Analysis 3.6 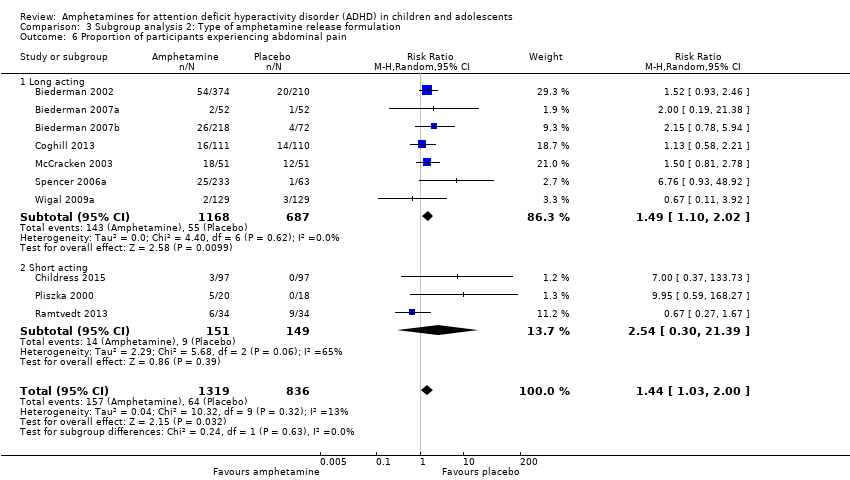 Comparison 3 Subgroup analysis 2: Type of amphetamine release formulation, Outcome 6 Proportion of participants experiencing abdominal pain. | ||||
| 6.1 Long acting | 7 | 1855 | Risk Ratio (M‐H, Random, 95% CI) | 1.49 [1.10, 2.02] |
| 6.2 Short acting | 3 | 300 | Risk Ratio (M‐H, Random, 95% CI) | 2.54 [0.30, 21.39] |
| Outcome or subgroup title | No. of studies | No. of participants | Statistical method | Effect size |
| 1 Total ADHD symptom score ‐ parent ratings Show forest plot | 7 | 1247 | Std. Mean Difference (IV, Random, 95% CI) | ‐0.57 [‐0.86, ‐0.27] |
| Analysis 4.1  Comparison 4 Subgroup analysis 3: Funding source, Outcome 1 Total ADHD symptom score ‐ parent ratings. | ||||
| 1.1 Industry | 5 | 1135 | Std. Mean Difference (IV, Random, 95% CI) | ‐0.53 [‐0.89, ‐0.16] |
| 1.2 Public | 1 | 84 | Std. Mean Difference (IV, Random, 95% CI) | ‐0.75 [‐1.20, ‐0.31] |
| 1.3 Not reported | 1 | 28 | Std. Mean Difference (IV, Random, 95% CI) | ‐0.60 [‐1.36, 0.16] |
| 2 Proportion of responders (CGI ‐ I) Show forest plot | 9 | 2210 | Risk Ratio (M‐H, Random, 95% CI) | 3.37 [2.50, 4.53] |
| Analysis 4.2 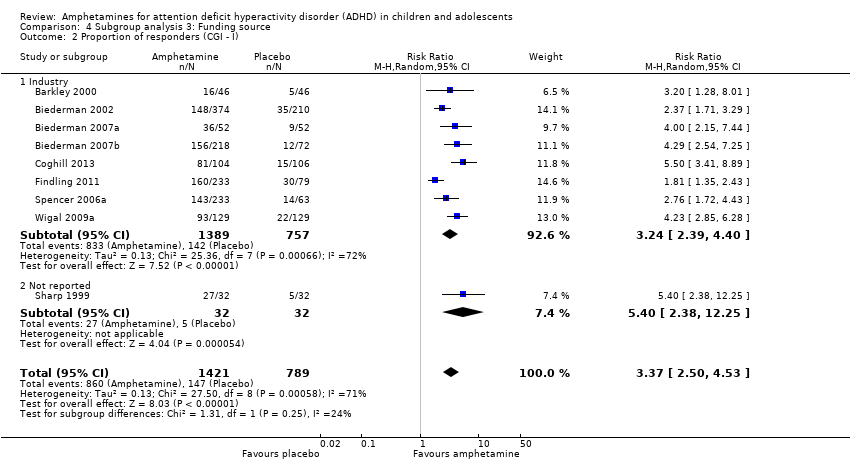 Comparison 4 Subgroup analysis 3: Funding source, Outcome 2 Proportion of responders (CGI ‐ I). | ||||
| 2.1 Industry | 8 | 2146 | Risk Ratio (M‐H, Random, 95% CI) | 3.24 [2.39, 4.40] |
| 2.2 Not reported | 1 | 64 | Risk Ratio (M‐H, Random, 95% CI) | 5.4 [2.38, 12.25] |
| 3 Academic performance Show forest plot | 8 | 826 | Std. Mean Difference (IV, Random, 95% CI) | 0.56 [0.39, 0.73] |
| Analysis 4.3  Comparison 4 Subgroup analysis 3: Funding source, Outcome 3 Academic performance. | ||||
| 3.1 Industry | 5 | 688 | Std. Mean Difference (IV, Random, 95% CI) | 0.64 [0.46, 0.81] |
| 3.2 Public | 1 | 44 | Std. Mean Difference (IV, Random, 95% CI) | ‐0.01 [‐0.60, 0.59] |
| 3.3 Not reported | 2 | 94 | Std. Mean Difference (IV, Random, 95% CI) | 0.47 [0.06, 0.88] |
| Outcome or subgroup title | No. of studies | No. of participants | Statistical method | Effect size |
| 1 Total ADHD symptom score ‐ parent ratings Show forest plot | 7 | 1247 | Std. Mean Difference (IV, Fixed, 95% CI) | ‐0.52 [‐0.64, ‐0.40] |
| Analysis 5.1  Comparison 5 Sensitivity analysis 1: Fixed‐effect model, Outcome 1 Total ADHD symptom score ‐ parent ratings. | ||||
| 2 Hyperactivity/impulsivity ‐ parent ratings Show forest plot | 2 | 132 | Std. Mean Difference (IV, Fixed, 95% CI) | ‐0.54 [‐0.89, ‐0.19] |
| Analysis 5.2  Comparison 5 Sensitivity analysis 1: Fixed‐effect model, Outcome 2 Hyperactivity/impulsivity ‐ parent ratings. | ||||
| 3 Total ADHD symptom score ‐ teacher ratings Show forest plot | 5 | 745 | Std. Mean Difference (IV, Fixed, 95% CI) | ‐0.47 [‐0.62, ‐0.32] |
| Analysis 5.3 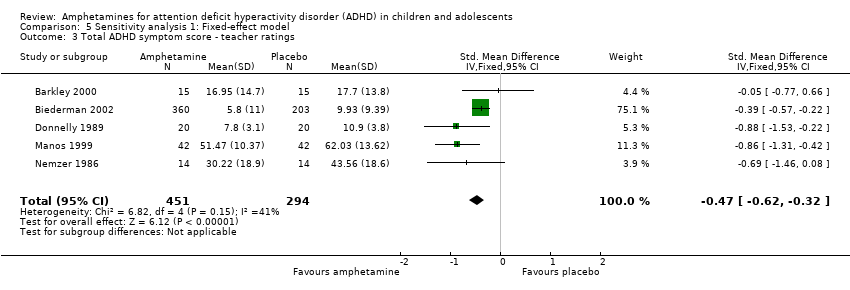 Comparison 5 Sensitivity analysis 1: Fixed‐effect model, Outcome 3 Total ADHD symptom score ‐ teacher ratings. | ||||
| 4 Hyperactivity/impulsivity ‐ teacher ratings Show forest plot | 1 | Std. Mean Difference (IV, Fixed, 95% CI) | Subtotals only | |
| Analysis 5.4  Comparison 5 Sensitivity analysis 1: Fixed‐effect model, Outcome 4 Hyperactivity/impulsivity ‐ teacher ratings. | ||||
| 5 Inattention ‐ teacher ratings Show forest plot | 1 | Std. Mean Difference (IV, Fixed, 95% CI) | Subtotals only | |
| Analysis 5.5  Comparison 5 Sensitivity analysis 1: Fixed‐effect model, Outcome 5 Inattention ‐ teacher ratings. | ||||
| 6 Total ADHD symptom score ‐ clinician ratings Show forest plot | 3 | 813 | Std. Mean Difference (IV, Fixed, 95% CI) | ‐0.84 [‐1.01, ‐0.68] |
| Analysis 5.6  Comparison 5 Sensitivity analysis 1: Fixed‐effect model, Outcome 6 Total ADHD symptom score ‐ clinician ratings. | ||||
| 7 Hyperactivity/impulsivity ‐ clinician ratings Show forest plot | 3 | 813 | Std. Mean Difference (IV, Fixed, 95% CI) | ‐0.74 [‐0.90, ‐0.58] |
| Analysis 5.7  Comparison 5 Sensitivity analysis 1: Fixed‐effect model, Outcome 7 Hyperactivity/impulsivity ‐ clinician ratings. | ||||
| 8 Inattention ‐ clinician ratings Show forest plot | 3 | 813 | Std. Mean Difference (IV, Fixed, 95% CI) | ‐0.77 [‐0.94, ‐0.61] |
| Analysis 5.8  Comparison 5 Sensitivity analysis 1: Fixed‐effect model, Outcome 8 Inattention ‐ clinician ratings. | ||||
| 9 Total ADHD symptom score ‐ investigator/research personnel ratings Show forest plot | 3 | 630 | Std. Mean Difference (IV, Fixed, 95% CI) | ‐1.08 [‐1.25, ‐0.91] |
| Analysis 5.9  Comparison 5 Sensitivity analysis 1: Fixed‐effect model, Outcome 9 Total ADHD symptom score ‐ investigator/research personnel ratings. | ||||
| 10 Hyperactivity/impulsivity ‐ Investigator/research personnel ratings Show forest plot | 2 | 280 | Std. Mean Difference (IV, Fixed, 95% CI) | ‐1.50 [‐1.76, ‐1.23] |
| Analysis 5.10  Comparison 5 Sensitivity analysis 1: Fixed‐effect model, Outcome 10 Hyperactivity/impulsivity ‐ Investigator/research personnel ratings. | ||||
| 11 Inattention ‐ investigator/research personnel ratings Show forest plot | 4 | 634 | Std. Mean Difference (IV, Fixed, 95% CI) | ‐0.76 [‐0.93, ‐0.60] |
| Analysis 5.11  Comparison 5 Sensitivity analysis 1: Fixed‐effect model, Outcome 11 Inattention ‐ investigator/research personnel ratings. | ||||
| 12 Proportion of responders (CGI ‐ I) Show forest plot | 9 | 2207 | Risk Ratio (M‐H, Fixed, 95% CI) | 3.11 [2.68, 3.61] |
| Analysis 5.12  Comparison 5 Sensitivity analysis 1: Fixed‐effect model, Outcome 12 Proportion of responders (CGI ‐ I). | ||||
| 13 CGI ‐ S score Show forest plot | 2 | 86 | Std. Mean Difference (IV, Fixed, 95% CI) | ‐0.71 [‐1.15, ‐0.27] |
| Analysis 5.13  Comparison 5 Sensitivity analysis 1: Fixed‐effect model, Outcome 13 CGI ‐ S score. | ||||
| 14 Quality of life Show forest plot | 1 | Std. Mean Difference (IV, Fixed, 95% CI) | Subtotals only | |
| Analysis 5.14 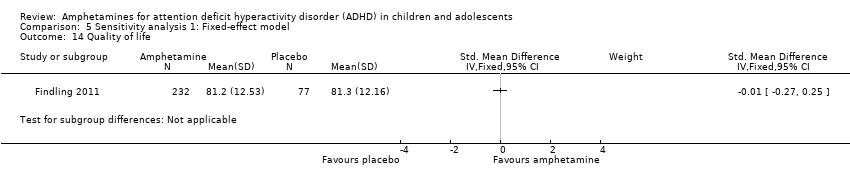 Comparison 5 Sensitivity analysis 1: Fixed‐effect model, Outcome 14 Quality of life. | ||||
| 15 Academic performance Show forest plot | 8 | 826 | Std. Mean Difference (IV, Fixed, 95% CI) | 0.59 [0.45, 0.73] |
| Analysis 5.15  Comparison 5 Sensitivity analysis 1: Fixed‐effect model, Outcome 15 Academic performance. | ||||
| 16 Retention: proportion of participants who completed the trial Show forest plot | 10 | 2364 | Risk Ratio (M‐H, Fixed, 95% CI) | 1.08 [1.04, 1.12] |
| Analysis 5.16  Comparison 5 Sensitivity analysis 1: Fixed‐effect model, Outcome 16 Retention: proportion of participants who completed the trial. | ||||
| 17 Proportion of participants who experienced at least one adverse event Show forest plot | 6 | 1742 | Risk Ratio (M‐H, Fixed, 95% CI) | 1.33 [1.20, 1.47] |
| Analysis 5.17  Comparison 5 Sensitivity analysis 1: Fixed‐effect model, Outcome 17 Proportion of participants who experienced at least one adverse event. | ||||
| 18 Proportion of participants who dropped out/withdrew due to an adverse event Show forest plot | 9 | 2160 | Risk Ratio (M‐H, Fixed, 95% CI) | 1.95 [1.08, 3.51] |
| Analysis 5.18 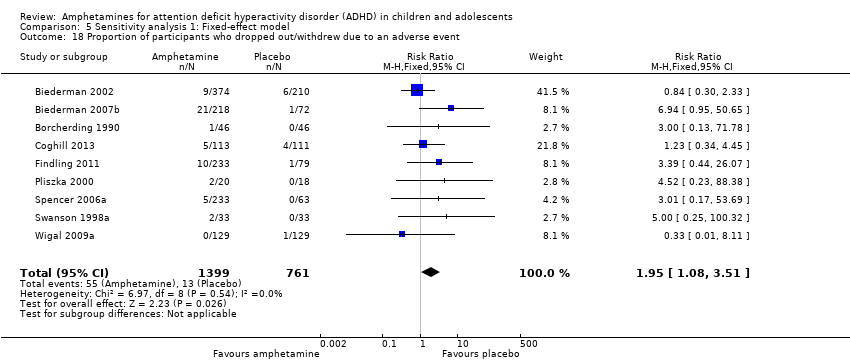 Comparison 5 Sensitivity analysis 1: Fixed‐effect model, Outcome 18 Proportion of participants who dropped out/withdrew due to an adverse event. | ||||
| 19 Proportion of participants experiencing decreased appetite Show forest plot | 11 | 2467 | Risk Ratio (M‐H, Fixed, 95% CI) | 5.57 [4.03, 7.68] |
| Analysis 5.19  Comparison 5 Sensitivity analysis 1: Fixed‐effect model, Outcome 19 Proportion of participants experiencing decreased appetite. | ||||
| 20 Proportion of participants experiencing insomnia/trouble sleeping Show forest plot | 10 | 2429 | Risk Ratio (M‐H, Fixed, 95% CI) | 3.91 [2.82, 5.41] |
| Analysis 5.20  Comparison 5 Sensitivity analysis 1: Fixed‐effect model, Outcome 20 Proportion of participants experiencing insomnia/trouble sleeping. | ||||
| 21 Proportion of participants experiencing abdominal pain Show forest plot | 10 | 2155 | Risk Ratio (M‐H, Fixed, 95% CI) | 1.57 [1.18, 2.08] |
| Analysis 5.21 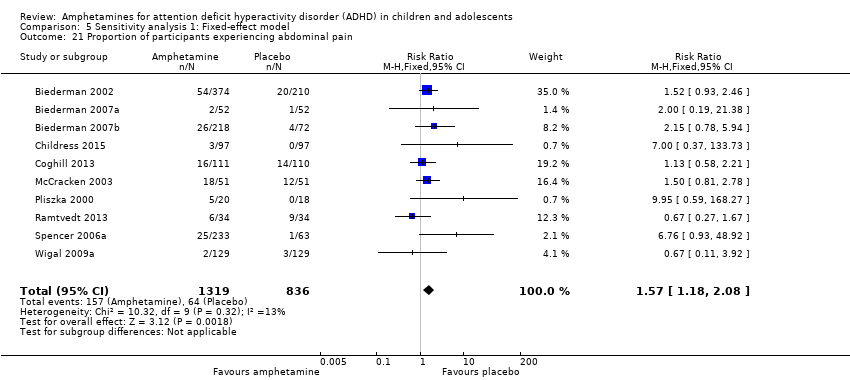 Comparison 5 Sensitivity analysis 1: Fixed‐effect model, Outcome 21 Proportion of participants experiencing abdominal pain. | ||||
| 22 Proportion of participants experiencing headaches Show forest plot | 9 | 2091 | Risk Ratio (M‐H, Fixed, 95% CI) | 0.95 [0.76, 1.18] |
| Analysis 5.22 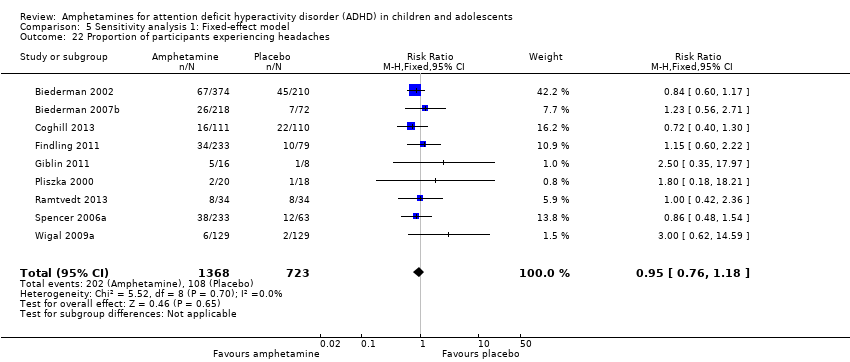 Comparison 5 Sensitivity analysis 1: Fixed‐effect model, Outcome 22 Proportion of participants experiencing headaches. | ||||
| 23 Proportion of participants experiencing anxiety/nervousness Show forest plot | 5 | 1088 | Risk Ratio (M‐H, Fixed, 95% CI) | 1.21 [0.94, 1.56] |
| Analysis 5.23  Comparison 5 Sensitivity analysis 1: Fixed‐effect model, Outcome 23 Proportion of participants experiencing anxiety/nervousness. | ||||
| 24 Proportion of participants experiencing nausea/vomiting Show forest plot | 6 | 1579 | Risk Ratio (M‐H, Fixed, 95% CI) | 1.72 [1.20, 2.46] |
| Analysis 5.24  Comparison 5 Sensitivity analysis 1: Fixed‐effect model, Outcome 24 Proportion of participants experiencing nausea/vomiting. | ||||


Risk of bias graph: review authors' judgements about each risk of bias item presented as percentages across all included studies.
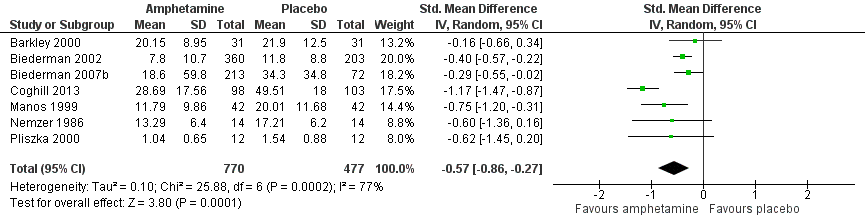
Forest plot of comparison: 1 Amphetamines versus placebo, outcome: 1.1 Total ADHD symptom score ‐ parent ratings.

Forest plot of comparison: 1 Amphetamines versus placebo, outcome: 1.3 Total ADHD symptom score ‐ teacher ratings.

Forest plot of comparison: 1 Amphetamines versus placebo, outcome: 1.23 Proportion of participants who experienced at least one adverse event.

Forest plot of comparison: 2 Subgroup analysis 1: Type of amphetamine, outcome: 2.6 Proportion of participants experiencing decreased appetite.
Comparison 1 Amphetamines versus placebo, Outcome 1 Total ADHD symptom score ‐ parent ratings.
Comparison 1 Amphetamines versus placebo, Outcome 2 Hyperactivity/impulsivity ‐ parent ratings.
Comparison 1 Amphetamines versus placebo, Outcome 3 Total ADHD symptom score ‐ teacher ratings.
Comparison 1 Amphetamines versus placebo, Outcome 4 Hyperactivity/impulsivity ‐ teacher ratings.
Comparison 1 Amphetamines versus placebo, Outcome 5 Inattention ‐ teacher ratings.
Comparison 1 Amphetamines versus placebo, Outcome 6 Total ADHD symptom score ‐ clinician ratings.
Comparison 1 Amphetamines versus placebo, Outcome 7 Hyperactivity/impulsivity ‐ clinician ratings.
Comparison 1 Amphetamines versus placebo, Outcome 8 Inattention ‐ clinician ratings.
Comparison 1 Amphetamines versus placebo, Outcome 9 Total ADHD symptom score ‐ investigator/research personnel ratings.
Comparison 1 Amphetamines versus placebo, Outcome 10 Hyperactivity/impulsivity ‐ investigator/research personnel ratings.
Comparison 1 Amphetamines versus placebo, Outcome 11 Inattention ‐ investigator/research personnel ratings.
Comparison 1 Amphetamines versus placebo, Outcome 12 Proportion of responders (Clinical Global Impression ‐ Improvement; CGI ‐ I).
Comparison 1 Amphetamines versus placebo, Outcome 13 Clinical Global Impression ‐ Severity (CGI ‐ S) score.
Comparison 1 Amphetamines versus placebo, Outcome 14 Academic performance.
Comparison 1 Amphetamines versus placebo, Outcome 15 Quality of life.
Comparison 1 Amphetamines versus placebo, Outcome 16 Retention: proportion of participants who completed the trial.
Comparison 1 Amphetamines versus placebo, Outcome 17 Proportion of participants experiencing decreased appetite.
Comparison 1 Amphetamines versus placebo, Outcome 18 Proportion of participants experiencing insomnia/trouble sleeping.
Comparison 1 Amphetamines versus placebo, Outcome 19 Proportion of participants experiencing abdominal pain.
Comparison 1 Amphetamines versus placebo, Outcome 20 Proportion of participants experiencing nausea/vomiting.
Comparison 1 Amphetamines versus placebo, Outcome 21 Proportion of participants experiencing headaches.
Comparison 1 Amphetamines versus placebo, Outcome 22 Proportion of participants experiencing anxiety/nervousness.
Comparison 1 Amphetamines versus placebo, Outcome 23 Proportion of participants who experienced at least one adverse event.
Comparison 1 Amphetamines versus placebo, Outcome 24 Proportion of participants who dropped out/withdrew due to an adverse event.
Comparison 2 Subgroup analysis 1: Type of amphetamine, Outcome 1 Total ADHD symptom score ‐ parent ratings.
Comparison 2 Subgroup analysis 1: Type of amphetamine, Outcome 2 Proportion of responders (CGI ‐ I).
Comparison 2 Subgroup analysis 1: Type of amphetamine, Outcome 3 Academic performance.
Comparison 2 Subgroup analysis 1: Type of amphetamine, Outcome 4 Retention: proportion of participants who completed the trial.
Comparison 2 Subgroup analysis 1: Type of amphetamine, Outcome 5 Proportion of participants who dropped out/withdrew due to an adverse event.
Comparison 2 Subgroup analysis 1: Type of amphetamine, Outcome 6 Proportion of participants experiencing decreased appetite.
Comparison 2 Subgroup analysis 1: Type of amphetamine, Outcome 7 Proportion of participants experiencing insomnia/trouble sleeping.
Comparison 2 Subgroup analysis 1: Type of amphetamine, Outcome 8 Proportion of participants experiencing abdominal pain.
Comparison 2 Subgroup analysis 1: Type of amphetamine, Outcome 9 Proportion of participants experiencing headaches.
Comparison 2 Subgroup analysis 1: Type of amphetamine, Outcome 10 Proportion of participants experiencing nausea/vomiting.
Comparison 3 Subgroup analysis 2: Type of amphetamine release formulation, Outcome 1 Total ADHD symptom score ‐ parent ratings.
Comparison 3 Subgroup analysis 2: Type of amphetamine release formulation, Outcome 2 Proportion of responders (CGI ‐ I).
Comparison 3 Subgroup analysis 2: Type of amphetamine release formulation, Outcome 3 Academic performance.
Comparison 3 Subgroup analysis 2: Type of amphetamine release formulation, Outcome 4 Retention: proportion of participants who completed the trial.
Comparison 3 Subgroup analysis 2: Type of amphetamine release formulation, Outcome 5 Proportion of participants experiencing decreased appetite.
Comparison 3 Subgroup analysis 2: Type of amphetamine release formulation, Outcome 6 Proportion of participants experiencing abdominal pain.
Comparison 4 Subgroup analysis 3: Funding source, Outcome 1 Total ADHD symptom score ‐ parent ratings.
Comparison 4 Subgroup analysis 3: Funding source, Outcome 2 Proportion of responders (CGI ‐ I).
Comparison 4 Subgroup analysis 3: Funding source, Outcome 3 Academic performance.
Comparison 5 Sensitivity analysis 1: Fixed‐effect model, Outcome 1 Total ADHD symptom score ‐ parent ratings.
Comparison 5 Sensitivity analysis 1: Fixed‐effect model, Outcome 2 Hyperactivity/impulsivity ‐ parent ratings.
Comparison 5 Sensitivity analysis 1: Fixed‐effect model, Outcome 3 Total ADHD symptom score ‐ teacher ratings.
Comparison 5 Sensitivity analysis 1: Fixed‐effect model, Outcome 4 Hyperactivity/impulsivity ‐ teacher ratings.
Comparison 5 Sensitivity analysis 1: Fixed‐effect model, Outcome 5 Inattention ‐ teacher ratings.
Comparison 5 Sensitivity analysis 1: Fixed‐effect model, Outcome 6 Total ADHD symptom score ‐ clinician ratings.
Comparison 5 Sensitivity analysis 1: Fixed‐effect model, Outcome 7 Hyperactivity/impulsivity ‐ clinician ratings.
Comparison 5 Sensitivity analysis 1: Fixed‐effect model, Outcome 8 Inattention ‐ clinician ratings.
Comparison 5 Sensitivity analysis 1: Fixed‐effect model, Outcome 9 Total ADHD symptom score ‐ investigator/research personnel ratings.
Comparison 5 Sensitivity analysis 1: Fixed‐effect model, Outcome 10 Hyperactivity/impulsivity ‐ Investigator/research personnel ratings.
Comparison 5 Sensitivity analysis 1: Fixed‐effect model, Outcome 11 Inattention ‐ investigator/research personnel ratings.
Comparison 5 Sensitivity analysis 1: Fixed‐effect model, Outcome 12 Proportion of responders (CGI ‐ I).
Comparison 5 Sensitivity analysis 1: Fixed‐effect model, Outcome 13 CGI ‐ S score.
Comparison 5 Sensitivity analysis 1: Fixed‐effect model, Outcome 14 Quality of life.
Comparison 5 Sensitivity analysis 1: Fixed‐effect model, Outcome 15 Academic performance.
Comparison 5 Sensitivity analysis 1: Fixed‐effect model, Outcome 16 Retention: proportion of participants who completed the trial.
Comparison 5 Sensitivity analysis 1: Fixed‐effect model, Outcome 17 Proportion of participants who experienced at least one adverse event.
Comparison 5 Sensitivity analysis 1: Fixed‐effect model, Outcome 18 Proportion of participants who dropped out/withdrew due to an adverse event.
Comparison 5 Sensitivity analysis 1: Fixed‐effect model, Outcome 19 Proportion of participants experiencing decreased appetite.
Comparison 5 Sensitivity analysis 1: Fixed‐effect model, Outcome 20 Proportion of participants experiencing insomnia/trouble sleeping.
Comparison 5 Sensitivity analysis 1: Fixed‐effect model, Outcome 21 Proportion of participants experiencing abdominal pain.
Comparison 5 Sensitivity analysis 1: Fixed‐effect model, Outcome 22 Proportion of participants experiencing headaches.
Comparison 5 Sensitivity analysis 1: Fixed‐effect model, Outcome 23 Proportion of participants experiencing anxiety/nervousness.
Comparison 5 Sensitivity analysis 1: Fixed‐effect model, Outcome 24 Proportion of participants experiencing nausea/vomiting.
| Amphetamines compared with placebo for attention deficit hyperactivity disorder in children and adolescents | ||||||
| Patient or population: children or adolescents with ADHD Settings: Beligum, France, Germany, Hungary, Italy, Netherlands, Norway, Poland, Spain, Sweden, United Kingdom, United States Intervention: amphetamines (i.e. dexamphetamine, lisdexamphetamine, mixed amphetamine salts) Comparison: placebo | ||||||
| Outcomes | Illustrative comparative risks* (95% CI) | Relative effect | Number of participants | Quality of the evidence | Comments | |
| Assumed risk | Corresponding risk | |||||
| Placebo | Amphetamine | |||||
| Total ADHD symptom score ‐ parent ratings (ADHD Rating Scale, Fourth Version; Conners' Rating Scale; Conners' Global Index; Conners' Abbreviated Symptom Questionnaire) | ‐ | The mean total score in the intervention groups was 0.57 standard deviations lower (‐0.86 to ‐0.27) | SMD ‐0.57 (‐0.86 to ‐0.27) | 1247 | ⊕⊝⊝⊝ | Moderate effect** |
| Total ADHD symptom score ‐ teacher ratings (ADHD Rating Scale, Fourth Version; Conners' Rating Scale; Conners' Global Index; Conners' Abbreviated Symptom Questionnaire) Follow‐up: 7 to 35 days | ‐ | The mean total score in the intervention groups was 0.55 standard deviations lower (‐0.83 to ‐0.27) | SMD ‐0.55 (‐0.83 to ‐0.27) | 745 | ⊕⊕⊝⊝ | Moderate effect** |
| Total ADHD symptom score ‐ clinician ratings (ADHD Rating Scale, Fourth Version) | ‐ | The mean total score in the intervention groups was 0.84 standard deviations lower (‐1.32 to ‐0.36) | SMD ‐0.84 (‐1.32 to ‐0.36) | 813 | ⊕⊝⊝⊝ | Large effect** |
| Proportion of responders (Clinical Global Impressions ‐ Improvement (CGI‐I) scale) | 187 per 1000 | 605 per 1000 | RR 3.36 (2.48 to 4.55) | 2207 | ⊝⊝⊝⊝ | ‐ |
| Academic performance (Permanent Product Measure of Performance; Wechsler Intelligence Scale for Children ‐ Revised; Barnell Lot, Ltd Math Test; Wide Range Achievement Test) Follow‐up: 7 to 21 days | ‐ | The mean score in the intervention groups was 0.51 standard deviations higher (0.31 to 0.70) | SMD 0.56 (0.39 to 0.73) | 826 | ⊕⊕⊝⊝ | Moderate effect** |
| Retention: proportion of participants who completed the trial | 825 per 1000 | 864 per 1000 | RR 1.03 | 2381 | ⊕⊝⊝⊝ | ‐ |
| Proportion of participants who experienced at least 1 adverse event | 366 per 1000 | 582 per 1000 | RR 1.30 (1.18 to 1.44) | 1742 | ⊕⊕⊝⊝ | ‐ |
| *The basis for the assumed risk (e.g. the median control group risk across studies) is provided in the footnotes. The corresponding risk (and its 95% CI) is based on the assumed risk in the comparison group and the relative effect of the intervention (and its 95% CI). ADHD: Attention deficit hyperactivity disorder; CI: Confidence interval; GRADE: Grades of recommendation, assessment, development and evaluation; RR: Risk ratio; SMD: Standardized mean difference | ||||||
| GRADE Working Group grades of evidence | ||||||
| 1Downgraded one level due to the majority of studies included in this outcome having a high risk of bias. | ||||||
| Types of outcome measures | Primary outcomes Multiple perspectives (i.e. teacher, parent, clinician) are considered the gold standard when assessing the core symptoms of ADHD. As such, we will not favor one perspective over another. In the event that reports do not agree with one another, for example, teacher reports disagree with parent reports on the improvement of core symptoms, this may be quite telling about how a child’s environment impacts their ADHD given the varying demands between a school environment and home environment. This will be interpreted accordingly in the discussion. Secondary outcomes We will assess 'parental stress' as a secondary outcome. |
| Measures of treatment effect | Dichotomous outcome data When a single study has utilized more than one measure to assess the same construct (e.g. ADHD core symptoms as assessed by teacher‐rated ADHD‐RS‐IV and teacher ratings of the Conners’ ADHD Rating Scale), treatment effects will be averaged across outcome measures in order to arrive at a single treatment effect for use in the meta‐analysis. Continuous outcome data For continuous outcomes, where the same rating scale has been used for all studies, we will calculate mean differences. |
| Unit of analysis issues | Cross‐over trials For meta‐analyses that use that use a mean difference, we will compute standard deviations for the cross‐over trials taking into account correlation. If correlation coefficients are not available, we will impute them from other studies or use 0.5 as a conservative estimate (Follman 1992). For cross‐over trials where carry‐over is thought to be a problem, where no washout period is present, or when only data from the first period are available, we will analyze data from the first period only. Studies with multiple time points In studies where results are presented for several periods of follow‐up, we will analyze each outcome at each point in a separate meta‐analysis with other comparable studies taking measures at a similar time frame post‐randomization. Time frames will reflect short‐term (up to six months), medium‐term (between 6 months and 12 |
| Assessment of reporting biases | For each primary meta‐analysis in which we have identified a sufficient number of studies (n ≥ 10) for inclusion, we will draw funnel plots in order to assess the possibility of publication bias. |
| Subgroup analysis and investigation of heterogeneity | We will conduct the following subgroup analyses.
|
| Sensitivity analysis | We will conduct the following sensitivity analyses.
|
| ADHD: attention deficit hyperactivity disorder. | |
| Outcome | Outcome measure (respondent) | Studies | Measure used in meta‐analysis |
| Inattention | ADHD Rating Scale, Fourth Version (parent ratings) | No (data presented in an unusable format) | |
| ADHD Rating Scale, Fourth Version (clinician ratings) | Yes | ||
| Yes | |||
| Yes | |||
| ADHD Rating Scale, Fourth Version (investigator/research personnel ratings) | Yes | ||
| Conners’ Rating Scale (parent ratings) | Yes | ||
| No (only study that included long‐term data) | |||
| Conners’ Rating Scale (teacher ratings) | No (only study that included long‐term data) | ||
| IOWA Conners’ Rating Scale | Yes | ||
| SKAMP scale (teacher ratings) | No (data not available) | ||
| SKAMP scale (investigator/research personnel ratings) | Yes | ||
| Yes | |||
| Hyperactivity/impulsivity | ADHD Rating Scale, Fourth Version (parent ratings) | No (data presented in an unusable format) | |
| ADHD Rating Scale, Fourth Version (clinician ratings) | Yes | ||
| Yes | |||
| Yes | |||
| ADHD Rating Scale, Fourth Version (investigator/research personnel ratings) | Yes | ||
| Conners’ Rating Scale (parent ratings) | No (only study that included long‐term data) | ||
| Yes | |||
| Conners’ Rating Scale (teacher ratings) | No (only study that included long‐term data) | ||
| Yes | |||
| Total core symptom score | ADHD Rating Scale, Fourth Version (parent ratings) | Yes | |
| Yes | |||
| ADHD Rating Scale, Fourth Version (teacher ratings) | Yes | ||
| ADHD Rating Scale, Fourth Version (clinician ratings) | Yes | ||
| Yes | |||
| Yes | |||
| ADHD Rating Scale, Fourth Version (investigator/research personnel ratings) | Yes | ||
| No (no data available) | |||
| Conners’ Rating Scale (parent ratings) | No (data presented in an unusable format) | ||
| Yes | |||
| No (data not available) | |||
| No (only study that included long‐term data) | |||
| Yes | |||
| No (data not available) | |||
| No (data presented in an unusable format) | |||
| Conners’ Rating Scale (teacher ratings) | No (no data available) | ||
| Yes | |||
| No (only study that included long‐term data) | |||
| Yes | |||
| No (data not available) | |||
| No (data presented in an unusable format) | |||
| Conners’ Global Index (parent ratings) | Yes | ||
| Yes | |||
| Conners’ Global Index (teacher ratings) | Yes | ||
| Conners’ Abbreviated Symptom Questionnaire (parent ratings) | Yes | ||
| Conners’ Abbreviated Symptom Questionnaire (teacher ratings) | Yes | ||
| ADHD Questionnaire (developed within study) (parent ratings) | No (data presented in an unusable format) | ||
| ADHD Questionnaire (developed within study) (teacher ratings) | No (data presented in an unusable format) | ||
| SKAMP scale (investigator/research personnel ratings) | Yes | ||
| ADHD: attention deficit hyperactivity disorder. | |||
| Outcome or subgroup title | No. of studies | No. of participants | Statistical method | Effect size |
| 1 Total ADHD symptom score ‐ parent ratings Show forest plot | 7 | 1247 | Std. Mean Difference (IV, Random, 95% CI) | ‐0.57 [‐0.86, ‐0.27] |
| 2 Hyperactivity/impulsivity ‐ parent ratings Show forest plot | 2 | 132 | Std. Mean Difference (IV, Random, 95% CI) | ‐0.54 [‐0.89, ‐0.19] |
| 3 Total ADHD symptom score ‐ teacher ratings Show forest plot | 5 | 745 | Std. Mean Difference (IV, Random, 95% CI) | ‐0.55 [‐0.83, ‐0.27] |
| 4 Hyperactivity/impulsivity ‐ teacher ratings Show forest plot | 1 | Std. Mean Difference (IV, Random, 95% CI) | Subtotals only | |
| 5 Inattention ‐ teacher ratings Show forest plot | 1 | Std. Mean Difference (IV, Random, 95% CI) | Subtotals only | |
| 6 Total ADHD symptom score ‐ clinician ratings Show forest plot | 3 | 813 | Std. Mean Difference (IV, Random, 95% CI) | ‐0.84 [‐1.32, ‐0.36] |
| 7 Hyperactivity/impulsivity ‐ clinician ratings Show forest plot | 3 | 813 | Std. Mean Difference (IV, Random, 95% CI) | ‐0.75 [‐1.28, ‐0.23] |
| 8 Inattention ‐ clinician ratings Show forest plot | 3 | 813 | Std. Mean Difference (IV, Random, 95% CI) | ‐0.78 [‐1.26, ‐0.30] |
| 9 Total ADHD symptom score ‐ investigator/research personnel ratings Show forest plot | 3 | 630 | Std. Mean Difference (IV, Random, 95% CI) | ‐1.15 [‐1.87, ‐0.44] |
| 10 Hyperactivity/impulsivity ‐ investigator/research personnel ratings Show forest plot | 2 | 280 | Std. Mean Difference (IV, Random, 95% CI) | ‐1.46 [‐1.83, ‐1.08] |
| 11 Inattention ‐ investigator/research personnel ratings Show forest plot | 4 | 634 | Std. Mean Difference (IV, Random, 95% CI) | ‐0.73 [‐1.42, ‐0.04] |
| 12 Proportion of responders (Clinical Global Impression ‐ Improvement; CGI ‐ I) Show forest plot | 9 | 2207 | Risk Ratio (M‐H, Random, 95% CI) | 3.36 [2.48, 4.55] |
| 13 Clinical Global Impression ‐ Severity (CGI ‐ S) score Show forest plot | 2 | 86 | Std. Mean Difference (IV, Random, 95% CI) | ‐0.86 [‐1.72, ‐0.01] |
| 14 Academic performance Show forest plot | 8 | 826 | Std. Mean Difference (IV, Random, 95% CI) | 0.56 [0.39, 0.73] |
| 15 Quality of life Show forest plot | 1 | Std. Mean Difference (IV, Random, 95% CI) | Subtotals only | |
| 16 Retention: proportion of participants who completed the trial Show forest plot | 11 | 2381 | Risk Ratio (M‐H, Random, 95% CI) | 1.03 [0.97, 1.10] |
| 17 Proportion of participants experiencing decreased appetite Show forest plot | 11 | 2467 | Risk Ratio (M‐H, Random, 95% CI) | 6.31 [2.58, 15.46] |
| 18 Proportion of participants experiencing insomnia/trouble sleeping Show forest plot | 10 | 2429 | Risk Ratio (M‐H, Random, 95% CI) | 3.80 [2.12, 6.83] |
| 19 Proportion of participants experiencing abdominal pain Show forest plot | 10 | 2155 | Risk Ratio (M‐H, Random, 95% CI) | 1.44 [1.03, 2.00] |
| 20 Proportion of participants experiencing nausea/vomiting Show forest plot | 6 | 1579 | Risk Ratio (M‐H, Random, 95% CI) | 1.63 [1.04, 2.56] |
| 21 Proportion of participants experiencing headaches Show forest plot | 9 | 2091 | Risk Ratio (M‐H, Random, 95% CI) | 0.93 [0.75, 1.16] |
| 22 Proportion of participants experiencing anxiety/nervousness Show forest plot | 5 | 1088 | Risk Ratio (M‐H, Random, 95% CI) | 1.22 [0.78, 1.93] |
| 23 Proportion of participants who experienced at least one adverse event Show forest plot | 6 | 1742 | Risk Ratio (M‐H, Random, 95% CI) | 1.30 [1.18, 1.44] |
| 24 Proportion of participants who dropped out/withdrew due to an adverse event Show forest plot | 9 | 2160 | Risk Ratio (M‐H, Random, 95% CI) | 1.60 [0.86, 2.98] |
| Outcome or subgroup title | No. of studies | No. of participants | Statistical method | Effect size |
| 1 Total ADHD symptom score ‐ parent ratings Show forest plot | 7 | 1247 | Std. Mean Difference (IV, Random, 95% CI) | ‐0.57 [‐0.86, ‐0.27] |
| 1.1 Dexamphetamine | 1 | 28 | Std. Mean Difference (IV, Random, 95% CI) | ‐0.60 [‐1.36, 0.16] |
| 1.2 Lisdexamphetamine | 2 | 486 | Std. Mean Difference (IV, Random, 95% CI) | ‐0.72 [‐1.59, 0.14] |
| 1.3 Mixed amphetamine salts | 4 | 733 | Std. Mean Difference (IV, Random, 95% CI) | ‐0.44 [‐0.63, ‐0.24] |
| 2 Proportion of responders (CGI ‐ I) Show forest plot | 9 | 2205 | Risk Ratio (M‐H, Random, 95% CI) | 3.38 [2.51, 4.55] |
| 2.1 Dexamphetamine | 1 | 64 | Risk Ratio (M‐H, Random, 95% CI) | 5.4 [2.38, 12.25] |
| 2.2 Lisdexamphetamine | 4 | 1065 | Risk Ratio (M‐H, Random, 95% CI) | 3.62 [2.04, 6.41] |
| 2.3 Mixed amphetamine salts | 4 | 1076 | Risk Ratio (M‐H, Random, 95% CI) | 2.72 [2.14, 3.45] |
| 3 Academic performance Show forest plot | 8 | 826 | Std. Mean Difference (IV, Random, 95% CI) | 0.56 [0.39, 0.73] |
| 3.1 Dexamphetamine | 4 | 208 | Std. Mean Difference (IV, Random, 95% CI) | 0.40 [0.12, 0.67] |
| 3.2 Lisdexamphetamine | 1 | 226 | Std. Mean Difference (IV, Random, 95% CI) | 0.78 [0.51, 1.05] |
| 3.3 Mixed amphetamine salts | 3 | 392 | Std. Mean Difference (IV, Random, 95% CI) | 0.56 [0.29, 0.84] |
| 4 Retention: proportion of participants who completed the trial Show forest plot | 10 | 2364 | Risk Ratio (M‐H, Random, 95% CI) | 1.05 [0.99, 1.12] |
| 4.1 Dexamphetamine | 1 | 64 | Risk Ratio (M‐H, Random, 95% CI) | 1.03 [0.95, 1.12] |
| 4.2 Lisdexamphetamine | 4 | 1084 | Risk Ratio (M‐H, Random, 95% CI) | 1.14 [0.92, 1.42] |
| 4.3 Mixed amphetamine salts | 5 | 1216 | Risk Ratio (M‐H, Random, 95% CI) | 1.03 [0.96, 1.11] |
| 5 Proportion of participants who dropped out/withdrew due to an adverse event Show forest plot | 9 | 2161 | Risk Ratio (M‐H, Random, 95% CI) | 1.61 [0.86, 2.98] |
| 5.1 Dexamphetamine | 1 | 92 | Risk Ratio (M‐H, Random, 95% CI) | 3.0 [0.13, 71.78] |
| 5.2 Lisdexamphetamine | 4 | 1085 | Risk Ratio (M‐H, Random, 95% CI) | 2.03 [0.70, 5.91] |
| 5.3 Mixed amphetamine salts | 4 | 984 | Risk Ratio (M‐H, Random, 95% CI) | 1.27 [0.53, 3.06] |
| 6 Proportion of participants experiencing decreased appetite Show forest plot | 10 | 2273 | Risk Ratio (M‐H, Random, 95% CI) | 6.20 [2.44, 15.71] |
| 6.1 Dexamphetamine | 1 | 68 | Risk Ratio (M‐H, Random, 95% CI) | 1.41 [0.95, 2.11] |
| 6.2 Lisdexampheatmine | 4 | 1081 | Risk Ratio (M‐H, Random, 95% CI) | 9.83 [5.08, 19.02] |
| 6.3 Mixed amphetamine salts | 5 | 1124 | Risk Ratio (M‐H, Random, 95% CI) | 6.42 [1.56, 26.52] |
| 7 Proportion of participants experiencing insomnia/trouble sleeping Show forest plot | 10 | 2429 | Risk Ratio (M‐H, Random, 95% CI) | 3.80 [2.12, 6.83] |
| 7.1 Dexamphetamine | 1 | 68 | Risk Ratio (M‐H, Random, 95% CI) | 2.14 [1.41, 3.26] |
| 7.2 Lisdexamphetamine | 4 | 1081 | Risk Ratio (M‐H, Random, 95% CI) | 5.91 [2.84, 12.29] |
| 7.3 Mixed amphetamine salts | 5 | 1280 | Risk Ratio (M‐H, Random, 95% CI) | 3.34 [1.25, 8.96] |
| 8 Proportion of participants experiencing abdominal pain Show forest plot | 10 | 2155 | Risk Ratio (M‐H, Random, 95% CI) | 1.44 [1.03, 2.00] |
| 8.1 Dexamphetamine | 1 | 68 | Risk Ratio (M‐H, Random, 95% CI) | 0.67 [0.27, 1.67] |
| 8.2 Lisdexamphetamine | 3 | 769 | Risk Ratio (M‐H, Random, 95% CI) | 1.29 [0.76, 2.19] |
| 8.3 Mixed amphetamine salts | 6 | 1318 | Risk Ratio (M‐H, Random, 95% CI) | 1.69 [1.17, 2.45] |
| 9 Proportion of participants experiencing headaches Show forest plot | 9 | 2063 | Risk Ratio (M‐H, Random, 95% CI) | 0.93 [0.75, 1.16] |
| 9.1 Dexamphetamine | 1 | 68 | Risk Ratio (M‐H, Random, 95% CI) | 1.0 [0.42, 2.36] |
| 9.2 Lisdexamphetamine | 5 | 1077 | Risk Ratio (M‐H, Random, 95% CI) | 1.07 [0.73, 1.57] |
| 9.3 Mixed amphetamine salts | 3 | 918 | Risk Ratio (M‐H, Random, 95% CI) | 0.85 [0.64, 1.14] |
| 10 Proportion of participants experiencing nausea/vomiting Show forest plot | 6 | 1579 | Risk Ratio (M‐H, Random, 95% CI) | 1.63 [1.04, 2.56] |
| 10.1 Dexamphetamine | 1 | 68 | Risk Ratio (M‐H, Random, 95% CI) | 1.67 [0.68, 4.07] |
| 10.2 Lisdexamphetamine | 4 | 927 | Risk Ratio (M‐H, Random, 95% CI) | 1.48 [0.61, 3.61] |
| 10.3 Mixed amphetamine salts | 1 | 584 | Risk Ratio (M‐H, Random, 95% CI) | 1.84 [1.04, 3.27] |
| Outcome or subgroup title | No. of studies | No. of participants | Statistical method | Effect size |
| 1 Total ADHD symptom score ‐ parent ratings Show forest plot | 7 | 1247 | Std. Mean Difference (IV, Random, 95% CI) | ‐0.57 [‐0.86, ‐0.27] |
| 1.1 Long acting | 3 | 1049 | Std. Mean Difference (IV, Random, 95% CI) | ‐0.61 [‐1.08, ‐0.13] |
| 1.2 Short acting | 4 | 198 | Std. Mean Difference (IV, Random, 95% CI) | ‐0.52 [‐0.82, ‐0.23] |
| 2 Proportion of responders (CGI ‐ I) Show forest plot | 9 | 2105 | Risk Ratio (M‐H, Random, 95% CI) | 3.31 [2.44, 4.49] |
| 2.1 Long acting | 6 | 1662 | Risk Ratio (M‐H, Random, 95% CI) | 3.55 [2.63, 4.79] |
| 2.2 Short acting | 3 | 443 | Risk Ratio (M‐H, Random, 95% CI) | 2.89 [1.39, 6.02] |
| 3 Academic performance Show forest plot | 8 | 826 | Std. Mean Difference (IV, Random, 95% CI) | 0.56 [0.39, 0.73] |
| 3.1 Long acting | 4 | 494 | Std. Mean Difference (IV, Random, 95% CI) | 0.59 [0.36, 0.81] |
| 3.2 Short acting | 4 | 332 | Std. Mean Difference (IV, Random, 95% CI) | 0.48 [0.15, 0.81] |
| 4 Retention: proportion of participants who completed the trial Show forest plot | 10 | 2364 | Risk Ratio (M‐H, Random, 95% CI) | 1.05 [0.99, 1.12] |
| 4.1 Long acting | 6 | 1756 | Risk Ratio (M‐H, Random, 95% CI) | 1.11 [1.00, 1.24] |
| 4.2 Short acting | 4 | 608 | Risk Ratio (M‐H, Random, 95% CI) | 0.98 [0.95, 1.01] |
| 5 Proportion of participants experiencing decreased appetite Show forest plot | 10 | 2271 | Risk Ratio (M‐H, Random, 95% CI) | 6.18 [2.44, 15.63] |
| 5.1 Long acting | 8 | 2165 | Risk Ratio (M‐H, Random, 95% CI) | 7.67 [3.33, 17.65] |
| 5.2 Short acting | 2 | 106 | Risk Ratio (M‐H, Random, 95% CI) | 1.58 [0.69, 3.62] |
| 6 Proportion of participants experiencing abdominal pain Show forest plot | 10 | 2155 | Risk Ratio (M‐H, Random, 95% CI) | 1.44 [1.03, 2.00] |
| 6.1 Long acting | 7 | 1855 | Risk Ratio (M‐H, Random, 95% CI) | 1.49 [1.10, 2.02] |
| 6.2 Short acting | 3 | 300 | Risk Ratio (M‐H, Random, 95% CI) | 2.54 [0.30, 21.39] |
| Outcome or subgroup title | No. of studies | No. of participants | Statistical method | Effect size |
| 1 Total ADHD symptom score ‐ parent ratings Show forest plot | 7 | 1247 | Std. Mean Difference (IV, Random, 95% CI) | ‐0.57 [‐0.86, ‐0.27] |
| 1.1 Industry | 5 | 1135 | Std. Mean Difference (IV, Random, 95% CI) | ‐0.53 [‐0.89, ‐0.16] |
| 1.2 Public | 1 | 84 | Std. Mean Difference (IV, Random, 95% CI) | ‐0.75 [‐1.20, ‐0.31] |
| 1.3 Not reported | 1 | 28 | Std. Mean Difference (IV, Random, 95% CI) | ‐0.60 [‐1.36, 0.16] |
| 2 Proportion of responders (CGI ‐ I) Show forest plot | 9 | 2210 | Risk Ratio (M‐H, Random, 95% CI) | 3.37 [2.50, 4.53] |
| 2.1 Industry | 8 | 2146 | Risk Ratio (M‐H, Random, 95% CI) | 3.24 [2.39, 4.40] |
| 2.2 Not reported | 1 | 64 | Risk Ratio (M‐H, Random, 95% CI) | 5.4 [2.38, 12.25] |
| 3 Academic performance Show forest plot | 8 | 826 | Std. Mean Difference (IV, Random, 95% CI) | 0.56 [0.39, 0.73] |
| 3.1 Industry | 5 | 688 | Std. Mean Difference (IV, Random, 95% CI) | 0.64 [0.46, 0.81] |
| 3.2 Public | 1 | 44 | Std. Mean Difference (IV, Random, 95% CI) | ‐0.01 [‐0.60, 0.59] |
| 3.3 Not reported | 2 | 94 | Std. Mean Difference (IV, Random, 95% CI) | 0.47 [0.06, 0.88] |
| Outcome or subgroup title | No. of studies | No. of participants | Statistical method | Effect size |
| 1 Total ADHD symptom score ‐ parent ratings Show forest plot | 7 | 1247 | Std. Mean Difference (IV, Fixed, 95% CI) | ‐0.52 [‐0.64, ‐0.40] |
| 2 Hyperactivity/impulsivity ‐ parent ratings Show forest plot | 2 | 132 | Std. Mean Difference (IV, Fixed, 95% CI) | ‐0.54 [‐0.89, ‐0.19] |
| 3 Total ADHD symptom score ‐ teacher ratings Show forest plot | 5 | 745 | Std. Mean Difference (IV, Fixed, 95% CI) | ‐0.47 [‐0.62, ‐0.32] |
| 4 Hyperactivity/impulsivity ‐ teacher ratings Show forest plot | 1 | Std. Mean Difference (IV, Fixed, 95% CI) | Subtotals only | |
| 5 Inattention ‐ teacher ratings Show forest plot | 1 | Std. Mean Difference (IV, Fixed, 95% CI) | Subtotals only | |
| 6 Total ADHD symptom score ‐ clinician ratings Show forest plot | 3 | 813 | Std. Mean Difference (IV, Fixed, 95% CI) | ‐0.84 [‐1.01, ‐0.68] |
| 7 Hyperactivity/impulsivity ‐ clinician ratings Show forest plot | 3 | 813 | Std. Mean Difference (IV, Fixed, 95% CI) | ‐0.74 [‐0.90, ‐0.58] |
| 8 Inattention ‐ clinician ratings Show forest plot | 3 | 813 | Std. Mean Difference (IV, Fixed, 95% CI) | ‐0.77 [‐0.94, ‐0.61] |
| 9 Total ADHD symptom score ‐ investigator/research personnel ratings Show forest plot | 3 | 630 | Std. Mean Difference (IV, Fixed, 95% CI) | ‐1.08 [‐1.25, ‐0.91] |
| 10 Hyperactivity/impulsivity ‐ Investigator/research personnel ratings Show forest plot | 2 | 280 | Std. Mean Difference (IV, Fixed, 95% CI) | ‐1.50 [‐1.76, ‐1.23] |
| 11 Inattention ‐ investigator/research personnel ratings Show forest plot | 4 | 634 | Std. Mean Difference (IV, Fixed, 95% CI) | ‐0.76 [‐0.93, ‐0.60] |
| 12 Proportion of responders (CGI ‐ I) Show forest plot | 9 | 2207 | Risk Ratio (M‐H, Fixed, 95% CI) | 3.11 [2.68, 3.61] |
| 13 CGI ‐ S score Show forest plot | 2 | 86 | Std. Mean Difference (IV, Fixed, 95% CI) | ‐0.71 [‐1.15, ‐0.27] |
| 14 Quality of life Show forest plot | 1 | Std. Mean Difference (IV, Fixed, 95% CI) | Subtotals only | |
| 15 Academic performance Show forest plot | 8 | 826 | Std. Mean Difference (IV, Fixed, 95% CI) | 0.59 [0.45, 0.73] |
| 16 Retention: proportion of participants who completed the trial Show forest plot | 10 | 2364 | Risk Ratio (M‐H, Fixed, 95% CI) | 1.08 [1.04, 1.12] |
| 17 Proportion of participants who experienced at least one adverse event Show forest plot | 6 | 1742 | Risk Ratio (M‐H, Fixed, 95% CI) | 1.33 [1.20, 1.47] |
| 18 Proportion of participants who dropped out/withdrew due to an adverse event Show forest plot | 9 | 2160 | Risk Ratio (M‐H, Fixed, 95% CI) | 1.95 [1.08, 3.51] |
| 19 Proportion of participants experiencing decreased appetite Show forest plot | 11 | 2467 | Risk Ratio (M‐H, Fixed, 95% CI) | 5.57 [4.03, 7.68] |
| 20 Proportion of participants experiencing insomnia/trouble sleeping Show forest plot | 10 | 2429 | Risk Ratio (M‐H, Fixed, 95% CI) | 3.91 [2.82, 5.41] |
| 21 Proportion of participants experiencing abdominal pain Show forest plot | 10 | 2155 | Risk Ratio (M‐H, Fixed, 95% CI) | 1.57 [1.18, 2.08] |
| 22 Proportion of participants experiencing headaches Show forest plot | 9 | 2091 | Risk Ratio (M‐H, Fixed, 95% CI) | 0.95 [0.76, 1.18] |
| 23 Proportion of participants experiencing anxiety/nervousness Show forest plot | 5 | 1088 | Risk Ratio (M‐H, Fixed, 95% CI) | 1.21 [0.94, 1.56] |
| 24 Proportion of participants experiencing nausea/vomiting Show forest plot | 6 | 1579 | Risk Ratio (M‐H, Fixed, 95% CI) | 1.72 [1.20, 2.46] |