Descentralização do tratamento para HIV em países de baixa e média renda
References
References to studies included in this review
References to studies excluded from this review
References to studies awaiting assessment
References to ongoing studies
Additional references
Characteristics of studies
Characteristics of included studies [ordered by study ID]
| Methods | Design: Retrospective cohort Duration of study: Recruitment Sept 2006‐2008, censored March 2009 (minimum 6 months, maximum 24 months follow‐up) | |
| Participants | Country: Ethiopia Setting: Nationwide, 30 hospitals, 25 health centres Inclusion and exclusion criteria: None described Comparable CD4 count or clinical stage at baseline: Similar CD4 count | |
| Interventions | Intervention: Patients initiated and maintained at health centres by nurses and health officers. Severe manifestations, treatment failures were referred to hospital Control: Initiated and followed up at hospital with physicians. Co‐interventions: Community health workers performed counselling, referrals and linkage between facilities and defaulter tracing, not clear if this was provided at all sites | |
| Outcomes | Mortality, loss to follow‐up, retention, and median CD4+ cell count, Assessed at 6, 12 and 24 months | |
| Notes | ||
| Risk of bias | ||
| Bias | Authors' judgement | Support for judgement |
| Baseline CD4 count (All studies) | Low risk | Similar median CD4 counts at baseline in both groups |
| Other baseline variables (All studies) | Unclear risk | Not described |
| Co‐interventions (All studies) | Unclear risk | Community health workers delivered adherence and referral services from health centres to hospitals, unclear whether this was for both groups for the health centre group only |
| Data collection (Cohorts) | High risk | Retrospective cohort |
| Patient selection bias (Cohorts) | Low risk | Randomly selected folders in all included sites in both groups |
| Methods | Design: Retrospective cohort Duration: February 2007 ‐ February 2009, 6 months post censor follow‐up | |
| Participants | Country: Ethiopia Setting: Rural and urban, in one region, 3 health centres, 2 hospitals Inclusion criteria: Adults eligible for antiretroviral treatment (CD4 <200cell/mm3 or WHO clinical stage 3 or 4) and on treatment for < 6 months Exclusion: HIV infected, but not on antiretroviral therapy Comparable CD4 count or clinical stage at baseline: Similar CD4 count | |
| Interventions | Intervention: Initiation on antiretrovirals in health centre, maintenance in health centre; provided by nurses and health officers Control: Initiated and maintained in hospital, provided by doctors Co‐interventions: None described | |
| Outcomes | Currently alive and on treatment, loss to follow‐up, transferred out, mortality Assessed at 24 months | |
| Notes | ||
| Risk of bias | ||
| Bias | Authors' judgement | Support for judgement |
| Baseline CD4 count (All studies) | Low risk | Similar median CD4 in both groups |
| Other baseline variables (All studies) | Unclear risk | Only data on sex reported by arm |
| Co‐interventions (All studies) | Unclear risk | No co‐intervention information described |
| Data collection (Cohorts) | High risk | Retrospective cohort |
| Patient selection bias (Cohorts) | Low risk | No selection bias identified |
| Methods | Design: Retrospective cohort Duration: January 2004 ‐ June 2005, completed 12 months follow‐up by July 2006 | |
| Participants | Country: South Africa Setting: Rural, 12 health centres, 1 hospital Inclusion criteria: Adults, eligible for ART CD4+ cell count < 200cells/mm3, WHO clinical stage 4 Exclusion criteria: None described Comparable CD4+ cell count or clinical stage at baseline: CD4+ cell counts differed at baseline (sicker at hospital) | |
| Interventions | Intervention: ART initiated and maintained at health centre by nurses, physician support with mobile team, adherence counsellors and patient support groups available Control: ART initiated and maintained at hospital by doctors | |
| Outcomes | Mortality, loss to follow‐up, CD4 count, viral load Assessed at 12 months | |
| Notes | ||
| Risk of bias | ||
| Bias | Authors' judgement | Support for judgement |
| Baseline CD4 count (All studies) | High risk | CD4+ cell counts differed between groups at baseline, lower CD4+ cell counts remained at the hospital |
| Other baseline variables (All studies) | Unclear risk | Only reported on sex of included participants |
| Co‐interventions (All studies) | High risk | Model differed by group: The health centre group received additional adherence support and visits from a mobile support team of experienced clinicians |
| Data collection (Cohorts) | High risk | Retrospective cohort |
| Patient selection bias (Cohorts) | Low risk | No selection bias identified |
| Methods | Design: Retrospective cohort Duration: April 2004 ‐ April 2006, no follow‐up post censor described | |
| Participants | Country: South Africa Setting: Urban, peri‐urban, 20 health centres (enhanced), 16 hospitals, 3 advanced hospitals Inclusion criteria: Children <15 years, eligible for ART (modified WHO stage 2, 3 disease, or low CD4% by age group ‐ <20% if <18 months old, or <15% if >18 months old), recurrent hospitalisation >4 weeks, and identifiable caregiver Exclusion criteria: Previous exposure to ART for >1 month (treatment experienced), transferred in or out of antiretroviral treatment site Comparable CD4+ cell count or clinical stage at baseline: Sicker children with lower CD4 % at hospital and advanced hospital | |
| Interventions | Intervention (Primary health care clinics): ART initiated at advanced hospital, maintained at enhanced health centres, by doctors Intervention (Level 1 district hospitals): ART initiated at advanced hospital, maintained at hospital, by doctors Control (level 2 and 3 facilities): ART initiated and maintained at advanced hospital, by doctors and specialists | |
| Outcomes | Death, loss to follow‐up, virological suppression, CD4 % changes, change to second line treatment Assessed at 6, 12 and 18 months | |
| Notes | ||
| Risk of bias | ||
| Bias | Authors' judgement | Support for judgement |
| Baseline CD4 count (All studies) | High risk | Sicker children with lower CD4 % at hospital and advanced disease remained in hospital |
| Other baseline variables (All studies) | Unclear risk | Not described |
| Co‐interventions (All studies) | Unclear risk | Not described |
| Data collection (Cohorts) | High risk | Retrospective cohort |
| Patient selection bias (Cohorts) | Low risk | Although stable patients could be transferred to the PHC group while sicker children requiring specialist care were transferred to advanced hospital, this group of patients were excluded from the analysis. |
| Methods | Design: Retrospective matched cohort analysis Duration: April 2004 ‐ January 2009 | |
| Participants | Country: South Africa Setting: Peri‐urban, urban, 1 hospital, 1 clinic Inclusion criteria: Stable on antiretroviral treatment for at least 11 months, no opportunistic infections, CD4+ cell count > 200cells/mm3, stable weight and virologically suppressed <400 copies/mL. Considered good candidates by doctors and agree to down‐referral Exclusion criteria: Refused down referral Comparable CD4 count or clinical stage at baseline: Control matched on sex, age, months on therapy, treatment regimen, BMI, HB and CD4+ cell count (propensity scoring) | |
| Interventions | Intervention: ART initiated at advanced hospital by doctors, maintained at health centre by nurses, seen every 2 months for medicine pick up. "Up referred" if default (>7 days), toxicity, detectable viral load Control: ART initiated and maintained by doctor at advanced hospital, seen 6 monthly, pick up medicines every 2 months Co‐interventions: Adherence counselling provided at both facilities | |
| Outcomes | Death, loss to follow‐up, mean CD4+ cell count, viral load rebound Assessed at 12 months | |
| Notes | ||
| Risk of bias | ||
| Bias | Authors' judgement | Support for judgement |
| Baseline CD4 count (All studies) | Low risk | Matched by propensity scores on all baseline characteristics |
| Other baseline variables (All studies) | Low risk | Matched by propensity scores on all baseline characteristics |
| Co‐interventions (All studies) | Low risk | Both groups received adherence counselling |
| Data collection (Cohorts) | High risk | Retrospective cohort |
| Patient selection bias (Cohorts) | Low risk | All participants were equally eligible for down referral, and were matched using propensity scores on baseline characteristics |
| Methods | Design: Retrospective cohort Duration: October 2004 ‐ 31 December 2008, censored 31 December 2008, maximum follow‐up 50 months | |
| Participants | Country: Malawi Setting: Rural, Zomba district, 16 health centres and 1 hospital Inclusion criteria: Adults and older children eligible for antiretroviral therapy (CD4+ cell count <250 cells/mm3, WHO clinical stage 3 or 4), on treatment for >3 months and stable, no evidence of opportunistic infections or drug intolerance, provider confidence in patient adherence, live closer to health centre than hospital Exclusion criteria: None described Comparable CD4+ cell count or clinical stage at baseline: Earlier stage disease at intervention site, more men, children and advanced disease at control site | |
| Interventions | Intervention: ART initiated at advanced hospital, maintained at health centre, seen by nurses and clinical officers, home‐based peer support and health surveillance assistants for defaulter tracing, expert patients, nutrition counsellors, volunteers from the community Control: ART initiated and maintained at hospital, by clinical officers, adherence counsellor and specialist support Co‐intervention: Paediatric and adult specialist support at both sites | |
| Outcomes | Death, loss to follow‐up (not seen at facility for >3m) Unknown time of outcome reporting | |
| Notes | ||
| Risk of bias | ||
| Bias | Authors' judgement | Support for judgement |
| Baseline CD4 count (All studies) | Unclear risk | Not reported |
| Other baseline variables (All studies) | High risk | Healthier at peripheral site: Earlier WHO stage, more women and adults, differing baseline characteristics. |
| Co‐interventions (All studies) | High risk | Paediatric and adult specialist infectious diseases support at both sites, via mobile visits for health centres. In addition, the intervention group had many antiretroviral therapy counsellors health surveillance assistants, peer home based care providers and community volunteers to support adherence. |
| Data collection (Cohorts) | High risk | Retrospective cohort |
| Patient selection bias (Cohorts) | High risk | Only stable patients, on treatment for > 3 months with no opportunistic infections or signs of adverse effects of the medication were decentralised to intervention arm. |
| Methods | Design: Retrospective cohort Duration: December 2004 ‐ December 2007, followed up until March 2008 | |
| Participants | Country: South Africa Setting: Four provinces, peri‐urban and rural, 47 health centres (enhanced), 9 hospitals and 3 advanced hospitals Inclusion criteria: Adults >16 years with CD4+ cell count <200cells/mm3 or WHO clinical stage 4, documented date of birth, gender and date of starting antiretroviral therapy Exclusion criteria: Missing demographic data, antiretroviral therapy experienced, starting antiretroviral therapy after 31 December 2007 Comparable CD4 cell count or clinical stage at baseline: CD4+ cell count clinically similar at baseline (median range 109‐113 cells/mm3), but more advanced disease (WHO clinical stage 3 or 4) at primary care facilities | |
| Interventions | Intervention: ART initiated at hospital by doctor and maintained at health centre (enhanced) by doctors Control: ART initiated and maintained at hospital by doctors Co‐interventions: Adherence counselling by community support workers | |
| Outcomes | Death. loss to follow‐up, virological suppression reported at 12, 24 and 36 months | |
| Notes | ||
| Risk of bias | ||
| Bias | Authors' judgement | Support for judgement |
| Baseline CD4 count (All studies) | Low risk | Similar CD4+ cell counts between groups |
| Other baseline variables (All studies) | High risk | Health centres had patients with more advanced disease by WHO clinical stage (note bias in favour of control) |
| Co‐interventions (All studies) | Low risk | Adherence support provided by community‐based adherence counsellor, linking with losses and detecting deaths |
| Data collection (Cohorts) | High risk | Retrospective cohort |
| Patient selection bias (Cohorts) | Low risk | No evidence of patient selection bias |
| Methods | Design: Retrospective cohort Duration:January 2008 to March 2010 | |
| Participants | Country: Kenya. Lesotho, Mozambique, Rwanda and Tanzania Setting: 274 sites, all receiving funding from the Presidents Emergency Plan for AIDS Relief Inclusion criteria: Children < 15 years old Exclusion criteria: if initiated on therapy before study period or at another facility they were excluded from analysis Comparable CD4 cell count or clinical stage at baseline: no data on CD4 counts at baseline or other health related variables | |
| Interventions | Intervention: ART initiated and maintained at health centres by doctor or nurse (43%) Control: ART initiated and maintained at hospital by doctors or nurse (42%) Co‐interventions:differed by country and site and included nutrition support, outreach services, support groups, PEER educator programme and adherence counselling. | |
| Outcomes | Loss to follow‐up (not having made a clinic visit or pharmacy pick up in 90 days); mortality (documented death in clinic records) | |
| Notes | Primary health facilities (health centres in our model) included health centres and clinics, secondary health facilities (hospitals) included district, sub‐district and provincial hospitals | |
| Risk of bias | ||
| Bias | Authors' judgement | Support for judgement |
| Baseline CD4 count (All studies) | Unclear risk | Not stated |
| Other baseline variables (All studies) | Unclear risk | None provided |
| Co‐interventions (All studies) | High risk | Variable by country and setting, therefore not known |
| Data collection (Cohorts) | High risk | Retrospective cohort |
| Patient selection bias (Cohorts) | Low risk | No evidence of selection bias |
| Methods | Design: Retrospective cohort Duration: February 2002 to April 2008 | |
| Participants | Country: Thailand Setting: Community‐based paediatric HIV care and treatment network, training and supervision were provided Inclusion criteria: Children, stable on treatment prior to referral (absence of opportunistic infections and improved weight and CD4%) Exclusion criteria: ART experienced, follow up < 6 months, opportunistic infections, on protease inhibitor Comparable CD4 cell count or clinical stage at baseline: Median CD4% and viral load was similar, but more CDC stage C at health centre (25% at hospital and 40% at health centre) | |
| Interventions | Intervention: ART initiated at hospital by doctors and maintained at health centres by nurses, under doctor attendance Control: ART initiated and maintained at hospital by doctors Co‐interventions: Team included nurses/ counsellors, people living with HIV, pharmacists and physicians, adherence monitoring conducted at both sites. This model included mentoring, emails, phone calls and discussion between health centres and hospital | |
| Outcomes | Mortality, loss to follow‐up, weight for age score, adherence, CD4%, viral load change | |
| Notes | ||
| Risk of bias | ||
| Bias | Authors' judgement | Support for judgement |
| Baseline CD4 count (All studies) | Low risk | Balanced CD4% at baseline |
| Other baseline variables (All studies) | Low risk | Baseline variables balanced. |
| Co‐interventions (All studies) | Low risk | There was mentoring and support for health centres health staff maintaining ART, however this is part of the model of care and not expected to bias the results. |
| Data collection (Cohorts) | High risk | Retrospective cohort |
| Patient selection bias (Cohorts) | Low risk | Stable patients were referred to the health centres, however, the analysis excluded patients who were ill with opportunistic infections, or who were on a protease inhibitor, and the baseline characteristics were similar |
| Methods | Design: Prospective cohort Duration: Started recruitment January 2007 ‐ June 2007, followed up until November 2007, minimum 6 months follow‐up | |
| Participants | Country: Swaziland Setting: Rural setting, one district hospital, 30 nurse led health centres Inclusion criteria: Adults >14 years on antiretroviral therapy for at least 4 weeks, CD4+ cell count >100 cells/mm3 Exclusion criteria: refused to be down referred Comparable CD4+ cell count or clinical stage at baseline: CD4+ cell count and clinical stage similar at baseline | |
| Interventions | Intervention: ART initiated at hospital by doctor and maintained at health centre by nurses Control: ART initiated and maintained at hospital by doctors Co‐interventions: Training for primary care centre nurses, monthly outreach support visit by at least one counsellor and nurse | |
| Outcomes | Clinic attendance, patient experience, loss to follow‐up, change in CD4 count, weight, death | |
| Notes | ||
| Risk of bias | ||
| Bias | Authors' judgement | Support for judgement |
| Baseline CD4 count (All studies) | Low risk | Similar mean CD4+ cell counts between groups |
| Other baseline variables (All studies) | Low risk | Age, sex, and weight were similar at baseline |
| Co‐interventions (All studies) | Unclear risk | No additional intervention described, other than mobile support team visits monthly which are part of the model of care |
| Data collection (Cohorts) | Low risk | Prospective Cohort |
| Patient selection bias (Cohorts) | Low risk | Assignment was based on catchment areas (intervention clinics / control clinics) |
| Methods | Design: Cluster randomised controlled trial, 22 clusters for each arm, median size 25 ‐ 36, inter‐cluster co‐efficient 0.2 Duration: February 2005 ‐ December 2006, follow‐up until 31 January 2009, median follow‐up 27 ‐ 28 months | |
| Participants | Country: Uganda Setting: Urban, peri‐urban and rural, varying distance from the hospital Inclusion criteria: Adults >18 years old, CD4+ cell count <200cells/mm3, WHO clinical stage 3 or 4 Exclusion criteria: Living >100 km from facility Comparable CD4+ cell count or clinical stage at baseline: Similar, slightly lower CD4+ cell count for intervention arm | |
| Interventions | Intervention: ART initiated at hospital by doctors, maintained in the community by field officers who delivered treatments every month on motorcycles, monitored adherence, drug toxicity and disease, they referred patients; had access to mobile phones for on‐site call to doctor. If patients was absent, followed up. Reviewed at hospital 6 monthly. Control: ART initiated and maintained at hospital. Monthly clinic visits to collect medicine, reviewed by medical officer 3 monthly, drop in clinic; if defaulted, followed up at home; household vouchers for counselling | |
| Outcomes | Rate of virological failure, time to detectable viral load >500 copies/mL, time to detectable viral load >500 copies/mL at any visit from 12 months if it was <500 copies/mL at 6 months or increase in 1000 copies/mL between two consecutive tests in those who did not have viral load <500 copies/mL at 6 months, all cause mortality, admission, change to second line antiretrovirals, outpatient attendance, adherence in previous 28 days, cost incurred by health services and patients, patient diagnosed with TB at first admission, proportion of those with CD4+ cell count > 200cells/mm3 Timepoints of outcome assessment not clear | |
| Notes | ||
| Risk of bias | ||
| Bias | Authors' judgement | Support for judgement |
| Baseline CD4 count (All studies) | Low risk | Similar at baseline |
| Other baseline variables (All studies) | Low risk | Comparable baseline characteristics |
| Co‐interventions (All studies) | Low risk | Both groups seen monthly, but provider and facility differed by group |
| Random sequence generation (Trials) | Unclear risk | Not described |
| Allocation concealment (Trials) | Low risk | Allocation cards labelled with stratum number and sealed in advance was drawn from a concealed box in the presence of all stakeholders |
| Contamination protection (Trials) | Low risk | No evidence of contamination |
| Methods | Design: Prospective cohort Duration: 6 month results | |
| Participants | Country: Rwimi, Uganda Setting: intervention in rural setting, control in urban setting Inclusion criteria: Adults >18 years, eligible for antiretroviral therapy, antiretroviral therapy naive, resident in the sub‐county Exclusion criteria: None described Comparable CD4 count or clinical stage at baseline: Similar CD4+ cell count at baseline | |
| Interventions | Intervention: ART initiated at the health centre, maintained in community receiving care from volunteer community health workers who did weekly home visits ‐ delivering antiretrovirals monthly, monitoring and supporting adherence, monitoring adverse effects and clinical symptoms Control: ART initiated and maintained in hospital, by doctors Co‐intervention: an additional treatment support was required by those in the home‐based group to support adherence and disclosure | |
| Outcomes | Mortality, viral load, increase in CD4+ cell count, cost to provider Assessed at 6 months and 24 months | |
| Notes | ||
| Risk of bias | ||
| Bias | Authors' judgement | Support for judgement |
| Baseline CD4 count (All studies) | Low risk | Similar mean CD4+ cell count in both groups |
| Other baseline variables (All studies) | Low risk | Age, sex and educational status similar at baseline (although occupations different)., |
| Co‐interventions (All studies) | High risk | Treatment supporter was required by home‐based care group |
| Data collection (Cohorts) | Low risk | Prospective cohort |
| Patient selection bias (Cohorts) | Low risk | No selection bias identified |
| Methods | Design: Retrospective cohort Duration: 1 June 2006 ‐ 31 June 2007, censored 31 June 2007 | |
| Participants | Country: Thyolo District, Malawi Setting: Rural, 1 hospital, 9 health centres Inclusion criteria: HIV infected adults and children, eligible for antiretrovirals, CD4 count <250cells/mm3, WHO clinical stage 3 or 4 Exclusion criteria: None described Comparable CD4 count or clinical stage at baseline: More men and children and stage 4 disease at hospital, more patients with active tuberculosis at the health centre | |
| Interventions | Intervention: ART initiated and maintained at health centre, by medical assistant, 1 nurse Control: ART initiated and maintained at hospital by clinical officer, medical assistants, nurses, counsellors Co‐interventions: Both have district mobile support teams | |
| Outcomes | Attrition (dead, loss to follow‐up, stopped treatment), retention (alive and on treatment, and transferred out) Assessment of outcomes provided in person‐years of follow‐up | |
| Notes | ||
| Risk of bias | ||
| Bias | Authors' judgement | Support for judgement |
| Baseline CD4 count (All studies) | Unclear risk | Not reported |
| Other baseline variables (All studies) | High risk | Sicker at peripheral site: More men and children, WHO clinical stage 4 disease, and fewer patients with active Tuberculosis at control site |
| Co‐interventions (All studies) | Unclear risk | The community‐based group received monthly visits from volunteer community support providers, and delivery of their medicines. They were also required to identify a treatment supporter at home, not clear if this applied to both groups |
| Data collection (Cohorts) | High risk | Retrospective cohort |
| Patient selection bias (Cohorts) | Low risk | No selection bias identified |
| Methods | Design: Retrospective cohort Duration: August 2001 to December 2008, compared by year (e.g. 2001/2002; 2003/2004 etc) | |
| Participants | Country: Malawi Setting: 10 peripheral health centres, 1 district hospital Inclusion criteria: HIV infected adults, eligible for antiretrovirals, CD4 count <250cells/mm3, WHO clinical stage 3 or 4 Exclusion criteria: None described Comparable CD4 count or clinical stage at baseline: CD4+ cell count similar at baseline median IQR 176 cells/mm3 [105 ‐229] at the health centre and 149 cells/mm3 [74 ‐ 219]; however more clinical stage 1 and 2 at the health centre which may favour the intervention, also more men at the hospital | |
| Interventions | Intervention: ART initiated and maintained at health centre, by clinical officers. Medical assistants and nurses could prescribe after 2007 Control: ART initiated and maintained at hospital by clinical officer, medical assistants, nurses Co‐interventions: Lay community workers, peer counsellors for adherence support, group and individual counselling | |
| Outcomes | Death, loss to follow‐up and attrition (death and loss to follow‐up) at 12 months | |
| Notes | ||
| Risk of bias | ||
| Bias | Authors' judgement | Support for judgement |
| Baseline CD4 count (All studies) | High risk | Healthier at peripheral site: CD4+ cell count higher. |
| Other baseline variables (All studies) | High risk | Healthier at peripheral site: (clinical stage 1 and 2). |
| Co‐interventions (All studies) | Low risk | default tracing by community health workers, seems to be same for both facilities |
| Data collection (Cohorts) | High risk | Retrospective cohort |
| Patient selection bias (Cohorts) | Low risk | No evidence of selection bias |
| Methods | Design: Retrospective cohort Duration:Initiated therapy between January and December 2007, follow‐up data collected until 2010 | |
| Participants | Country: Nigeria Setting: Secondary (medical officers, nurses, laboratory scientists, pharmacists and community heath officers) and tertiary hospitals (medical specialists) in Nigeria where majority of ART initiation occurs Inclusion criteria: HIV infected adults and children, eligible for antiretrovirals by Nigeria national recommendations, adapted from WHO recommendations Exclusion criteria: None described Comparable CD4 count or clinical stage at baseline: CD4+ cell count not reported, but more patients with clinical stage 3 and 4 at the hospital | |
| Interventions | Intervention: ART initiated and maintained at health centre, by clinical officers. Medical assistants and nurses could prescribe after 2007 Control: ART initiated and maintained at hospital by clinical officer, medical assistants, nurses Co‐interventions: Adehrence counselling and pharmacy counselling received at every visit, at both tiers of health service | |
| Outcomes | Primary outcome was attrition, which includes those stopping treatment,confirmed dead or lost to follow‐up at 12 and 24 months. Loss to follow‐up was defined as those absent from treatment for 90 days. | |
| Notes | As this comparison included tertiary vs secondary hospitals, this differed from other models in the analysis and is therefore described narratively, not included in analysis. | |
| Risk of bias | ||
| Bias | Authors' judgement | Support for judgement |
| Baseline CD4 count (All studies) | Unclear risk | Not stated |
| Other baseline variables (All studies) | High risk | More patients with WHO clinical stage 3 disease at the secondary hospital, this is likely to increase bias in favour of control |
| Co‐interventions (All studies) | Low risk | Same approach to adherence support and counselling in both settings |
| Data collection (Cohorts) | High risk | Retrospecrive cohort |
| Patient selection bias (Cohorts) | Low risk | No selection bias identified |
| Methods | Design: Cluster randomised controlled trial. Unit of allocation: sub‐location, stratified by distance from road, inter cluster co‐efficient not found Duration: March 2006 ‐ April 2008, minimum 12 months follow‐up | |
| Participants | Country: Kenya Setting: Rural, 24 sub‐locations Inclusion criteria: adults >18 years, clinically stable on antiretroviral therapy for 3 months with no adherence issues, disclosed to household members, live within area, informed consent given Exclusion criteria: Active WHO clinical stage 3 or 4 condition, pregnant, hospitalisation in previous 3 months, unable to understand informed consent process Comparable CD4 count or clinical stage at baseline:similar CD4+ cell count and WHO clinical stage | |
| Interventions | Intervention: ART initiated at hospital by clinical officer, maintained in community by person living with HIV/AIDS ("community care coordinators" who had secondary education, were clinically stable, 100% adherent and "considered a good role model"; trained, given mobile computer decision aids, visited patients monthly at home and delivered medicines. Three monthly clinic visits seen by doctor or clinical officer Control: ART initiated at hospital by clinical officer or doctor (10% of visits), maintained at hospital. Visit clinic monthly, seen by nurse and doctor. Co‐interventions: community coordinators had computer decision aids to trigger referral for clinical or social concerns | |
| Outcomes | Viral load, CD4+ cell count, number of clinic visits, Karnofsky score, stability of antiretroviral regimen, opportunistic infections, pregnancy, adherence to drugs, loss to follow‐up Assessed at 12 months | |
| Notes | ||
| Risk of bias | ||
| Bias | Authors' judgement | Support for judgement |
| Baseline CD4 count (All studies) | Low risk | Similar at baseline |
| Other baseline variables (All studies) | Low risk | Similar baseline characteristics including age, sex and WHO clinical staging. |
| Co‐interventions (All studies) | Low risk | Other than the intervention (computerised decision aids and home‐based support) the groups were treated equally. |
| Random sequence generation (Trials) | Unclear risk | Not clearly described |
| Allocation concealment (Trials) | Low risk | Well described |
| Contamination protection (Trials) | Low risk | Unlikely that control group was exposed to intervention |
Characteristics of excluded studies [ordered by study ID]
| Study | Reason for exclusion |
| Decision analysis model using one patient as case study. | |
| Description of program outcomes. | |
| No contemporaneous comparison group. | |
| Cross‐sectional survey. | |
| Cross‐sectional survey. | |
| Randomised controlled trial conducted in high income country (United States of America). | |
| No contemporaneous comparison group. | |
| Cohort study with no clear comparison between standard level/model of care and a decentralised model | |
| Intervention being evaluated was integration of care vs vertical care, both occurred at primary care setting. | |
| Randomised controlled trial done in high income country (Spain). | |
| Cohort (task shifting) with no comparison group. | |
| Qualitative data from health care workers only. | |
| Cohort study with no clear comparison between standard level/model of care and a decentralised model |
Characteristics of studies awaiting assessment [ordered by study ID]
| Methods | |
| Participants | |
| Interventions | |
| Outcomes | |
| Notes | Presentation at International AIDS Conference, 2012. Awaiting additional information from authors. Querying whether this a sub‐study within Assefa 2012 or a different population. |
| Methods | Data from International epidemiologic databases to evaluate AIDS in Southern Africa network (IeDEA‐SA). Programmatic data |
| Participants | 9 Hospitals and 40 health centres in 4 countries, 13 100 patients on ART in 2011 Inclusion criteria: >16 years old at start of ART, no previous ART exposure Baseline characteristics well balanced for sex and age, but not for CD4+ cell counts which were lower at hospital and WHO clinical stages which were more advanced at the hospitals Decentralisation model currently underway in Lesotho |
| Interventions | ART received at nurse run health centres |
| Outcomes | Loss to follow‐up defined as not returning to clinic >= 6 months, mortality. |
| Notes | Oral presentation at the International AIDS Conference, 2012. Additional data regarding loss to follow‐up needed. |
| Methods | |
| Participants | |
| Interventions | |
| Outcomes | |
| Notes | Presentation at International AIDS Conference, 2012. Seeking additional information about publication of this data to assess eligibility. |
| Methods | Retrospective cohort |
| Participants | Children eligible for antiretroviral therapy in South Africa. |
| Interventions | Initiation and maintenance by paediatric medical officers in health centres (enhanced) compared to initiation at an advanced hospital by paediatric doctors and down referral to health centres |
| Outcomes | Mortality, retention, CD4 count |
| Notes | Awaiting feedback from author about outcomes of interest |
| Methods | Cohort study in children Before and after results of decentralisation from hospital to 'outreach' site |
| Participants | Children in paediatric cohort in rural Zambia |
| Interventions | Decentralisation to outreach site, not clear when initiation of ART occurred |
| Outcomes | Cost, travel time, death, loss to follow‐up, viral load |
| Notes | Oral presentation at the International AIDS Conference, 2012. Concludes that outreach group less likely to achieve virological suppression, but travel costs and times lower. Need additional information from authors regarding study design and whether the arms of the study were evaluated contemporaneously. |
Characteristics of ongoing studies [ordered by study ID]
| Trial name or title | Home assessment and initiation of ART: a cluster‐randomised controlled trial in Blantyre, Malawi |
| Methods | Randomised open‐label parallel arm trial |
| Participants | Adults >18 years of age, HIV positive and eligible for ART |
| Interventions | Intervention: Home assessment and initiation of ART Control: Clinic‐based ART assessment and initiation |
| Outcomes | Primary outcome: Antiretroviral initiation within first 6 months Secondary outcomes: Uptake of home‐based HIV testing, disclosure of HIV results, retention on ART, adherence to ART, mortality. |
| Starting date | January 2012 |
| Contact information | Peter MacPherson, [email protected] |
| Notes |
Data and analyses
| Outcome or subgroup title | No. of studies | No. of participants | Statistical method | Effect size | ||||||||||||||||
| 1 Death or lost to care (12 months) Show forest plot | 4 | 39090 | Risk Ratio (IV, Random, 95% CI) | 0.46 [0.29, 0.71] | ||||||||||||||||
| Analysis 1.1  Comparison 1 Partial decentralisation ‐ initiation in hospital, maintenance at health centre, Outcome 1 Death or lost to care (12 months). | ||||||||||||||||||||
| 1.1 Adults | 2 | 29492 | Risk Ratio (IV, Random, 95% CI) | 0.49 [0.21, 1.12] | ||||||||||||||||
| 1.2 Children | 1 | 1505 | Risk Ratio (IV, Random, 95% CI) | 0.45 [0.27, 0.74] | ||||||||||||||||
| 1.3 Adults and children | 1 | 8093 | Risk Ratio (IV, Random, 95% CI) | 0.39 [0.35, 0.43] | ||||||||||||||||
| 2 Lost to care Show forest plot | 6 | Risk Ratio (IV, Random, 95% CI) | Subtotals only | |||||||||||||||||
| Analysis 1.2  Comparison 1 Partial decentralisation ‐ initiation in hospital, maintenance at health centre, Outcome 2 Lost to care. | ||||||||||||||||||||
| 2.1 Lost to care (6 months) | 3 | 28699 | Risk Ratio (IV, Random, 95% CI) | 0.99 [0.56, 1.76] | ||||||||||||||||
| 2.2 Lost to care (12 months) | 4 | 39090 | Risk Ratio (IV, Random, 95% CI) | 0.55 [0.45, 0.69] | ||||||||||||||||
| 2.3 Lost to care (24 months) | 1 | 543 | Risk Ratio (IV, Random, 95% CI) | 0.0 [0.0, 0.0] | ||||||||||||||||
| 3 Death Show forest plot | 6 | Risk Ratio (IV, Random, 95% CI) | Subtotals only | |||||||||||||||||
| Analysis 1.3  Comparison 1 Partial decentralisation ‐ initiation in hospital, maintenance at health centre, Outcome 3 Death. | ||||||||||||||||||||
| 3.1 Death (6 months) | 3 | 28699 | Risk Ratio (IV, Random, 95% CI) | 0.52 [0.19, 1.41] | ||||||||||||||||
| 3.2 Death (12 months) | 4 | 39090 | Risk Ratio (IV, Random, 95% CI) | 0.34 [0.13, 0.87] | ||||||||||||||||
| 3.3 Death (24 months) | 1 | 543 | Risk Ratio (IV, Random, 95% CI) | 0.04 [0.00, 0.58] | ||||||||||||||||
| 4 Cost of travel Show forest plot | Other data | No numeric data | ||||||||||||||||||
| Analysis 1.4
Comparison 1 Partial decentralisation ‐ initiation in hospital, maintenance at health centre, Outcome 4 Cost of travel. | ||||||||||||||||||||
| 4.1 cost of travel | Other data | No numeric data | ||||||||||||||||||
| Outcome or subgroup title | No. of studies | No. of participants | Statistical method | Effect size |
| 1 Death or lost to care (12 months) Show forest plot | 4 | 56360 | Risk Ratio (IV, Random, 95% CI) | 0.70 [0.47, 1.02] |
| Analysis 2.1  Comparison 2 Full decentralisation ‐ initiation and maintenance in health centre, Outcome 1 Death or lost to care (12 months). | ||||
| 1.1 Adults | 3 | 52286 | Risk Ratio (IV, Random, 95% CI) | 0.62 [0.39, 0.99] |
| 1.2 Adults and children | 1 | 4074 | Risk Ratio (IV, Random, 95% CI) | 0.97 [0.82, 1.15] |
| 2 Lost to care Show forest plot | 6 | Risk Ratio (IV, Random, 95% CI) | Subtotals only | |
| Analysis 2.2 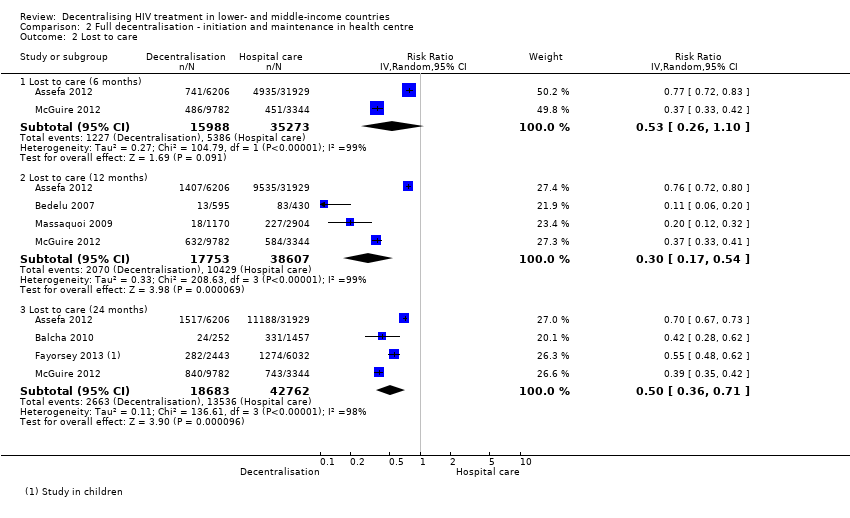 Comparison 2 Full decentralisation ‐ initiation and maintenance in health centre, Outcome 2 Lost to care. | ||||
| 2.1 Lost to care (6 months) | 2 | 51261 | Risk Ratio (IV, Random, 95% CI) | 0.53 [0.26, 1.10] |
| 2.2 Lost to care (12 months) | 4 | 56360 | Risk Ratio (IV, Random, 95% CI) | 0.30 [0.17, 0.54] |
| 2.3 Lost to care (24 months) | 4 | 61445 | Risk Ratio (IV, Random, 95% CI) | 0.50 [0.36, 0.71] |
| 3 Death Show forest plot | 6 | Risk Ratio (IV, Random, 95% CI) | Subtotals only | |
| Analysis 2.3  Comparison 2 Full decentralisation ‐ initiation and maintenance in health centre, Outcome 3 Death. | ||||
| 3.1 Death (6 months) | 2 | 50000 | Risk Ratio (IV, Random, 95% CI) | 0.84 [0.35, 2.00] |
| 3.2 Death (12 Months) | 4 | 55099 | Risk Ratio (IV, Random, 95% CI) | 1.10 [0.63, 1.92] |
| 3.3 Death (24 months) | 4 | 60184 | Risk Ratio (IV, Random, 95% CI) | 0.64 [0.39, 1.06] |
| Outcome or subgroup title | No. of studies | No. of participants | Statistical method | Effect size | ||||||||||||
| 1 Death or lost to care (12 months) Show forest plot | 2 | 709 | Risk Ratio (IV, Random, 95% CI) | 0.95 [0.62, 1.46] | ||||||||||||
| Analysis 3.1 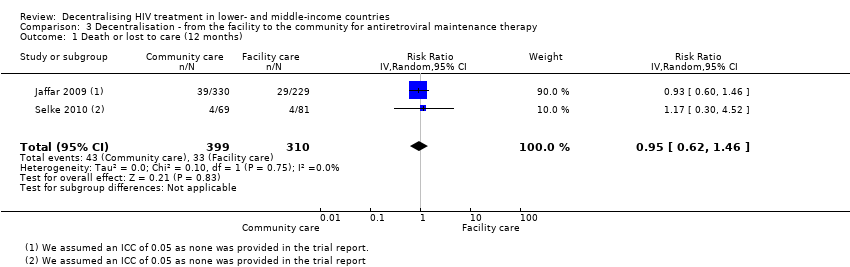 Comparison 3 Decentralisation ‐ from the facility to the community for antiretroviral maintenance therapy, Outcome 1 Death or lost to care (12 months). | ||||||||||||||||
| 2 Lost to care Show forest plot | 3 | Risk Ratio (IV, Random, 95% CI) | Subtotals only | |||||||||||||
| Analysis 3.2  Comparison 3 Decentralisation ‐ from the facility to the community for antiretroviral maintenance therapy, Outcome 2 Lost to care. | ||||||||||||||||
| 2.1 Lost to care (6 months) | 1 | 385 | Risk Ratio (IV, Random, 95% CI) | 1.49 [0.81, 2.74] | ||||||||||||
| 2.2 Lost to care (12 months) | 2 | 709 | Risk Ratio (IV, Random, 95% CI) | 0.81 [0.30, 2.21] | ||||||||||||
| 2.3 Lost to care (24 months) | 1 | 385 | Risk Ratio (IV, Random, 95% CI) | 0.74 [0.46, 1.20] | ||||||||||||
| 3 Death Show forest plot | 3 | Risk Ratio (IV, Random, 95% CI) | Subtotals only | |||||||||||||
| Analysis 3.3  Comparison 3 Decentralisation ‐ from the facility to the community for antiretroviral maintenance therapy, Outcome 3 Death. | ||||||||||||||||
| 3.1 Death (6 months) | 1 | 385 | Risk Ratio (IV, Random, 95% CI) | 1.44 [0.81, 2.57] | ||||||||||||
| 3.2 Death (12 months) | 2 | 709 | Risk Ratio (IV, Random, 95% CI) | 1.03 [0.64, 1.65] | ||||||||||||
| 3.3 Death (24 months) | 1 | 385 | Risk Ratio (IV, Random, 95% CI) | 1.50 [0.91, 2.47] | ||||||||||||
| 4 Cost to patient Show forest plot | Other data | No numeric data | ||||||||||||||
| Analysis 3.4
Comparison 3 Decentralisation ‐ from the facility to the community for antiretroviral maintenance therapy, Outcome 4 Cost to patient. | ||||||||||||||||


Risk of bias summary: review authors' judgements about each risk of bias item for each included study.

Forest plot of comparison: 1 Partial decentralisation ‐ initiation in hospital, maintenance at health centre, outcome: 1.1 Death or lost to care (12 months).

Forest plot of comparison: 1 Partial decentralisation ‐ initiation in hospital, maintenance at health centre, outcome: 1.2 Lost to care.

Forest plot of comparison: 1 Partial decentralisation ‐ initiation in hospital, maintenance at health centre, outcome: 1.3 Death.

Forest plot of comparison: 2 Full decentralisation ‐ initiation and maintenance in health centre, outcome: 2.1 Death or lost to care (12 months).

Forest plot of comparison: 2 Full decentralisation ‐ initiation and maintenance in health centre, outcome: 2.2 Lost to care.

Forest plot of comparison: 2 Full decentralisation ‐ initiation and maintenance in health centre, outcome: 2.3 Death.

Forest plot of comparison: 3 Decentralisation ‐ from the facility to the community for antiretroviral maintenance therapy, outcome: 3.1 Death or lost to care (12 months).

Forest plot of comparison: 3 Decentralisation ‐ to community from facility, outcome: 3.2 lost to care.
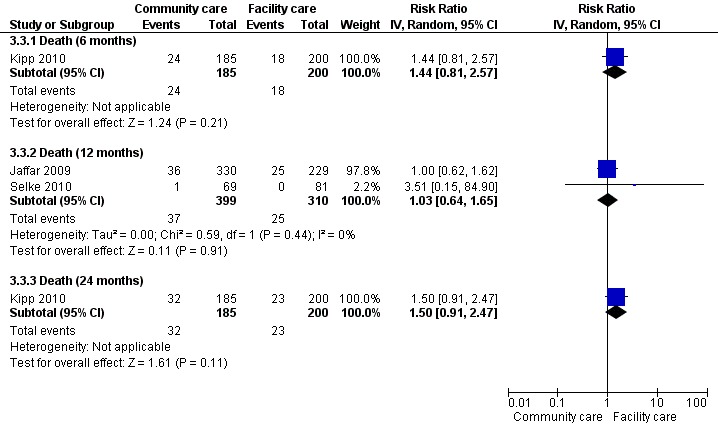
Forest plot of comparison: 3 Decentralisation ‐ to community from facility, outcome: 3.1 Death.
Comparison 1 Partial decentralisation ‐ initiation in hospital, maintenance at health centre, Outcome 1 Death or lost to care (12 months).
Comparison 1 Partial decentralisation ‐ initiation in hospital, maintenance at health centre, Outcome 2 Lost to care.
Comparison 1 Partial decentralisation ‐ initiation in hospital, maintenance at health centre, Outcome 3 Death.
| Study | Down referred patient | Hospital care patient | P‐value |
| cost of travel | |||
| Humphreys 2010 | Average cost for follow up care USD 0.74 | Average cost for follow up care USD 1.5 | P = 0.001 |
Comparison 1 Partial decentralisation ‐ initiation in hospital, maintenance at health centre, Outcome 4 Cost of travel.
Comparison 2 Full decentralisation ‐ initiation and maintenance in health centre, Outcome 1 Death or lost to care (12 months).
Comparison 2 Full decentralisation ‐ initiation and maintenance in health centre, Outcome 2 Lost to care.
Comparison 2 Full decentralisation ‐ initiation and maintenance in health centre, Outcome 3 Death.
Comparison 3 Decentralisation ‐ from the facility to the community for antiretroviral maintenance therapy, Outcome 1 Death or lost to care (12 months).
Comparison 3 Decentralisation ‐ from the facility to the community for antiretroviral maintenance therapy, Outcome 2 Lost to care.
Comparison 3 Decentralisation ‐ from the facility to the community for antiretroviral maintenance therapy, Outcome 3 Death.
| Study | Home based care | Hospital based care |
| Jaffar 2009 | total cost per year for transport, lunch, childcare costs, lost work time: $18/year (after first year) | total cost per year for transport, lunch, childcare costs, lost work time: $54/ year (after the first year) |
| Kipp 2010 | Transport cost $0.74/ visit for home based care | Transport cost $1.5/ visit for facility based care |
Comparison 3 Decentralisation ‐ from the facility to the community for antiretroviral maintenance therapy, Outcome 4 Cost to patient.
| Antiretroviral therapy initiated in a hospital, maintained at a health centre for HIV infected patients | ||||||
| Patient or population: HIV infected patients | ||||||
| Outcomes | Illustrative comparative risks* (95% CI) | Relative effect | No of Participants | Quality of the evidence | Comments | |
| Assumed risk | Corresponding risk | |||||
| Control | Antiretroviral therapy initiated in a hospital, maintained at a health centre | |||||
| Death or lost to care | 218 per 1000 | 100 per 1000 | RR 0.46 | 39090 | ⊕⊕⊕⊝ | |
| Lost to care | 134 per 1000 | 74 per 1000 | RR 0.55 | 39090 | ⊕⊕⊝⊝ | |
| Death | 84 per 1000 | 28 per 1000 | RR 0.34 | 39090 | ⊕⊕⊝⊝ | |
| *The basis for the assumed risk (e.g. the median control group risk across studies) is provided in footnotes. The corresponding risk (and its 95% confidence interval) is based on the assumed risk in the comparison group and the relative effect of the intervention (and its 95% CI). | ||||||
| GRADE Working Group grades of evidence | ||||||
| 1 No serious inconsistency. All four studies report a decrease in attrition at 12 months. | ||||||
| Antiretroviral therapy be started and maintained in health centre for HIV infected patients | ||||||
| Patient or population: HIV infected patients | ||||||
| Outcomes | Illustrative comparative risks* (95% CI) | Relative effect | No of Participants | Quality of the evidence | Comments | |
| Assumed risk | Corresponding risk | |||||
| Control | Antiretroviral therapy be started and maintained in health centre | |||||
| Death or lost to care | 365 per 1000 | 256 per 1000 | RR 0.7 | 56360 | ⊕⊝⊝⊝ | |
| Lost to care | 270 per 1000 | 81 per 1000 | RR 0.3 | 56360 | ⊕⊕⊕⊝ | |
| Death | 97 per 1000 | 106 per 1000 | RR 1.1 | 55099 | ⊕⊝⊝⊝ | |
| *The basis for the assumed risk (e.g. the median control group risk across studies) is provided in footnotes. The corresponding risk (and its 95% confidence interval) is based on the assumed risk in the comparison group and the relative effect of the intervention (and its 95% CI). | ||||||
| GRADE Working Group grades of evidence | ||||||
| 1 Downgraded by 1 for methodological limitations. Bedelu 2008, McGuire 2013 and Massaquoi 2009 included sicker patients at the hospital setting, Assefa has unknown baseline risk as other baseline characteristics were not reported. This bias would tend to favour therapy provided at the health centre. | ||||||
| Decentralisation from the facility to the community for antiretroviral maintenance therapy for HIV‐infected patients | ||||||
| Patient or population: HIV‐infected patients | ||||||
| Outcomes | Illustrative comparative risks* (95% CI) | Relative effect | No of Participants | Quality of the evidence | Comments | |
| Assumed risk | Corresponding risk | |||||
| Control | Decentralisation from the facility to the community for antiretroviral maintenance therapy | |||||
| Death or lost to care | 106 per 1000 | 101 per 1000 | RR 0.95 | 709 | ⊕⊕⊕⊝ | |
| Lost to care | 26 per 1000 | 21 per 1000 | RR 0.81 | 709 | ⊕⊕⊕⊝ | |
| Death | Moderate | RR 1.03 | 709 | ⊕⊕⊕⊝ | ||
| 55 per 1000 | 57 per 1000 | |||||
| *The basis for the assumed risk (e.g. the median control group risk across studies) is provided in footnotes. The corresponding risk (and its 95% confidence interval) is based on the assumed risk in the comparison group and the relative effect of the intervention (and its 95% CI). | ||||||
| GRADE Working Group grades of evidence | ||||||
| 1 Not downgraded for indirectness. Note that the trials were conducted in Kenya and Uganda in adult populations. | ||||||
| Tier | Highest cadre | Terms often used | Facility and staff | Equipment facilities |
| Community | Individual with maximum of few months training; paid or unpaid | 1a. Family led care | Family member |
|
|
| 1b. Village volunteer | Trained volunteer; health assistants | HIV tests, counselling, replenish drugs | |
|
| 1c. Primary care clinic | Nurse aide or community health worker with a few months training |
| |
| Health centre | clinical officer or nurse (2+ years training) | Health centres; district hospitals | Purpose built with at least one paramedic or nurse with some health assistants | HIV tests; antiretrovirals; opportunistic infections medicines; point of care laboratories |
| Health centre (enhanced) | Clinical officer or nurse (2 + years training) | Health centres, primary healthcare clinics, district hospitals | Purpose built with at least one paramedic or nurse with some health assistants, with input from a doctor (may be via mobile support service) | HIV tests; antiretrovirals; opportunistic infections medicines; point of care laboratories |
| Hospital | Doctor | Health centres; district hospitals | Purpose built with at least one medical doctor with nurses / paramedics and assistants | CD4 count Medicines Not viral load |
| Hospital (advanced) | Specialist doctor | District hospital; referral hospital | Purpose built with at least 2 specialist doctors with nurses / paramedics and assistants | Viral load and full investigations |
| Our term | Initiation | Follow‐up |
| Standard hospital model | Hospital | Hospital |
| Partial decentralisation | Hospital | Health centre |
| Full decentralisation | Health centre | Health centre |
| Full decentralisation with regular hospital support | Health centre (weekly clinics with hospital staff) | Health centre (weekly clinics with hospital staff) |
| Community | Primary (tier 1c) Health centre
| Primary (tier 1c) (monitor six monthly by health centre) |
| Models of care | Provider details | Laboratory facilities | Community support | Training in ART initiation and maintenance | Supervision or mentoring | Referral | |
| Partial decentralisation | |||||||
| Bock 2008 | Health centres (enhanced) | Doctors | yes | not stated | not stated | specialists available | yes |
| Hospital (advanced) | Doctors | yes | not stated | yes | specialists available | not applicable | |
| Brennan 2011 | Health centres | Primary health care nurses | not stated | not stated | yes | yes ‐ telephonic | yes ‐ to hospital |
|
| Hospitals | Doctors | not stated | not stated | not applicable | not applicable | not applicable |
| Chan 2010 | Health centres | Nurses and health surveillance assistants | no | Expert patients | yes | yes ‐ from hospital | not stated |
|
| Hospitals | Clinical officers, nurses and doctors | yes | Home‐based care volunteers | not applicable | not applicable | not stated |
| Fatti 2010 | Health centres | Doctors | yes | Community‐based adherence counsellors | not stated | not stated | not stated |
|
| Hospitals | Doctors | yes | not stated | not stated | not stated | not stated |
| Hansudewechakul 2012 | health centres | Nurses | yes | yes | yes | yes | not stated |
| Hospital | Doctors | yes | yes | yes | not applicable | not stated | |
| Humphreys 2010 | Health centres | Nurses | no | not stated | yes | yes ‐ monthly visit from nurse and counsellor | yes |
| Hospital | Doctors | yes | not stated | not applicable | not applicable | not applicable | |
| Full decentralisation | |||||||
| Assefa 2012 | Health centres | Health officers, nurse | not stated | Community health workers, adherence counselling, defaulter tracing, referral and linkage between facilities | not stated | not stated | yes ‐ to hospital |
|
| Hospitals | Doctors | not stated | none | not stated | not stated | not applicable |
| Balcha 2010 | Health centres | Health officers, nurses, data clerk, pharmacy technicians | not stated | not stated | not stated | not stated | yes ‐ to hospital |
|
| Hospitals | Nurses, data clerks, pharmacists | not stated | not stated | not stated | not stated | not applicable |
| Bedelu 2007 | Health centres | Nurses | no | Community health workers, adherence support, defaulter tracing | yes | yes ‐ mobile team | yes ‐ to hospital |
|
| Hospitals | Doctors | yes | no | not stated | not applicable | not applicable |
| Fayorsey 2013 | health centres | doctors and nurses | 8/182 sites CD4 machines | variable by site | not stated | not stated | yes |
| Hospitals | doctors and nurses | 54/92 sites Cd4 machines | variable by site | not stated | not stated | not applicable | |
| Massaquoi 2009 | Health centres | Medical assistants and nurse | yes | yes | yes | yes | yes ‐ to hospital |
|
| Hospitals | Doctors | yes | not stated | yes | not applicable | not applicable |
| McGuire 2012 | Health centres | Clinical officers, nurses and medical assistants | yes | yes | yes | not stated | yes |
| Hospitals | Clinical officers and nurses | yes | yes | not stated | not stated | not applicable | |
| Odafe 2012 | Hospitals | Medical doctors | yes | yes | not stated | not stated | not stated |
| Hospitals (advanced) | Medical specialists | yes | not stated | not stated | not applicable | not applicable | |
| Decentralisation from facility to community | |||||||
| Jaffar | Community | Field officers | no | not stated | yes | yes | yes |
|
| Health centres | Clinical staff | yes | not stated | yes | yes | not applicable |
| Kipp | Community | Unpaid volunteers, >18 years old and literate | no | Treatment supporter to assist with adherence | yes | yes | yes |
|
| Health centres | Doctors | yes | no | not applicable | not stated | not applicable |
| Selke | Community | Community care co‐ordinators | no | Computer aided devices | yes | yes | yes |
|
| Health centres | Clinical officers, doctor (1 day/ week) | yes | no | not applicable | not applicable | not applicable |
| Outcome or subgroup title | No. of studies | No. of participants | Statistical method | Effect size |
| 1 Death or lost to care (12 months) Show forest plot | 4 | 39090 | Risk Ratio (IV, Random, 95% CI) | 0.46 [0.29, 0.71] |
| 1.1 Adults | 2 | 29492 | Risk Ratio (IV, Random, 95% CI) | 0.49 [0.21, 1.12] |
| 1.2 Children | 1 | 1505 | Risk Ratio (IV, Random, 95% CI) | 0.45 [0.27, 0.74] |
| 1.3 Adults and children | 1 | 8093 | Risk Ratio (IV, Random, 95% CI) | 0.39 [0.35, 0.43] |
| 2 Lost to care Show forest plot | 6 | Risk Ratio (IV, Random, 95% CI) | Subtotals only | |
| 2.1 Lost to care (6 months) | 3 | 28699 | Risk Ratio (IV, Random, 95% CI) | 0.99 [0.56, 1.76] |
| 2.2 Lost to care (12 months) | 4 | 39090 | Risk Ratio (IV, Random, 95% CI) | 0.55 [0.45, 0.69] |
| 2.3 Lost to care (24 months) | 1 | 543 | Risk Ratio (IV, Random, 95% CI) | 0.0 [0.0, 0.0] |
| 3 Death Show forest plot | 6 | Risk Ratio (IV, Random, 95% CI) | Subtotals only | |
| 3.1 Death (6 months) | 3 | 28699 | Risk Ratio (IV, Random, 95% CI) | 0.52 [0.19, 1.41] |
| 3.2 Death (12 months) | 4 | 39090 | Risk Ratio (IV, Random, 95% CI) | 0.34 [0.13, 0.87] |
| 3.3 Death (24 months) | 1 | 543 | Risk Ratio (IV, Random, 95% CI) | 0.04 [0.00, 0.58] |
| 4 Cost of travel Show forest plot | Other data | No numeric data | ||
| 4.1 cost of travel | Other data | No numeric data | ||
| Outcome or subgroup title | No. of studies | No. of participants | Statistical method | Effect size |
| 1 Death or lost to care (12 months) Show forest plot | 4 | 56360 | Risk Ratio (IV, Random, 95% CI) | 0.70 [0.47, 1.02] |
| 1.1 Adults | 3 | 52286 | Risk Ratio (IV, Random, 95% CI) | 0.62 [0.39, 0.99] |
| 1.2 Adults and children | 1 | 4074 | Risk Ratio (IV, Random, 95% CI) | 0.97 [0.82, 1.15] |
| 2 Lost to care Show forest plot | 6 | Risk Ratio (IV, Random, 95% CI) | Subtotals only | |
| 2.1 Lost to care (6 months) | 2 | 51261 | Risk Ratio (IV, Random, 95% CI) | 0.53 [0.26, 1.10] |
| 2.2 Lost to care (12 months) | 4 | 56360 | Risk Ratio (IV, Random, 95% CI) | 0.30 [0.17, 0.54] |
| 2.3 Lost to care (24 months) | 4 | 61445 | Risk Ratio (IV, Random, 95% CI) | 0.50 [0.36, 0.71] |
| 3 Death Show forest plot | 6 | Risk Ratio (IV, Random, 95% CI) | Subtotals only | |
| 3.1 Death (6 months) | 2 | 50000 | Risk Ratio (IV, Random, 95% CI) | 0.84 [0.35, 2.00] |
| 3.2 Death (12 Months) | 4 | 55099 | Risk Ratio (IV, Random, 95% CI) | 1.10 [0.63, 1.92] |
| 3.3 Death (24 months) | 4 | 60184 | Risk Ratio (IV, Random, 95% CI) | 0.64 [0.39, 1.06] |
| Outcome or subgroup title | No. of studies | No. of participants | Statistical method | Effect size |
| 1 Death or lost to care (12 months) Show forest plot | 2 | 709 | Risk Ratio (IV, Random, 95% CI) | 0.95 [0.62, 1.46] |
| 2 Lost to care Show forest plot | 3 | Risk Ratio (IV, Random, 95% CI) | Subtotals only | |
| 2.1 Lost to care (6 months) | 1 | 385 | Risk Ratio (IV, Random, 95% CI) | 1.49 [0.81, 2.74] |
| 2.2 Lost to care (12 months) | 2 | 709 | Risk Ratio (IV, Random, 95% CI) | 0.81 [0.30, 2.21] |
| 2.3 Lost to care (24 months) | 1 | 385 | Risk Ratio (IV, Random, 95% CI) | 0.74 [0.46, 1.20] |
| 3 Death Show forest plot | 3 | Risk Ratio (IV, Random, 95% CI) | Subtotals only | |
| 3.1 Death (6 months) | 1 | 385 | Risk Ratio (IV, Random, 95% CI) | 1.44 [0.81, 2.57] |
| 3.2 Death (12 months) | 2 | 709 | Risk Ratio (IV, Random, 95% CI) | 1.03 [0.64, 1.65] |
| 3.3 Death (24 months) | 1 | 385 | Risk Ratio (IV, Random, 95% CI) | 1.50 [0.91, 2.47] |
| 4 Cost to patient Show forest plot | Other data | No numeric data | ||