Quimioterapia con cetuximab versus quimioterapia sola para el cáncer de pulmón de células no pequeñas avanzado que nunca fue tratado con quimioterapia
Appendices
Appendix 1. The Cochrane Lung Cancer Review Group Specialized Register (from inception to 17 December 2013) search strategy
All records in the Register coded as 'non‐small cell lung cancer' will be searched using the following terms: monoclonal antibody OR monoclonal antibodies OR mab OR mcab OR moab OR cetuximab OR erbitux OR c225 OR c‐225.
Appendix 2. The Cochrane Central Register of Controlled Clinical Trials (CENTRAL, from inception to 17 December 2013) search strategy
1. MeSH descriptor Carcinoma, Non‐Small‐Cell Lung explode all trees
2. "Non‐Small‐Cell Lung Cancer" OR "Non‐Small‐Cell Lung Carcinoma" OR "Non‐Small Cell Lung Cancer" OR "Non‐Small Cell Lung Carcinoma" OR "Non Small‐Cell Lung Cancer" OR "Non Small‐Cell Lung Carcinoma" OR "Non Small Cell Lung Cancer" OR "Non Small Cell Lung Carcinoma" OR NSCLC
3. (#1 OR #2)
4. MeSH descriptor Antibodies, Monoclonal explode all trees/
5. "monoclonal antibody" OR "monoclonal antibodies" OR mab OR mcab OR moab OR cetuximab OR erbitux OR c225 OR c‐225
6. (#4 OR #5)
7. (#3 AND #6)
Appendix 3. MEDLINE (access through PubMed (1966 to 17 December 2013)) search strategy
1. "Carcinoma, Non‐Small‐Cell Lung"[Mesh]
2. "Non‐Small‐Cell Lung Cancer" OR "Non‐Small‐Cell Lung Carcinoma" OR "Non‐Small Cell Lung Cancer" OR "Non‐Small Cell Lung Carcinoma" OR "Non Small‐Cell Lung Cancer" OR "Non Small‐Cell Lung Carcinoma" OR "Non Small Cell Lung Cancer" OR "Non Small Cell Lung Carcinoma" OR NSCLC
3. #1 OR #2
4. "Antibodies, Monoclonal"[Mesh]
5. "cetuximab"[Substance Name]
6. "monoclonal antibody" OR "monoclonal antibodies" OR mab OR mcab OR moab OR cetuximab OR erbitux OR c225 OR c‐225
7. #4 OR #5 OR #6
8. "Clinical Trial" [Publication Type] Field: Title/Abstract
9. random* Field: Title/Abstract
10. placebo Field: Title/Abstract
11. trial Field: Title
12. "Meta‐Analysis" [Publication Type] Field: Title/Abstract
13. "Review" [Publication Type] Field: Title/Abstract
14. #8 OR #9 OR #10 OR #11 OR #12 OR #13
15. #3 AND #7 AND #14
16. #15 Limits: Humans
Appendix 4. EMBASE (1980 to 17 December 2013) search strategy
1. lung non small cell cancer/
2. Non‐Small‐Cell Lung Cancer.af.
3. Non‐Small‐Cell Lung Carcinoma.af.
4. Non‐Small Cell Lung Cancer.af.
5. Non‐Small Cell Lung Carcinoma.af.
6. Non Small‐Cell Lung Cancer.af.
7. Non Small‐Cell Lung Carcinoma.af.
8. Non Small Cell Lung Cancer.af.
9. Non Small Cell Lung Carcinoma.af.
10. NSCLC.af.
11. 1 or 2 or 3 or 4 or 5 or 6 or 7 or 8 or 9 or 10
12. monoclonal antibody/
13. cetuximab/
14. monoclonal antibody.af.
15. monoclonal antibodies.af.
16. mab.af.
17. mcab.af.
18. moab.af.
19. cetuximab.af.
20. erbitux.af.
21. c225.af.
22. c‐225.af.
23. 12 or 13 or 14 or 15 or 16 or 17 or 18 or 19 or 20 or 21 or 22
24. 11 and 23
25. limit 24 to (clinical trial or randomized controlled trial or controlled clinical trial)
26. limit 24 to (meta analysis or "systematic review")
27. random*.ab.
28. placebo.ab.
29. trial.ti.
30. 27 or 28 or 29
31. 24 and 30
32. 25 or 26 or 31
33. limit 32 to human
Appendix 5. Clinical trial registries (from inception to 17 December 2013) search strategy
The website of ClinicalTrials.gov (clinicaltrials.gov) will be searched using "cetuximab or erbitux or c225 or c‐225" as "Search Terms" and "lung cancer" as "Conditions" under the "Advanced Search" tab. The website of WHO International Clinical Trials Registry Platform (ICTRP) search portal (apps.who.int/trialsearch/Default.aspx) will also be searched using "cetuximab or erbitux or c225 or c‐225" in the "Title" and "lung cancer" as "Conditions" under the "Advanced Search" tab.
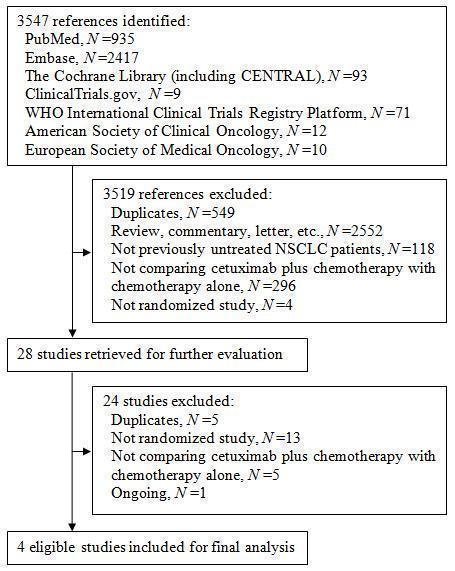
Figure 1. The flow chart of study selection
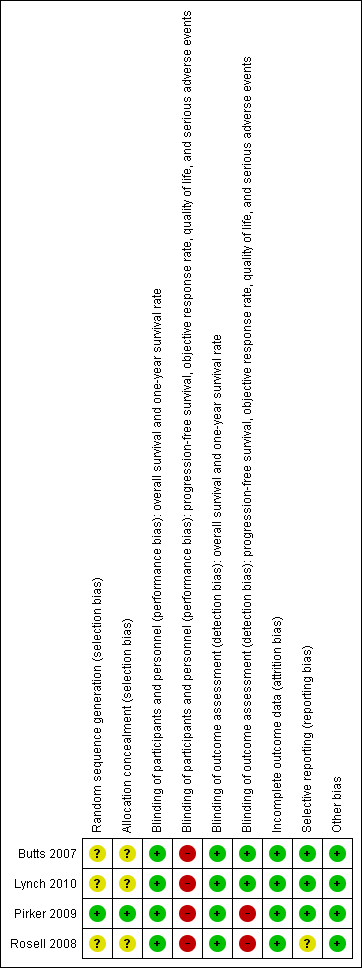
Risk of bias summary: review authors' judgements about each risk of bias item for each included study.

Risk of bias graph: review authors' judgements about each risk of bias item presented as percentages across all included studies.
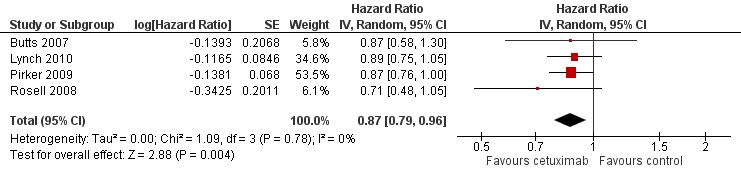
Forest plot of comparison: 1 chemotherapy plus cetuximab versus chemotherapy alone, outcome: 1.1 Overall survival.

Forest plot of comparison: 1 chemotherapy plus cetuximab versus chemotherapy alone, outcome: 1.2 Progression‐free survival.

Forest plot of comparison: 1 chemotherapy plus cetuximab versus chemotherapy alone, outcome: 1.3 Objective response rate.
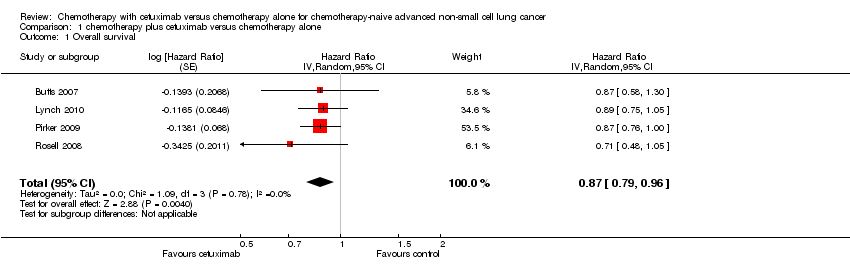
Comparison 1 chemotherapy plus cetuximab versus chemotherapy alone, Outcome 1 Overall survival.

Comparison 1 chemotherapy plus cetuximab versus chemotherapy alone, Outcome 2 Progression‐free survival.
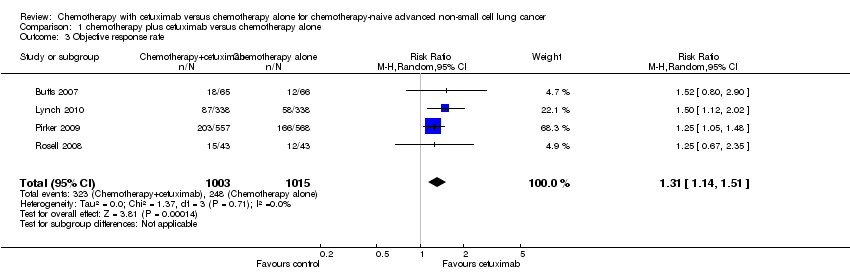
Comparison 1 chemotherapy plus cetuximab versus chemotherapy alone, Outcome 3 Objective response rate.

Comparison 1 chemotherapy plus cetuximab versus chemotherapy alone, Outcome 4 One‐year survival rate.
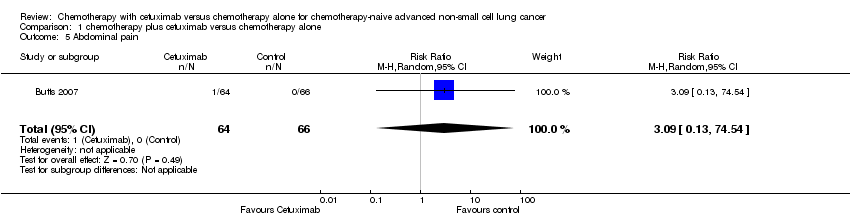
Comparison 1 chemotherapy plus cetuximab versus chemotherapy alone, Outcome 5 Abdominal pain.

Comparison 1 chemotherapy plus cetuximab versus chemotherapy alone, Outcome 6 Acneiform rash.

Comparison 1 chemotherapy plus cetuximab versus chemotherapy alone, Outcome 7 Anorexia.

Comparison 1 chemotherapy plus cetuximab versus chemotherapy alone, Outcome 8 Anxiety.
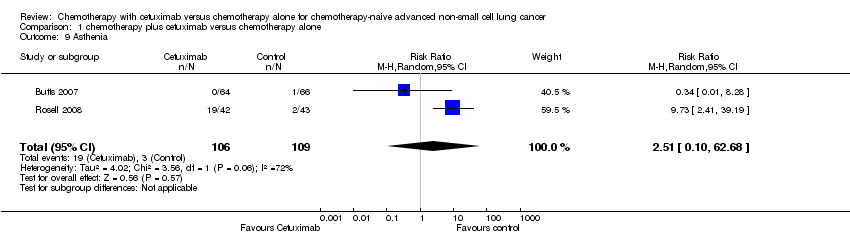
Comparison 1 chemotherapy plus cetuximab versus chemotherapy alone, Outcome 9 Asthenia.

Comparison 1 chemotherapy plus cetuximab versus chemotherapy alone, Outcome 10 Back pain.

Comparison 1 chemotherapy plus cetuximab versus chemotherapy alone, Outcome 11 Bleeding events.

Comparison 1 chemotherapy plus cetuximab versus chemotherapy alone, Outcome 12 Cardiac events.

Comparison 1 chemotherapy plus cetuximab versus chemotherapy alone, Outcome 13 Constipation.

Comparison 1 chemotherapy plus cetuximab versus chemotherapy alone, Outcome 14 Dehydration.

Comparison 1 chemotherapy plus cetuximab versus chemotherapy alone, Outcome 15 Diarrhoea.

Comparison 1 chemotherapy plus cetuximab versus chemotherapy alone, Outcome 16 Dysphasia.

Comparison 1 chemotherapy plus cetuximab versus chemotherapy alone, Outcome 17 Dyspnea.

Comparison 1 chemotherapy plus cetuximab versus chemotherapy alone, Outcome 18 Epistaxis.
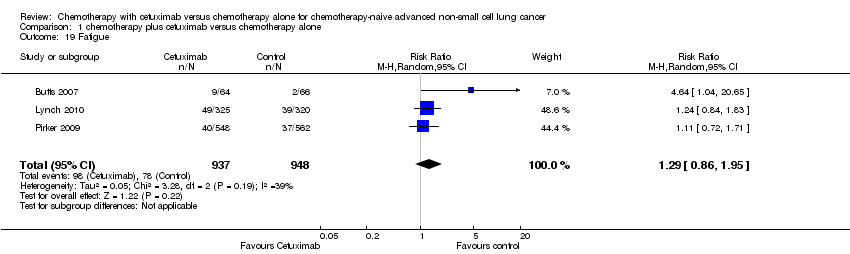
Comparison 1 chemotherapy plus cetuximab versus chemotherapy alone, Outcome 19 Fatigue.

Comparison 1 chemotherapy plus cetuximab versus chemotherapy alone, Outcome 20 Hypokalaemia.

Comparison 1 chemotherapy plus cetuximab versus chemotherapy alone, Outcome 21 Hypomagnesemia.
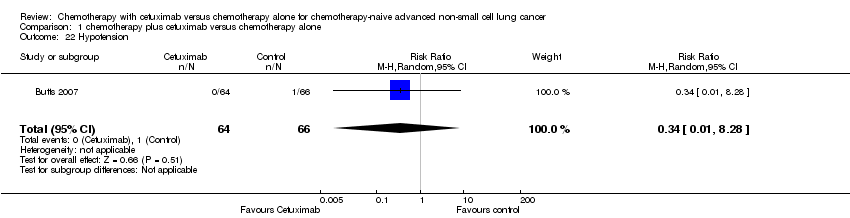
Comparison 1 chemotherapy plus cetuximab versus chemotherapy alone, Outcome 22 Hypotension.
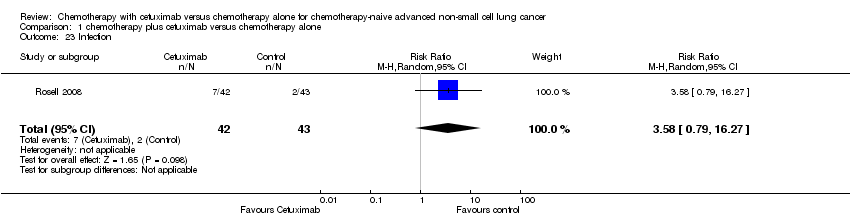
Comparison 1 chemotherapy plus cetuximab versus chemotherapy alone, Outcome 23 Infection.

Comparison 1 chemotherapy plus cetuximab versus chemotherapy alone, Outcome 24 Infusion reaction.

Comparison 1 chemotherapy plus cetuximab versus chemotherapy alone, Outcome 25 Mucosal inflammation.
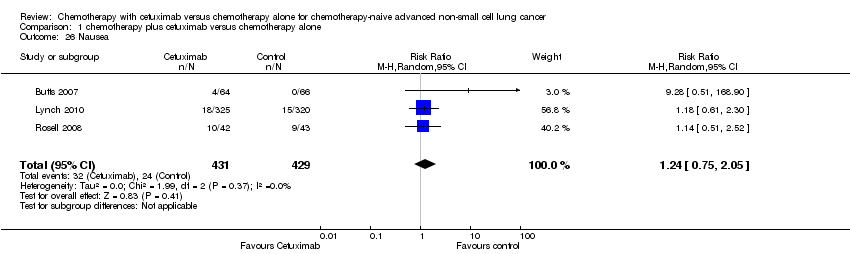
Comparison 1 chemotherapy plus cetuximab versus chemotherapy alone, Outcome 26 Nausea.

Comparison 1 chemotherapy plus cetuximab versus chemotherapy alone, Outcome 27 Pneumonia.

Comparison 1 chemotherapy plus cetuximab versus chemotherapy alone, Outcome 28 Pulmonary embolism.

Comparison 1 chemotherapy plus cetuximab versus chemotherapy alone, Outcome 29 Pyrexia.

Comparison 1 chemotherapy plus cetuximab versus chemotherapy alone, Outcome 30 Respiratory failure.

Comparison 1 chemotherapy plus cetuximab versus chemotherapy alone, Outcome 31 Sepsis.

Comparison 1 chemotherapy plus cetuximab versus chemotherapy alone, Outcome 32 Stomatitis.
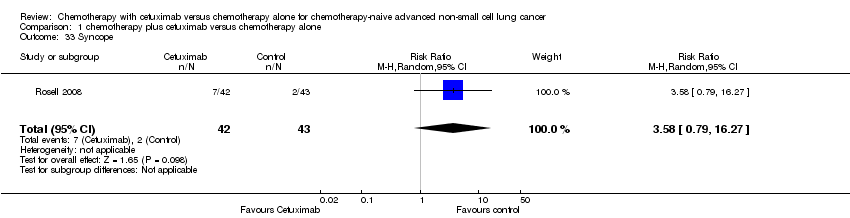
Comparison 1 chemotherapy plus cetuximab versus chemotherapy alone, Outcome 33 Syncope.

Comparison 1 chemotherapy plus cetuximab versus chemotherapy alone, Outcome 34 Vomiting.
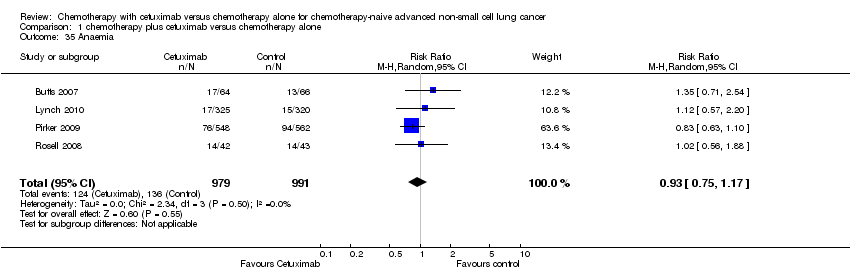
Comparison 1 chemotherapy plus cetuximab versus chemotherapy alone, Outcome 35 Anaemia.

Comparison 1 chemotherapy plus cetuximab versus chemotherapy alone, Outcome 36 Febrile neutropenia.
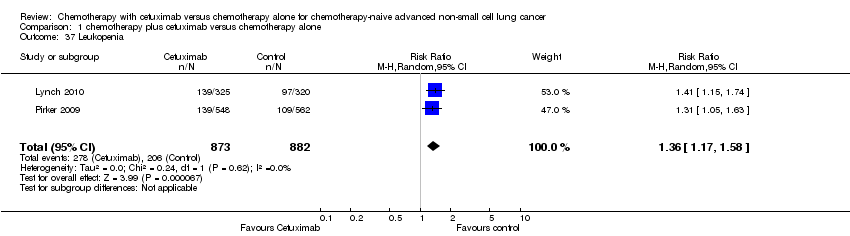
Comparison 1 chemotherapy plus cetuximab versus chemotherapy alone, Outcome 37 Leukopenia.

Comparison 1 chemotherapy plus cetuximab versus chemotherapy alone, Outcome 38 Thrombocytopenia.
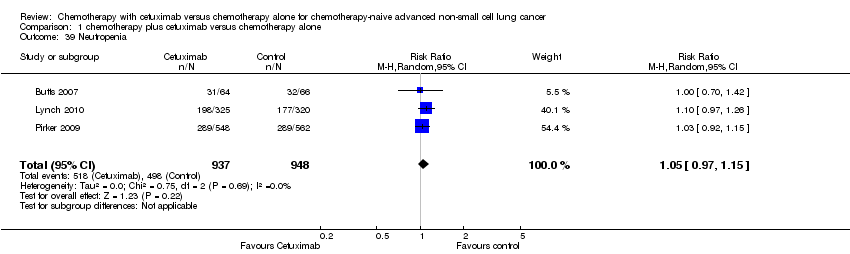
Comparison 1 chemotherapy plus cetuximab versus chemotherapy alone, Outcome 39 Neutropenia.
| Chemotherapy plus cetuximab compared with chemotherapy alone for chemotherapy‐naive advanced non‐small cell lung cancer | ||||||
| Patient or population: Patients with advanced non‐small cell lung cancer Settings: First‐line treatment Intervention: Chemotherapy plus cetuximab Comparison: Chemotherapy | ||||||
| Outcomes | Illustrative comparative risks* (95% CI) | Relative effect | No of Participants | Quality of the evidence | Comments | |
| Assumed risk | Corresponding risk | |||||
| Chemotherapy alone | Chemotherapy plus cetuximab | |||||
| Overall survival1 | 8.9 months | 10.5 months | HR 0.87 (0.79 to 0.96) | 2018 | ⊕⊕⊕⊕ | |
| Progression‐free survival1 | 4.4 months | 4.9 months | HR 0.91 (0.83 to 1.00) | 2018 | ⊕⊕⊝⊝ | |
| One‐year survival rate2 | 40 per 100 | 45 per 100 (41 to 50) | RR 1.13 (1.02 to 1.25) | 2018 | ⊕⊕⊕⊕ | |
| Objective response rate2 | 23 per 100 | 30 per 100 (26 to 35) | RR 1.31 (1.14 to 1.51) | 2018 | ⊕⊕⊕⊝ | |
| Quality of life3 | See comment | See comment | Not estimable | 1801 | ⊕⊕⊝⊝ | Both studies reported that there were no significant differences in the change of quality of life between the two treatment arms, but no detailed data were reported |
| Serious adverse events2,4 | 1. acneiform rash: 0.3 per 100 2. hypomagnesemia: 0.8 per 100 3. infusion reaction: 1.1 per 100 4. diarrhoea: 2.3 per 100 5. hypokalaemia: 3.6 per 100 6. febrile neutropenia: 7.6 per 100 7.leukopenia: 42.7 per 100 | 1. acneiform rash: 11.2 per 100 (3.2 to 39.3) 2. hypomagnesemia: 5.3 per 100 (0.9 to 30.5) 3. infusion reaction: 3.9 per 100 (1.9 to 7.6) 4. diarrhoea: 4.8 per 100 (2.9 to 8.0) 5. hypokalaemia: 6.3 per 100 (3.7 to 10.8) 6. febrile neutropenia: 10.6 per 100 (8.4 to 13.5) 7.leukopenia: 58.1 per 100 (50.0 to 67.5) | 1. acneiform rash: RR 37.36 (10.66 to 130.95) 2. hypomagnesemia: RR 6.57 (1.13 to 38.12) 3. infusion reaction: RR 3.50 (1.76 to 6.94) 4. diarrhoea: RR 2.10 (1.26 to 3.48) 5. hypokalaemia: RR 1.74 (1.02 to 2.99) 6. febrile neutropenia: RR 1.40 (1.10 to 1.77) 7.leukopenia: RR 1.36 (1.17 to 1.58) | 1. acneiform rash: 1970 2. hypomagnesemia: 775 3. infusion reaction: 1885 4. diarrhoea: 1885 5. hypokalaemia: 1110 6. febrile neutropenia: 1755 7.leukopenia: 1755 | ⊕⊕⊝⊝ | For other adverse events, there were no significant differences between the two treatment arms |
| *The basis for the assumed risk (e.g. the median control group risk across studies) is provided in footnotes. The corresponding risk (and its 95% confidence interval) is based on the assumed risk in the comparison group and the relative effect of the intervention (and its 95% CI). | ||||||
| GRADE Working Group grades of evidence | ||||||
| 1 For time‐to‐event outcomes, e.g. overall survival, the assumed risk was obtained by calculating the median value of the "median survival time of the control arm" reported by different studies. The corresponding risk was obtained in a similar way, i.e. by calculating the median value of the "median survival time of the intervention arm" reported by different studies. 2 For dichotomous outcomes, e.g. one‐year survival rate, the assumed risk was obtained by meta‐analysis of the one‐year survival rates of control arms from all relevant studies. 3 For the assessment of quality of life: In Lynch 2010, the FACT‐LCS5 questionnaire was used; in Pirker 2009, the European Organisation for Research and Treatment of Cancer quality of life questionnaire C30 (version 3.0), EORTC lung cancer specific QLQ‐LC13, and EuroQoL (EQ‐5D) questionnaires were used. 4 The overall risk of serious adverse events was not available. Thus, specific adverse events that occurred with significantly different frequencies in the two arms were summarised instead. 5 The quality of evidence is downgraded by two factors, i.e. study limitations and imprecision, according to the guidelines of the GRADE Working Group. 6 The quality of evidence is downgraded by one factor, i.e. study limitations, according to the guidelines of the GRADE Working Group. | ||||||
| Outcome or subgroup title | No. of studies | No. of participants | Statistical method | Effect size |
| 1 Overall survival Show forest plot | 4 | Hazard Ratio (Random, 95% CI) | 0.87 [0.79, 0.96] | |
| 2 Progression‐free survival Show forest plot | 4 | Hazard Ratio (Random, 95% CI) | 0.91 [0.83, 1.00] | |
| 3 Objective response rate Show forest plot | 4 | 2018 | Risk Ratio (M‐H, Random, 95% CI) | 1.31 [1.14, 1.51] |
| 4 One‐year survival rate Show forest plot | 4 | 2018 | Risk Ratio (M‐H, Random, 95% CI) | 1.13 [1.02, 1.25] |
| 5 Abdominal pain Show forest plot | 1 | 130 | Risk Ratio (M‐H, Random, 95% CI) | 3.09 [0.13, 74.54] |
| 6 Acneiform rash Show forest plot | 4 | 1970 | Risk Ratio (M‐H, Random, 95% CI) | 37.36 [10.66, 130.95] |
| 7 Anorexia Show forest plot | 1 | 130 | Risk Ratio (M‐H, Random, 95% CI) | 9.28 [0.51, 168.90] |
| 8 Anxiety Show forest plot | 1 | 130 | Risk Ratio (M‐H, Random, 95% CI) | 1.03 [0.07, 16.14] |
| 9 Asthenia Show forest plot | 2 | 215 | Risk Ratio (M‐H, Random, 95% CI) | 2.51 [0.10, 62.68] |
| 10 Back pain Show forest plot | 1 | 130 | Risk Ratio (M‐H, Random, 95% CI) | 5.15 [0.25, 105.31] |
| 11 Bleeding events Show forest plot | 1 | 1110 | Risk Ratio (M‐H, Random, 95% CI) | 0.68 [0.31, 1.51] |
| 12 Cardiac events Show forest plot | 1 | 1110 | Risk Ratio (M‐H, Random, 95% CI) | 1.14 [0.69, 1.87] |
| 13 Constipation Show forest plot | 1 | 130 | Risk Ratio (M‐H, Random, 95% CI) | 2.06 [0.19, 22.19] |
| 14 Dehydration Show forest plot | 2 | 775 | Risk Ratio (M‐H, Random, 95% CI) | 2.20 [0.80, 6.01] |
| 15 Diarrhoea Show forest plot | 3 | 1885 | Risk Ratio (M‐H, Random, 95% CI) | 2.10 [1.26, 3.48] |
| 16 Dysphasia Show forest plot | 1 | 130 | Risk Ratio (M‐H, Random, 95% CI) | 3.09 [0.13, 74.54] |
| 17 Dyspnea Show forest plot | 3 | 1325 | Risk Ratio (M‐H, Random, 95% CI) | 2.62 [0.53, 12.96] |
| 18 Epistaxis Show forest plot | 1 | 130 | Risk Ratio (M‐H, Random, 95% CI) | 3.09 [0.33, 28.97] |
| 19 Fatigue Show forest plot | 3 | 1885 | Risk Ratio (M‐H, Random, 95% CI) | 1.29 [0.86, 1.95] |
| 20 Hypokalaemia Show forest plot | 1 | 1110 | Risk Ratio (M‐H, Random, 95% CI) | 1.74 [1.02, 2.99] |
| 21 Hypomagnesemia Show forest plot | 2 | 775 | Risk Ratio (M‐H, Random, 95% CI) | 6.57 [1.13, 38.12] |
| 22 Hypotension Show forest plot | 1 | 130 | Risk Ratio (M‐H, Random, 95% CI) | 0.34 [0.01, 8.28] |
| 23 Infection Show forest plot | 1 | 85 | Risk Ratio (M‐H, Random, 95% CI) | 3.58 [0.79, 16.27] |
| 24 Infusion reaction Show forest plot | 3 | 1885 | Risk Ratio (M‐H, Random, 95% CI) | 3.50 [1.76, 6.94] |
| 25 Mucosal inflammation Show forest plot | 1 | 130 | Risk Ratio (M‐H, Random, 95% CI) | 0.34 [0.01, 8.28] |
| 26 Nausea Show forest plot | 3 | 860 | Risk Ratio (M‐H, Random, 95% CI) | 1.24 [0.75, 2.05] |
| 27 Pneumonia Show forest plot | 1 | 130 | Risk Ratio (M‐H, Random, 95% CI) | 3.09 [0.13, 74.54] |
| 28 Pulmonary embolism Show forest plot | 1 | 1110 | Risk Ratio (M‐H, Random, 95% CI) | 1.47 [0.79, 2.76] |
| 29 Pyrexia Show forest plot | 2 | 215 | Risk Ratio (M‐H, Random, 95% CI) | 2.24 [0.88, 5.71] |
| 30 Respiratory failure Show forest plot | 1 | 1110 | Risk Ratio (M‐H, Random, 95% CI) | 1.92 [0.82, 4.50] |
| 31 Sepsis Show forest plot | 1 | 1110 | Risk Ratio (M‐H, Random, 95% CI) | 3.42 [0.95, 12.35] |
| 32 Stomatitis Show forest plot | 1 | 130 | Risk Ratio (M‐H, Random, 95% CI) | 3.09 [0.13, 74.54] |
| 33 Syncope Show forest plot | 1 | 85 | Risk Ratio (M‐H, Random, 95% CI) | 3.58 [0.79, 16.27] |
| 34 Vomiting Show forest plot | 3 | 1325 | Risk Ratio (M‐H, Random, 95% CI) | 0.98 [0.69, 1.40] |
| 35 Anaemia Show forest plot | 4 | 1970 | Risk Ratio (M‐H, Random, 95% CI) | 0.93 [0.75, 1.17] |
| 36 Febrile neutropenia Show forest plot | 2 | 1755 | Risk Ratio (M‐H, Random, 95% CI) | 1.40 [1.10, 1.77] |
| 37 Leukopenia Show forest plot | 2 | 1755 | Risk Ratio (M‐H, Random, 95% CI) | 1.36 [1.17, 1.58] |
| 38 Thrombocytopenia Show forest plot | 3 | 860 | Risk Ratio (M‐H, Random, 95% CI) | 1.26 [0.96, 1.66] |
| 39 Neutropenia Show forest plot | 3 | 1885 | Risk Ratio (M‐H, Random, 95% CI) | 1.05 [0.97, 1.15] |