Té verde y té negro para la prevención primaria de las enfermedades cardiovasculares
References
References to studies included in this review
References to studies excluded from this review
References to studies awaiting assessment
References to ongoing studies
Additional references
Characteristics of studies
Characteristics of included studies [ordered by study ID]
| Methods | RCT of parallel group design | |
| Participants | 87 healthy adults of either sex, aged 25‐60 years were enrolled. Inclusion criteria: non‐smoker or former smokers who had stopped for less than 6 months. alcohol intake of less than 2 standard drinks/day, postmenopausal women not receiving hormone replacement therapy and ejection fraction greater than 40%. Country of publication was Mauritius. | |
| Interventions | Participants were required to consume 3 x 200 mL of black tea a day for 12 weeks. Those in the control group consumed the equivalent volume of hot water for 12 weeks. Follow‐up period was at the end of the intervention period of 12 weeks. | |
| Outcomes | Triglycerides, total cholesterol, LDL‐cholesterol, HDL‐cholesterol. | |
| Notes | This study was a post‐hoc analysis of a subgroup of patients used in a previous study that recruited both patients with Ischaemic heart disease and healthy participants. As such, it has unequal randomisation to intervention and control groups and has a high potential for bias. | |
| Risk of bias | ||
| Bias | Authors' judgement | Support for judgement |
| Random sequence generation (selection bias) | Low risk | A random generator was used by a statistician and randomisation was in a 7:3 ratio. However, this is a post‐hoc analysis of only the healthy participants and the methods of randomisation apply to all participants of the study which will include those with Ischaemic heart disease. Therefore, the number of healthy participants randomised to each group was unequal, with more participants randomised to the intervention group than to the control. |
| Allocation concealment (selection bias) | Unclear risk | Method of allocation concealment not stated |
| Blinding of participants and personnel (performance bias) | Unclear risk | Not stated |
| Blinding of outcome assessment (detection bias) | Unclear risk | Not stated |
| Incomplete outcome data (attrition bias) | High risk | No ITT analysis. Reasons for attrition not reported sufficiently. |
| Selective reporting (reporting bias) | Low risk | All outcomes stated are reported |
| Other bias | High risk | Post‐hoc analysis of a previous study that included patients with Ischaemic heart disease. Randomisation not equal between groups and no rationale for the randomisation ratio of 7:3 was given. |
| Methods | Please see information provided above | |
| Participants | ||
| Interventions | ||
| Outcomes | ||
| Notes | ||
| Risk of bias | ||
| Bias | Authors' judgement | Support for judgement |
| Random sequence generation (selection bias) | Low risk | A random generator was used by a statistician and randomisation was in a 7:3 ratio. However, this is a post‐hoc analysis of only the healthy participants and the methods of randomisation apply to all participants of the study which will include those with Ischaemic heart disease. Therefore, the number of healthy participants randomised to each group was unequal, with more participants randomised to the intervention group than to the control. |
| Allocation concealment (selection bias) | Unclear risk | Method of allocation concealment not stated |
| Blinding of participants and personnel (performance bias) | Unclear risk | Not stated |
| Blinding of outcome assessment (detection bias) | Unclear risk | Not stated |
| Incomplete outcome data (attrition bias) | High risk | No ITT analysis. Reasons for attrition not reported sufficiently. |
| Selective reporting (reporting bias) | Low risk | All outcomes stated are reported |
| Other bias | High risk | Post‐hoc analysis of a previous study that included patients with Ischaemic heart disease. Randomisation not equal between groups and no rationale for the randomisation ratio of 7:3 was given. |
| Methods | RCT of parallel group design | |
| Participants | 56 obese adults of either sex, aged 30‐60 years with hypertension were enrolled. Exclusion criteria: those with secondary hypertension and/or secondary obesity, diabetes, history of coronary artery disease, stroke, congestive heart failure, malignancy, history of use of any dietary supplements within three months before the study, current need for modification of antihypertensive therapy, abnormal liver, kidney or thyroid gland function, clinically significant inflammatory process within respiratory, digestive or genitourinary tract, or in the oral cavity, pharynx, or paranasal sinuses, history of infection in the month before the study, nicotine or alcohol abuse and/or any other condition that would make participation not in the best interest of the subject or could prevent, limit or confound the efficacy assessment. Country of publication was Poland. | |
| Interventions | Participants were required to consume 1 capsule of green tea extract or a placebo with a morning meal for 3 months. Each green tea capsule contained 379 mg of green tea extract. The placebo capsule contained pure microcrystalline cellulose. Follow‐up period was at the end of the intervention period of 3 months. | |
| Outcomes | Blood pressure, total cholesterol, LDL‐cholesterol, HDL‐cholesterol, triglycerides | |
| Notes | ||
| Risk of bias | ||
| Bias | Authors' judgement | Support for judgement |
| Random sequence generation (selection bias) | Unclear risk | Not stated |
| Allocation concealment (selection bias) | Low risk | Used an independent statistician |
| Blinding of participants and personnel (performance bias) | Low risk | States double‐blind and placebo‐controlled |
| Blinding of outcome assessment (detection bias) | Unclear risk | States double‐blind but provides no details |
| Incomplete outcome data (attrition bias) | Unclear risk | No information provided |
| Selective reporting (reporting bias) | Low risk | All expected outcomes were reported |
| Other bias | Unclear risk | Insufficient information to judge |
| Methods | RCT of parallel group design | |
| Participants | 50 adults of either sex, aged 40‐70 years with borderline hypercholesterolaemia were enrolled in the study. Exclusion criteria: those under treatment of serious cardiac, renal, or hepatic diseases; those with history of gastrectomy, enterectomy, other gastrointestinal surgery, or hypothyroidism; those with alcohol abuse, insulin‐dependent diabetes or secondary causes of hyperglycaemia, pancreatitis, or serious hypertension. Country of publication was Japan. | |
| Interventions | Participants were required to consume 2 black tea extract (BTE) tablets or placebo tablets, 3 times daily before meals for 3 months. Each BTE tablet (250 mg) contained 166.5 mg BTE (66.6%) and various bulking agents, including sugar alcohol (12.4%), cellulose (10%), polysaccharide (2%), lubricating and glossing agents (5%) and other excipients (4%). This meant that participants ingested a total of 1 g/day of BTE. The placebo tablets contained dextrin (66.6%) instead of BTE. Study was conducted between June 2006 and October 2006. Follow‐up period was at the end of the intervention period of 3 months. | |
| Outcomes | Total cholesterol, LDL‐cholesterol, HDL‐cholesterol, triglycerides | |
| Notes | BTE tablets were circular and placebo tablets were square. Adverse effects were monitored, however, none were reported. | |
| Risk of bias | ||
| Bias | Authors' judgement | Support for judgement |
| Random sequence generation (selection bias) | Unclear risk | Not stated |
| Allocation concealment (selection bias) | Unclear risk | Not stated |
| Blinding of participants and personnel (performance bias) | Low risk | States double‐blind and placebo‐controlled |
| Blinding of outcome assessment (detection bias) | Unclear risk | States double‐blind but provides no details |
| Incomplete outcome data (attrition bias) | Low risk | Reasons for exclusions provided |
| Selective reporting (reporting bias) | Unclear risk | Insufficient information to judge |
| Other bias | Unclear risk | Insufficient information to judge |
| Methods | RCT of parallel group design | |
| Participants | 111 healthy men and women, aged 35 to 75 years were recruited from the general population and randomised to two arms ‐ black tea (56 participants) and placebo (55 participants). Inclusion criteria: taking up to three antihypertensive medications. Any change in regular medication with the potential to influence vascular health resulted in withdrawal of the participant from the study. Baseline status within the black tea group, based on 46 participants: mean age 56.9; 33% male, 20% taking antihypertensive medication. Baseline status within the placebo group, based on 49 participants: mean age 56.3, 37% male, 29% taking antihypertensive medication. Country of publication was Australia. | |
| Interventions | Participants consumed 3 cups/day of 1493 mg powdered black tea solids containing 429 mg of polyphenols and 96 mg of caffeine for 6 months, or placebo, 3 cups/day which was matched in flavour and caffeine content, containing no tea solids. Follow‐up period was at the end of the intervention period of 6 months. | |
| Outcomes | Blood Pressure (systolic and diastolic) | |
| Notes | Participants were regular tea drinkers | |
| Risk of bias | ||
| Bias | Authors' judgement | Support for judgement |
| Random sequence generation (selection bias) | Low risk | Used computer‐generated random numbers. |
| Allocation concealment (selection bias) | Low risk | Randomisation codes sealed in envelopes, produced independent of study researchers. Envelopes opened in consecutive order as participants entered into the study. |
| Blinding of participants and personnel (performance bias) | Low risk | States placebo‐controlled and double‐blind. |
| Blinding of outcome assessment (detection bias) | Low risk | Analysis performed by biostatistician blinded to treatment allocation. |
| Incomplete outcome data (attrition bias) | Low risk | Used ITT analysis. |
| Selective reporting (reporting bias) | Unclear risk | Insufficient information to judge |
| Other bias | Unclear risk | Insufficient information to judge |
| Methods | RCT of parallel group design | |
| Participants | 56 healthy women aged 25‐75 years were randomised to two arms ‐green tea extract (29 participants) and placebo (27 participants). Inclusion criteria:Facial Glogau Photoaging scale II or III and Fitzpatrick skin type I to III. Exclusion criteria: Used systemic retinoids within 6 weeks before the start of the study, had active facial dermatological conditions that might interfere with photo‐aging assessments, history of cosmetic procedure to the face such as laser treatment, chemical peel and facelifts. Country of publication was the U.S.A. | |
| Interventions | Participants were required to consume 1 capsule twice daily containing green tea extract or placebo for two years. Each active study capsule contained 250 mg of polyphenols (70%) of which were catechins. The capsules were 99.5% caffeine‐free. The placebo capsule were identical in appearance to the active capsule. Follow‐up period was at the end of the intervention period of 2 years. | |
| Outcomes | Adverse events | |
| Notes | ||
| Risk of bias | ||
| Bias | Authors' judgement | Support for judgement |
| Random sequence generation (selection bias) | Low risk | Computer‐generated |
| Allocation concealment (selection bias) | Unclear risk | Not stated |
| Blinding of participants and personnel (performance bias) | Low risk | Double‐blind and placebo‐controlled |
| Blinding of outcome assessment (detection bias) | Unclear risk | Double‐blind but provides no details |
| Incomplete outcome data (attrition bias) | High risk | No ITT analysis and 37.9 % of tea group and 37% of placebo group dropped out of study |
| Selective reporting (reporting bias) | Low risk | All expected outcomes reported |
| Other bias | Unclear risk | Insufficient information to judge |
| Methods | RCT of parallel group design | |
| Participants | 240 adults (100 males, 140 females) with mild to moderate hypercholesterolaemia and on a low‐fat diet were recruited from outpatient clinics in 6 urban hospitals in China. Participants were randomised to 2 arms ‐ tea extract (120 participants, 44.2% male, mean age 54.4) and placebo (120 participants, 39.2% male, mean age 55.0). Exclusion criteria: a baseline triglyceride level of 350 mg/dL or greater (4.0 mmol/L), having uncontrolled hypertension (160/95 mmHg), active pulmonary, hematologic, hepatic, gastrointestinal or renal disease, premalignant or malignant disease, diabetes, thyroid dysfunction, a history of coronary heart disease or other atherosclerotic disease, or any pathological values among routine clinical chemistry or hematological parameters having consumed greater than 32% of daily energy from fat or had a body mass index of 35 or higher, taking any lipid‐lowering medications or drugs that might interfere with lipid metabolism, taking cardiac or other vasoactive medications including antihypertensive drugs, thyroid hormones, oral contraceptives, cyclic hormone replacement therapy, dietary supplements (e.g., fish oils, niacin at doses 400 mg/d, or dietary fibre supplements), or antioxidants, and they were prohibited from taking these medications during the course of the study. Country of publication was China. | |
| Interventions | Participants were required to consume 1 capsule containing a theaflavin‐enriched green tea extract or placebo, each morning, for 12 weeks (June 7th 2001 to October 18th 2001). Each active study capsule contained 75 mg of theaflavins, 150 mg of green tea catechins, and 150 mg of other tea polyphenols.The placebo capsules were made from inert ingredients and were identical to the theaflavin‐enriched green tea extract capsules in weight, appearance, and odour. Follow‐up period was at the end of the intervention period of 12 weeks. | |
| Outcomes | Total cholesterol, LDL‐cholesterol, HDL‐cholesterol, triglycerides, adverse effects. | |
| Notes | Authors were contacted for extra information on lipid levels. Authors responded. | |
| Risk of bias | ||
| Bias | Authors' judgement | Support for judgement |
| Random sequence generation (selection bias) | Unclear risk | Not stated, only states stratified by hospital |
| Allocation concealment (selection bias) | Unclear risk | Not stated |
| Blinding of participants and personnel (performance bias) | Low risk | Double‐blind and placebo‐controlled |
| Blinding of outcome assessment (detection bias) | Unclear risk | Double‐blind but provides no details |
| Incomplete outcome data (attrition bias) | High risk | No ITT analysis. Reasons for attrition not reported sufficiently. 95% and 88% of participants completed the study in intervention and control groups respectively |
| Selective reporting (reporting bias) | Low risk | All expected outcomes were reported |
| Other bias | Unclear risk | Insufficient information to judge |
| Methods | RCT of parallel group design | |
| Participants | 31 community‐dwelling adults aged 55 years and older with either diabetes (21% in tea group and 7% in control group) or 2 other cardiovascular risk factors (hypertension, current smoking, LDL cholesterol >=130 mg/dL, high‐density lipoprotein cholesterol > 40 mg/dL, or family history of premature coronary heart disease) were randomised to 2 arms ‐ black tea extract (16 participants, mean age 66.6 years, 79% on statins at baseline) and control (15 participants, mean age 64.9 years, 57% on statins at baseline). Exclusion criteria: established cardiovascular disease (congestive heart failure; myocardial infarction; coronary, carotid, or peripheral arterial revascularisation procedure; stroke; angina; or intermittent claudication), contraindications to MRI (severe claustrophobia, intolerance to previous MRI examinations, pacemaker, intraauricular implants, or intracranial clips), atrial fibrillation (due to requirement for gated MRI images), severe illness expected to cause death or disability within 6 months; blood pressure >=180/110 mm Hg; serum creatinine >2.5 mg/dL or dialysis; history of hyponatraemia; use of vitamin supplements greater than the recommended daily allowance; inability to speak English; and lack of a working telephone. Country of publication was the U.S.A. | |
| Interventions | Intervention group: Dehydrated soluble black tea powder was provided to participants in unit‐dose containers. Each container included 2.0 g of powder, and 3 containers (representing a single‐day supply) were bagged together. The catechin content of the tea was 106 ± 7 mg per serving (i.e. 318 mg/d) of catechin equivalents. No restrictions were made on addition of milk or sweeteners, reconstitution with hot or cold water, or time of day of consumption. The control group consumed 3 glasses of water daily and dietary restrictions were consumption of non‐study tea (green, oolong, or black). Follow‐up period was at the end of the intervention period of 6 months. | |
| Outcomes | HDL‐cholesterol, LDL‐cholesterol, triglycerides, adverse effects. | |
| Notes | Authors contacted for extra information on blood pressure. Authors responded. | |
| Risk of bias | ||
| Bias | Authors' judgement | Support for judgement |
| Random sequence generation (selection bias) | Low risk | Used random permuted blocks of sizes 2 and 4 |
| Allocation concealment (selection bias) | Low risk | Used opaque, sealed, sequentially numbered envelopes in a locked, off‐site location |
| Blinding of participants and personnel (performance bias) | High risk | Participants knew whether they were in the intervention or control group as they were asked to drink tea or water |
| Blinding of outcome assessment (detection bias) | Low risk | All measurements performed by technicians or investigators blinded to treatment assignment |
| Incomplete outcome data (attrition bias) | Low risk | ITT analysis used and attrition and exclusions were reported with reasons |
| Selective reporting (reporting bias) | Unclear risk | Insufficient information to judge |
| Other bias | Unclear risk | Insufficient information to judge |
| Methods | RCT of parallel group design | |
| Participants | 124 healthy adults recruited from University of Florida and Gainsville community (52 males, 72 females), mean age 29. Participants were randomised to 2 arms ‐ Camellia Sinensis capsules (61) and placebo (63). Exclusion criteria: vegetarian diet, chemotherapy or other immune suppressing therapy within the previous year, chronic antibiotics or other infectious disease prophylactic, chronic or current illness, surgery within the previous year, and pregnancy and/or lactation, those who daily consumed greater than one cup (250 mL) of tea, an average of seven or more servings of fruits and vegetables, and herbal supplements and vitamins other than a multivitamin or vitamin D. Country of publication was the U.S.A. | |
| Interventions | Participants were required to consume either 1 Camellia sinensis composition (CSC) capsule or 1 placebo capsule (PBO), twice daily (1 in the morning and 1 in the evening, preferably with meals) for 3 months. CSC capsules contained 100 mg of L‐theanine and 200 mg of a decaffeinated catechin green tea extract. PBO capsules contained microcrystalline cellulose, dextrose, dicalcium phosphate, magnesium stearate, silicon dioxide, and FD&C red #40, yellow #6, and blue #1. PBO capsules were identical in appearance to the CSC capsules. Follow‐up was at the end of the intervention period of 3 months (90 days). | |
| Outcomes | Blood pressure (systolic and diastolic), adverse effects | |
| Notes | No participant started any new medication during the study | |
| Risk of bias | ||
| Bias | Authors' judgement | Support for judgement |
| Random sequence generation (selection bias) | Low risk | Drawing coloured marbles to allocate to intervention or control group |
| Allocation concealment (selection bias) | Unclear risk | Not stated |
| Blinding of participants and personnel (performance bias) | Low risk | States double‐blind and placebo‐controlled. Particpants and investigators were blinded to treatment allocation |
| Blinding of outcome assessment (detection bias) | Unclear risk | States double‐blind but provides no details |
| Incomplete outcome data (attrition bias) | Low risk | Withdrawals and exclusions were clearly reported |
| Selective reporting (reporting bias) | Unclear risk | Insufficient information to judge |
| Other bias | Unclear risk | Insufficient information to judge |
| Methods | RCT of parallel group design | |
| Participants | Postmenopausal women were recruited through flyers, local TV, radios, newspaper, municipal community centres and clinics. 171 women were randomised into 4 arms ‐ placebo; green tea polyphenols; placebo + tai chi; and green tea polyphenols + tai chi. Inclusion criteria were postmenopausal women (at least 2 years after menopause) with osteopenia; normal function of thyroid, liver and kidney; serum alkaline phosphatase, calcium and inorganic phosphorus within normal ranges; and serum 25‐hydroxy vitamin D (25(OH)D) ≥ 20 ng/mL. Exclusion criteria: participants with a disease condition or those on medication known to affect bone metabolism; a history of cancer except for treated superficial basal or squamous cell carcinoma of the skin; uncontrolled intercurrent illness or physical condition that would be a contraindication to exercise; depression; cognitive impairment; or those unwilling to accept randomisation. | |
| Interventions | Green tea polyphenols (GTP) group: GTP 500 mg daily. The main GTP components were 46.5% of epigallocatechin‐3‐gallate (EGCG), 21.25% of epigallocatechin (ECG), 10% of epicatechin (EC), 7.5% of epicatechin‐3‐gallate (EGC), 9.5% of gallocatechin gallate (GCG), and 4.5% of catechin. Placebo group: medicinal starch 500 mg daily. The daily dose of GTP or placebo material was divided into two capsules (250 mg each). During the 24‐week intervention, all participants were provided with 500 mg elemental calcium and 200 IU vitamin D (as cholecalciferol) daily. Follow‐up period was at the end of the intervention period of 24 weeks. | |
| Outcomes | Quality of life (8 domains), adverse effects. | |
| Notes | Data only used from two arms: placebo, green tea polyphenol. The reported adverse effects were judged by the safety monitoring team as unlikely to be related to the study protocol. | |
| Risk of bias | ||
| Bias | Authors' judgement | Support for judgement |
| Random sequence generation (selection bias) | Unclear risk | Insufficient information to judge |
| Allocation concealment (selection bias) | Unclear risk | Not stated |
| Blinding of participants and personnel (performance bias) | Low risk | Participants and investigators responsible for day‐to‐day operation and data analyses were blinded to the intervention and placebo groups |
| Blinding of outcome assessment (detection bias) | Low risk | Participants and investigators responsible for day‐to‐day operation and data analyses were blinded to the intervention and placebo groups |
| Incomplete outcome data (attrition bias) | Unclear risk | ITT analysis performed but no reasons reported for loss to follow‐up |
| Selective reporting (reporting bias) | Low risk | All expected outcomes reported |
| Other bias | Unclear risk | Insufficient information to judge |
| Methods | RCT | |
| Participants | Women who volunteered to participate. 27 sedentary women classified as "overweight" were randomised into 4 arms ‐ exercise and active supplement; exercise and placebo; placebo; active supplement. Inclusion criteria were women aged 18‐45 years; < 30 min physical activity per week. Exclusion criteria: those with a history of hypertension or metabolic, renal, hepatic, musculoskeletal, autoimmune, or neurological disease; used any medication that might have significantly affected the study outcome; used nutritional supplements, other than a multivitamin, that might have affected metabolism and/or muscle mass within the four weeks prior to the start of the study. 7 participants were randomised to receive the active supplement (Green tea extract) (mean age 27.86) and 5 participants were randomised to the placebo (mean age 28.40). Country of publication was the U.S.A. | |
| Interventions | Active Supplement group: Drink consisted of 10 kcal, B6 and B12, blend of taurine, guarana extract, green tea leaf extract (EGCG), caffeine, glucuronolactone and ginger extract. Placebo group: consisted of the same calorie and vitamin content as active supplement. 1 drink a day with time of beverage consumption left to subjects discretion. all beverages were labelled identically and matched for taste and colour. | |
| Outcomes | Total cholesterol, LDL‐cholesterol, HDL‐cholesterol, triglycerides, blood pressure (systolic and diastolic) | |
| Notes | Data only used from 2 arms: placebo and active supplementation group. | |
| Risk of bias | ||
| Bias | Authors' judgement | Support for judgement |
| Random sequence generation (selection bias) | Unclear risk | Not stated |
| Allocation concealment (selection bias) | Unclear risk | Not stated |
| Blinding of participants and personnel (performance bias) | Low risk | States double‐blind and placebo controlled |
| Blinding of outcome assessment (detection bias) | Unclear risk | States double‐ blind but provides no details |
| Incomplete outcome data (attrition bias) | Unclear risk | No ITT analysis used and no loss to follow‐up reported |
| Selective reporting (reporting bias) | Low risk | All expected outcomes reported |
| Other bias | Unclear risk | Insufficient information to judge |
| Methods | RCT | |
| Participants | Women who volunteered to participate. 54 overweight breast cancer survivors were randomised into two arms ‐ green tea or placebo. Inclusion criteria: BMI between 25‐40 kg m‐2, received chemotherapy for treatment of invasive breast cancer, aged 18‐80 years, reported no current tobacco use and have no chronic illnesses. Participants had to be willing to refrain from all weight loss diets and supplements for a study period of six months. Twenty‐nine participants were randomised to receive green tea (mean age 56.6) and twenty five participants were randomised to the placebo group (mean age 57.8). Country of publication was the U.S.A. | |
| Interventions | Green tea group: Consumed green tea. Green tea bags comprising of 550‐700 mg tea solids, providing an average catechin dose of 58.91 mg and 32.21 mg of EGCG per bag. Participants were to consume 960 mL green tea daily. Individiual tea bags were placed in a provided tea mug with 240 mL of boiling water and allowed to steep for 3 minutes. Green tea was to be consumed four times a day and up to two doses were allowed at any single dosing. Placebo group:Citrus‐based herbal tea that contained no EGCG. Follow‐up period was six months. | |
| Outcomes | Total cholesterol, LDL‐cholesterol, HDL‐cholesterol, triglycerides. | |
| Notes | ||
| Risk of bias | ||
| Bias | Authors' judgement | Support for judgement |
| Random sequence generation (selection bias) | Low risk | Used a table of random numbers |
| Allocation concealment (selection bias) | Low risk | Allocation done by someone independent of study |
| Blinding of participants and personnel (performance bias) | Low risk | States double‐blind and placebo controlled |
| Blinding of outcome assessment (detection bias) | Unclear risk | States double‐blind but does not provide details |
| Incomplete outcome data (attrition bias) | High risk | No ITT analysis and 36% of participants in the control group and 20% of participants in the intervention group were lost to follow‐up |
| Selective reporting (reporting bias) | Low risk | All expected outcomes reported |
| Other bias | Unclear risk | Insufficient information to judge |
BMI: body mass index
HDL: high‐density lipoprotein
ITT: intention‐to‐treat
LDL: low‐density lipoprotein
MRI: magnetic resonance imaging
RCT: randomised controlled trial
Characteristics of excluded studies [ordered by study ID]
| Study | Reason for exclusion |
| Short‐term trial (follow‐up period was 120 minutes) | |
| Short‐term trial (follow‐up period was 2 weeks) | |
| Short‐term trial (follow‐up period was 6 hours) | |
| Study focused on weight loss | |
| Short‐term trial (follow‐up period was 8 weeks) | |
| Short‐term trial (follow‐up period was 8 weeks) | |
| Short‐term trial (follow‐up period was 8 weeks) | |
| Short‐term trial (follow‐up period was 4 hours) | |
| Short‐term trial (follow‐up period was 4 weeks) | |
| Short‐term trial (follow‐up period was 6 weeks) | |
| Short‐term trial (follow‐up period was 3 weeks) | |
| Short‐term trial (follow‐up period was 4 weeks) | |
| Study focused on weight loss | |
| Short‐term trial (follow‐up period was 21 days) | |
| Short‐term trial (follow‐up period was 42 days) | |
| Short‐term trial (follow‐up period was 6 weeks) | |
| Short‐term trial (follow‐up period was 3 weeks) | |
| Short‐term trial (follow‐up period was 4 weeks) | |
| Study focused on weight loss | |
| Short‐term trial (follow‐up period was 1 week) | |
| No outcomes of interest | |
| Short‐term trial (follow‐up was 2 hours duration) | |
| Short‐term trial (follow‐up period was 7 days) | |
| No outcomes of interest | |
| No outcomes of interest | |
| Short‐term trial (follow‐up period was 4 weeks) | |
| Short‐term trial (follow‐up period 7days or 4 weeks) | |
| Short‐term trial (follow‐up period 4hrs) | |
| Short‐term trial (follow‐up period was 4 weeks) | |
| Short‐term trial (follow‐up period was 4 weeks) | |
| Short‐term trial (follow‐up period was 4 weeks) | |
| Short‐term trial (follow‐up period 8 weeks) | |
| Short‐term trial (follow‐up period 90 minutes) | |
| Study focused on weight loss | |
| Short‐term trial (follow‐up period was 2 hours) | |
| Short‐term trial (follow‐up period was 8 weeks) | |
| Short‐term trial (follow‐up period was 4 weeks) | |
| Short‐term trial (follow‐up period was 60 minutes) | |
| Short‐term trials (follow‐up periods were between 60‐105 minutes) | |
| Short‐term trial (follow‐up period was 2 weeks) | |
| More than 25% of patients had T2D | |
| Short‐term trial (follow‐up period was 7 hours) | |
| Study focused on weight loss | |
| Short‐term trial (follow‐up period was 6 weeks) | |
| Study focused on weight loss | |
| Study focused on weight loss | |
| Short‐term trial (follow‐up period was 11 weeks) | |
| Short‐term trial (follow‐up period was 6 hours) | |
| Short‐term trial (follow‐up period was 3 hours) | |
| Study focused on weight loss | |
| Short‐term trial (follow‐up period was 2 months) | |
| Study focused on weight loss | |
| Short‐term trial (follow‐up period was 1 week) |
T2D: type 2 diabetes
Characteristics of studies awaiting assessment [ordered by study ID]
| Methods | Article written in Chinese with no English abstract ‐ awaiting translation. |
| Participants | |
| Interventions | |
| Outcomes | |
| Notes |
| Methods | Article written in Chinese with no English abstract ‐ awaiting translation. |
| Participants | |
| Interventions | |
| Outcomes | |
| Notes |
Characteristics of ongoing studies [ordered by study ID]
| Trial name or title | A randomised, double‐blind, placebo‐controlled study of effect of green tea on lifestyle‐related disease prevention |
| Methods | Parallel randomised |
| Participants | Inclusion criteria: Is over 30 years old and under 75 years old and meets at least one of the followings; Exclusion criteria: 1) Individuals with a medical record of heart failure or cardiac infarction. Age minimum: 30 years‐old Health conditions: metabolic syndrome |
| Interventions | Ten capsules of green tea powder, three times a day (6 g/day), for 12 weeks. |
| Outcomes | Primary 1) body weight Secondary 1) Blood pressure, fat percentage, waist, BMI |
| Starting date | Date of first enrolment: 2009/02/01 |
| Contact information | Mitsuhiro Yamada Address: 9‐28, Goshohara, Kakegawa, Shizuoka, Japan Email: [email protected] |
| Notes |
BMI: body mass index
FBS: fasting blood sugar
HDL: high‐density lipoprotein
LDL: low‐density lipoprotein
TNF: tumour necrosis factor
Data and analyses
| Outcome or subgroup title | No. of studies | No. of participants | Statistical method | Effect size |
| 1 LDL‐Cholesterol Show forest plot | 4 | 147 | Mean Difference (IV, Random, 95% CI) | ‐0.43 [‐0.56, ‐0.31] |
| Analysis 1.1 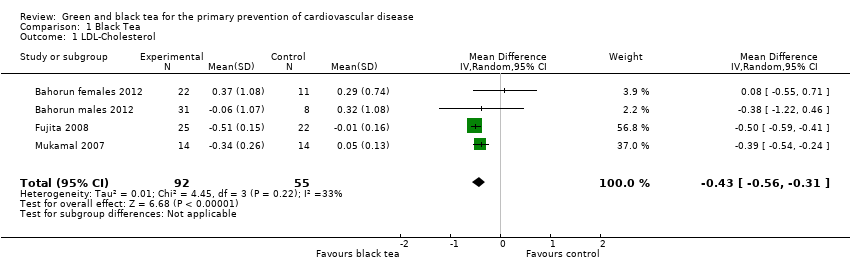 Comparison 1 Black Tea, Outcome 1 LDL‐Cholesterol. | ||||
| 2 HDL‐Cholesterol Show forest plot | 4 | 146 | Mean Difference (IV, Random, 95% CI) | ‐0.01 [‐0.06, 0.04] |
| Analysis 1.2 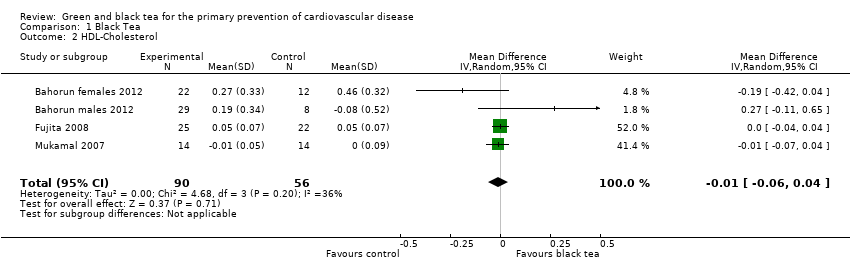 Comparison 1 Black Tea, Outcome 2 HDL‐Cholesterol. | ||||
| 3 Triglycerides Show forest plot | 4 | Mean Difference (IV, Random, 95% CI) | Totals not selected | |
| Analysis 1.3  Comparison 1 Black Tea, Outcome 3 Triglycerides. | ||||
| 4 Total Cholesterol Show forest plot | 3 | Mean Difference (IV, Fixed, 95% CI) | Totals not selected | |
| Analysis 1.4  Comparison 1 Black Tea, Outcome 4 Total Cholesterol. | ||||
| 5 Systolic blood pressure Show forest plot | 2 | 123 | Mean Difference (IV, Fixed, 95% CI) | ‐1.85 [‐3.21, ‐0.48] |
| Analysis 1.5  Comparison 1 Black Tea, Outcome 5 Systolic blood pressure. | ||||
| 6 Diastolic blood pressure Show forest plot | 2 | 123 | Mean Difference (IV, Fixed, 95% CI) | ‐1.27 [‐3.06, 0.53] |
| Analysis 1.6 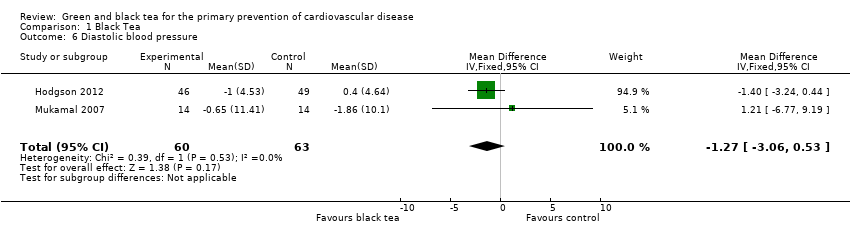 Comparison 1 Black Tea, Outcome 6 Diastolic blood pressure. | ||||
| Outcome or subgroup title | No. of studies | No. of participants | Statistical method | Effect size |
| 1 Total Cholesterol Show forest plot | 4 | 327 | Mean Difference (IV, Fixed, 95% CI) | ‐0.62 [‐0.77, ‐0.46] |
| Analysis 2.1  Comparison 2 Green Tea, Outcome 1 Total Cholesterol. | ||||
| 2 LDL Cholesterol Show forest plot | 4 | 327 | Mean Difference (IV, Fixed, 95% CI) | ‐0.64 [‐0.77, ‐0.52] |
| Analysis 2.2  Comparison 2 Green Tea, Outcome 2 LDL Cholesterol. | ||||
| 3 Triglycerides Show forest plot | 4 | 327 | Mean Difference (IV, Fixed, 95% CI) | ‐0.08 [‐0.24, 0.07] |
| Analysis 2.3  Comparison 2 Green Tea, Outcome 3 Triglycerides. | ||||
| 4 HDL‐Cholesterol Show forest plot | 4 | 327 | Mean Difference (IV, Random, 95% CI) | 0.01 [‐0.08, 0.11] |
| Analysis 2.4 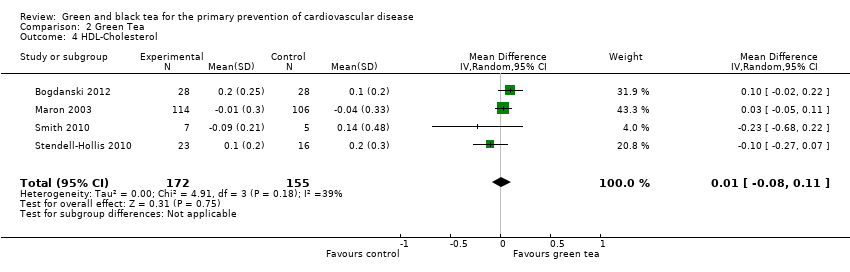 Comparison 2 Green Tea, Outcome 4 HDL‐Cholesterol. | ||||
| 5 Systolic Blood Pressure Show forest plot | 2 | 167 | Mean Difference (IV, Fixed, 95% CI) | ‐3.18 [‐5.25, ‐1.11] |
| Analysis 2.5 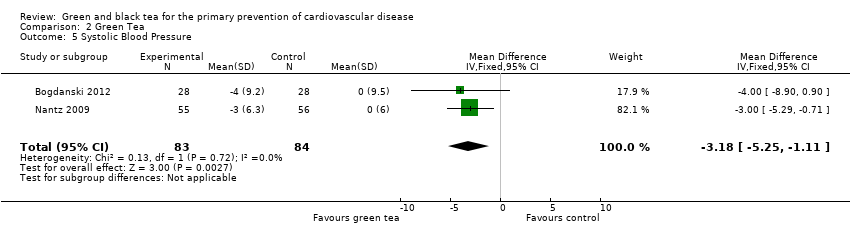 Comparison 2 Green Tea, Outcome 5 Systolic Blood Pressure. | ||||
| 6 Diastolic Blood Pressure Show forest plot | 2 | 167 | Mean Difference (IV, Fixed, 95% CI) | ‐3.42 [‐4.54, ‐2.30] |
| Analysis 2.6 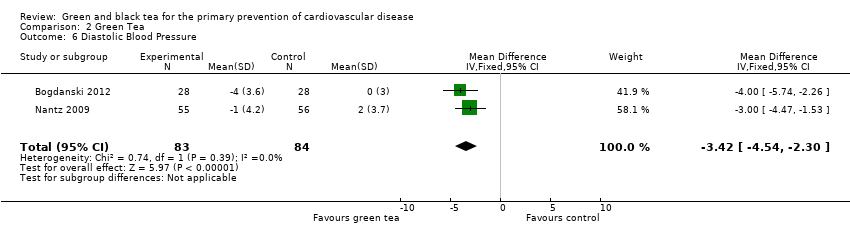 Comparison 2 Green Tea, Outcome 6 Diastolic Blood Pressure. | ||||
| Outcome or subgroup title | No. of studies | No. of participants | Statistical method | Effect size |
| 1 Total Cholesterol Show forest plot | 7 | Mean Difference (IV, Fixed, 95% CI) | Totals not selected | |
| Analysis 3.1 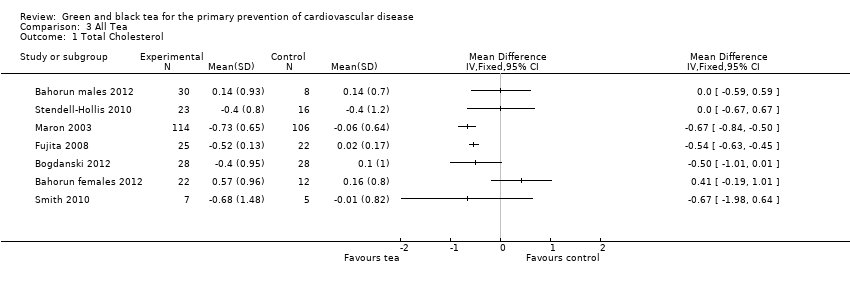 Comparison 3 All Tea, Outcome 1 Total Cholesterol. | ||||
| 2 LDL‐Cholesterol Show forest plot | 8 | 474 | Mean Difference (IV, Random, 95% CI) | ‐0.48 [‐0.61, ‐0.35] |
| Analysis 3.2 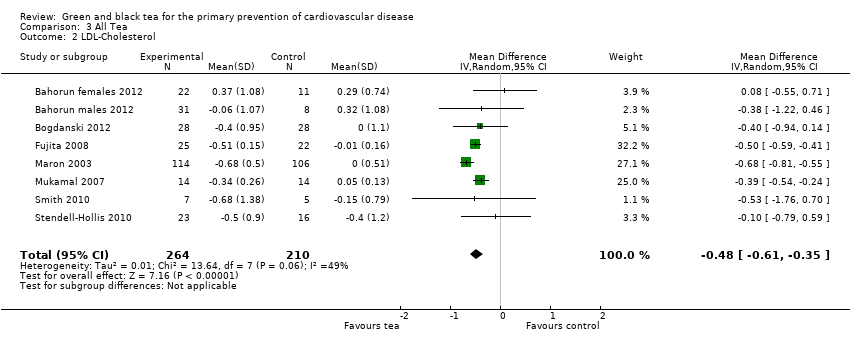 Comparison 3 All Tea, Outcome 2 LDL‐Cholesterol. | ||||
| 3 HDL‐Cholesterol Show forest plot | 8 | 473 | Mean Difference (IV, Random, 95% CI) | 0.00 [‐0.04, 0.04] |
| Analysis 3.3 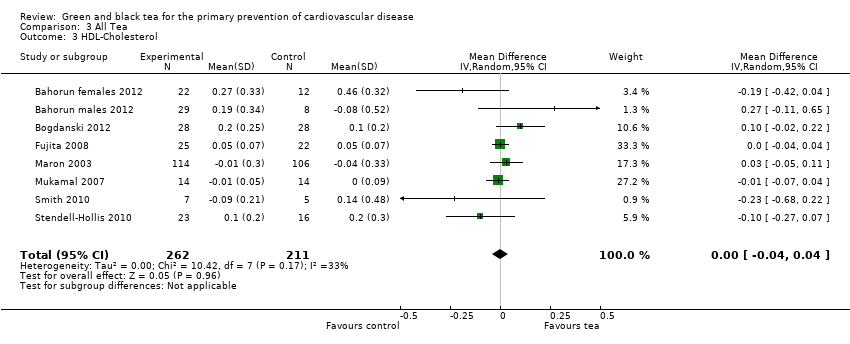 Comparison 3 All Tea, Outcome 3 HDL‐Cholesterol. | ||||
| 4 Triglycerides Show forest plot | 8 | 476 | Mean Difference (IV, Random, 95% CI) | ‐0.06 [‐0.19, 0.06] |
| Analysis 3.4 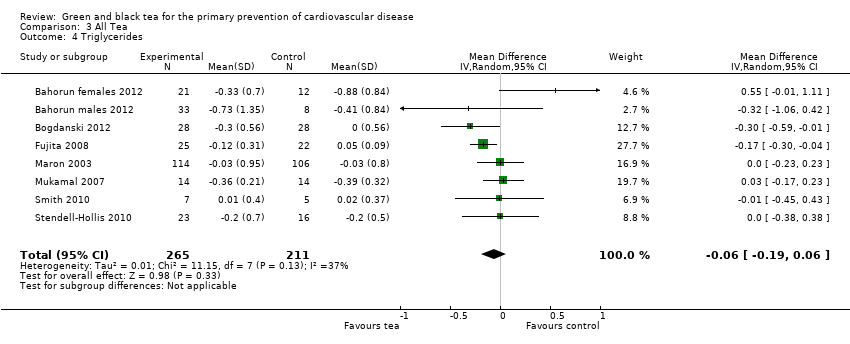 Comparison 3 All Tea, Outcome 4 Triglycerides. | ||||
| 5 Systolic Blood Pressure Show forest plot | 4 | 290 | Mean Difference (IV, Fixed, 95% CI) | ‐2.25 [‐3.39, ‐1.11] |
| Analysis 3.5 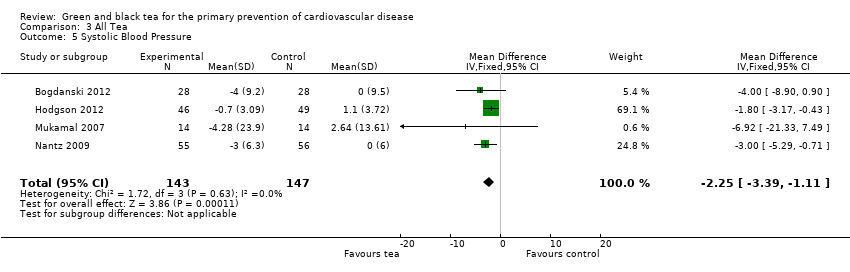 Comparison 3 All Tea, Outcome 5 Systolic Blood Pressure. | ||||
| 6 Diastolic Blood Pressure Show forest plot | 4 | 290 | Mean Difference (IV, Fixed, 95% CI) | ‐2.81 [‐3.77, ‐1.86] |
| Analysis 3.6  Comparison 3 All Tea, Outcome 6 Diastolic Blood Pressure. | ||||

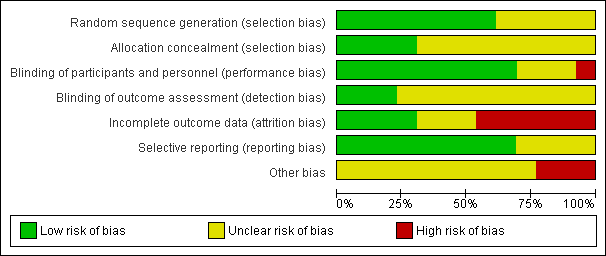
'Risk of bias' graph: review authors' judgements about each risk of bias item presented as percentages across all included studies.
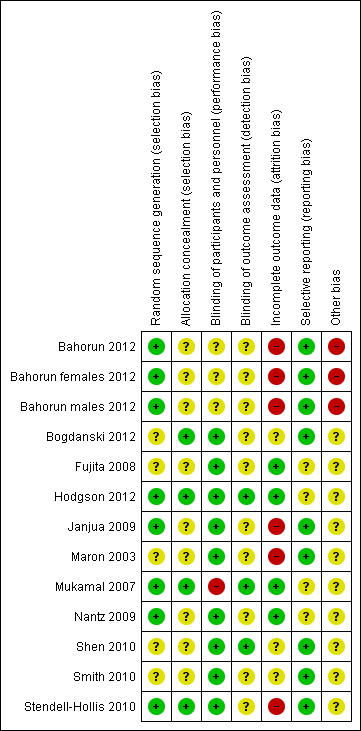
'Risk of bias' summary: review authors' judgements about each risk of bias item for each included study.
Comparison 1 Black Tea, Outcome 1 LDL‐Cholesterol.
Comparison 1 Black Tea, Outcome 2 HDL‐Cholesterol.
Comparison 1 Black Tea, Outcome 3 Triglycerides.
Comparison 1 Black Tea, Outcome 4 Total Cholesterol.
Comparison 1 Black Tea, Outcome 5 Systolic blood pressure.
Comparison 1 Black Tea, Outcome 6 Diastolic blood pressure.
Comparison 2 Green Tea, Outcome 1 Total Cholesterol.
Comparison 2 Green Tea, Outcome 2 LDL Cholesterol.
Comparison 2 Green Tea, Outcome 3 Triglycerides.
Comparison 2 Green Tea, Outcome 4 HDL‐Cholesterol.
Comparison 2 Green Tea, Outcome 5 Systolic Blood Pressure.
Comparison 2 Green Tea, Outcome 6 Diastolic Blood Pressure.
Comparison 3 All Tea, Outcome 1 Total Cholesterol.
Comparison 3 All Tea, Outcome 2 LDL‐Cholesterol.
Comparison 3 All Tea, Outcome 3 HDL‐Cholesterol.
Comparison 3 All Tea, Outcome 4 Triglycerides.
Comparison 3 All Tea, Outcome 5 Systolic Blood Pressure.
Comparison 3 All Tea, Outcome 6 Diastolic Blood Pressure.
| Study | Green/Black or extracts? | Dose | Duration |
| Black and Green tea | 6 g/d | 2 wks | |
| Green tea and Green tea extract | 4 cups/d or 2 capsules and 4 cups of water /d | 8 wks | |
| Green tea and Green tea extract | 4 cups/d or 2 capsules and 4 cups of water /d | 8 wks | |
| Green tea extract | 250 mg/d | 8 wks | |
| Green tea extract | 500 mg | 4 hrs | |
| Black tea | 6 mugs/d | 4 wks | |
| Green tea extract | 530 mg twice a day | 6 wks | |
| Black tea | 5 servings a day | 3 wks | |
| Black tea, Green tea and Green tea extract | 6 cups (150 mL)/day or 6 x 4 capsules/day with 6 x 150 mL of control beverage | 4 wks | |
| Green tea extract | In a beverage consumed once a day | 21 days | |
| Black tea | 5 servings (200 mL)/d | 6 wks | |
| Green tea extract | 6 capsules/d | 3 wks | |
| Green tea extract | 3 g a day | 4 wks | |
| Black tea | 0mg, 100 mg, 200 mg, 400 mg or 800 mg twice a day | 1 wk | |
| Black tea | 450 mL | 2hrs | |
| Black tea | 1250 mL/d | 4 wks | |
| Black or Green tea | 5 cups/d | 7 d | |
| Black tea | 5 cups/d | 4 wks | |
| Green tea extract | 500 mg | 4 wks | |
| Black tea | 5 cups/d (750 mL) | 4 wks | |
| Black tea | > 200 mL twice a day | 8 wks | |
| Green tea | 400ml | 2 hrs | |
| Green tea or Green tea extract | 4 cups a day or 2 capsules and 4 cups of water a day | 8 wks | |
| Black or Green tea | 6 cups/d of Black or Green tea or 3,6g tablet of Green tea polyphenols/day | 4 wks | |
| Black tea | 400 mL | 60 mins | |
| Black tea | 300 mL | 105 mins | |
| Black tea | 5 cups per day | 2 weeks | |
| Black tea | 1 litre | 7 hours | |
| Black tea extract | one capsule/d | 11 wks | |
| Black or Green tea | 6 gm | 3 hrs | |
| Black and Green tea | 1000 mL/d or 250 mL/d | 7 d or 4 wks | |
| Black tea | one cup | 4 hrs | |
| Green tea extract | 1.06 g | 90 mins | |
| Green tea | 2 cups | 42 days | |
| Green tea extract | 400 mg or 800 mg per day | 2 mths | |
| Green tea | 6 g | 120 mins | |
| Black tea | 1 cup | 6 hours | |
| Tea | 10, 224 or 674 mg of tea catechins | 6 hours | |
| Tea | 1069 mg/day of total catechins | 1 wk | |
| Black tea | 4 sachets a day | 6 wks | |
| d:day | |||
| Outcome or subgroup title | No. of studies | No. of participants | Statistical method | Effect size |
| 1 LDL‐Cholesterol Show forest plot | 4 | 147 | Mean Difference (IV, Random, 95% CI) | ‐0.43 [‐0.56, ‐0.31] |
| 2 HDL‐Cholesterol Show forest plot | 4 | 146 | Mean Difference (IV, Random, 95% CI) | ‐0.01 [‐0.06, 0.04] |
| 3 Triglycerides Show forest plot | 4 | Mean Difference (IV, Random, 95% CI) | Totals not selected | |
| 4 Total Cholesterol Show forest plot | 3 | Mean Difference (IV, Fixed, 95% CI) | Totals not selected | |
| 5 Systolic blood pressure Show forest plot | 2 | 123 | Mean Difference (IV, Fixed, 95% CI) | ‐1.85 [‐3.21, ‐0.48] |
| 6 Diastolic blood pressure Show forest plot | 2 | 123 | Mean Difference (IV, Fixed, 95% CI) | ‐1.27 [‐3.06, 0.53] |
| Outcome or subgroup title | No. of studies | No. of participants | Statistical method | Effect size |
| 1 Total Cholesterol Show forest plot | 4 | 327 | Mean Difference (IV, Fixed, 95% CI) | ‐0.62 [‐0.77, ‐0.46] |
| 2 LDL Cholesterol Show forest plot | 4 | 327 | Mean Difference (IV, Fixed, 95% CI) | ‐0.64 [‐0.77, ‐0.52] |
| 3 Triglycerides Show forest plot | 4 | 327 | Mean Difference (IV, Fixed, 95% CI) | ‐0.08 [‐0.24, 0.07] |
| 4 HDL‐Cholesterol Show forest plot | 4 | 327 | Mean Difference (IV, Random, 95% CI) | 0.01 [‐0.08, 0.11] |
| 5 Systolic Blood Pressure Show forest plot | 2 | 167 | Mean Difference (IV, Fixed, 95% CI) | ‐3.18 [‐5.25, ‐1.11] |
| 6 Diastolic Blood Pressure Show forest plot | 2 | 167 | Mean Difference (IV, Fixed, 95% CI) | ‐3.42 [‐4.54, ‐2.30] |
| Outcome or subgroup title | No. of studies | No. of participants | Statistical method | Effect size |
| 1 Total Cholesterol Show forest plot | 7 | Mean Difference (IV, Fixed, 95% CI) | Totals not selected | |
| 2 LDL‐Cholesterol Show forest plot | 8 | 474 | Mean Difference (IV, Random, 95% CI) | ‐0.48 [‐0.61, ‐0.35] |
| 3 HDL‐Cholesterol Show forest plot | 8 | 473 | Mean Difference (IV, Random, 95% CI) | 0.00 [‐0.04, 0.04] |
| 4 Triglycerides Show forest plot | 8 | 476 | Mean Difference (IV, Random, 95% CI) | ‐0.06 [‐0.19, 0.06] |
| 5 Systolic Blood Pressure Show forest plot | 4 | 290 | Mean Difference (IV, Fixed, 95% CI) | ‐2.25 [‐3.39, ‐1.11] |
| 6 Diastolic Blood Pressure Show forest plot | 4 | 290 | Mean Difference (IV, Fixed, 95% CI) | ‐2.81 [‐3.77, ‐1.86] |