Intervenciones de transición de la asistencia social al empleo y efectos sobre la salud mental y física de padres solteros y sus hijos
References
References to studies included in this review
Jump to:
References to studies excluded from this review
Jump to:
Additional references
Jump to:
Characteristics of studies
Characteristics of included studies [ordered by study ID]
Jump to:
| Methods | Randomised controlled trial, follow‐up at 36 months | |
| Participants | Full impact sample (welfare applicants and recipients from 6 counties in California: Alameda, Butte, Los Angeles, Riverside, San Diego, Tulane recruited between 1988 and 1990), N ≥ 33,000; AFDC‐FG sample (single parents with school‐aged children 6 or older), N = approximately 22,770 Survey sample (survey conducted in Alameda, Los Angeles, Riverside, San Diego, Tulane), N = 2242 Average age: AL 34.7 years/BU 33.6 years/LA 38.5 years/RI 33.7 years/SD 33.8 years/TU 34.9 years Ethnicity (%) ‐ Employment status ‐ currently employed (%): AL 11.5/BU 5.9/LA 26.3/RI 6.4/SD 18.4/TU 6.9 Family structure ‐ not reported | |
| Interventions | Compulsory intervention with caseload reduction (CR) ethos and an approach that varied over time and across sites Intervention group: mandatory employment; childcare subsidy; workfare; sanctions; education and training; varied case management Control group: subject to existing welfare programme Further details of intervention components: | |
| Outcomes | Maternal mental health: unhappy, sad or depressed very often or fairly often (%) Maternal physical health: in good or excellent health (%) Economic employment: ever employed since randomisation (36 months) (%); ever employed full‐time since randomisation (%); ever employed part‐time since randomisation (%) Economic income: average weekly earnings since randomisation (USD) Economic insurance: respondent has Medicaid or other health insurance within 2‐3 yrs of randomisation (%) | |
| Notes | — | |
| Risk of bias | ||
| Bias | Authors' judgement | Support for judgement |
| Random sequence generation (selection bias) | Low risk | Probably done, since other reports from the same investigators clearly describe use of random sequences |
| Allocation concealment (selection bias) | Low risk | Central allocation; see Appendix 6 |
| Baseline outcome measurements | Unclear risk | No health outcomes collected at baseline |
| Baseline characteristics | Low risk | No significant differences in baseline characteristics |
| Blinding of outcome assessment (detection bias) | High risk | All data from face‐to‐face survey. Outcome assessors not blinded |
| Incomplete outcome data (attrition bias) | Unclear risk | 80% response rate. No reasons for missing data provided |
| Incomplete outcome data (outcome level) | Low risk | Authors report item non‐response low |
| Direct contamination | Low risk | Control group isolated from GAIN participants for duration of study |
| Indirect contamination | Low risk | Predates welfare reform |
| Selective reporting (reporting bias) | Unclear risk | No study protocol available |
| Methods | Randomised controlled trial, follow‐up at 18 and 36 months | |
| Participants | Half of all welfare applicants and reapplicants in Manchester and New Haven randomised between January 1996 and February 1997. Full sample N = 4803 Focal Child Sample (single mothers with a child between the ages of 5 and 12 at the 3‐year survey), N = 2069 Age ‐ average age 30.1 years Ethnicity ‐ white non‐Hispanic 34.5%; black non‐Hispanic 42.5%; Hispanic 22.2%; other 0.45% (averaged across Jobs First and AFDC) Employment status ‐ 25.5% of full sample employed Family structure ‐ 0.4% married, living together | |
| Interventions | Compulsory intervention with anti‐poverty (AP) ethos and labour force attachment (LFA) approach (moved towards human capital development (HCD) approach in implementation). Intervention group: mandatory employment; earnings disregard; childcare subsidy; workfare; time limit; sanctions; education and training; health insurance; low case management Control group: subject to previous welfare programme Further details of intervention components: Earnings supplements: none Earnings disregards: for employed recipients, all earned income disregarded when calculating grants and food stamp benefits as long as below the federal poverty level (USD 1138 per month for family of 3 in 1998) Childcare subsidy: provided childcare assistance for families leaving welfare for work for as long as income was below 75% of state median Workfare: unpaid work experience; no further detail Lifetime limit: 21 cumulative months of cash assistance unless in receipt of exemption or extension. Renewable 6 month extensions available if made a "good‐faith effort" to find work and income below welfare payment standard. Many extensions were allowed Sanctions: failing to meet work requirements within 21 months or quitting job without good cause could result in welfare grant being reduced or closed. 1st instance = reduced by 20% for 3 months; 2nd instance = reduced by 35% for 3 months; 3rd instance = grant cancelled for 3 months. Stricter when reached time limit ‐ a "one‐strike" policy where one instance of non‐compliance during extension could result in permanent discontinuance of grant Education and training: education and training provided for those unable to find a job after 3‐6 months job search activities. Adult basic education, GED prep, ESL, vocational training. Also job search skills training if independent job search failed. Moved toward greater emphasis on training during intervention Health insurance: provided 2 years of transitional Medicaid for families leaving welfare for work Case management: focus on self‐directed job search. Case management generally non‐intensive, with low levels of monitoring and interaction. Lack of resources coupled with large caseloads | |
| Outcomes | Maternal mental health: T2 CES‐D mean score (0‐60) Child mental health: T2 Behavior Problems Index (0‐56) Child physical health: T2 general health scale (1‐5) Economic employment: T2 ever employed in year of study (%) Economic benefit receipt: T2 average annual welfare benefit year 3 (USD) Economic income: T2 average annual income (benefits, earnings and Food Stamps) years 3‐4 (USD) T2 average earnings in year of survey (USD) | |
| Notes | — | |
| Risk of bias | ||
| Bias | Authors' judgement | Support for judgement |
| Random sequence generation (selection bias) | Low risk | Probably done, since other reports from the same investigators clearly describe use of random sequences |
| Allocation concealment (selection bias) | Low risk | Central allocation; see Appendix 6 |
| Baseline outcome measurements | Unclear risk | No health outcomes collected at baseline |
| Baseline characteristics | Low risk | No significant differences in baseline characteristics. Regression used to control for baseline characteristics. |
| Blinding of outcome assessment (detection bias) | High risk | Health outcomes collected by face‐to‐face survey; outcome assessors not blinded |
| Incomplete outcome data (attrition bias) | Low risk | Response rate: intervention 72%, control 70%. Weighting and regression used to control for treatment group and response differences |
| Incomplete outcome data (outcome level) | High risk | Authors report that sample size may vary for all health outcomes |
| Direct contamination | Low risk | No evidence that control group received intervention treatment |
| Indirect contamination | High risk | All studies conducted after 1996 affected by change in attitudes to welfare; authors state control group likely to have been influenced by welfare reform |
| Selective reporting (reporting bias) | Unclear risk | No study protocol available |
| Methods | Randomised controlled trial, follow up at 18 and 36 months | |
| Participants | Half of all welfare applicants and reapplicants in Manchester and New Haven randomised between January 1996 and February 1997. Full sample N = 4803 Age ‐ average age at 18‐month interview: 25.4 years Ethnicity ‐ Latina 20%; African American 38%; white/Anglo 42% Employment status ‐ 46% of all women had worked in the year prior to randomisation Family structure ‐ 73% mothers never married | |
| Interventions | Compulsory intervention with anti‐poverty (AP) ethos and labour force attachment (LFA) approach (moved towards human capital development (HCD) approach in implementation). Intervention group: mandatory employment; earnings disregard; childcare subsidy; workfare; time limit; sanctions; education and training; health insurance; low case management Control group: subject to previous welfare programme Further details of intervention components: Mandatory employment: participation in employment, training, job search or unpaid work experience required in order to receive welfare payments and other programme benefits Earnings supplements: none Earnings disregards: for employed recipients, all earned income disregarded when calculating grants and food stamp benefits as long as below the federal poverty level (USD 1138 per month for family of 3 in 1998). Childcare subsidy: provided childcare assistance for families leaving welfare for work for as long as income was below 75% of state median Workfare: unpaid work experience; no further detail Lifetime limit: 21 cumulative months of cash assistance unless in receipt of exemption or extension. Renewable 6 month extensions available if made a "good‐faith effort" to find work and income below welfare payment standard. Many extensions were allowed. Sanctions: failing to meet work requirements within 21 months or quitting job without good cause could result in welfare grant being reduced or closed. 1st instance = reduced by 20% for 3 months; 2nd instance = reduced by 35% for 3 months; 3rd instance = grant cancelled for 3 months. Stricter when reached time limit ‐ a "one‐strike" policy where one instance of noncompliance during extension could result in permanent discontinuance of grant. Education and training: education and training provided for those unable to find a job after 3‐6 months job search activities. Adult basic education, GED prep, ESL, vocational training. Also job search skills training if independent job search failed. Moved toward greater emphasis on training during intervention. Health insurance: provided 2 years of transitional Medicaid for families leaving welfare for work. Case management: focus on self‐directed job search. Case management generally non‐intensive, with low levels of monitoring and interaction. Lack of resources coupled with large caseloads | |
| Outcomes | Maternal mental health: T1 CIDI at risk (% threshold not reported) T2 CES‐D mean score (0‐60) Child mental health: T2 Child Behavior Checklist (1‐3) Economic employment: T1 currently employed (%) Economic insurance: T1 respondent has Medicaid (%) | |
| Notes | — | |
| Risk of bias | ||
| Bias | Authors' judgement | Support for judgement |
| Random sequence generation (selection bias) | Low risk | Probably done, since other reports from the same investigators clearly describe use of random sequences |
| Allocation concealment (selection bias) | Low risk | Central allocation; see Appendix 6 |
| Baseline outcome measurements | Unclear risk | No health outcomes collected at baseline |
| Baseline characteristics | Unclear risk | Baseline characteristics reported for whole sample; no adjustment reported |
| Blinding of outcome assessment (detection bias) | High risk | Health outcomes collected by face‐to‐face survey; outcome assessors not blinded |
| Incomplete outcome data (attrition bias) | Unclear risk | 78% response rate at 36 months; no reasons for missing data provided |
| Incomplete outcome data (outcome level) | Unclear risk | No information on item non‐response |
| Direct contamination | Low risk | No evidence that control group received intervention treatment |
| Indirect contamination | High risk | All studies conducted after 1996 affected by change in attitudes to welfare; authors state control group likely to have been influenced by welfare reform |
| Selective reporting (reporting bias) | High risk | Outcomes reported at each time point differ. CES‐D mean score and Child Behavior Checklist reported at 36 months but not at 18 months. Mother reported general health collected at each time point but not reported |
| Methods | Randomised controlled trial, follow up at 18 months | |
| Participants | Half of all welfare applicants and reapplicants in Manchester and New Haven randomised between January 1996 and February 1997. Full sample N = 4803 Older child subsample (child aged 3‐10 years at 18‐month interview) N = 311 Age ‐ average age 30.1 years Ethnicity ‐ black, non‐Hispanic: 41.31%; Hispanic: 17.70%; Asian/Pacific Islander: 0.69%; white: 39.61%; other: 0.69% Employment status ‐ not reported Family structure ‐ 4.52% living with spouse | |
| Interventions | Compulsory intervention with anti‐poverty (AP) ethos and labour force attachment (LFA) approach (moved towards human capital development (HCD) approach in implementation). Intervention group: mandatory employment; earnings disregard; childcare subsidy; workfare; time limit; sanctions; education and training; health insurance; low case management Control group: subject to previous welfare programme Further details of intervention components: Mandatory employment: participation in employment, training, job search or unpaid work experience required in order to receive welfare payments and other programme benefits Earnings supplements: none Earnings disregards: for employed recipients, all earned income disregarded when calculating grants and food stamp benefits as long as below the federal poverty level (USD 1138 per month for family of 3 in 1998) Childcare subsidy: provided childcare assistance for families leaving welfare for work for as long as income was below 75% of state median. Workfare: unpaid work experience; no further detail Lifetime limit: 21 cumulative months of cash assistance unless in receipt of exemption or extension. Renewable 6‐month extensions available if made a "good‐faith effort" to find work and income below welfare payment standard. Many extensions were allowed. Sanctions: failing to meet work requirements within 21 months or quitting job without good cause could result in welfare grant being reduced or closed. 1st instance = reduced by 20% for 3 months; 2nd instance = reduced by 35% for 3 months; 3rd instance = grant cancelled for 3 months. Stricter when reached time limit ‐ a "one‐strike" policy where one instance of non‐compliance during extension could result in permanent discontinuance of grant Education and training: education and training provided for those unable to find a job after 3‐6 months job search activities. Adult basic education, GED prep, ESL, vocational training. Also job search skills training if independent job search failed. Moved toward greater emphasis on training during intervention Health insurance: provided 2 years of transitional Medicaid for families leaving welfare for work. Case management: focus on self‐directed job search. Case management generally non‐intensive, with low levels of monitoring and interaction. Lack of resources coupled with large caseloads | |
| Outcomes | Maternal mental health: T1 = CES‐D % at risk (≥ 16/60) Maternal physical health: T1 = 1 or more physical health problems (%) Child mental health: T1 = Behavior Problems Index (% with problems) Economic employment: currently employed (%); ever employed since randomisation (18 months) (%) Economic insurance: respondent has Medicaid (%) | |
| Notes | — | |
| Risk of bias | ||
| Bias | Authors' judgement | Support for judgement |
| Random sequence generation (selection bias) | Low risk | Probably done, since other reports from the same investigators clearly describe use of random sequences |
| Allocation concealment (selection bias) | Low risk | Central allocation; see Appendix 6 |
| Baseline outcome measurements | Unclear risk | No health outcomes collected at baseline |
| Baseline characteristics | Low risk | Baseline characteristics presented and compared; few significant differences |
| Blinding of outcome assessment (detection bias) | High risk | All data collected by face‐to‐face survey; outcome assessors not blinded. |
| Incomplete outcome data (attrition bias) | Unclear risk | 20% of the sample lost to follow‐up or refused to participate. Reasons for missing data not presented by intervention group status |
| Incomplete outcome data (outcome level) | Unclear risk | No information on item non‐response provided |
| Direct contamination | Low risk | No evidence that control group received intervention treatment |
| Indirect contamination | High risk | All studies conducted after 1996 affected by change in attitudes to welfare; authors state control group likely to have been influenced by welfare reform |
| Selective reporting (reporting bias) | Unclear risk | No study protocol available |
| Methods | Randomised controlled trial, follow up at 48 months | |
| Participants | Report sample (single parent applicants and a proportion of reapplicants in Escambia County, Florida, randomly assigned between August 1994 and February 1995) N = 2817. Focal Child Sample: respondents to 4‐year survey sample who had a child between 5 and 12 years old, N = 1108 Age ‐ maternal age categories (%) ‐ intervention/control: under 20 years: 8.1/6.0; 20‐23 years: 22.8/24.1; 24‐33 years: 54.9/54.3; 34‐43 years: 13.1/14.3; 44 years or older: 1.1/1.2 Ethnicity (%) ‐ intervention/control: white, non‐Hispanic: 44.7/43.3; black, non‐Hispanic: 53.3/54.9; other: 2.0/1.8 Employment status ‐ not reported Family structure ‐ married, live together (%): intervention/control 0.6/1.2 | |
| Interventions | Compulsory intervention with anti‐poverty (AP) ethos and human capital development (HCD) approach (moving towards labour force attachment (LFA) in implementation). Intervention group: mandatory employment; earnings disregard; childcare subsidy; workfare; time limit; sanctions; education and training; high case management Control group: subject to existing welfare programme Further details of intervention components: Mandatory employment: participation in employment, training, job search or unpaid work experience of at least 30 hours per/week required in order in order to receive welfare payments and other programme benefits Earnings supplements: none Earnings disregards: enhanced earned income disregard ‐ first USD 200 plus one‐half of remaining earned income disregarded in calculating monthly grant Childcare subsidy: offered subsidised transitional child care for 2 years after participant left welfare for work Workfare: job ready participants assigned to workfare if they did not find employment after 3 weeks of job search Lifetime limit: limited most families to 24 months of cash assistance in any 60‐month period ('least job‐ready' 36 in 72 months). Allowed up to 2, four‐month extensions in some circumstances. Time limit could also be suspended if health problems identified by a doctor Sanctions: first 3 years of implementation, sanctions involved partial benefit termination. Adopted WAGES sanctioning policy in mid‐1997 which could result in full termination for repeated noncompliance. Under WAGES: 1st instance = cash assistance closed until compliance; 2nd instance = cash and food stamps case closed until 30 days of compliance; 3rd instance = both closed for at least 3 months Education and training: strong emphasis on training provision, which was well resourced. Provided adult basic education and vocational training. Assigned some participants (lacking high school diploma/low literacy) to community institutions providing maths and reading instruction or GED prep. Created special short‐term training programs for those facing time limits which could lead to qualifications such as nursing, machining, office supervision. Strong links with local industry. Health insurance: none Case management: individualised, intensive case management delivery with small staff to participant ratios. Provided intensive one‐on‐one job placement help to those approaching time limit. | |
| Outcomes | Maternal mental health: CES‐D mean score (0‐60) Child mental health: Behavior Problems Index (0‐56) Child physical health: general health scale (1‐5) Economic employment: ever employed in year of study (%) Economic benefit receipt: total AFDC/TANF received year 4 (USD) Economic income: average total income (benefits, earnings and food stamps) year 4 (USD); average total income from earnings, AFDC/TANF and food stamps year 4 (USD) | |
| Notes | — | |
| Risk of bias | ||
| Bias | Authors' judgement | Support for judgement |
| Random sequence generation (selection bias) | Low risk | Probably done, since other reports from the same investigators clearly describe use of random sequences |
| Allocation concealment (selection bias) | Low risk | Central allocation; see Appendix 6 |
| Baseline outcome measurements | Unclear risk | No health outcomes collected at baseline |
| Baseline characteristics | Low risk | Baseline characteristics presented and compared; no significant differences |
| Blinding of outcome assessment (detection bias) | High risk | Health outcomes collected by face‐to‐face survey; outcome assessors not blinded |
| Incomplete outcome data (attrition bias) | Unclear risk | 20% of the sample lost to follow‐up or refused to participate; reasons for missing data not presented by intervention group status |
| Incomplete outcome data (outcome level) | High risk | Authors report that sample size may vary for all health outcomes |
| Direct contamination | Low risk | No evidence that control group received intervention treatment |
| Indirect contamination | High risk | All studies conducted after 1996 affected by change in attitudes to welfare; authors state control group likely to have been influenced by welfare reform |
| Selective reporting (reporting bias) | Unclear risk | No study protocol available |
| Methods | Randomised controlled trial, follow up at 60 months | |
| Participants | Full sample (ongoing welfare recipients randomised 10/93, new applicants randomised between 10/93 3/96), N = 17,345. Core survey sample (stratified random sample from full sample) N = 4111 Child Impact Study sample (respondents from the Core survey that had a child between 5 and 12 years old), N = 1962 Age ‐ average age Ongoing cases: 26.6 years; applicants: 26.1 years Ethnicity ‐ race/ethnicity (%) Employment status ‐ employed in year prior to randomisation: Family structure ‐ married respondents Ongoing cases: 16.8% | |
| Interventions | Compulsory intervention with anti‐poverty (AP) ethos and labour force attachment (LFA) approach. Intervention group: mandatory employment; earnings disregard; childcare subsidy; workfare; sanctions; education and training; case management not reported Control group: subject to existing welfare programme Further details of intervention components: Mandatory employment: required to participate in PROMISE JOBS, a programme providing employment and training opportunities. Required to complete 20 hours of work or work‐related activities per week in order to receive welfare payments and other programme benefits Earnings supplements: none Earnings disregards: FIP provided earned‐income disregards that resulted in a tax rate on earnings of only 40 percent: for every USD 1 a FIP family earned, FIP benefit amount reduced by USD 0.40, so total income increases by USD 0.60 Childcare subsidy: financial assistance to pay for child care while receiving cash welfare and for up to 2 years after their cash welfare case closed because of earnings or employment. The parent made a modest co‐payment based on family income and size, and IFIP paid the remaining cost of child care, up to the provider's regular fee for private‐paying families or the state's maximum payment rate, whichever was lower Workfare: unpaid work experience and community service mentioned; no further detail Lifetime limit: no time limit mentioned Sanctions: failure to comply with programme requirements led to assignment to the Limited Benefit Plan. Initially this provided 3 months of full FIP cash benefits, then 3 months of reduced benefits and then 6 months of no benefits for the whole family. Revised in 1996 to 3 months of reduced benefits followed by 6 of no benefits. For second failure benefits terminated fully and immediately for 6 months. Revised in 1999 to full termination for first instance of non‐compliance. Benefits restored immediately on compliance Education and training: placed little weight on developing skills and more on rapid entry into employment. However, did require mothers under 18 to obtain a high school diploma or GED Health insurance: none Case management: little detail provided | |
| Outcomes | Maternal mental health: CES‐D % at high risk (≥ 23/60) Child mental health: Behavior Problems Index (0‐56) Child physical health: in fair or poor health (%) Economic employment: currently employed (%): currently employed full‐time (%); currently employed part‐time (%) Economic benefit receipt: average welfare received month prior to survey (USD); currently receiving Family Independence Payment (%) Economic income: household income month prior to survey (USD); average earnings month prior to survey(USD) Economic insurance: family has health insurance (%) | |
| Notes | — | |
| Risk of bias | ||
| Bias | Authors' judgement | Support for judgement |
| Random sequence generation (selection bias) | Unclear risk | No information provided |
| Allocation concealment (selection bias) | Unclear risk | No information provided |
| Baseline outcome measurements | Unclear risk | No health outcomes collected at baseline |
| Baseline characteristics | Low risk | No significant differences in baseline characteristics; regression used to control for differences |
| Blinding of outcome assessment (detection bias) | Unclear risk | All outcomes collected by face‐to‐face survey; no information on blinding |
| Incomplete outcome data (attrition bias) | Low risk | Response rate: intervention 75.8%; control 74.0%. Weights used to account for survey non‐response and attrition |
| Incomplete outcome data (outcome level) | Low risk | Authors report item non‐response low |
| Direct contamination | High risk | Control conditions terminated during intervention; all participants moved to TANF at 3.5 years |
| Indirect contamination | High risk | All studies conducted after 1996 affected by change in attitudes to welfare |
| Selective reporting (reporting bias) | Unclear risk | No study protocol available |
| Methods | Randomised controlled trial, follow up at 60 months | |
| Participants | Full sample (all Indiana single‐parent welfare recipients randomly assigned between May 1995 and April 1996), N = 66,440 5‐year survey (stratified random sample from full population), N = 3360 Focal Child sample (families who completed 5‐year survey with a child aged 5 to 12), N =1679. Age ‐ under 25 years: 48%; 25‐34 years: 42.7%; 35 + years: 9.3% Ethnicity ‐ non‐white: 44.7% Employment status ‐ quarters worked in the 5 quarters before randomisation: 38.3% none; 35.8% between 1‐3 quarters; 25.9% between 4‐5 quarters 25.9% Family structure ‐ never married: 43.8%; separated: 10.5%; divorced or widowed: 22.5%; married and living with spouse: 23.2% | |
| Interventions | Compulsory intervention with caseload reduction (CR) ethos and labour force attachment (LFA) approach Intervention group: mandatory employment; earnings disregard; childcare subsidy; time limit; sanctions; education and training; health insurance; case management not reported Control group: subject to existing welfare programme Further details of intervention components: Mandatory employment: required to participate in work activities (primarily working or looking for employment) for 25 hours per week in order to receive welfare payments and other programme benefits Earnings supplements: none Earnings disregards: TANF grant fixed at level of recipients' initial earnings for some time after they entered employment Childcare subsidy: subsidy provided but no detail given Workfare: none Lifetime limit: 24‐month lifetime limit on TANF receipt. Affected only adults' portion of the grant; children continued to receive assistance Sanctions: for first violation, TANF grant reduced by adult's portion for 2 months, for second and third violation, reduced by same amount for 12 and 36 months, respectively. No full family sanction Education and training: training is referred to but no detail is provided. Main activity is described as "unsubsidized employment and job search" Health insurance: none Case management: Little detail provided | |
| Outcomes | Maternal mental health: CES‐D mean score (0‐60) Child mental health: Behavior Problems Index (0‐56) Child physical health: health status scale (1‐5) Economic employment: currently employed (%) Economic benefit receipt: TANF receipt month before survey, annualised year 5 (USD); currently receiving TANF (%) Economic income: total household income month prior to survey, annualised (USD); earnings month prior to survey, annualised (USD) | |
| Notes | — | |
| Risk of bias | ||
| Bias | Authors' judgement | Support for judgement |
| Random sequence generation (selection bias) | Unclear risk | Conducted by Indiana State; no information provided |
| Allocation concealment (selection bias) | Unclear risk | Conducted by Indiana State; no information provided |
| Baseline outcome measurements | Unclear risk | No health outcomes collected at baseline |
| Baseline characteristics | Low risk | No significant differences in baseline characteristics; regression used to control for differences |
| Blinding of outcome assessment (detection bias) | Unclear risk | All outcomes collected by face‐to‐face survey; blinding of outcome assessors unlikely; maternal depression was self‐administered |
| Incomplete outcome data (attrition bias) | Low risk | Overall response rate 70%; reports statistically significant difference between intervention and control groups. Weights used to adjust for attrition |
| Incomplete outcome data (outcome level) | Unclear risk | No information on item non‐response provided |
| Direct contamination | Low risk | No evidence that control group received intervention treatment |
| Indirect contamination | High risk | All studies conducted after 1996 affected by change in attitudes to welfare; authors state control group likely to have been influenced by welfare reform |
| Selective reporting (reporting bias) | Unclear risk | No study protocol available |
| Methods | Randomised controlled trial, follow up at 36 months | |
| Participants | Total sample; welfare applicants and recipients from April 1994 to March 1996 in 3 urban and 4 rural Minessota counties), N = 14,639 Age ‐ average age: 28.9 among long‐term recipients, 30.1 among recent applicants Ethnicity ‐ % long‐term recipients/% recent applicants: Employment status ‐ 12.8% among long‐term recipients, 22.3% among recent applicants Family structure ‐ married, living with spouse: 0.5% among long‐term recipients, 0.6% among recent applicants | |
| Interventions | Compulsory intervention with anti‐poverty (AP) ethos and labour force attachment (LFA) approach (intervention group 1) Intervention group1 (MFIP): mandatory employment; earnings disregard; childcare subsidy; sanctions; mandatory education and training; case management not reported Intervention group2 (MFIP‐incentives only): earnings disregard; childcare subsidy; voluntary education and training; case management not reported Control group: subject to existing welfare programme Further details of intervention components: Mandatory employment: mandatory participation in employment‐focused activities for long‐term welfare recipients. MFIP required mothers who were unemployed for 24 months out of the previous 36 to work 30 hours at least per week if not participating in employment services or 20 hours if had child under age of 6 in order to receive welfare payments and other programme benefits. Short‐term recipients and MFIP‐IO group were not required to participate in work related activities but received programme benefits if they did Earnings supplements: none Earnings disregards: recipients eligible for welfare until income reached 140% of the poverty level. Those already working received additional income for no extra hours of work Childcare subsidy: child care subsidies paid directly to provider if recipient working while on welfare. Amounts paid did not differ from control group, but intervention group also given child care for attending counselling, drug programmes etc. to tackle barriers to work. Workfare: none Lifetime limit: none Sanctions: failure to comply with the programme requirements led to sanction involving monthly welfare payments reduced by 10% Education and training: employment and training participation required if receiving assistance for 24 of past 36 months. Provided job search, short‐term training, and educational activities Health insurance: none Case management: case management role to monitor and give guidance but level of monitoring or time spent with clients not detailed; staff‐to‐participant ratio not mentioned | |
| Outcomes | Maternal mental health: CES‐D % at high risk (≥23/60) Child mental health: Behavior Problems Index (0‐56) Child physical health: in good or excellent health (%) Economic employment: ever employed since randomisation (36 months) (%); ever employed full‐time since randomisation (%); ever employed part‐time since randomisation (%) Economic benefit receipt: average annual welfare benefit year 3 (USD) Economic income: average annual income (benefits and earnings) year 3 (USD); average annual earnings years 1‐3 (USD) Economic insurance: children have health insurance continuously past 36 months (%) | |
| Notes | — | |
| Risk of bias | ||
| Bias | Authors' judgement | Support for judgement |
| Random sequence generation (selection bias) | Low risk | Probably done, since other reports from the same investigators clearly describe use of random sequences |
| Allocation concealment (selection bias) | Low risk | Central allocation; see Appendix 6 |
| Baseline outcome measurements | Unclear risk | No health outcomes collected at baseline |
| Baseline characteristics | Unclear risk | Baseline characteristics not presented separately for intervention groups; some baseline characteristics are controlled for, but not clear which ones |
| Blinding of outcome assessment (detection bias) | Low risk | Health outcomes collected by Audio‐CASI; outcome assessors blind to response |
| Incomplete outcome data (attrition bias) | Low risk | Response rate: intervention 80.3% control 75%.Regression used to control for differences between groups. |
| Incomplete outcome data (outcome level) | Low risk | Values for health outcomes imputed to account for item non‐response |
| Direct contamination | Low risk | No evidence that control group received intervention treatment |
| Indirect contamination | High risk | All studies conducted after 1996 affected by change in attitudes to welfare; authors state control group likely to have been influenced by welfare reform |
| Selective reporting (reporting bias) | High risk | Maternal CES‐D scale, health insurance and employment outcomes not reported for rural subgroups |
| Methods | Randomised controlled trial, follow up at 24, 60 and 96 months | |
| Participants | Total sample: low‐income adults aged ≥ 18 years living in 2 inner city areas of Milwaukee, randomly assigned from August 1994 through December 1995. Recruited by community workers in community settings. N = 1357 Child and Family Study (CFS) Sample (families with at least one child between ages 1 and 10 at baseline), N = 745 Age ‐ average age T1: 29.4 years Ethnicity ‐ T1: African American: 55.0%, Hispanic: 29.3%, white: 12.5%, Native American/Alaskan Native: 3.2% Employment status ‐ employed at randomisation: 36.5% Family structure ‐ married, living with spouse: 10.5% | |
| Interventions | Voluntary intervention with anti‐poverty (AP) ethos and labour force attachment (LFA) approach. Intervention group: earnings supplement; childcare subsidy; health insurance; high case management Control group: subject to existing welfare programme Further details of intervention components: Mandatory employment: voluntary programme. Required to work full time (at least 30 hours a week) in order to receive earnings supplements and other programme benefits Earnings supplements: New Hope offered monthly earnings supplements to participants who worked at least 30 hours per week but whose earnings left their household below 200% of the poverty line. Earnings supplements were adjusted upward for household size, up to a maximum of 2 adults and 4 children Earnings disregards: none Childcare subsidy: financial assistance to cover child care expenses for children under age 13 when parent worked at least 30 hours per week. Participants paid a portion of the cost, based on income and household size; New Hope covered the remainder. For participants to qualify for New Hope subsidies, the child care had to be provided in state‐licensed or county‐certified homes or child care centres Workfare: none. Community service jobs were available to those who could not find employment independently, but these were voluntary and paid at market rates. Lifetime limit: no limit on receipt of welfare payments. 3‐year limit on supplement payments Sanctions: none Education and training: education or training activities were not provided but New Hope staff provided advice and signposting to training Health insurance: provided for those working at least 30 hours per week and not covered by employers' health insurance or Medicaid. Required to contribute toward premium on a sliding scale that took into account their income and household size; New Hope subsidised the remainder Case management: intensive case management with high‐quality staff services, individualised attention, flexibility and frequent contact. Voluntary so focus on engagement through support rather than sanctions | |
| Outcomes | Maternal mental health: T1 CES‐D mean score (0‐60); T3 CES‐D mean score (0‐60) Maternal physical health: T3 physical health scale (1‐5) Child mental health: T1 Problem Behavior Scale (1‐5); T3 Problem Behavior Scale (1‐5) Child physical health: T3 overall health scale (1‐5) Economic employment: T1 ever employed year 2 (%); T3 ever employed year 5 (%); T3 currently employed full‐time (%) Economic benefit receipt: T1 total AFDC received year 2 (USD); T1 ever received AFDC/TANF year 2 (%); T3 total AFDC/TANF receipt year 5 (USD); T3 ever received AFDC/TANF year 5 (%) Economic income: T1 total income year 2 (USD); T1 average annual earnings year 2 (USD); T3 total income year 5 (USD); T3 average earnings year 5 (USD) Economic insurance: T1 respondent ever had Medicaid since randomisation (24 months) (%); T3 respondent has health insurance (%); T3 all focal children have health insurance (%) | |
| Notes | — | |
| Risk of bias | ||
| Bias | Authors' judgement | Support for judgement |
| Random sequence generation (selection bias) | Low risk | Probably done, since other reports from the same investigators clearly describe use of random sequences |
| Allocation concealment (selection bias) | Low risk | Central allocation; see Appendix 6 |
| Baseline outcome measurements | Unclear risk | No health outcomes collected at baseline |
| Baseline characteristics | Low risk | No significant differences in baseline characteristics. Weighting used to control for differences |
| Blinding of outcome assessment (detection bias) | High risk | Health outcomes collected by face‐to‐face survey; outcome assessors not blinded |
| Incomplete outcome data (attrition bias) | Low risk | Response rates (%): At 2 years intervention 79.7, control 79 At 5 years intervention 77, control 73.5 Unit and item non‐response addressed using multiple imputation |
| Incomplete outcome data (outcome level) | Low risk | Unit and item non‐response addressed using multiple imputation |
| Direct contamination | High risk | Wisconsin Works implemented state‐wide in 1997, a year before New Hope intervention ended. It is unclear how much New Hope participants were affected but it is likely that year 5 data are affected by contamination bias |
| Indirect contamination | High risk | All studies conducted after 1996 affected by change in attitudes to welfare |
| Selective reporting (reporting bias) | High risk | Maternal physical health not reported at T1. Child overall health not reported at T1. Total behaviour problems not reported at 96 months |
| Methods | Randomised controlled trial, follow‐up at 24 and 60 months | |
| Participants | Full impact sample (welfare applicants or recipients randomly assigned June 1991 to December 1994 in Atlanta, Grand Rapids, Riverside, Columbus, Detroit, Oklahoma City, Portland), N = 41,715 Child Outcomes Study sample (single parent with child aged 3 to 5 years at randomisation, in Atlanta, Grand Rapids or Riverside. Randomly selected from respondents to 2‐year Survey), N = 3018 Age ‐ T1 mean age of mother: 29.0 years in Atlanta, 26.7 years in Grand Rapids, 29.3 years in Riverside Ethnicity ‐ T1 % in Atlanta/Grand Rapids/Riverside Employment status ‐ T1 % in Atlanta/Grand Rapids/Riverside employed at baseline 9.1%/11.5%/9.7% Family structure ‐ T1 % in Atlanta/Grand Rapids/Riverside married, living with spouse: 0.9%/2.1%/2.2% | |
| Interventions | Compulsory intervention with caseload reduction (CR) ethos, human capital development (HCD) approach (intervention group 1) and labour force attachment (LFA) approach (intervention group 2). Intervention group 1 (HCD): mandatory employment; workfare; sanctions; education and training; high case management Intervention group 2 (LFA): mandatory employment; workfare; sanctions; education and training; high case management Control group: subject to existing welfare programme Further details of intervention components: Mandatory employment: required to engage in a JOBS welfare‐to‐work programme requiring mandated participation in education, training and/or employment activities for an average of 30 hours per week, including at least 20 hours in actual work or job search, in order to receive welfare payments and other programme benefits Earnings supplements: none Earnings disregards: none Childcare subsidy: none Workfare: participants could be assigned to 3 types of work experience positions: unpaid work in the public or private sector (in exchange for their welfare grant), on job training in private sector and paid work. More common in LFA programmes Lifetime limit: none Sanctions: sanctions in place for non‐participation in work mandates. Grand Rapids LFA in particular frequently issued sanctions, while other programmes gave clients more chances to comply. Adult welfare grant was reduced by approximately 20%, depending on the site. Penalty continued until sanctioned individual complied with participation mandate. Minimum sanction length of 3 months for 2nd 'offence' and 6 months for third offence (no minimum length for first offence). Education and training: HCD groups initially assigned to some type of skill‐building activity (GED prep, ESL, adult basic skills classes). LFA programmes assigned most enrollees to job club as first activity. Education and training available after if necessary or in addition to work Health insurance: none Case management: most sites described as 'high enforcement' with close monitoring and sanctions applied for non‐participation. Suggests intensive case management. Seems HCD programmes more flexible, though varied across sites | |
| Outcomes | Maternal mental health: T1 CES‐D mean score (0‐36) Child mental health: T1 Behavior Problems Index (0‐2); T3 BPI Externalising subscore (0‐18); T3 BPI Internalising subscore (0‐24); T3 BPI Hyperactivity subscore (0‐18) Child physical health: T1 general health rating (1‐5); T3 general health rating (1‐5) Economic employment: T1 currently employed (%); T1 ever employed since randomisation (24 months) (%); T3 currently employed (%); T3 ever employed years 1‐5 (%); T3 currently employed full‐time (%); T3 currently employed part‐time (%) Economic benefit receipt: T1 currently receiving AFDC (%); T3 total welfare payments years 1‐5 (USD) Economic income: T1 total net household income in prior month (USD); T1 average earnings previous month (USD); T3 total income years 1‐5 (USD); T3 average earnings years 1‐5 (USD) Economic insurance: T1 respondent ever had employer‐provided health insurance since randomisation (24 months) (%); T1 child health insurance (%); T3 family has health insurance (%) | |
| Notes | — | |
| Risk of bias | ||
| Bias | Authors' judgement | Support for judgement |
| Random sequence generation (selection bias) | Low risk | Probably done, since other reports from the same investigators clearly describe use of random sequences |
| Allocation concealment (selection bias) | Low risk | Central allocation; see Appendix 6 |
| Baseline outcome measurements | Unclear risk | Maternal CES‐D collected at baseline and controlled for, but no other health outcomes collected at baseline |
| Baseline characteristics | Low risk | Response rates at 5 years (%): Atlanta LFA: 82.8 Weights and regression used to control for differences in baseline characteristics |
| Blinding of outcome assessment (detection bias) | High risk | Health outcomes by face‐to‐face survey; outcome assessors not blinded |
| Incomplete outcome data (attrition bias) | Low risk | Weights and regression used to correct/control for differences in background characteristics. Authors state differences in response rates and characteristics were not sufficient to bias the impacts. |
| Incomplete outcome data (outcome level) | High risk | Authors report that sample size may vary for all health outcomes |
| Direct contamination | High risk | Some control group members in Atlanta and Grand Rapids were required to participate in WtW programmes after year 3. Data at 5 years may therefore suffer from contamination bias. |
| Indirect contamination | High risk | All studies conducted after 1996 affected by change in attitudes to welfare |
| Selective reporting (reporting bias) | High risk | Maternal CES‐D scale and summary Behavior Problems Index only reported at 24 months |
| Methods | Randomised controlled trial, follow up at 24 and 48 months | |
| Participants | Full sample (all new single parent applicants approved to receive welfare benefit in 2 areas of Ontario) N (eligible) = 1739; N (recruited) = 765 Full intervention group, employment training group and control group N = 459 Age (%): 15‐19 years: full Intervention (FI) 2.5/employment retraining (ER) 4.1/self‐directed (SD) 6.9; 20‐24 years: FI 16.5/ER 19/SD 16.4; 25‐29: FI 21.5/ER 23.1/SD 19; 30‐34 years: FI 19/ER 21.5/SD 20.7; 35‐39 years: FI 21.5/ER 16.5/SD 19.8; 40 and over years: FI 19/ER 15.7/SD 17.2 Ethnicity ‐ not reported. Employment status ‐ %: full‐time work: FI 5/ER 5.8/SD 1.7; part‐time work: FI 15.8/ER 10/SD 14.7; unemployed: FI 16.7/ER 15.8/SD 20.7 Family structure ‐ marital status (n/%) Married or remarried or common law: 12/1.6; separated 343/ 44.8; divorced or annulled 171/22.4; widowed 10/1.3; never married 22.9/29.9 | |
| Interventions | Voluntary intervention Full Intervention group: childcare subsidy; education and training; high case management Employment training group: employment training only Control group: subject to existing welfare programme Further details of intervention components: Mandatory employment: not required to participate in programme activities in order to receive welfare payments or other programme benefits. No sanctions or supplements attached to non/participation Earnings supplements: none Earnings disregards: none Childcare subsidy: group 1 (comprehensive approach) received subsidised after school recreation/child care twice a week for 4 years Workfare: none Lifetime limit: none Sanctions: none Education and training: group 1 received up to 6 employment skills focused sessions with an employment counsellor Health insurance: NA Case management: case management involved home visits and intensive contact and support. Flexible/personalised case management focused on problem solving, engagement and empowerment | |
| Outcomes | Maternal mental health: T1 presence of mood disorders (University of Michigan, Composite International Diagnostic Interview) (%) Maternal physical health: T2 in good or excellent health % Child mental health: T1 1 or more behaviour disorders (Survey Diagnostic Instrument) (%); T2 Survey Diagnostic Instrument Conduct Disorder (0‐30) Economic benefit receipt: T1 received social assistance in last 12 months (%); T2 social assistance/unemployment insurance receipt year 4 (%) | |
| Notes | — | |
| Risk of bias | ||
| Bias | Authors' judgement | Support for judgement |
| Random sequence generation (selection bias) | Low risk | "Subjects eligible and receiving income maintenance were randomly allocated to one of five treatment strategies using a computerized randomization schedule which blocked randomly after every 5th or 10th subject (household) to ensure equal numbers in all treatment groups." |
| Allocation concealment (selection bias) | Unclear risk | No information provided |
| Baseline outcome measurements | High risk | Outcome measures presented for all groups, but differ by group; no mention of adjustment |
| Baseline characteristics | Low risk | Many baseline characteristics are presented; there are few significant differences between groups |
| Blinding of outcome assessment (detection bias) | Low risk | Outcome assessors blind to intervention status |
| Incomplete outcome data (attrition bias) | High risk | Very high. Overall response rate at randomisation 44%. Of 1739 eligibles, 700 refused and 274 were not contactable. At 2 years, response rate varied across groups from 38%‐58%. Overall response rate at 4 years was 78.5% of randomisation sample; no reasons for missing data provided |
| Incomplete outcome data (outcome level) | Unclear risk | No information on item non‐response |
| Direct contamination | High risk | Ontario Works introduced in 1996, although single parents of children under school age often exempt. Also earnings disregards increased. Difficult to assess how much this would have affected this sample |
| Indirect contamination | High risk | Attitudes to welfare became increasingly negative during this period |
| Selective reporting (reporting bias) | High risk | All outcomes reported at each time point differ |
| Methods | Randomised controlled trial, follow up at 72 months | |
| Participants | Applicant study sample; single parents 19 years or older who had recently applied for Income Assistance (and remained on it for 12 out of 13 months in order to receive supplement), assigned randomly between February 1994 and March 1995. Randomly selected from all adult single parents applying for IA in selected areas of British Columbia. N = 3,315 Age ‐ under age 25 (%): intervention 15.5, control 14.3 Ethnicity ‐ First Nations ancestry (%) intervention 7.2, control 8.7 Employment status ‐ worked in month before randomisation (%): intervention 24.0, control 23.1 Family structure ‐ never married (%): intervention 21.6, control 25.1 | |
| Interventions | Voluntary intervention with anti‐poverty (AP) ethos and labour force attachment (LFA) approach. Intervention group: earnings supplement; low case management Control group: subject to existing welfare programme Further details of intervention components: Mandatory employment: not required to participate in employment in order to receive welfare payments. Required to work at least 30 hours per week to be eligible for supplement payments. Earnings supplements: financial supplement paid to parents who worked 30 or more hours per week an amount equal to half the difference between their actual earnings and a 'benchmarked' level of earnings. During the first year of operations, the benchmark was CAD 30,000 in New Brunswick and CAD 37,000 in British Columbia. Had to remain on Income Assistance for 12 months to qualify for supplement payments Earnings disregards: none Childcare subsidy: none Workfare: none Lifetime limit: no limit on receipt of welfare payments. 3‐year limit on supplement payments Sanctions: none Education and training: education or training activities were not provided but SSP staff provided advice and signposting to training Health insurance: NA Case management: generally non‐intensive with limited contact | |
| Outcomes | Maternal mental health: CES‐D mean score (0‐33) Child mental health: Behavior Problems Scale (1‐3) Child physical health: child average health scale (1‐5) Economic employment: currently employed (%); currently employed full‐time (%); currently employed part‐time (%) Economic benefit receipt: average Income Assistance received year 6 (CAD); currently receiving income assistance (%) Economic income: total monthly individual income at 72 months (CAD); average earnings year 6 (CAD) | |
| Notes | — | |
| Risk of bias | ||
| Bias | Authors' judgement | Support for judgement |
| Random sequence generation (selection bias) | Low risk | Randomly chosen from lists of IA recipients |
| Allocation concealment (selection bias) | Low risk | "Immediately after the baseline interview, each of these . . . single parents was randomly assigned to one of the research groups of the SSP study. Each sample member had 50‐50 odds of being assigned to the program group or the control group." |
| Baseline outcome measurements | Unclear risk | No health outcomes collected at baseline |
| Baseline characteristics | Low risk | Significant differences in some baseline characteristics, but regression adjusted estimates did not differ from unadjusted estimates. Unadjusted estimates presented throughout |
| Blinding of outcome assessment (detection bias) | Unclear risk | Health outcomes collected by face‐to‐face survey; no information on blinding |
| Incomplete outcome data (attrition bias) | Unclear risk | 72% response rate at 72 months; no reasons for missing data provided |
| Incomplete outcome data (outcome level) | High risk | Authors report that sample size may vary for all outcomes |
| Direct contamination | High risk | Direct ‐ welfare conditions became increasingly restrictive during the course of the study |
| Indirect contamination | High risk | Attitudes to welfare became increasingly negative during this period |
| Selective reporting (reporting bias) | Unclear risk | No study protocol available |
| Methods | Randomised controlled trial, follow‐up at 36 and 54 months | |
| Participants | Recipient study sample; single parents 19 years or older who had received Income Assistance payments in the current month and at least 11 of the prior 12 months. Randomly selected from all adult single parents applying for IA in selected areas of British Columbia and New Brunswick between November 1992 and March 1995 N = 5739 Age 19–24 years (only age group reported) %: total sample/British Columbia/New Brunswick: 21.7/17.3/26.5 Ethnicity ‐ % total sample/British Columbia/New Brunswick: First Nations ancestry 9.7/13.1/6.0; not born in Canada 13.0/22.5/ 2.4 Employment status ‐ 19% employed in total at baseline Family structure ‐ never married % total sample/British Columbia/New Brunswick 48.9/43.7/54.6 | |
| Interventions | Voluntary intervention with anti‐poverty (AP) ethos and labour force attachment (LFA) approach. Intervention group: earnings supplement; low case management Control group: subject to existing welfare programme Further details of intervention components: Mandatory employment: not required to participate in employment in order to receive welfare payments. Required to work at least 30 hours per week to be eligible for supplement payments. Earnings supplements: financial supplement paid to parents who worked 30 or more hours per week an amount equal to half the difference between their actual earnings and a 'benchmarked' level of earnings. During the first year of operations, the benchmark was CAD 30,000 in New Brunswick and CAD 37,000 in British Columbia. Had to find a full‐time job within 12 months to qualify for supplement payments. Earnings disregards: none Childcare subsidy: none Workfare: none Lifetime limit: no limit on receipt of welfare payments. 3‐year limit on supplement payments Sanctions: none Education and training: education or training activities were not provided but SSP staff provided advice and signposting to training Health insurance: NA Case management: generally non‐intensive with limited contact | |
| Outcomes | Maternal mental health: T2 CES‐D mean score (0‐33); T3 CES‐D mean score (0‐33) Child mental health: T2 Behavior Problems Scale (1‐3); T2 adolescent CES‐D at risk (%≥8/30); T3 Behavior Problems Scale (1‐3) Child physical health: T2 child average health scale (1‐5); T3 child average health scale (1‐5) Economic employment: T2 ever employed full‐time since randomisation (%); T2 employed FT at 33 months (%); T2 currently employed part‐time (%); T3 currently employed (%); T3 currently employed full‐time (%); T3 currently employed part‐time (%) Economic benefit receipt: T2 average Income Assistance year 3 (CAD); T2 Income Assistance receipt year 3 (%); T3 average Income Assistance received year 5 (CAD); T3 cCurrently receiving Income Assistance (%); Economic income: T2 total monthly individual income 6 months prior to 3 year survey (CAD); T2 average earnings in year of survey (CAD); T3 total monthly individual income (average in 6 months prior to month 54 (CAD)); T3 monthly earnings year 5, quarter 18 (CAD) | |
| Notes | — | |
| Risk of bias | ||
| Bias | Authors' judgement | Support for judgement |
| Random sequence generation (selection bias) | Low risk | Randomly chosen from lists of IA recipients |
| Allocation concealment (selection bias) | Low risk | "Immediately after the baseline interview, each of these . . . single parents was randomly assigned to one of the research groups of the SSP study. Each sample member had 50‐50 odds of being assigned to the program group or the control group." |
| Baseline outcome measurements | Unclear risk | No health outcomes collected at baseline |
| Baseline characteristics | Unclear risk | Baseline characteristics not reported by intervention status; no adjustment reported |
| Blinding of outcome assessment (detection bias) | Unclear risk | Health outcomes collected by face‐to‐face survey; no information on blinding |
| Incomplete outcome data (attrition bias) | Unclear risk | 80% response rate at 2 years. 72% response rate at 5 years; no reasons for missing data provided |
| Incomplete outcome data (outcome level) | High risk | Authors report that sample size may vary for all outcomes: "Sample sizes reflect the largest sample of all measures shown. However, sample sizes vary largely across the measures, ranging from 235 to 1,111 in the program group." |
| Direct contamination | High risk | Direct ‐ welfare conditions became increasingly restrictive during the course of the study |
| Indirect contamination | High risk | Attitudes to welfare became increasingly negative during this period |
| Selective reporting (reporting bias) | High risk | Child health outcomes and subgroups reported at T1 and T3 differ |
| Methods | Randomised controlled trial, follow up at 60 months | |
| Participants | Main study sample N = 16,384. New Deal for Lone Parents Sample (lone parents receiving welfare benefits and attending a Job Centre, randomised between October 2003 and December 2004, from 6 sites in the UK) N = 6787 Customer survey sample N = 1854 Age ‐ (%:) under 30 years, 41.3; 30‐39 years, 39.7; 40 years or older, 19.0 Ethnicity ‐ ethnic minority 14.8; white 85.2 Employment status ‐ number of months worked in 3 years prior to randomisation (%) none, 49.6; 1‐12 months, 23.1; ≥ 13 months, 27.3 Family structure ‐ marital status (%) single, 71.6; divorced, 14.7; separated, 11.6; widowed, 1.2; living together, 0.0; married, 0.6. | |
| Interventions | Voluntary intervention with anti‐poverty (AP) ethos and human capital development (HCD) approach Intervention group: earnings supplement; education and training; high case management Control group: subject to existing welfare programme Further details of intervention components: Mandatory employment: not required to participate in employment in order to receive welfare payments. Required to work at least 30 hours per week in 13 weeks out of 17 week period to be eligible for supplement payments. Unique postemployment 'in work' phase lasting approximately 2 years Earnings supplements: paid an employment retention bonus of GBP 400, 3 times a year for 2 years for staying in full‐time work (at least 30 hours per week for 13 out of every 17 weeks). Earnings disregards: none Childcare subsidy: none Workfare: none Lifetime limit: no limit on receipt of welfare payments. 33‐month limit on supplement payments Sanctions: none Education and training: provided financial support for training and completion bonuses ‐ assistance for training courses up to GBP 1000 while employed and a bonus up to GBP 1000 for completing training when employed. Helped to identify appropriate education or training courses Health insurance: NA Case management: supportive case management. Flexible with regular, intensive post employment support. Generally small caseloads, however substantial variation across offices | |
| Outcomes | Maternal mental health: miserable or depressed often or always (%) Maternal physical health: long‐standing illness, disability or infirmity (%); in good or very good health (%) Economic employment: currently employed (%); ever employed year 5 (%); currently employed full‐time (%); currently employed part‐time (%) Economic benefit receipt: average Income Support received per wk (GBP); currently receiving Income Support or Jobseeker's Allowance (GBP) Economic income: average earnings year 5 (GBP) | |
| Notes | — | |
| Risk of bias | ||
| Bias | Authors' judgement | Support for judgement |
| Random sequence generation (selection bias) | Low risk | Computerised algorithm used |
| Allocation concealment (selection bias) | Low risk | Central allocation; see Appendix 6 |
| Baseline outcome measurements | Unclear risk | No health outcomes collected at baseline |
| Baseline characteristics | Low risk | Regression used to control for differences in background characteristics |
| Blinding of outcome assessment (detection bias) | Unclear risk | Health outcomes collected by face‐to‐face survey; no information on blinding |
| Incomplete outcome data (attrition bias) | High risk | Very high. 62% of randomisation sample responded to 60‐month survey (64% of intervention group and 60% of control group). Most disadvantaged more likely to drop out. Administrative data showed that survey data overestimated impact on earnings, although estimate for ever employed in year 5 was not biased. Weighting attempted but not successful; authors state findings should be treated with caution |
| Incomplete outcome data (outcome level) | Unclear risk | No information on item non‐response |
| Direct contamination | High risk | 5‐year data were collected between October 2008 and January 2009. During this period, lone parents with a youngest child aged ≥ 12 years (2008) and ≥ 7 years (October 2009) were transferred to Jobseekers' Allowance, which is a conditional out‐of‐work benefit. They were therefore required to prove that they were actively seeking work. It is not clear what proportion of the sample were affected by these changes. |
| Indirect contamination | Unclear risk | Attitudes to welfare changed during this period |
| Selective reporting (reporting bias) | Unclear risk | No study protocol available |
AFDC: Aid to Families with Dependent Children; AP: anti‐poverty; audio‐CASI: audio‐enhanced, computer‐assisted self‐interviewing; BPI: Behavior Problems Index; CES‐D: Center for Epidemiologic Studies Depression Scale; CIDI: Composite International Diagnostic Interview; CR: caseload reduction; ESL: English as a second language; FIP: family independence payment; GED: general education development; HCD: human capital development; IA: income assistance; LFA: labour force attachment; MFIP: Minnesota Family Investment Program; NA: not applicable; NDLP: New Deal for Lone Parents; TANF: Temporary Assistance for Needy Families; WtW: welfare to work.
Characteristics of excluded studies [ordered by study ID]
Jump to:
| Study | Reason for exclusion |
| No relevant outcomes | |
| Not a randomised control trial | |
| No health outcomes | |
| Not a randomised control trial | |
| Not welfare to work | |
| Not welfare to work | |
| Not welfare to work | |
| Not welfare to work | |
| Not a randomised control trial | |
| No health outcomes | |
| Not a randomised control trial | |
| No health outcomes | |
| Not a randomised control trial | |
| No health outcomes | |
| Inappropriate population | |
| Inappropriate population | |
| No health outcomes | |
| Not a randomised control trial | |
| Review | |
| Not a randomised control trial | |
| Not welfare to work | |
| Aimed at teenage parents | |
| Not a randomised control trial | |
| No relevant outcomes | |
| Not a randomised control trial | |
| No health outcomes | |
| Low proportion of lone parents | |
| No health outcomes | |
| No health outcomes | |
| Not a randomised control trial | |
| Not a primary study | |
| Not a randomised control trial | |
| Not lone parents | |
| No health outcomes | |
| Not welfare to work | |
| Not welfare to work | |
| Not welfare to work | |
| No health outcomes | |
| No relevant outcomes | |
| Aimed at teenage parents | |
| Not lone parents | |
| Aimed at teenage parents | |
| Population unclear | |
| No relevant outcomes | |
| Not a randomised control trial | |
| Not a randomised control trial | |
| Review |
Data and analyses
| Outcome or subgroup title | No. of studies | No. of participants | Statistical method | Effect size |
| 1 Maternal mental health continuous Show forest plot | 2 | 3352 | Std. Mean Difference (IV, Random, 95% CI) | 0.07 [0.00, 0.14] |
| Analysis 1.1  Comparison 1 Time point 1 Maternal mental health, Outcome 1 Maternal mental health continuous. | ||||
| 1.1 CES‐D mean score (0‐60) | 1 | 590 | Std. Mean Difference (IV, Random, 95% CI) | 0.0 [‐0.16, 0.16] |
| 1.2 CES‐D mean score (0‐36) | 1 | 2762 | Std. Mean Difference (IV, Random, 95% CI) | 0.08 [0.01, 0.16] |
| 2 Maternal mental health dichotomous Show forest plot | 3 | Risk Ratio (M‐H, Random, 95% CI) | Subtotals only | |
| Analysis 1.2  Comparison 1 Time point 1 Maternal mental health, Outcome 2 Maternal mental health dichotomous. | ||||
| 2.1 Presence of mood disorders (University of Michigan, Composite International Diagnostic Interview) (%) | 1 | 148 | Risk Ratio (M‐H, Random, 95% CI) | 0.99 [0.50, 1.99] |
| 2.2 CES‐D at risk (% ≥ 16/60) | 1 | 311 | Risk Ratio (M‐H, Random, 95% CI) | 1.18 [0.80, 1.74] |
| 2.3 CIDI at risk (% threshold not reported) | 1 | 308 | Risk Ratio (M‐H, Random, 95% CI) | 1.21 [0.72, 2.06] |
| Outcome or subgroup title | No. of studies | No. of participants | Statistical method | Effect size | |||||||||||||||||||||
| 1 Maternal mental health continuous Show forest plot | 3 | 7091 | Std. Mean Difference (IV, Random, 95% CI) | 0.00 [‐0.05, 0.05] | |||||||||||||||||||||
| Analysis 2.1 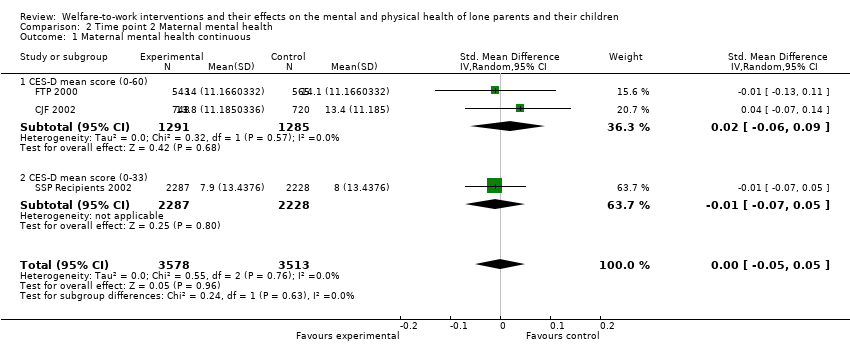 Comparison 2 Time point 2 Maternal mental health, Outcome 1 Maternal mental health continuous. | |||||||||||||||||||||||||
| 1.1 CES‐D mean score (0‐60) | 2 | 2576 | Std. Mean Difference (IV, Random, 95% CI) | 0.02 [‐0.06, 0.09] | |||||||||||||||||||||
| 1.2 CES‐D mean score (0‐33) | 1 | 4515 | Std. Mean Difference (IV, Random, 95% CI) | ‐0.01 [‐0.07, 0.05] | |||||||||||||||||||||
| 2 CJF GUP CES‐D mean score (0‐60) Show forest plot | Other data | No numeric data | |||||||||||||||||||||||
| Analysis 2.2
Comparison 2 Time point 2 Maternal mental health, Outcome 2 CJF GUP CES‐D mean score (0‐60). | |||||||||||||||||||||||||
| 3 Maternal mental health dichotomous Show forest plot | 2 | Risk Ratio (M‐H, Random, 95% CI) | Subtotals only | ||||||||||||||||||||||
| Analysis 2.3  Comparison 2 Time point 2 Maternal mental health, Outcome 3 Maternal mental health dichotomous. | |||||||||||||||||||||||||
| 3.1 Unhappy, sad or depressed very often or fairly often (%) | 1 | 2242 | Risk Ratio (M‐H, Random, 95% CI) | 1.06 [0.95, 1.18] | |||||||||||||||||||||
| 3.2 CES‐D at high risk (% ≥ 23/60) | 1 | 1900 | Risk Ratio (M‐H, Random, 95% CI) | 1.00 [0.85, 1.18] | |||||||||||||||||||||
| Outcome or subgroup title | No. of studies | No. of participants | Statistical method | Effect size |
| 1 Maternal mental health continuous Show forest plot | 4 | 8904 | Std. Mean Difference (IV, Random, 95% CI) | ‐0.07 [‐0.15, 0.00] |
| Analysis 3.1 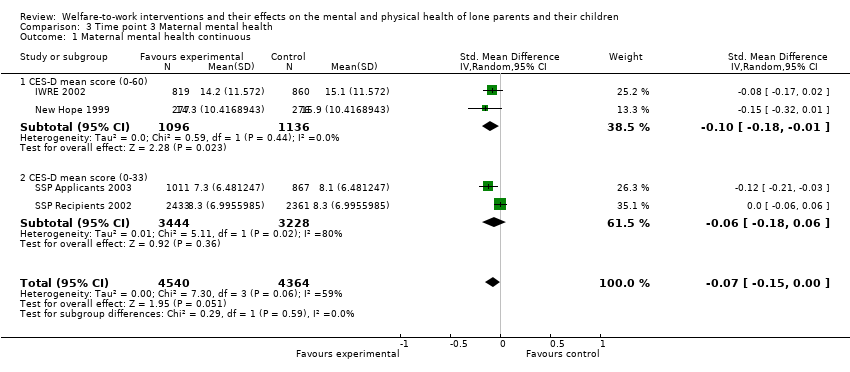 Comparison 3 Time point 3 Maternal mental health, Outcome 1 Maternal mental health continuous. | ||||
| 1.1 CES‐D mean score (0‐60) | 2 | 2232 | Std. Mean Difference (IV, Random, 95% CI) | ‐0.10 [‐0.18, ‐0.01] |
| 1.2 CES‐D mean score (0‐33) | 2 | 6672 | Std. Mean Difference (IV, Random, 95% CI) | ‐0.06 [‐0.18, 0.06] |
| 2 Maternal mental health dichotomous Show forest plot | 2 | Risk Ratio (M‐H, Random, 95% CI) | Subtotals only | |
| Analysis 3.2 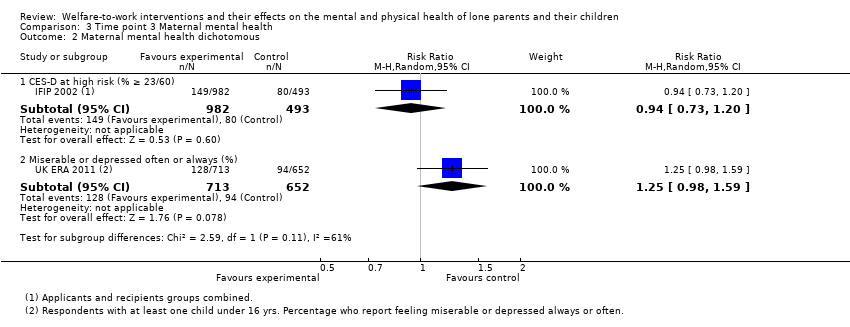 Comparison 3 Time point 3 Maternal mental health, Outcome 2 Maternal mental health dichotomous. | ||||
| 2.1 CES‐D at high risk (% ≥ 23/60) | 1 | 1475 | Risk Ratio (M‐H, Random, 95% CI) | 0.94 [0.73, 1.20] |
| 2.2 Miserable or depressed often or always (%) | 1 | 1365 | Risk Ratio (M‐H, Random, 95% CI) | 1.25 [0.98, 1.59] |
| Outcome or subgroup title | No. of studies | No. of participants | Statistical method | Effect size |
| 1 In poor health (%) Show forest plot | 1 | 311 | Risk Ratio (M‐H, Random, 95% CI) | 0.85 [0.54, 1.36] |
| Analysis 4.1 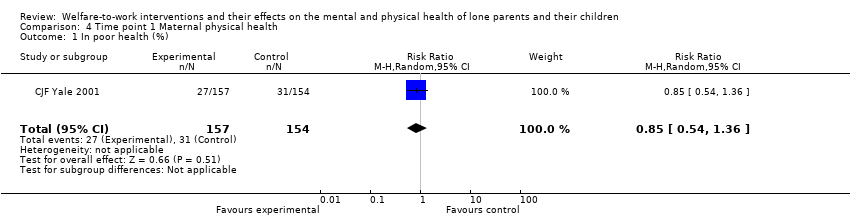 Comparison 4 Time point 1 Maternal physical health, Outcome 1 In poor health (%). | ||||
| Outcome or subgroup title | No. of studies | No. of participants | Statistical method | Effect size |
| 1 In good or excellent health (%) Show forest plot | 2 | 2551 | Risk Ratio (M‐H, Random, 95% CI) | 1.06 [0.95, 1.18] |
| Analysis 5.1  Comparison 5 Time point 2 Maternal physical health, Outcome 1 In good or excellent health (%). | ||||
| Outcome or subgroup title | No. of studies | No. of participants | Statistical method | Effect size |
| 1 Self‐reported health (1‐5) Show forest plot | 1 | 553 | Std. Mean Difference (IV, Random, 95% CI) | 0.16 [‐0.01, 0.33] |
| Analysis 6.1 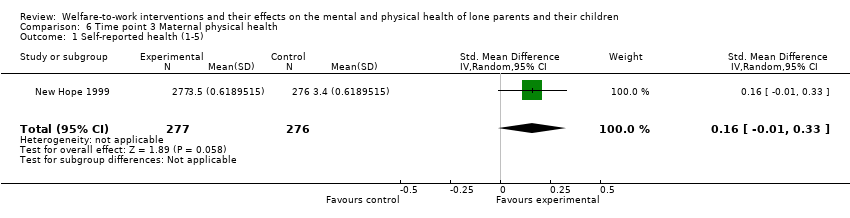 Comparison 6 Time point 3 Maternal physical health, Outcome 1 Self‐reported health (1‐5). | ||||
| 2 In good or very good health (%) Show forest plot | 1 | 1854 | Risk Ratio (M‐H, Random, 95% CI) | 0.97 [0.91, 1.04] |
| Analysis 6.2  Comparison 6 Time point 3 Maternal physical health, Outcome 2 In good or very good health (%). | ||||
| Outcome or subgroup title | No. of studies | No. of participants | Statistical method | Effect size |
| 1 Child behaviour problems continuous Show forest plot | 2 | Std. Mean Difference (IV, Random, 95% CI) | Subtotals only | |
| Analysis 7.1  Comparison 7 Time point 1 Child mental health, Outcome 1 Child behaviour problems continuous. | ||||
| 1.1 Problem Behavior Scale (1‐5) | 1 | 563 | Std. Mean Difference (IV, Random, 95% CI) | ‐0.17 [‐0.34, ‐0.01] |
| 1.2 Behavior Problems Index (0‐2) | 1 | 2762 | Std. Mean Difference (IV, Random, 95% CI) | 0.01 [‐0.06, 0.09] |
| 2 Child behaviour problems dichotomous Show forest plot | 2 | Risk Ratio (M‐H, Random, 95% CI) | Subtotals only | |
| Analysis 7.2  Comparison 7 Time point 1 Child mental health, Outcome 2 Child behaviour problems dichotomous. | ||||
| 2.1 One or more behavior disorders (Survey Diagnostic Instrument) (%) | 1 | 178 | Risk Ratio (M‐H, Random, 95% CI) | 1.58 [0.48, 5.24] |
| 2.2 Behavior Problems Index (% with problems) | 1 | 311 | Risk Ratio (M‐H, Random, 95% CI) | 1.58 [0.92, 2.72] |
| Outcome or subgroup title | No. of studies | No. of participants | Statistical method | Effect size | ||||||||||||||||||
| 1 Child behaviour problems continuous Show forest plot | 5 | 7560 | Std. Mean Difference (IV, Random, 95% CI) | ‐0.04 [‐0.08, 0.01] | ||||||||||||||||||
| Analysis 8.1 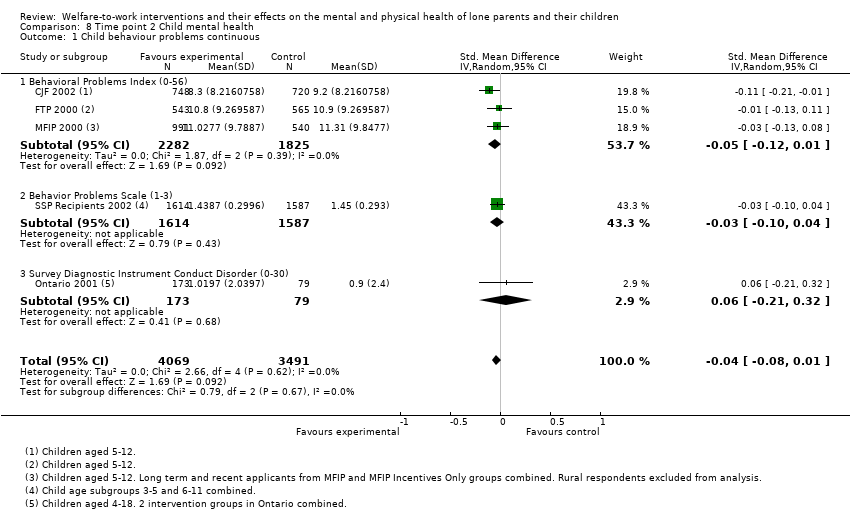 Comparison 8 Time point 2 Child mental health, Outcome 1 Child behaviour problems continuous. | ||||||||||||||||||||||
| 1.1 Behavioral Problems Index (0‐56) | 3 | 4107 | Std. Mean Difference (IV, Random, 95% CI) | ‐0.05 [‐0.12, 0.01] | ||||||||||||||||||
| 1.2 Behavior Problems Scale (1‐3) | 1 | 3201 | Std. Mean Difference (IV, Random, 95% CI) | ‐0.03 [‐0.10, 0.04] | ||||||||||||||||||
| 1.3 Survey Diagnostic Instrument Conduct Disorder (0‐30) | 1 | 252 | Std. Mean Difference (IV, Random, 95% CI) | 0.06 [‐0.21, 0.32] | ||||||||||||||||||
| 2 Adolescent mental health dichotomous Show forest plot | 1 | Risk Ratio (M‐H, Random, 95% CI) | Subtotals only | |||||||||||||||||||
| Analysis 8.2 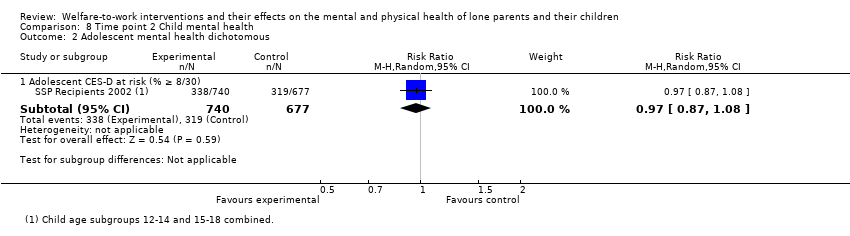 Comparison 8 Time point 2 Child mental health, Outcome 2 Adolescent mental health dichotomous. | ||||||||||||||||||||||
| 2.1 Adolescent CES‐D at risk (% ≥ 8/30) | 1 | 1417 | Risk Ratio (M‐H, Random, 95% CI) | 0.97 [0.87, 1.08] | ||||||||||||||||||
| 3 Child Behavior Checklist (1‐3) Show forest plot | Other data | No numeric data | ||||||||||||||||||||
| Analysis 8.3
Comparison 8 Time point 2 Child mental health, Outcome 3 Child Behavior Checklist (1‐3). | ||||||||||||||||||||||
| Outcome or subgroup title | No. of studies | No. of participants | Statistical method | Effect size | ||||||||||||||||||||||||||||
| 1 Child behaviour problems continuous Show forest plot | 3 | 3643 | Std. Mean Difference (IV, Random, 95% CI) | ‐0.05 [‐0.16, 0.05] | ||||||||||||||||||||||||||||
| Analysis 9.1  Comparison 9 Time point 3 Child mental health, Outcome 1 Child behaviour problems continuous. | ||||||||||||||||||||||||||||||||
| 1.1 Behavior Problems Scale (1‐3) | 1 | 1134 | Std. Mean Difference (IV, Random, 95% CI) | 0.04 [‐0.07, 0.16] | ||||||||||||||||||||||||||||
| 1.2 Behavioral Problems Index (0‐56) | 1 | 1679 | Std. Mean Difference (IV, Random, 95% CI) | ‐0.07 [‐0.16, 0.03] | ||||||||||||||||||||||||||||
| 1.3 Problem Behavior Scale (1‐5) | 1 | 830 | Std. Mean Difference (IV, Random, 95% CI) | ‐0.15 [‐0.29, ‐0.02] | ||||||||||||||||||||||||||||
| 2 Child behaviour problem continuous excluding SSP Applicants Show forest plot | 2 | 2509 | Std. Mean Difference (IV, Random, 95% CI) | ‐0.10 [‐0.18, ‐0.01] | ||||||||||||||||||||||||||||
| Analysis 9.2 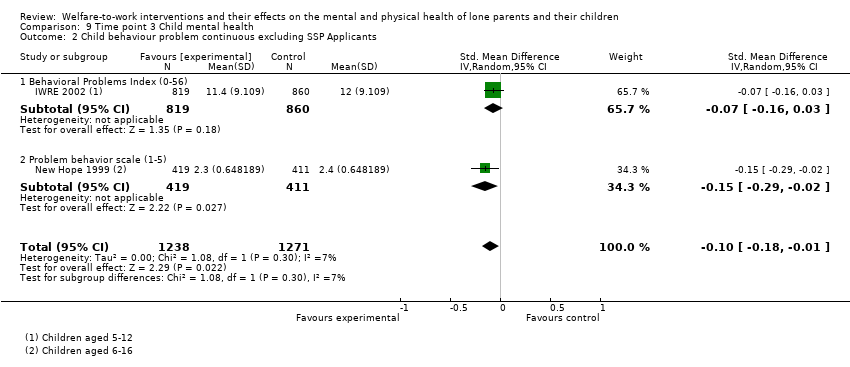 Comparison 9 Time point 3 Child mental health, Outcome 2 Child behaviour problem continuous excluding SSP Applicants. | ||||||||||||||||||||||||||||||||
| 2.1 Behavioral Problems Index (0‐56) | 1 | 1679 | Std. Mean Difference (IV, Random, 95% CI) | ‐0.07 [‐0.16, 0.03] | ||||||||||||||||||||||||||||
| 2.2 Problem behavior scale (1‐5) | 1 | 830 | Std. Mean Difference (IV, Random, 95% CI) | ‐0.15 [‐0.29, ‐0.02] | ||||||||||||||||||||||||||||
| 3 NEWWS 2001 Child mental health Show forest plot | 1 | Std. Mean Difference (IV, Random, 95% CI) | Subtotals only | |||||||||||||||||||||||||||||
| Analysis 9.3 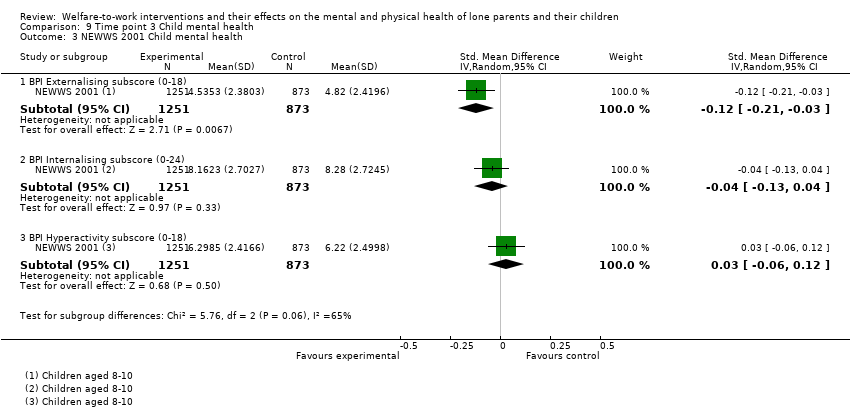 Comparison 9 Time point 3 Child mental health, Outcome 3 NEWWS 2001 Child mental health. | ||||||||||||||||||||||||||||||||
| 3.1 BPI Externalising subscore (0‐18) | 1 | 2124 | Std. Mean Difference (IV, Random, 95% CI) | ‐0.12 [‐0.21, ‐0.03] | ||||||||||||||||||||||||||||
| 3.2 BPI Internalising subscore (0‐24) | 1 | 2124 | Std. Mean Difference (IV, Random, 95% CI) | ‐0.04 [‐0.13, 0.04] | ||||||||||||||||||||||||||||
| 3.3 BPI Hyperactivity subscore (0‐18) | 1 | 2124 | Std. Mean Difference (IV, Random, 95% CI) | 0.03 [‐0.06, 0.12] | ||||||||||||||||||||||||||||
| 4 IFIP Behavioral Problems Index (0‐56) Show forest plot | Other data | No numeric data | ||||||||||||||||||||||||||||||
| Analysis 9.4
Comparison 9 Time point 3 Child mental health, Outcome 4 IFIP Behavioral Problems Index (0‐56). | ||||||||||||||||||||||||||||||||
| 5 SSP‐R T3 Behavior Problems Scale (1‐3) Show forest plot | Other data | No numeric data | ||||||||||||||||||||||||||||||
| Analysis 9.5
Comparison 9 Time point 3 Child mental health, Outcome 5 SSP‐R T3 Behavior Problems Scale (1‐3). | ||||||||||||||||||||||||||||||||
| Outcome or subgroup title | No. of studies | No. of participants | Statistical method | Effect size |
| 1 General health rating (1‐5) Show forest plot | 1 | 2762 | Std. Mean Difference (IV, Random, 95% CI) | ‐0.05 [‐0.12, 0.03] |
| Analysis 10.1 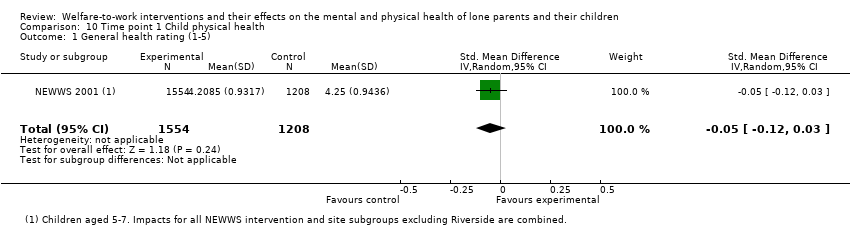 Comparison 10 Time point 1 Child physical health, Outcome 1 General health rating (1‐5). | ||||
| Outcome or subgroup title | No. of studies | No. of participants | Statistical method | Effect size |
| 1 Child physical health continuous Show forest plot | 3 | 7195 | Std. Mean Difference (IV, Random, 95% CI) | 0.07 [0.01, 0.12] |
| Analysis 11.1  Comparison 11 Time point 2 Child physical health, Outcome 1 Child physical health continuous. | ||||
| 1.1 General health scale (1‐5) | 2 | 2577 | Std. Mean Difference (IV, Random, 95% CI) | 0.11 [0.03, 0.19] |
| 1.2 Child average health scale (1‐5 across 4‐item instrument) | 1 | 4618 | Std. Mean Difference (IV, Random, 95% CI) | 0.03 [‐0.03, 0.09] |
| 2 Child physical health dichotomous Show forest plot | 1 | Risk Ratio (M‐H, Random, 95% CI) | Subtotals only | |
| Analysis 11.2 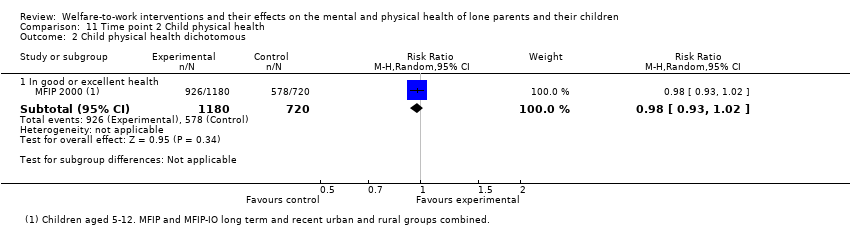 Comparison 11 Time point 2 Child physical health, Outcome 2 Child physical health dichotomous. | ||||
| 2.1 In good or excellent health | 1 | 1900 | Risk Ratio (M‐H, Random, 95% CI) | 0.98 [0.93, 1.02] |
| Outcome or subgroup title | No. of studies | No. of participants | Statistical method | Effect size |
| 1 Child physical health continuous Show forest plot | 5 | 8083 | Std. Mean Difference (IV, Random, 95% CI) | 0.01 [‐0.04, 0.06] |
| Analysis 12.1 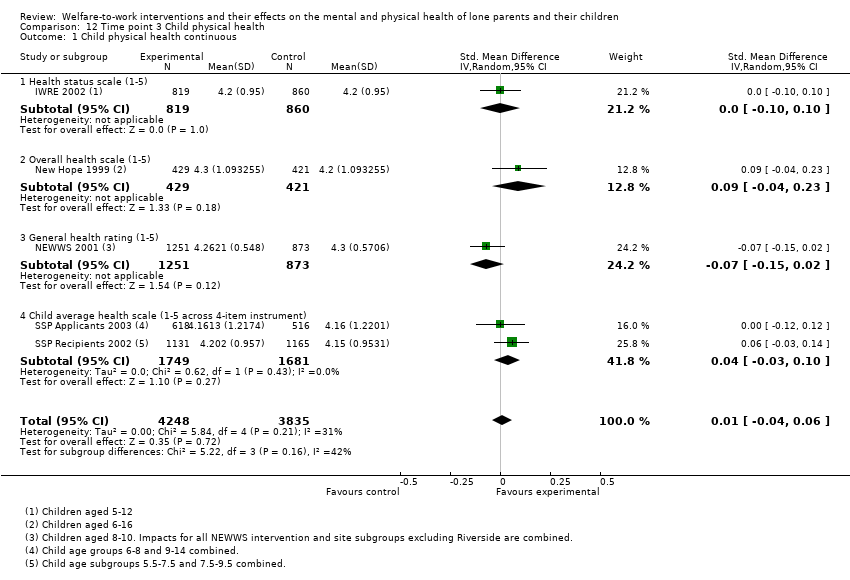 Comparison 12 Time point 3 Child physical health, Outcome 1 Child physical health continuous. | ||||
| 1.1 Health status scale (1‐5) | 1 | 1679 | Std. Mean Difference (IV, Random, 95% CI) | 0.0 [‐0.10, 0.10] |
| 1.2 Overall health scale (1‐5) | 1 | 850 | Std. Mean Difference (IV, Random, 95% CI) | 0.09 [‐0.04, 0.23] |
| 1.3 General health rating (1‐5) | 1 | 2124 | Std. Mean Difference (IV, Random, 95% CI) | ‐0.07 [‐0.15, 0.02] |
| 1.4 Child average health scale (1‐5 across 4‐item instrument) | 2 | 3430 | Std. Mean Difference (IV, Random, 95% CI) | 0.04 [‐0.03, 0.10] |
| 2 Child physical health dichotomous Show forest plot | 1 | Risk Ratio (M‐H, Random, 95% CI) | Subtotals only | |
| Analysis 12.2  Comparison 12 Time point 3 Child physical health, Outcome 2 Child physical health dichotomous. | ||||
| 2.1 In fair or poor health (%) | 1 | 1475 | Risk Ratio (M‐H, Random, 95% CI) | 1.26 [0.73, 2.14] |
| Outcome or subgroup title | No. of studies | No. of participants | Statistical method | Effect size |
| 1 Currently employed (%) Show forest plot | 3 | 3381 | Risk Ratio (M‐H, Random, 95% CI) | 1.22 [1.12, 1.32] |
| Analysis 13.1  Comparison 13 Time point 1 Employment status, Outcome 1 Currently employed (%). | ||||
| 2 Ever employed (%) Show forest plot | 3 | 3818 | Risk Ratio (M‐H, Random, 95% CI) | 1.14 [1.07, 1.21] |
| Analysis 13.2  Comparison 13 Time point 1 Employment status, Outcome 2 Ever employed (%). | ||||
| 2.1 Ever employed since randomisation (18 months) (%) | 1 | 311 | Risk Ratio (M‐H, Random, 95% CI) | 1.17 [1.03, 1.34] |
| 2.2 Ever employed year 2 (%) | 1 | 745 | Risk Ratio (M‐H, Random, 95% CI) | 1.09 [1.03, 1.15] |
| 2.3 Ever employed since randomisation (24 months) (%) | 1 | 2762 | Risk Ratio (M‐H, Random, 95% CI) | 1.17 [1.11, 1.24] |
| Outcome or subgroup title | No. of studies | No. of participants | Statistical method | Effect size |
| 1 Ever employed (%) Show forest plot | 5 | 12274 | Risk Ratio (M‐H, Random, 95% CI) | 1.13 [1.08, 1.19] |
| Analysis 14.1  Comparison 14 Time point 2 Employment status, Outcome 1 Ever employed (%). | ||||
| 1.1 Ever employed since randomisation (36 months) | 2 | 4845 | Risk Ratio (M‐H, Random, 95% CI) | 1.14 [1.03, 1.26] |
| 1.2 Average employment year of study | 2 | 2577 | Risk Ratio (M‐H, Random, 95% CI) | 1.10 [1.03, 1.17] |
| 1.3 Employed at 33 months | 1 | 4852 | Risk Ratio (M‐H, Random, 95% CI) | 1.19 [1.10, 1.28] |
| 2 Ever employed full‐time since randomisation (%) Show forest plot | 3 | 9806 | Risk Ratio (M‐H, Random, 95% CI) | 1.20 [1.05, 1.37] |
| Analysis 14.2 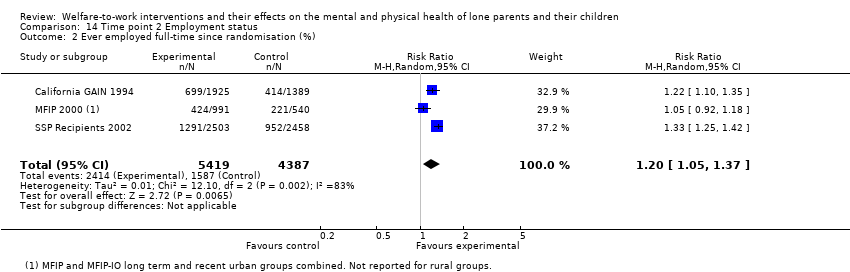 Comparison 14 Time point 2 Employment status, Outcome 2 Ever employed full‐time since randomisation (%). | ||||
| 3 Ever employed full‐time excluding MFIP (%) Show forest plot | 2 | 8275 | Risk Ratio (M‐H, Random, 95% CI) | 1.29 [1.18, 1.40] |
| Analysis 14.3  Comparison 14 Time point 2 Employment status, Outcome 3 Ever employed full‐time excluding MFIP (%). | ||||
| 4 Employed part‐time (%) Show forest plot | 3 | Risk Ratio (M‐H, Random, 95% CI) | Subtotals only | |
| Analysis 14.4 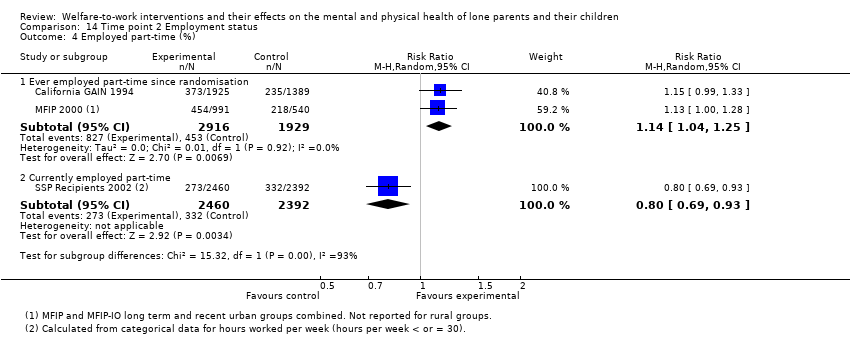 Comparison 14 Time point 2 Employment status, Outcome 4 Employed part‐time (%). | ||||
| 4.1 Ever employed part‐time since randomisation | 2 | 4845 | Risk Ratio (M‐H, Random, 95% CI) | 1.14 [1.04, 1.25] |
| 4.2 Currently employed part‐time | 1 | 4852 | Risk Ratio (M‐H, Random, 95% CI) | 0.80 [0.69, 0.93] |
| Outcome or subgroup title | No. of studies | No. of participants | Statistical method | Effect size |
| 1 Currently employed (%) Show forest plot | 6 | 14355 | Risk Ratio (M‐H, Random, 95% CI) | 1.03 [0.99, 1.07] |
| Analysis 15.1  Comparison 15 Time point 3 Employment status, Outcome 1 Currently employed (%). | ||||
| 2 Ever employed (%) Show forest plot | 3 | Risk Ratio (M‐H, Random, 95% CI) | Subtotals only | |
| Analysis 15.2 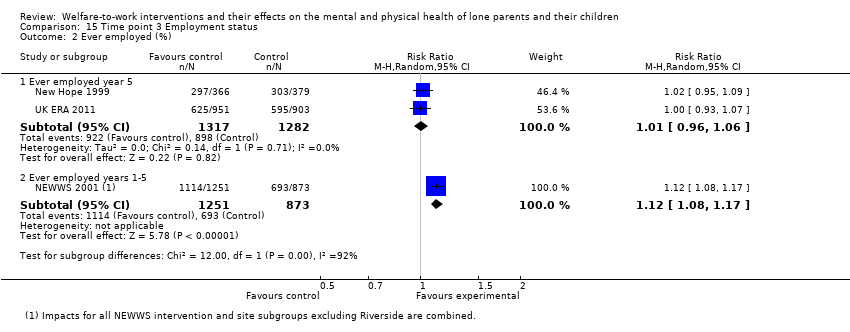 Comparison 15 Time point 3 Employment status, Outcome 2 Ever employed (%). | ||||
| 2.1 Ever employed year 5 | 2 | 2599 | Risk Ratio (M‐H, Random, 95% CI) | 1.01 [0.96, 1.06] |
| 2.2 Ever employed years 1‐5 | 1 | 2124 | Risk Ratio (M‐H, Random, 95% CI) | 1.12 [1.08, 1.17] |
| 3 Currently employed full‐time (%) Show forest plot | 6 | 13233 | Risk Ratio (M‐H, Random, 95% CI) | 1.05 [1.00, 1.12] |
| Analysis 15.3 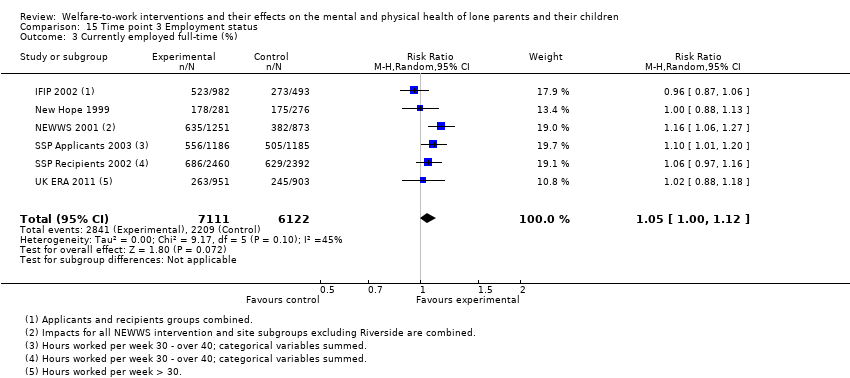 Comparison 15 Time point 3 Employment status, Outcome 3 Currently employed full‐time (%). | ||||
| 4 Currently employed part‐time (%) Show forest plot | 5 | 12676 | Risk Ratio (M‐H, Random, 95% CI) | 0.93 [0.85, 1.01] |
| Analysis 15.4  Comparison 15 Time point 3 Employment status, Outcome 4 Currently employed part‐time (%). | ||||
| Outcome or subgroup title | No. of studies | No. of participants | Statistical method | Effect size | |||||||||||||||||||||||||||||||||||||||||||||||||
| 1 Total income Show forest plot | 2 | Std. Mean Difference (IV, Random, 95% CI) | Subtotals only | ||||||||||||||||||||||||||||||||||||||||||||||||||
| Analysis 16.1  Comparison 16 Time point 1 Income, Outcome 1 Total income. | |||||||||||||||||||||||||||||||||||||||||||||||||||||
| 1.1 Total income year 2 (USD) | 1 | 744 | Std. Mean Difference (IV, Random, 95% CI) | 0.11 [‐0.04, 0.25] | |||||||||||||||||||||||||||||||||||||||||||||||||
| 1.2 Total net household income in prior month (USD) | 1 | 2762 | Std. Mean Difference (IV, Random, 95% CI) | ‐0.08 [‐0.15, ‐0.00] | |||||||||||||||||||||||||||||||||||||||||||||||||
| 2 Earnings Show forest plot | 1 | Std. Mean Difference (IV, Random, 95% CI) | Subtotals only | ||||||||||||||||||||||||||||||||||||||||||||||||||
| Analysis 16.2  Comparison 16 Time point 1 Income, Outcome 2 Earnings. | |||||||||||||||||||||||||||||||||||||||||||||||||||||
| 2.1 Average annual earnings year 2 (USD) | 1 | 744 | Std. Mean Difference (IV, Random, 95% CI) | 0.07 [‐0.08, 0.21] | |||||||||||||||||||||||||||||||||||||||||||||||||
| 3 NEWWS T1 Average earnings previous month (USD) Show forest plot | Other data | No numeric data | |||||||||||||||||||||||||||||||||||||||||||||||||||
| Analysis 16.3
Comparison 16 Time point 1 Income, Outcome 3 NEWWS T1 Average earnings previous month (USD). | |||||||||||||||||||||||||||||||||||||||||||||||||||||
| Outcome or subgroup title | No. of studies | No. of participants | Statistical method | Effect size | ||||||||||||||||||||||||||||||||||||||||||||||||||||||
| 1 Total income Show forest plot | 4 | 8934 | Std. Mean Difference (IV, Random, 95% CI) | 0.10 [0.02, 0.17] | ||||||||||||||||||||||||||||||||||||||||||||||||||||||
| Analysis 17.1  Comparison 17 Time point 2 Income, Outcome 1 Total income. | ||||||||||||||||||||||||||||||||||||||||||||||||||||||||||
| 1.1 Average annual income (benefits, earnings and food stamps) years 3‐4 (USD) | 1 | 1469 | Std. Mean Difference (IV, Random, 95% CI) | ‐0.01 [‐0.11, 0.09] | ||||||||||||||||||||||||||||||||||||||||||||||||||||||
| 1.2 Average total income (benefits, earnings and food stamps) year 4 (USD) | 1 | 1108 | Std. Mean Difference (IV, Random, 95% CI) | 0.08 [‐0.04, 0.20] | ||||||||||||||||||||||||||||||||||||||||||||||||||||||
| 1.3 Average annual income (benefits and earnings) year 3 (USD) | 1 | 1531 | Std. Mean Difference (IV, Random, 95% CI) | 0.14 [0.03, 0.24] | ||||||||||||||||||||||||||||||||||||||||||||||||||||||
| 1.4 Total monthly individual income (average from all sources in 6 months prior to 3‐year survey) (CAD) | 1 | 4826 | Std. Mean Difference (IV, Random, 95% CI) | 0.15 [0.10, 0.21] | ||||||||||||||||||||||||||||||||||||||||||||||||||||||
| 2 Total income excluding CJF Show forest plot | 3 | 7465 | Std. Mean Difference (IV, Random, 95% CI) | 0.14 [0.09, 0.18] | ||||||||||||||||||||||||||||||||||||||||||||||||||||||
| Analysis 17.2 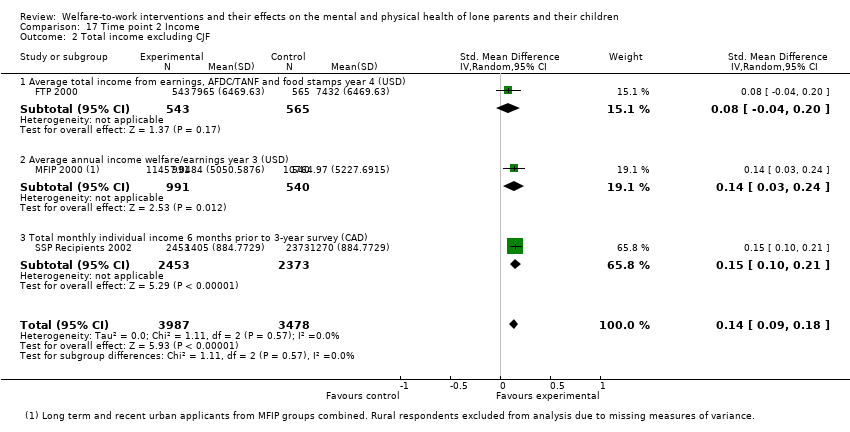 Comparison 17 Time point 2 Income, Outcome 2 Total income excluding CJF. | ||||||||||||||||||||||||||||||||||||||||||||||||||||||||||
| 2.1 Average total income from earnings, AFDC/TANF and food stamps year 4 (USD) | 1 | 1108 | Std. Mean Difference (IV, Random, 95% CI) | 0.08 [‐0.04, 0.20] | ||||||||||||||||||||||||||||||||||||||||||||||||||||||
| 2.2 Average annual income welfare/earnings year 3 (USD) | 1 | 1531 | Std. Mean Difference (IV, Random, 95% CI) | 0.14 [0.03, 0.24] | ||||||||||||||||||||||||||||||||||||||||||||||||||||||
| 2.3 Total monthly individual income 6 months prior to 3‐year survey (CAD) | 1 | 4826 | Std. Mean Difference (IV, Random, 95% CI) | 0.15 [0.10, 0.21] | ||||||||||||||||||||||||||||||||||||||||||||||||||||||
| 3 Average earnings in year of survey (USD) Show forest plot | 2 | 6321 | Std. Mean Difference (IV, Random, 95% CI) | 0.09 [0.04, 0.13] | ||||||||||||||||||||||||||||||||||||||||||||||||||||||
| Analysis 17.3  Comparison 17 Time point 2 Income, Outcome 3 Average earnings in year of survey (USD). | ||||||||||||||||||||||||||||||||||||||||||||||||||||||||||
| 4 MFIP Average annual earnings years 1‐3 (USD) Show forest plot | Other data | No numeric data | ||||||||||||||||||||||||||||||||||||||||||||||||||||||||
| Analysis 17.4
Comparison 17 Time point 2 Income, Outcome 4 MFIP Average annual earnings years 1‐3 (USD). | ||||||||||||||||||||||||||||||||||||||||||||||||||||||||||
| 5 GAIN Average weekly earnings since randomisation (USD) Show forest plot | Other data | No numeric data | ||||||||||||||||||||||||||||||||||||||||||||||||||||||||
| Analysis 17.5
Comparison 17 Time point 2 Income, Outcome 5 GAIN Average weekly earnings since randomisation (USD). | ||||||||||||||||||||||||||||||||||||||||||||||||||||||||||
| 6 FTP Average earnings in year of study (USD) Show forest plot | Other data | No numeric data | ||||||||||||||||||||||||||||||||||||||||||||||||||||||||
| Analysis 17.6
Comparison 17 Time point 2 Income, Outcome 6 FTP Average earnings in year of study (USD). | ||||||||||||||||||||||||||||||||||||||||||||||||||||||||||
| Outcome or subgroup title | No. of studies | No. of participants | Statistical method | Effect size | |||||||||||||||||||||||||||||||||||||||||||||||||
| 1 Total income Show forest plot | 5 | 11745 | Std. Mean Difference (IV, Random, 95% CI) | 0.01 [‐0.04, 0.06] | |||||||||||||||||||||||||||||||||||||||||||||||||
| Analysis 18.1 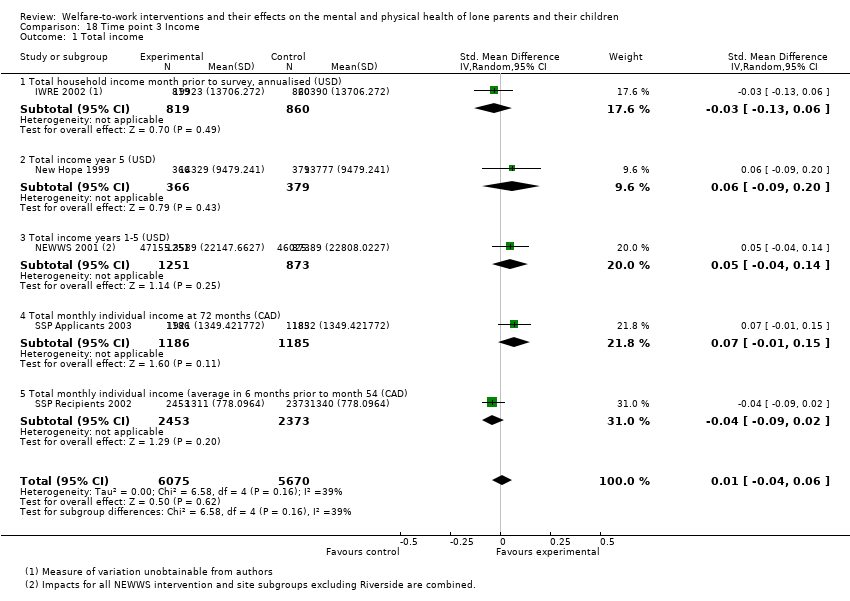 Comparison 18 Time point 3 Income, Outcome 1 Total income. | |||||||||||||||||||||||||||||||||||||||||||||||||||||
| 1.1 Total household income month prior to survey, annualised (USD) | 1 | 1679 | Std. Mean Difference (IV, Random, 95% CI) | ‐0.03 [‐0.13, 0.06] | |||||||||||||||||||||||||||||||||||||||||||||||||
| 1.2 Total income year 5 (USD) | 1 | 745 | Std. Mean Difference (IV, Random, 95% CI) | 0.06 [‐0.09, 0.20] | |||||||||||||||||||||||||||||||||||||||||||||||||
| 1.3 Total income years 1‐5 (USD) | 1 | 2124 | Std. Mean Difference (IV, Random, 95% CI) | 0.05 [‐0.04, 0.14] | |||||||||||||||||||||||||||||||||||||||||||||||||
| 1.4 Total monthly individual income at 72 months (CAD) | 1 | 2371 | Std. Mean Difference (IV, Random, 95% CI) | 0.07 [‐0.01, 0.15] | |||||||||||||||||||||||||||||||||||||||||||||||||
| 1.5 Total monthly individual income (average in 6 months prior to month 54 (CAD) | 1 | 4826 | Std. Mean Difference (IV, Random, 95% CI) | ‐0.04 [‐0.09, 0.02] | |||||||||||||||||||||||||||||||||||||||||||||||||
| 2 IFIP household income month prior to survey (USD) Show forest plot | Other data | No numeric data | |||||||||||||||||||||||||||||||||||||||||||||||||||
| Analysis 18.2
Comparison 18 Time point 3 Income, Outcome 2 IFIP household income month prior to survey (USD). | |||||||||||||||||||||||||||||||||||||||||||||||||||||
| 3 Total earnings Show forest plot | 5 | 11501 | Std. Mean Difference (IV, Random, 95% CI) | 0.04 [‐0.00, 0.07] | |||||||||||||||||||||||||||||||||||||||||||||||||
| Analysis 18.3  Comparison 18 Time point 3 Income, Outcome 3 Total earnings. | |||||||||||||||||||||||||||||||||||||||||||||||||||||
| 3.1 Average earnings year 5 (USD) | 1 | 745 | Std. Mean Difference (IV, Random, 95% CI) | 0.05 [‐0.09, 0.20] | |||||||||||||||||||||||||||||||||||||||||||||||||
| 3.2 Average earnings year 6 (CAD) | 1 | 2371 | Std. Mean Difference (IV, Random, 95% CI) | 0.08 [0.00, 0.16] | |||||||||||||||||||||||||||||||||||||||||||||||||
| 3.3 Average earnings year 5 (GBP) | 1 | 1854 | Std. Mean Difference (IV, Random, 95% CI) | 0.06 [‐0.04, 0.15] | |||||||||||||||||||||||||||||||||||||||||||||||||
| 3.4 Earnings month prior to survey, annualised (USD) | 1 | 1679 | Std. Mean Difference (IV, Random, 95% CI) | 0.01 [‐0.09, 0.11] | |||||||||||||||||||||||||||||||||||||||||||||||||
| 3.5 Monthly earnings year 5, quarter 18 (CAD) | 1 | 4852 | Std. Mean Difference (IV, Random, 95% CI) | 0.01 [‐0.05, 0.07] | |||||||||||||||||||||||||||||||||||||||||||||||||
| 4 IFIP Average earnings month prior to survey (USD) Show forest plot | Other data | No numeric data | |||||||||||||||||||||||||||||||||||||||||||||||||||
| Analysis 18.4
Comparison 18 Time point 3 Income, Outcome 4 IFIP Average earnings month prior to survey (USD). | |||||||||||||||||||||||||||||||||||||||||||||||||||||
| 5 NEWWS T3 Average earnings years 1‐5 (USD) Show forest plot | Other data | No numeric data | |||||||||||||||||||||||||||||||||||||||||||||||||||
| Analysis 18.5
Comparison 18 Time point 3 Income, Outcome 5 NEWWS T3 Average earnings years 1‐5 (USD). | |||||||||||||||||||||||||||||||||||||||||||||||||||||
| Outcome or subgroup title | No. of studies | No. of participants | Statistical method | Effect size |
| 1 Total AFDC received year 2 (USD) Show forest plot | 1 | 744 | Std. Mean Difference (IV, Random, 95% CI) | ‐0.10 [‐0.24, 0.04] |
| Analysis 19.1  Comparison 19 Time point 1 Welfare receipt, Outcome 1 Total AFDC received year 2 (USD). | ||||
| 2 Proportion of sample receiving welfare (%) Show forest plot | 3 | 3714 | Risk Ratio (M‐H, Random, 95% CI) | 0.88 [0.84, 0.92] |
| Analysis 19.2  Comparison 19 Time point 1 Welfare receipt, Outcome 2 Proportion of sample receiving welfare (%). | ||||
| 2.1 Received social assistance in last 12 months | 1 | 207 | Risk Ratio (M‐H, Random, 95% CI) | 0.85 [0.76, 0.97] |
| 2.2 Currently receiving AFDC | 1 | 2762 | Risk Ratio (M‐H, Random, 95% CI) | 0.87 [0.83, 0.92] |
| 2.3 Ever received AFDC/TANF year 2 | 1 | 745 | Risk Ratio (M‐H, Random, 95% CI) | 0.94 [0.84, 1.06] |
| Outcome or subgroup title | No. of studies | No. of participants | Statistical method | Effect size |
| 1 Average annual welfare benefit Show forest plot | 4 | 8960 | Std. Mean Difference (IV, Random, 95% CI) | ‐0.11 [‐0.36, 0.15] |
| Analysis 20.1 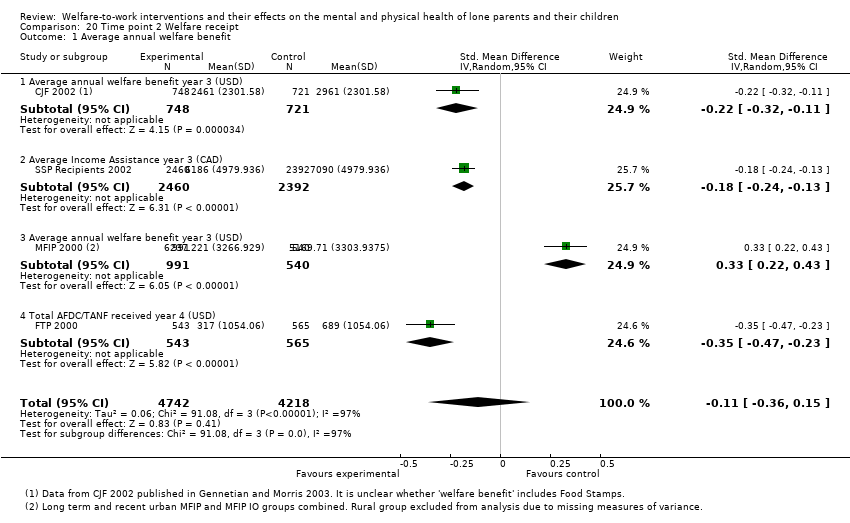 Comparison 20 Time point 2 Welfare receipt, Outcome 1 Average annual welfare benefit. | ||||
| 1.1 Average annual welfare benefit year 3 (USD) | 1 | 1469 | Std. Mean Difference (IV, Random, 95% CI) | ‐0.22 [‐0.32, ‐0.11] |
| 1.2 Average Income Assistance year 3 (CAD) | 1 | 4852 | Std. Mean Difference (IV, Random, 95% CI) | ‐0.18 [‐0.24, ‐0.13] |
| 1.3 Average annual welfare benefit year 3 (USD) | 1 | 1531 | Std. Mean Difference (IV, Random, 95% CI) | 0.33 [0.22, 0.43] |
| 1.4 Total AFDC/TANF received year 4 (USD) | 1 | 1108 | Std. Mean Difference (IV, Random, 95% CI) | ‐0.35 [‐0.47, ‐0.23] |
| 2 Average annual welfare benefit excluding MFIP Show forest plot | 3 | 7429 | Std. Mean Difference (IV, Random, 95% CI) | ‐0.24 [‐0.33, ‐0.15] |
| Analysis 20.2  Comparison 20 Time point 2 Welfare receipt, Outcome 2 Average annual welfare benefit excluding MFIP. | ||||
| 2.1 Average annual welfare benefit year 3 (USD) | 1 | 1469 | Std. Mean Difference (IV, Random, 95% CI) | ‐0.22 [‐0.32, ‐0.11] |
| 2.2 Total AFDC/TANF received year 4 (USD) | 1 | 1108 | Std. Mean Difference (IV, Random, 95% CI) | ‐0.35 [‐0.47, ‐0.23] |
| 2.3 Average Income Assistance year 3 (USD/CAD) | 1 | 4852 | Std. Mean Difference (IV, Random, 95% CI) | ‐0.18 [‐0.24, ‐0.13] |
| 3 Proportion of sample receiving welfare Show forest plot | 2 | 5210 | Risk Ratio (M‐H, Random, 95% CI) | 0.87 [0.83, 0.91] |
| Analysis 20.3  Comparison 20 Time point 2 Welfare receipt, Outcome 3 Proportion of sample receiving welfare. | ||||
| 3.1 Social assistance/unemployment insurance receipt year 4 (%) | 1 | 358 | Risk Ratio (M‐H, Random, 95% CI) | 0.90 [0.71, 1.14] |
| 3.2 Income Assistance receipt year 3 (%) | 1 | 4852 | Risk Ratio (M‐H, Random, 95% CI) | 0.87 [0.83, 0.90] |
| Outcome or subgroup title | No. of studies | No. of participants | Statistical method | Effect size | ||||||||||||||||||||||||||||
| 1 Total welfare benefit received Show forest plot | 4 | 9822 | Std. Mean Difference (IV, Random, 95% CI) | ‐0.06 [‐0.11, ‐0.00] | ||||||||||||||||||||||||||||
| Analysis 21.1  Comparison 21 Time point 3 Welfare receipt, Outcome 1 Total welfare benefit received. | ||||||||||||||||||||||||||||||||
| 1.1 Total AFDC/TANF receipt year 5 (USD) | 1 | 745 | Std. Mean Difference (IV, Random, 95% CI) | 0.01 [‐0.14, 0.15] | ||||||||||||||||||||||||||||
| 1.2 Average Income Assistance received year 6 (CAD) | 1 | 2371 | Std. Mean Difference (IV, Random, 95% CI) | ‐0.12 [‐0.20, ‐0.04] | ||||||||||||||||||||||||||||
| 1.3 Average Income Support received per wk (GBP) | 1 | 1854 | Std. Mean Difference (IV, Random, 95% CI) | 0.0 [‐0.09, 0.09] | ||||||||||||||||||||||||||||
| 1.4 Average Income Assistance received year 5 (CAD) | 1 | 4852 | Std. Mean Difference (IV, Random, 95% CI) | ‐0.07 [‐0.12, ‐0.01] | ||||||||||||||||||||||||||||
| 2 Total welfare payments years 1‐5 (USD) Show forest plot | 1 | 2124 | Std. Mean Difference (IV, Random, 95% CI) | ‐0.55 [‐0.63, ‐0.46] | ||||||||||||||||||||||||||||
| Analysis 21.2 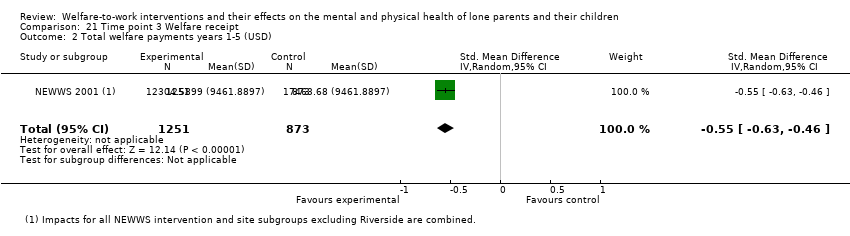 Comparison 21 Time point 3 Welfare receipt, Outcome 2 Total welfare payments years 1‐5 (USD). | ||||||||||||||||||||||||||||||||
| 3 IWRE TANF receipt month before survey, annualised year 5 (USD) Show forest plot | Other data | No numeric data | ||||||||||||||||||||||||||||||
| Analysis 21.3
Comparison 21 Time point 3 Welfare receipt, Outcome 3 IWRE TANF receipt month before survey, annualised year 5 (USD). | ||||||||||||||||||||||||||||||||
| 4 IFIP Average welfare received month prior to survey (USD) Show forest plot | Other data | No numeric data | ||||||||||||||||||||||||||||||
| Analysis 21.4
Comparison 21 Time point 3 Welfare receipt, Outcome 4 IFIP Average welfare received month prior to survey (USD). | ||||||||||||||||||||||||||||||||
| 5 Proportion of sample receiving welfare Show forest plot | 6 | 12976 | Risk Ratio (M‐H, Random, 95% CI) | 0.92 [0.86, 0.99] | ||||||||||||||||||||||||||||
| Analysis 21.5  Comparison 21 Time point 3 Welfare receipt, Outcome 5 Proportion of sample receiving welfare. | ||||||||||||||||||||||||||||||||
| 5.1 Currently receiving TANF (%) | 1 | 1679 | Risk Ratio (M‐H, Random, 95% CI) | 0.79 [0.67, 0.93] | ||||||||||||||||||||||||||||
| 5.2 Ever received AFDC/TANF year 5 (%) | 1 | 745 | Risk Ratio (M‐H, Random, 95% CI) | 0.91 [0.64, 1.29] | ||||||||||||||||||||||||||||
| 5.3 Currently receiving Income Support or Jobseeker's Allowance (%) | 1 | 1854 | Risk Ratio (M‐H, Random, 95% CI) | 0.98 [0.87, 1.11] | ||||||||||||||||||||||||||||
| 5.4 Currently receiving Family Independence Payment (%) | 1 | 1475 | Risk Ratio (M‐H, Random, 95% CI) | 1.09 [0.89, 1.33] | ||||||||||||||||||||||||||||
| 5.5 Currently receiving Income Assistance (%) | 1 | 2371 | Risk Ratio (M‐H, Random, 95% CI) | 0.84 [0.72, 0.98] | ||||||||||||||||||||||||||||
| 5.6 Currently receiving Income Assistance (%) | 1 | 4852 | Risk Ratio (M‐H, Random, 95% CI) | 0.94 [0.89, 0.99] | ||||||||||||||||||||||||||||
| Outcome or subgroup title | No. of studies | No. of participants | Statistical method | Effect size |
| 1 Respondent has health insurance (%) Show forest plot | 4 | Risk Ratio (M‐H, Random, 95% CI) | Subtotals only | |
| Analysis 22.1 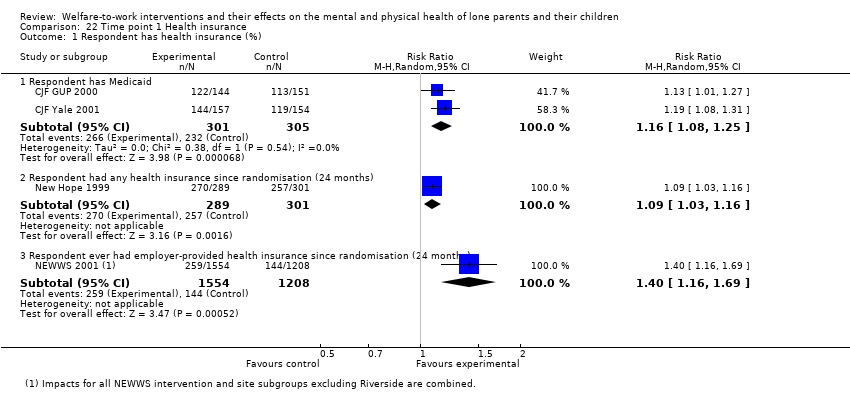 Comparison 22 Time point 1 Health insurance, Outcome 1 Respondent has health insurance (%). | ||||
| 1.1 Respondent has Medicaid | 2 | 606 | Risk Ratio (M‐H, Random, 95% CI) | 1.16 [1.08, 1.25] |
| 1.2 Respondent had any health insurance since randomisation (24 months) | 1 | 590 | Risk Ratio (M‐H, Random, 95% CI) | 1.09 [1.03, 1.16] |
| 1.3 Respondent ever had employer‐provided health insurance since randomisation (24 months) | 1 | 2762 | Risk Ratio (M‐H, Random, 95% CI) | 1.40 [1.16, 1.69] |
| 2 Child health insurance (%) Show forest plot | 1 | 2762 | Risk Ratio (M‐H, Random, 95% CI) | 0.99 [0.96, 1.01] |
| Analysis 22.2  Comparison 22 Time point 1 Health insurance, Outcome 2 Child health insurance (%). | ||||
| Outcome or subgroup title | No. of studies | No. of participants | Statistical method | Effect size |
| 1 Health insurance (%) Show forest plot | 2 | Risk Ratio (M‐H, Random, 95% CI) | Subtotals only | |
| Analysis 23.1 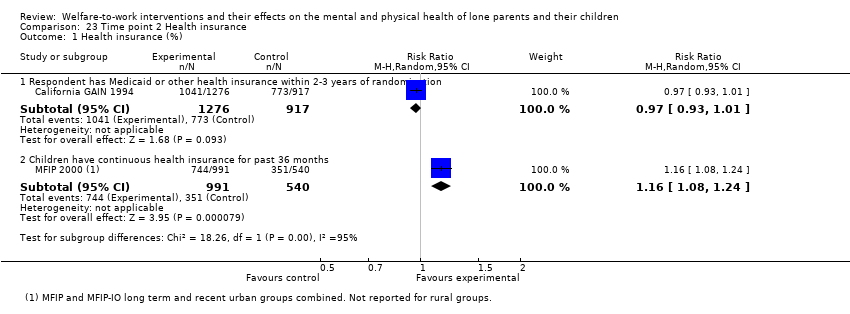 Comparison 23 Time point 2 Health insurance, Outcome 1 Health insurance (%). | ||||
| 1.1 Respondent has Medicaid or other health insurance within 2‐3 years of randomisation | 1 | 2193 | Risk Ratio (M‐H, Random, 95% CI) | 0.97 [0.93, 1.01] |
| 1.2 Children have continuous health insurance for past 36 months | 1 | 1531 | Risk Ratio (M‐H, Random, 95% CI) | 1.16 [1.08, 1.24] |
| Outcome or subgroup title | No. of studies | No. of participants | Statistical method | Effect size |
| 1 Health insurance Show forest plot | 3 | Risk Ratio (M‐H, Random, 95% CI) | Subtotals only | |
| Analysis 24.1  Comparison 24 Time point 3 Health insurance, Outcome 1 Health insurance. | ||||
| 1.1 Family has health insurance (%) | 2 | 3599 | Risk Ratio (M‐H, Random, 95% CI) | 0.98 [0.92, 1.05] |
| 1.2 Respondent has health insurance (%) | 1 | 561 | Risk Ratio (M‐H, Random, 95% CI) | 0.97 [0.91, 1.04] |
| 1.3 All focal children have health insurance (%) | 1 | 561 | Risk Ratio (M‐H, Random, 95% CI) | 0.95 [0.89, 1.02] |
| Outcome or subgroup title | No. of studies | No. of participants | Statistical method | Effect size | ||||||||||||||||||||||||||||||||||||||||||||||||||||||||||||||||||||||||||||||||
| 1 Maternal and child health outcomes Show forest plot | Other data | No numeric data | ||||||||||||||||||||||||||||||||||||||||||||||||||||||||||||||||||||||||||||||||||
| Analysis 25.1
Comparison 25 New Hope 96 months, Outcome 1 Maternal and child health outcomes. | ||||||||||||||||||||||||||||||||||||||||||||||||||||||||||||||||||||||||||||||||||||

Study flow diagram.
*An initial stage of screening reduced records from all other sources to 1609. The remaining records were then de‐duplicated against the Endnote library containing the electronic search results. Note this figure does not include publications found on websites without searchable databases.
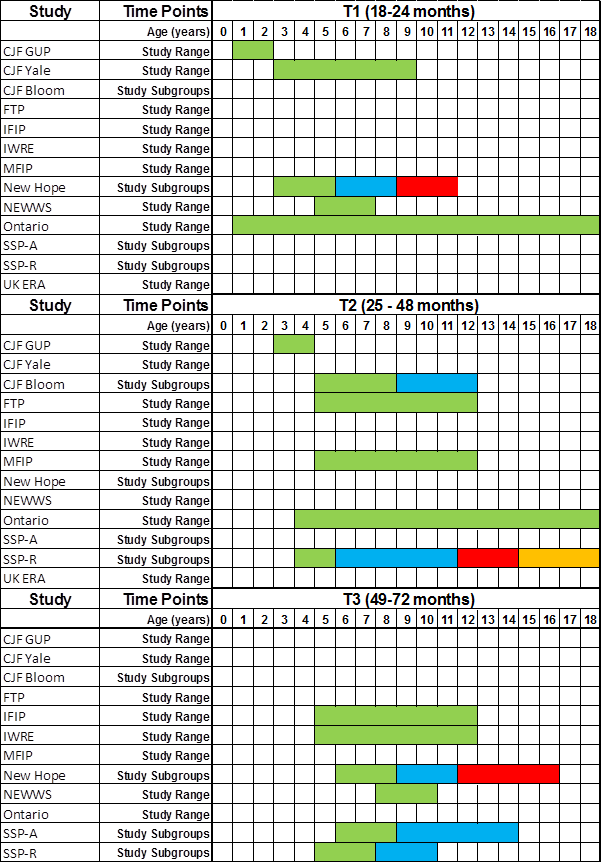
Age of children at time of data collection by time point
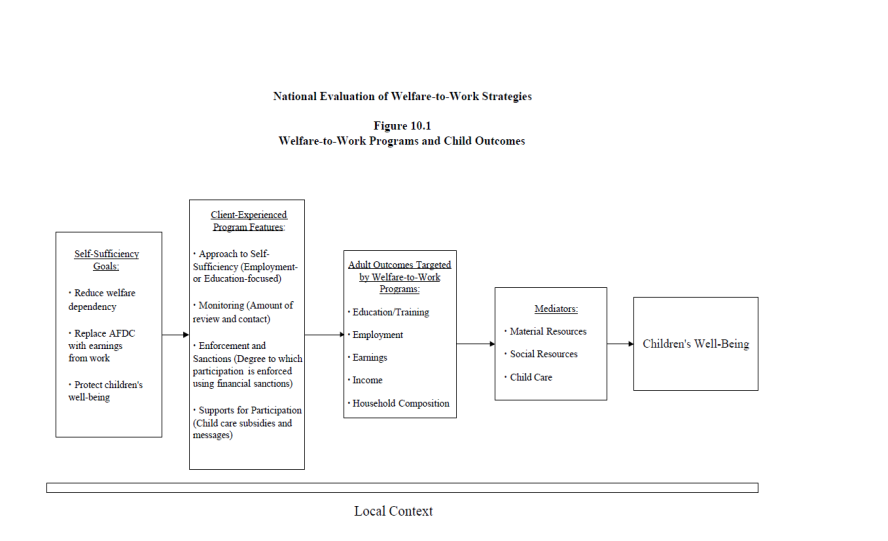
Example of study logic model from NEWWS 2001 Copyright © 2001 MDRC: reproduced with permission.
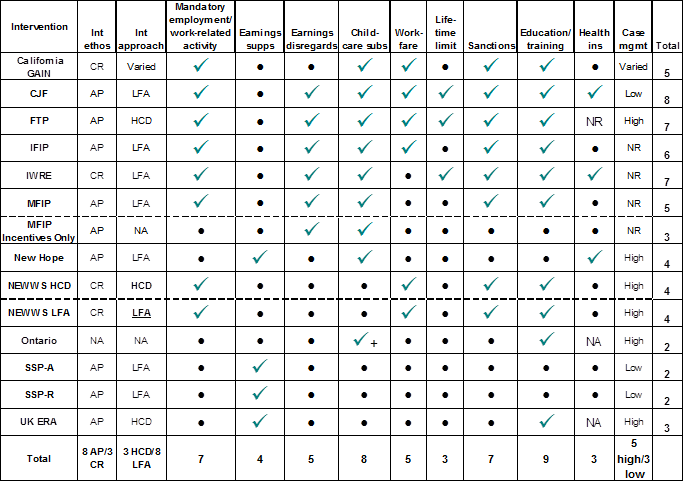
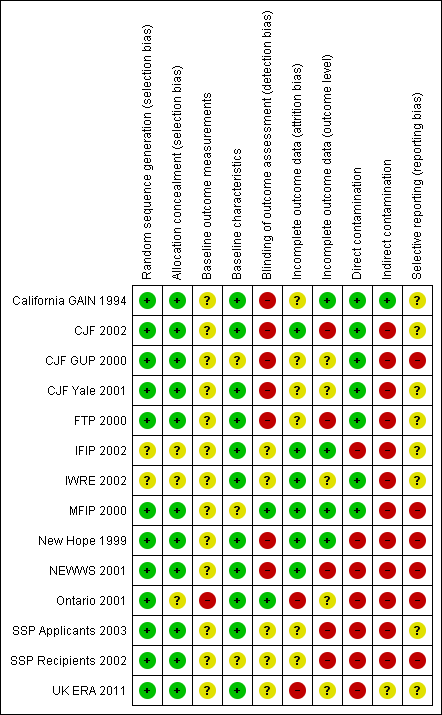
Risk of bias summary: review authors' judgements about each risk of bias item for each included study.

Risk of bias graph: review authors' judgements about each risk of bias item presented as percentages across all included studies.

Forest plot of comparison: 1 Time point 1 Maternal mental health, outcome: 1.1 Maternal mental health continuous.

Forest plot of comparison: 2 Time point 2 Maternal mental health, outcome: 2.1 Maternal mental health continuous.

Forest plot of comparison: 3 Time point 3 Maternal mental health, outcome: 3.1 Maternal mental health continuous.

Forest plot of comparison: 4 Time point 1 Maternal physical health, outcome: 4.1 In poor health (%).
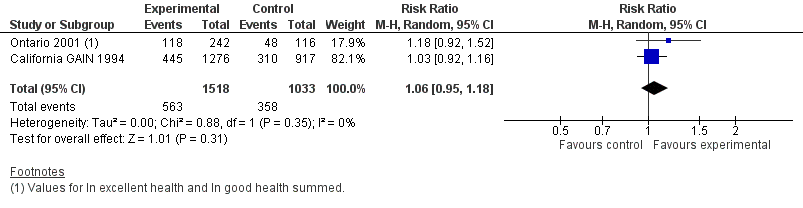
Forest plot of comparison: 5 Time point 2 Maternal physical health, outcome: 5.1 In good or excellent health %. Event defined as In good or excellent health.
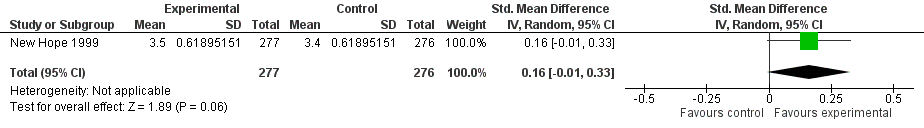
Forest plot of comparison: 6 Time point 3 Maternal physical health, outcome: 6.1 Self‐reported health (1‐5).

Forest plot of comparison: 7 Time point 1 Child mental health, outcome: 7.1 Child behaviour problems continuous.

Forest plot of comparison: 8 Time point 2 Child mental health, outcome: 8.1 Child behaviour problems continuous.
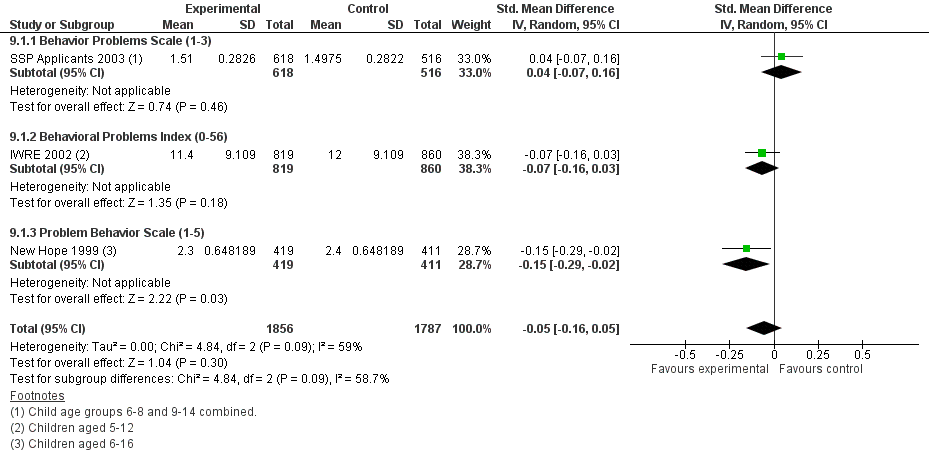
Forest plot of comparison: 9 Time point 3 Child mental health, outcome: 9.1 Child behaviour problems continuous.

Forest plot of comparison: 10 Time point 1 Child physical health, outcome: 10.1 General health rating (1‐5).

Forest plot of comparison: 11 Time point 2 Child physical health, outcome: 11.1 Child physical health continuous.

Forest plot of comparison: 12 Time point 3 Child physical health, outcome: 12.1 Child physical health continuous.
Comparison 1 Time point 1 Maternal mental health, Outcome 1 Maternal mental health continuous.
Comparison 1 Time point 1 Maternal mental health, Outcome 2 Maternal mental health dichotomous.
Comparison 2 Time point 2 Maternal mental health, Outcome 1 Maternal mental health continuous.
| Study | Intervention | Int n | Control | Cont n | Total n | Sig |
| CJF GUP 2000 | 15.5 | Not reported | 13.9 | Not reported | 187 | < 0.10 |
Comparison 2 Time point 2 Maternal mental health, Outcome 2 CJF GUP CES‐D mean score (0‐60).
Comparison 2 Time point 2 Maternal mental health, Outcome 3 Maternal mental health dichotomous.
Comparison 3 Time point 3 Maternal mental health, Outcome 1 Maternal mental health continuous.
Comparison 3 Time point 3 Maternal mental health, Outcome 2 Maternal mental health dichotomous.
Comparison 4 Time point 1 Maternal physical health, Outcome 1 In poor health (%).
Comparison 5 Time point 2 Maternal physical health, Outcome 1 In good or excellent health (%).
Comparison 6 Time point 3 Maternal physical health, Outcome 1 Self‐reported health (1‐5).
Comparison 6 Time point 3 Maternal physical health, Outcome 2 In good or very good health (%).
Comparison 7 Time point 1 Child mental health, Outcome 1 Child behaviour problems continuous.
Comparison 7 Time point 1 Child mental health, Outcome 2 Child behaviour problems dichotomous.
Comparison 8 Time point 2 Child mental health, Outcome 1 Child behaviour problems continuous.
Comparison 8 Time point 2 Child mental health, Outcome 2 Adolescent mental health dichotomous.
| Study | Intervention | Int n | Control | Cont n | Total N |
| CJF GUP 2000 | 1.7 | Not reported | 1.6 | Not reported | 182 |
Comparison 8 Time point 2 Child mental health, Outcome 3 Child Behavior Checklist (1‐3).
Comparison 9 Time point 3 Child mental health, Outcome 1 Child behaviour problems continuous.
Comparison 9 Time point 3 Child mental health, Outcome 2 Child behaviour problem continuous excluding SSP Applicants.
Comparison 9 Time point 3 Child mental health, Outcome 3 NEWWS 2001 Child mental health.
| Study | Group | Intervention | Int n | Control | Cont n | Sig |
| IFIP 2002 | Ongoing recipients | 11.8 | 540 | 12.0 | 273 | NS |
| IFIP 2002 | Applicants | 11.3 | 442 | 10.9 | 220 | NS |
Comparison 9 Time point 3 Child mental health, Outcome 4 IFIP Behavioral Problems Index (0‐56).
| Study | Child age | Intervention | Int n | Control | Cont n | Sig. |
| SSP Recipients 2002 | 5.5‐7.5 years at follow up | 1.3 | 554 | 1.3 | 605 | NS |
| SSP Recipients 2002 | 7.5‐9.5 years at follow up | 1.3 | 577 | 1.3 | 560 | NS |
Comparison 9 Time point 3 Child mental health, Outcome 5 SSP‐R T3 Behavior Problems Scale (1‐3).
Comparison 10 Time point 1 Child physical health, Outcome 1 General health rating (1‐5).
Comparison 11 Time point 2 Child physical health, Outcome 1 Child physical health continuous.
Comparison 11 Time point 2 Child physical health, Outcome 2 Child physical health dichotomous.
Comparison 12 Time point 3 Child physical health, Outcome 1 Child physical health continuous.
Comparison 12 Time point 3 Child physical health, Outcome 2 Child physical health dichotomous.
Comparison 13 Time point 1 Employment status, Outcome 1 Currently employed (%).
Comparison 13 Time point 1 Employment status, Outcome 2 Ever employed (%).
Comparison 14 Time point 2 Employment status, Outcome 1 Ever employed (%).
Comparison 14 Time point 2 Employment status, Outcome 2 Ever employed full‐time since randomisation (%).
Comparison 14 Time point 2 Employment status, Outcome 3 Ever employed full‐time excluding MFIP (%).
Comparison 14 Time point 2 Employment status, Outcome 4 Employed part‐time (%).
Comparison 15 Time point 3 Employment status, Outcome 1 Currently employed (%).
Comparison 15 Time point 3 Employment status, Outcome 2 Ever employed (%).
Comparison 15 Time point 3 Employment status, Outcome 3 Currently employed full‐time (%).
Comparison 15 Time point 3 Employment status, Outcome 4 Currently employed part‐time (%).
Comparison 16 Time point 1 Income, Outcome 1 Total income.
Comparison 16 Time point 1 Income, Outcome 2 Earnings.
| Study | Intervention group | I nt | n | C ont | n | Sig |
| NEWWS 2001 | Atlanta Human Capital Development | 343 | 520 | 289 | 506 | .0.1 |
| NEWWS 2001 | Atlanta Labour Force Attachment | 326 | 396 | 293 | 506 | NS |
| NEWWS 2001 | Grand Rapids Human Capital Development | 336 | 205 | 341 | 216 | NS |
| NEWWS 2001 | Grand Rapids Labour Force Attachment | 392 | 225 | 345 | 216 | NS |
| NEWWS 2001 | Riverside Labour Force Attachment | 337 | 208 | 197 | 486 | 0.001 |
Comparison 16 Time point 1 Income, Outcome 3 NEWWS T1 Average earnings previous month (USD).
Comparison 17 Time point 2 Income, Outcome 1 Total income.
Comparison 17 Time point 2 Income, Outcome 2 Total income excluding CJF.
Comparison 17 Time point 2 Income, Outcome 3 Average earnings in year of survey (USD).
| Study | Group | MFIP | MFIP‐IO | Control | MFIP n | MFIP‐IO n | Cont n | Sig |
| MFIP 2000 | Long‐term urban recipients | 4657 | 3,967 | 3906 | 306 | 292 | 281 | NS |
| MFIP 2000 | Recent urban recipients | 6817 | 6,270 | 7438 | 258 | 135 | 259 | NS |
| MFIP 2000 | Long‐term rural recipients | 4061 | NA | 4139 | 92 | NA | 105 | NS |
| MFIP 2000 | Recent rural recipients | 6530 | NA | 5854 | 97 | NA | 75 | NS |
Comparison 17 Time point 2 Income, Outcome 4 MFIP Average annual earnings years 1‐3 (USD).
| Study | Intervention | Int n | Control | Cont n | Sample | Sig |
| California GAIN 1994 | 204 | 1076 | 190 | 648 | Employed respondents only | No test conducted |
Comparison 17 Time point 2 Income, Outcome 5 GAIN Average weekly earnings since randomisation (USD).
| Study | Intervention mean | Intervention n | Control mean | Control n |
| FTP 2000 | 6177 | 543 | 5208 | 565 |
Comparison 17 Time point 2 Income, Outcome 6 FTP Average earnings in year of study (USD).
Comparison 18 Time point 3 Income, Outcome 1 Total income.
| Study | Group | Intervention | Int n | Control | Cont n | Sig |
| IFIP 2002 | Ongoing | 1533 | 540 | 1451 | 273 | NS |
| IFIP 2002 | Applicant | 1857 | 442 | 2110 | 220 | 0.05 |
Comparison 18 Time point 3 Income, Outcome 2 IFIP household income month prior to survey (USD).
Comparison 18 Time point 3 Income, Outcome 3 Total earnings.
| Study | Group | Intervention | Int n | Control | Cont n | Sig |
| IFIP 2002 | Ongoing | 816 | 540 | 808 | 273 | NS |
| IFIP 2002 | Applicant | 1053 | 442 | 1117 | 220 | NS |
Comparison 18 Time point 3 Income, Outcome 4 IFIP Average earnings month prior to survey (USD).
| Study | Group | int | N | cont | N | Sig |
| NEWWS 2001 | Atlanta Human Capital Development | 22,961 | 367 | 20,516 | 311 | NS |
| NEWWS 2001 | Atlanta Labour Force Attachment | 23,063 | 289 | 20,516 | 311 | NS |
| NEWWS 2001 | Grand Rapids Human Capital Development | 23,975 | 196 | 23,340 | 214 | NS |
| NEWWS 2001 | Grand Rapids Labour Force Attachment | 26,625 | 214 | 23,340 | 214 | NS |
| NEWWS 2001 | Riverside Labour Force Attachment | 17,342 | 185 | 10,805 | 348 | 0.01 |
Comparison 18 Time point 3 Income, Outcome 5 NEWWS T3 Average earnings years 1‐5 (USD).
Comparison 19 Time point 1 Welfare receipt, Outcome 1 Total AFDC received year 2 (USD).
Comparison 19 Time point 1 Welfare receipt, Outcome 2 Proportion of sample receiving welfare (%).
Comparison 20 Time point 2 Welfare receipt, Outcome 1 Average annual welfare benefit.
Comparison 20 Time point 2 Welfare receipt, Outcome 2 Average annual welfare benefit excluding MFIP.
Comparison 20 Time point 2 Welfare receipt, Outcome 3 Proportion of sample receiving welfare.
Comparison 21 Time point 3 Welfare receipt, Outcome 1 Total welfare benefit received.
Comparison 21 Time point 3 Welfare receipt, Outcome 2 Total welfare payments years 1‐5 (USD).
| Study | Intervention | Int n | Control | Cont n | Total n | Sig. |
| IWRE 2002 | 685 | 819 | 1082 | 860 | 1679 | < 0.01 |
Comparison 21 Time point 3 Welfare receipt, Outcome 3 IWRE TANF receipt month before survey, annualised year 5 (USD).
| Study | Group | Intervention | Int n | Control | Cont n | Sig. |
| IFIP 2002 | Ongoing | 111 | 540 | 103 | 273 | NS |
| IFIP 2002 | Applicant | 56 | 442 | 34 | 220 | < 0.05 |
Comparison 21 Time point 3 Welfare receipt, Outcome 4 IFIP Average welfare received month prior to survey (USD).
Comparison 21 Time point 3 Welfare receipt, Outcome 5 Proportion of sample receiving welfare.
Comparison 22 Time point 1 Health insurance, Outcome 1 Respondent has health insurance (%).
Comparison 22 Time point 1 Health insurance, Outcome 2 Child health insurance (%).
Comparison 23 Time point 2 Health insurance, Outcome 1 Health insurance (%).
Comparison 24 Time point 3 Health insurance, Outcome 1 Health insurance.
| Study | Outcome | Group | Intervention | Int n | Control | Cont n | Total n | P value | Effect size |
| New Hope 1999 | Physical health (mean score) (1‐5) | Parents | 3.2 | NR | 3.22 | NR | 595 | 0.82 | −0.02 |
| New Hope 1999 | CES‐D mean score (0‐60) | Parents | 17.36 | NR | 17.33 | NR | 595 | 0.98 | 0.00 |
| New Hope 1999 | Problem Behavior Scale Externalising subscore | Boys | 2.34 | NR | 2.45 | NR | 570 | 0.107 | −0.15 |
| New Hope 1999 | Problem Behavior Scale Externalising subscore | Girls | 2.34 | NR | 2.3 | NR | 531 | 0.615 | 0.05 |
| New Hope 1999 | Problem Behavior Scale Internalising subscore | Boys | 2.29 | NR | 2.39 | NR | 570 | 0.148 | −0.15 |
| New Hope 1999 | Problem Behavior Scale Internalising subscore | Girls | 2.32 | NR | 2.35 | NR | 531 | 0.664 | −0.04 |
Comparison 25 New Hope 96 months, Outcome 1 Maternal and child health outcomes.
| Welfare to work for lone parents. Maternal health outcomes Summaries of all health outcomes reported in the review are provided in Web appendix 1. | ||||||
| Patient or population: lone parents | ||||||
| Outcomes | Illustrative comparative risks* (95% CI) | Relative effect | No of participants | Quality of the evidence | Comments | |
| Assumed risk | Corresponding risk | |||||
| Control | Welfare to work | |||||
| T1 maternal mental health | — | The mean T1 maternal mental health in the intervention groups was | — | 3352 | ⊕⊕⊕⊝ | Very small negative effect |
| T2 maternal mental health | — | The mean T2 maternal mental health in the intervention groups was | — | 7091 | ⊕⊕⊕⊝ | No effect |
| T3 maternal mental health | — | The mean T3 maternal mental health in the intervention groups was | — | 8873 | ⊕⊕⊕⊝ | Very small positive effect |
| T1 maternal self‐rated health | 201 per 1000 | 171 per 1000 | RR 0.85 | 311 | ⊕⊝⊝⊝ | Very small positive effect |
| T2 maternal self‐rated health | 347 per 1000 | 367 per 1000 | RR 1.06 | 2551 | ⊕⊕⊕⊝ | Very small positive effect |
| T3 maternal self‐rated health | 664 per 1000 | 645 per 1000 | RR 0.97 | 1854 | ⊕⊕⊝⊝ | Very small negative effect |
| *The basis for the assumed risk (e.g. the median control group risk across studies) is provided in footnotes. The corresponding risk (and its 95% confidence interval) is based on the assumed risk in the comparison group and the relative effect of the intervention (and its 95% CI). Very small effect: unlikely to be substantively important. Small effect: may be substantively important. Modest effect: likely to be substantively important. See Table 5 for further explanation | ||||||
| GRADE Working Group grades of evidence | ||||||
| a Better indicated by lower values. | ||||||
| Welfare to work for lone parents. Child health outcomes Summaries of all outcomes reported in the review are provided in Web appendix 2 | ||||||
| Patient or population: lone parents | ||||||
| Outcomes | Illustrative comparative risks* (95% CI) | Relative effect | No of participants | Quality of the evidence | Comments | |
| Assumed risk | Corresponding risk | |||||
| Control | Welfare to work | |||||
| T1 child mental health | — | The mean T1 child mental health in the intervention groups was | — | 2762 | ⊕⊕⊕⊝ | Very small negative effect |
| T2 child mental health | — | The mean T2 child mental health in the intervention groups was | — | 7560 | ⊕⊕⊕⊝ | Very small positive effect |
| T3 child mental health | — | The mean T3 child mental health in the intervention groups was | — | 3643 | ⊕⊕⊝⊝ | Very small positive effect |
| T1 child health (mother reported) | — | The mean T1 child health (mother reported) in the intervention groups was | — | 2762 | ⊕⊕⊕⊝ | Very small negative effect |
| T2 child health (mother reported) | — | The mean T2 child health (mother reported) in the intervention groups was | — | 7195 | ⊕⊕⊕⊝ | Very small positive effect |
| T3 child health (mother reported) | — | The mean T3 child health (mother reported) in the intervention groups was | — | 8083 | ⊕⊕⊕⊝ | Very small positive effect |
| *The basis for the assumed risk (e.g. the median control group risk across studies) is provided in footnotes. The corresponding risk (and its 95% confidence interval) is based on the assumed risk in the comparison group and the relative effect of the intervention (and its 95% CI). Very small effect: unlikely to be substantively important. Small effect: may be substantively important. Modest effect: likely to be substantively important. See Table 5 for further explanation | ||||||
| GRADE Working Group grades of evidence | ||||||
| a Better indicated by lower values. | ||||||
| Primary outcomes | Reported measures |
| Parentalmental health | Center for Epidemiologic Studies Depression Scale (CES‐D), Composite International Diagnostic Interview (CIDI), University of Michigan Composite International Diagnostic Interview (UM‐CIDI). Currently unhappy, sad or depressed 'very often' or 'fairly often'. Miserable or depressed 'often' or 'always' |
| Parentalphysical health | 5‐item self‐report health measures; ≥ 1 physical health problem(s) |
| Child mental health | Behavior Problems Index (BPI), Problem Behavior Scale of the Social Skills Rating System (PBS), the Survey Diagnostic Instrument of the Ontario Child Health Survey (SDI), Child Behavior Checklist (CBCL), Behavior Problems Scale |
| Child physical health | 5‐item measures of parent reported health, except for the Self‐Sufficiency Project for Applicants (SSP Applicants 2003) and for Recipients (SSP Recipients 2002), which used a 4‐item measure with answers given on a 5‐point scale and averaged across the 5 items. |
| Intervention
| Bodies initiating and evaluating intervention |
| Hypothesis for mechanisms linking intervention to health | |
| Location | |
| Dates | |
| Political and economic context | |
| Intervention (and co‐intervention if applicable) approach (i.e. HCD/LFA, anti‐poverty/caseload reduction) | |
| Intervention (and co‐intervention if applicable) components | |
| Other implementation or contextual information | |
| Population
| Sample demographics (family composition, age, ethnicity) |
| Socioeconomic factors (employment status) | |
| Sample size | |
| Study information
| Study duration |
| Length of follow‐up | |
| Attrition and non‐response | |
| Final sample size | |
| Method of adjusting for confounders | |
| Statistical tests used | |
| Study limitations | |
| Outcomes
| Outcome measures used |
| Data collection times | |
| Results
| Impacts on outcomes at each follow‐up (including all data on statistical tests) |
| Impacts on relevant subgroups | |
| Other information
| Authors' orientation |
| Authors' conclusions | |
| Policy and research recommendations | |
| Reviewers' comments |
| Time point | T1: 18‐24 months | T2: 25‐48 months | T3 49‐72 months | Narrative synthesis | |||||
| Study | 18 months | 24 months | 36 months | 48 months | 54 months | 60 months | 72 months | 96 months | 15‐17 years |
| — | — | X | — | — | — | — | — | X | |
| X | — | X | — | — | — | — | — | — | |
| X | — | — | — | — | — | — | — | — | |
| — | — | — | X | — | — | — | — | X | |
| — | — | X | — | — | — | — | — | — | |
| — | — | — | — | — | X | — | — | — | |
| — | — | — | — | — | X | — | — | — | |
| — | — | X | — | — | — | — | — | — | |
| — | X | — | — | — | X | — | X | — | |
| — | X | — | — | — | X | — | — | — | |
| — | X | — | X | — | — | — | — | — | |
| — | — | — | — | — | — | X | — | — | |
| — | — | X | — | X | — | — | — | — | |
| — | — | — | — | — | X | — | — | — | |
| Studies (k) | k = 5 | k = 6 | k = 7 | k = 1 | k = 2 | ||||
| Study | Type of subgroup | Subgroup |
| Welfare receipt status | Ongoing/applicant | |
| Location | Urban/rural | |
| Welfare receipt status | Long‐term/recent | |
| Intervention | Full intervention/incentives only | |
| Intervention | LFA/HCD | |
| Location | Grand Rapids, Riverside, Atlanta | |
| Child age | T1 3‐5 years, 6‐8 years, 9‐12 years | |
| Intervention | Full intervention/employment training only | |
| Child age | 6‐8 years, 9‐14 years | |
| Child age | T2: 3‐5 years, 6‐11 years, 12‐18 years; T3: 5.5‐7.5 years, 7.5‐9.5 years |
| Cohen's standards | SMD | Odds ratio | Modified approach | SMD | RR |
| Trivial | < 0.20 | < 1.50 | Very small | < 0.10 | 1.01‐1.19 |
| Small | 0.20‐0.49 | 1.50‐2.49 | Small | 0.10‐0.20 | 1.20‐1.50 |
| Medium | 0.50‐0.79 | 2.50‐4.29 | Modest | > 0.20 | > 1.50 |
| Outcome or subgroup title | No. of studies | No. of participants | Statistical method | Effect size |
| 1 Maternal mental health continuous Show forest plot | 2 | 3352 | Std. Mean Difference (IV, Random, 95% CI) | 0.07 [0.00, 0.14] |
| 1.1 CES‐D mean score (0‐60) | 1 | 590 | Std. Mean Difference (IV, Random, 95% CI) | 0.0 [‐0.16, 0.16] |
| 1.2 CES‐D mean score (0‐36) | 1 | 2762 | Std. Mean Difference (IV, Random, 95% CI) | 0.08 [0.01, 0.16] |
| 2 Maternal mental health dichotomous Show forest plot | 3 | Risk Ratio (M‐H, Random, 95% CI) | Subtotals only | |
| 2.1 Presence of mood disorders (University of Michigan, Composite International Diagnostic Interview) (%) | 1 | 148 | Risk Ratio (M‐H, Random, 95% CI) | 0.99 [0.50, 1.99] |
| 2.2 CES‐D at risk (% ≥ 16/60) | 1 | 311 | Risk Ratio (M‐H, Random, 95% CI) | 1.18 [0.80, 1.74] |
| 2.3 CIDI at risk (% threshold not reported) | 1 | 308 | Risk Ratio (M‐H, Random, 95% CI) | 1.21 [0.72, 2.06] |
| Outcome or subgroup title | No. of studies | No. of participants | Statistical method | Effect size |
| 1 Maternal mental health continuous Show forest plot | 3 | 7091 | Std. Mean Difference (IV, Random, 95% CI) | 0.00 [‐0.05, 0.05] |
| 1.1 CES‐D mean score (0‐60) | 2 | 2576 | Std. Mean Difference (IV, Random, 95% CI) | 0.02 [‐0.06, 0.09] |
| 1.2 CES‐D mean score (0‐33) | 1 | 4515 | Std. Mean Difference (IV, Random, 95% CI) | ‐0.01 [‐0.07, 0.05] |
| 2 CJF GUP CES‐D mean score (0‐60) Show forest plot | Other data | No numeric data | ||
| 3 Maternal mental health dichotomous Show forest plot | 2 | Risk Ratio (M‐H, Random, 95% CI) | Subtotals only | |
| 3.1 Unhappy, sad or depressed very often or fairly often (%) | 1 | 2242 | Risk Ratio (M‐H, Random, 95% CI) | 1.06 [0.95, 1.18] |
| 3.2 CES‐D at high risk (% ≥ 23/60) | 1 | 1900 | Risk Ratio (M‐H, Random, 95% CI) | 1.00 [0.85, 1.18] |
| Outcome or subgroup title | No. of studies | No. of participants | Statistical method | Effect size |
| 1 Maternal mental health continuous Show forest plot | 4 | 8904 | Std. Mean Difference (IV, Random, 95% CI) | ‐0.07 [‐0.15, 0.00] |
| 1.1 CES‐D mean score (0‐60) | 2 | 2232 | Std. Mean Difference (IV, Random, 95% CI) | ‐0.10 [‐0.18, ‐0.01] |
| 1.2 CES‐D mean score (0‐33) | 2 | 6672 | Std. Mean Difference (IV, Random, 95% CI) | ‐0.06 [‐0.18, 0.06] |
| 2 Maternal mental health dichotomous Show forest plot | 2 | Risk Ratio (M‐H, Random, 95% CI) | Subtotals only | |
| 2.1 CES‐D at high risk (% ≥ 23/60) | 1 | 1475 | Risk Ratio (M‐H, Random, 95% CI) | 0.94 [0.73, 1.20] |
| 2.2 Miserable or depressed often or always (%) | 1 | 1365 | Risk Ratio (M‐H, Random, 95% CI) | 1.25 [0.98, 1.59] |
| Outcome or subgroup title | No. of studies | No. of participants | Statistical method | Effect size |
| 1 In poor health (%) Show forest plot | 1 | 311 | Risk Ratio (M‐H, Random, 95% CI) | 0.85 [0.54, 1.36] |
| Outcome or subgroup title | No. of studies | No. of participants | Statistical method | Effect size |
| 1 In good or excellent health (%) Show forest plot | 2 | 2551 | Risk Ratio (M‐H, Random, 95% CI) | 1.06 [0.95, 1.18] |
| Outcome or subgroup title | No. of studies | No. of participants | Statistical method | Effect size |
| 1 Self‐reported health (1‐5) Show forest plot | 1 | 553 | Std. Mean Difference (IV, Random, 95% CI) | 0.16 [‐0.01, 0.33] |
| 2 In good or very good health (%) Show forest plot | 1 | 1854 | Risk Ratio (M‐H, Random, 95% CI) | 0.97 [0.91, 1.04] |
| Outcome or subgroup title | No. of studies | No. of participants | Statistical method | Effect size |
| 1 Child behaviour problems continuous Show forest plot | 2 | Std. Mean Difference (IV, Random, 95% CI) | Subtotals only | |
| 1.1 Problem Behavior Scale (1‐5) | 1 | 563 | Std. Mean Difference (IV, Random, 95% CI) | ‐0.17 [‐0.34, ‐0.01] |
| 1.2 Behavior Problems Index (0‐2) | 1 | 2762 | Std. Mean Difference (IV, Random, 95% CI) | 0.01 [‐0.06, 0.09] |
| 2 Child behaviour problems dichotomous Show forest plot | 2 | Risk Ratio (M‐H, Random, 95% CI) | Subtotals only | |
| 2.1 One or more behavior disorders (Survey Diagnostic Instrument) (%) | 1 | 178 | Risk Ratio (M‐H, Random, 95% CI) | 1.58 [0.48, 5.24] |
| 2.2 Behavior Problems Index (% with problems) | 1 | 311 | Risk Ratio (M‐H, Random, 95% CI) | 1.58 [0.92, 2.72] |
| Outcome or subgroup title | No. of studies | No. of participants | Statistical method | Effect size |
| 1 Child behaviour problems continuous Show forest plot | 5 | 7560 | Std. Mean Difference (IV, Random, 95% CI) | ‐0.04 [‐0.08, 0.01] |
| 1.1 Behavioral Problems Index (0‐56) | 3 | 4107 | Std. Mean Difference (IV, Random, 95% CI) | ‐0.05 [‐0.12, 0.01] |
| 1.2 Behavior Problems Scale (1‐3) | 1 | 3201 | Std. Mean Difference (IV, Random, 95% CI) | ‐0.03 [‐0.10, 0.04] |
| 1.3 Survey Diagnostic Instrument Conduct Disorder (0‐30) | 1 | 252 | Std. Mean Difference (IV, Random, 95% CI) | 0.06 [‐0.21, 0.32] |
| 2 Adolescent mental health dichotomous Show forest plot | 1 | Risk Ratio (M‐H, Random, 95% CI) | Subtotals only | |
| 2.1 Adolescent CES‐D at risk (% ≥ 8/30) | 1 | 1417 | Risk Ratio (M‐H, Random, 95% CI) | 0.97 [0.87, 1.08] |
| 3 Child Behavior Checklist (1‐3) Show forest plot | Other data | No numeric data | ||
| Outcome or subgroup title | No. of studies | No. of participants | Statistical method | Effect size |
| 1 Child behaviour problems continuous Show forest plot | 3 | 3643 | Std. Mean Difference (IV, Random, 95% CI) | ‐0.05 [‐0.16, 0.05] |
| 1.1 Behavior Problems Scale (1‐3) | 1 | 1134 | Std. Mean Difference (IV, Random, 95% CI) | 0.04 [‐0.07, 0.16] |
| 1.2 Behavioral Problems Index (0‐56) | 1 | 1679 | Std. Mean Difference (IV, Random, 95% CI) | ‐0.07 [‐0.16, 0.03] |
| 1.3 Problem Behavior Scale (1‐5) | 1 | 830 | Std. Mean Difference (IV, Random, 95% CI) | ‐0.15 [‐0.29, ‐0.02] |
| 2 Child behaviour problem continuous excluding SSP Applicants Show forest plot | 2 | 2509 | Std. Mean Difference (IV, Random, 95% CI) | ‐0.10 [‐0.18, ‐0.01] |
| 2.1 Behavioral Problems Index (0‐56) | 1 | 1679 | Std. Mean Difference (IV, Random, 95% CI) | ‐0.07 [‐0.16, 0.03] |
| 2.2 Problem behavior scale (1‐5) | 1 | 830 | Std. Mean Difference (IV, Random, 95% CI) | ‐0.15 [‐0.29, ‐0.02] |
| 3 NEWWS 2001 Child mental health Show forest plot | 1 | Std. Mean Difference (IV, Random, 95% CI) | Subtotals only | |
| 3.1 BPI Externalising subscore (0‐18) | 1 | 2124 | Std. Mean Difference (IV, Random, 95% CI) | ‐0.12 [‐0.21, ‐0.03] |
| 3.2 BPI Internalising subscore (0‐24) | 1 | 2124 | Std. Mean Difference (IV, Random, 95% CI) | ‐0.04 [‐0.13, 0.04] |
| 3.3 BPI Hyperactivity subscore (0‐18) | 1 | 2124 | Std. Mean Difference (IV, Random, 95% CI) | 0.03 [‐0.06, 0.12] |
| 4 IFIP Behavioral Problems Index (0‐56) Show forest plot | Other data | No numeric data | ||
| 5 SSP‐R T3 Behavior Problems Scale (1‐3) Show forest plot | Other data | No numeric data | ||
| Outcome or subgroup title | No. of studies | No. of participants | Statistical method | Effect size |
| 1 General health rating (1‐5) Show forest plot | 1 | 2762 | Std. Mean Difference (IV, Random, 95% CI) | ‐0.05 [‐0.12, 0.03] |
| Outcome or subgroup title | No. of studies | No. of participants | Statistical method | Effect size |
| 1 Child physical health continuous Show forest plot | 3 | 7195 | Std. Mean Difference (IV, Random, 95% CI) | 0.07 [0.01, 0.12] |
| 1.1 General health scale (1‐5) | 2 | 2577 | Std. Mean Difference (IV, Random, 95% CI) | 0.11 [0.03, 0.19] |
| 1.2 Child average health scale (1‐5 across 4‐item instrument) | 1 | 4618 | Std. Mean Difference (IV, Random, 95% CI) | 0.03 [‐0.03, 0.09] |
| 2 Child physical health dichotomous Show forest plot | 1 | Risk Ratio (M‐H, Random, 95% CI) | Subtotals only | |
| 2.1 In good or excellent health | 1 | 1900 | Risk Ratio (M‐H, Random, 95% CI) | 0.98 [0.93, 1.02] |
| Outcome or subgroup title | No. of studies | No. of participants | Statistical method | Effect size |
| 1 Child physical health continuous Show forest plot | 5 | 8083 | Std. Mean Difference (IV, Random, 95% CI) | 0.01 [‐0.04, 0.06] |
| 1.1 Health status scale (1‐5) | 1 | 1679 | Std. Mean Difference (IV, Random, 95% CI) | 0.0 [‐0.10, 0.10] |
| 1.2 Overall health scale (1‐5) | 1 | 850 | Std. Mean Difference (IV, Random, 95% CI) | 0.09 [‐0.04, 0.23] |
| 1.3 General health rating (1‐5) | 1 | 2124 | Std. Mean Difference (IV, Random, 95% CI) | ‐0.07 [‐0.15, 0.02] |
| 1.4 Child average health scale (1‐5 across 4‐item instrument) | 2 | 3430 | Std. Mean Difference (IV, Random, 95% CI) | 0.04 [‐0.03, 0.10] |
| 2 Child physical health dichotomous Show forest plot | 1 | Risk Ratio (M‐H, Random, 95% CI) | Subtotals only | |
| 2.1 In fair or poor health (%) | 1 | 1475 | Risk Ratio (M‐H, Random, 95% CI) | 1.26 [0.73, 2.14] |
| Outcome or subgroup title | No. of studies | No. of participants | Statistical method | Effect size |
| 1 Currently employed (%) Show forest plot | 3 | 3381 | Risk Ratio (M‐H, Random, 95% CI) | 1.22 [1.12, 1.32] |
| 2 Ever employed (%) Show forest plot | 3 | 3818 | Risk Ratio (M‐H, Random, 95% CI) | 1.14 [1.07, 1.21] |
| 2.1 Ever employed since randomisation (18 months) (%) | 1 | 311 | Risk Ratio (M‐H, Random, 95% CI) | 1.17 [1.03, 1.34] |
| 2.2 Ever employed year 2 (%) | 1 | 745 | Risk Ratio (M‐H, Random, 95% CI) | 1.09 [1.03, 1.15] |
| 2.3 Ever employed since randomisation (24 months) (%) | 1 | 2762 | Risk Ratio (M‐H, Random, 95% CI) | 1.17 [1.11, 1.24] |
| Outcome or subgroup title | No. of studies | No. of participants | Statistical method | Effect size |
| 1 Ever employed (%) Show forest plot | 5 | 12274 | Risk Ratio (M‐H, Random, 95% CI) | 1.13 [1.08, 1.19] |
| 1.1 Ever employed since randomisation (36 months) | 2 | 4845 | Risk Ratio (M‐H, Random, 95% CI) | 1.14 [1.03, 1.26] |
| 1.2 Average employment year of study | 2 | 2577 | Risk Ratio (M‐H, Random, 95% CI) | 1.10 [1.03, 1.17] |
| 1.3 Employed at 33 months | 1 | 4852 | Risk Ratio (M‐H, Random, 95% CI) | 1.19 [1.10, 1.28] |
| 2 Ever employed full‐time since randomisation (%) Show forest plot | 3 | 9806 | Risk Ratio (M‐H, Random, 95% CI) | 1.20 [1.05, 1.37] |
| 3 Ever employed full‐time excluding MFIP (%) Show forest plot | 2 | 8275 | Risk Ratio (M‐H, Random, 95% CI) | 1.29 [1.18, 1.40] |
| 4 Employed part‐time (%) Show forest plot | 3 | Risk Ratio (M‐H, Random, 95% CI) | Subtotals only | |
| 4.1 Ever employed part‐time since randomisation | 2 | 4845 | Risk Ratio (M‐H, Random, 95% CI) | 1.14 [1.04, 1.25] |
| 4.2 Currently employed part‐time | 1 | 4852 | Risk Ratio (M‐H, Random, 95% CI) | 0.80 [0.69, 0.93] |
| Outcome or subgroup title | No. of studies | No. of participants | Statistical method | Effect size |
| 1 Currently employed (%) Show forest plot | 6 | 14355 | Risk Ratio (M‐H, Random, 95% CI) | 1.03 [0.99, 1.07] |
| 2 Ever employed (%) Show forest plot | 3 | Risk Ratio (M‐H, Random, 95% CI) | Subtotals only | |
| 2.1 Ever employed year 5 | 2 | 2599 | Risk Ratio (M‐H, Random, 95% CI) | 1.01 [0.96, 1.06] |
| 2.2 Ever employed years 1‐5 | 1 | 2124 | Risk Ratio (M‐H, Random, 95% CI) | 1.12 [1.08, 1.17] |
| 3 Currently employed full‐time (%) Show forest plot | 6 | 13233 | Risk Ratio (M‐H, Random, 95% CI) | 1.05 [1.00, 1.12] |
| 4 Currently employed part‐time (%) Show forest plot | 5 | 12676 | Risk Ratio (M‐H, Random, 95% CI) | 0.93 [0.85, 1.01] |
| Outcome or subgroup title | No. of studies | No. of participants | Statistical method | Effect size |
| 1 Total income Show forest plot | 2 | Std. Mean Difference (IV, Random, 95% CI) | Subtotals only | |
| 1.1 Total income year 2 (USD) | 1 | 744 | Std. Mean Difference (IV, Random, 95% CI) | 0.11 [‐0.04, 0.25] |
| 1.2 Total net household income in prior month (USD) | 1 | 2762 | Std. Mean Difference (IV, Random, 95% CI) | ‐0.08 [‐0.15, ‐0.00] |
| 2 Earnings Show forest plot | 1 | Std. Mean Difference (IV, Random, 95% CI) | Subtotals only | |
| 2.1 Average annual earnings year 2 (USD) | 1 | 744 | Std. Mean Difference (IV, Random, 95% CI) | 0.07 [‐0.08, 0.21] |
| 3 NEWWS T1 Average earnings previous month (USD) Show forest plot | Other data | No numeric data | ||
| Outcome or subgroup title | No. of studies | No. of participants | Statistical method | Effect size |
| 1 Total income Show forest plot | 4 | 8934 | Std. Mean Difference (IV, Random, 95% CI) | 0.10 [0.02, 0.17] |
| 1.1 Average annual income (benefits, earnings and food stamps) years 3‐4 (USD) | 1 | 1469 | Std. Mean Difference (IV, Random, 95% CI) | ‐0.01 [‐0.11, 0.09] |
| 1.2 Average total income (benefits, earnings and food stamps) year 4 (USD) | 1 | 1108 | Std. Mean Difference (IV, Random, 95% CI) | 0.08 [‐0.04, 0.20] |
| 1.3 Average annual income (benefits and earnings) year 3 (USD) | 1 | 1531 | Std. Mean Difference (IV, Random, 95% CI) | 0.14 [0.03, 0.24] |
| 1.4 Total monthly individual income (average from all sources in 6 months prior to 3‐year survey) (CAD) | 1 | 4826 | Std. Mean Difference (IV, Random, 95% CI) | 0.15 [0.10, 0.21] |
| 2 Total income excluding CJF Show forest plot | 3 | 7465 | Std. Mean Difference (IV, Random, 95% CI) | 0.14 [0.09, 0.18] |
| 2.1 Average total income from earnings, AFDC/TANF and food stamps year 4 (USD) | 1 | 1108 | Std. Mean Difference (IV, Random, 95% CI) | 0.08 [‐0.04, 0.20] |
| 2.2 Average annual income welfare/earnings year 3 (USD) | 1 | 1531 | Std. Mean Difference (IV, Random, 95% CI) | 0.14 [0.03, 0.24] |
| 2.3 Total monthly individual income 6 months prior to 3‐year survey (CAD) | 1 | 4826 | Std. Mean Difference (IV, Random, 95% CI) | 0.15 [0.10, 0.21] |
| 3 Average earnings in year of survey (USD) Show forest plot | 2 | 6321 | Std. Mean Difference (IV, Random, 95% CI) | 0.09 [0.04, 0.13] |
| 4 MFIP Average annual earnings years 1‐3 (USD) Show forest plot | Other data | No numeric data | ||
| 5 GAIN Average weekly earnings since randomisation (USD) Show forest plot | Other data | No numeric data | ||
| 6 FTP Average earnings in year of study (USD) Show forest plot | Other data | No numeric data | ||
| Outcome or subgroup title | No. of studies | No. of participants | Statistical method | Effect size |
| 1 Total income Show forest plot | 5 | 11745 | Std. Mean Difference (IV, Random, 95% CI) | 0.01 [‐0.04, 0.06] |
| 1.1 Total household income month prior to survey, annualised (USD) | 1 | 1679 | Std. Mean Difference (IV, Random, 95% CI) | ‐0.03 [‐0.13, 0.06] |
| 1.2 Total income year 5 (USD) | 1 | 745 | Std. Mean Difference (IV, Random, 95% CI) | 0.06 [‐0.09, 0.20] |
| 1.3 Total income years 1‐5 (USD) | 1 | 2124 | Std. Mean Difference (IV, Random, 95% CI) | 0.05 [‐0.04, 0.14] |
| 1.4 Total monthly individual income at 72 months (CAD) | 1 | 2371 | Std. Mean Difference (IV, Random, 95% CI) | 0.07 [‐0.01, 0.15] |
| 1.5 Total monthly individual income (average in 6 months prior to month 54 (CAD) | 1 | 4826 | Std. Mean Difference (IV, Random, 95% CI) | ‐0.04 [‐0.09, 0.02] |
| 2 IFIP household income month prior to survey (USD) Show forest plot | Other data | No numeric data | ||
| 3 Total earnings Show forest plot | 5 | 11501 | Std. Mean Difference (IV, Random, 95% CI) | 0.04 [‐0.00, 0.07] |
| 3.1 Average earnings year 5 (USD) | 1 | 745 | Std. Mean Difference (IV, Random, 95% CI) | 0.05 [‐0.09, 0.20] |
| 3.2 Average earnings year 6 (CAD) | 1 | 2371 | Std. Mean Difference (IV, Random, 95% CI) | 0.08 [0.00, 0.16] |
| 3.3 Average earnings year 5 (GBP) | 1 | 1854 | Std. Mean Difference (IV, Random, 95% CI) | 0.06 [‐0.04, 0.15] |
| 3.4 Earnings month prior to survey, annualised (USD) | 1 | 1679 | Std. Mean Difference (IV, Random, 95% CI) | 0.01 [‐0.09, 0.11] |
| 3.5 Monthly earnings year 5, quarter 18 (CAD) | 1 | 4852 | Std. Mean Difference (IV, Random, 95% CI) | 0.01 [‐0.05, 0.07] |
| 4 IFIP Average earnings month prior to survey (USD) Show forest plot | Other data | No numeric data | ||
| 5 NEWWS T3 Average earnings years 1‐5 (USD) Show forest plot | Other data | No numeric data | ||
| Outcome or subgroup title | No. of studies | No. of participants | Statistical method | Effect size |
| 1 Total AFDC received year 2 (USD) Show forest plot | 1 | 744 | Std. Mean Difference (IV, Random, 95% CI) | ‐0.10 [‐0.24, 0.04] |
| 2 Proportion of sample receiving welfare (%) Show forest plot | 3 | 3714 | Risk Ratio (M‐H, Random, 95% CI) | 0.88 [0.84, 0.92] |
| 2.1 Received social assistance in last 12 months | 1 | 207 | Risk Ratio (M‐H, Random, 95% CI) | 0.85 [0.76, 0.97] |
| 2.2 Currently receiving AFDC | 1 | 2762 | Risk Ratio (M‐H, Random, 95% CI) | 0.87 [0.83, 0.92] |
| 2.3 Ever received AFDC/TANF year 2 | 1 | 745 | Risk Ratio (M‐H, Random, 95% CI) | 0.94 [0.84, 1.06] |
| Outcome or subgroup title | No. of studies | No. of participants | Statistical method | Effect size |
| 1 Average annual welfare benefit Show forest plot | 4 | 8960 | Std. Mean Difference (IV, Random, 95% CI) | ‐0.11 [‐0.36, 0.15] |
| 1.1 Average annual welfare benefit year 3 (USD) | 1 | 1469 | Std. Mean Difference (IV, Random, 95% CI) | ‐0.22 [‐0.32, ‐0.11] |
| 1.2 Average Income Assistance year 3 (CAD) | 1 | 4852 | Std. Mean Difference (IV, Random, 95% CI) | ‐0.18 [‐0.24, ‐0.13] |
| 1.3 Average annual welfare benefit year 3 (USD) | 1 | 1531 | Std. Mean Difference (IV, Random, 95% CI) | 0.33 [0.22, 0.43] |
| 1.4 Total AFDC/TANF received year 4 (USD) | 1 | 1108 | Std. Mean Difference (IV, Random, 95% CI) | ‐0.35 [‐0.47, ‐0.23] |
| 2 Average annual welfare benefit excluding MFIP Show forest plot | 3 | 7429 | Std. Mean Difference (IV, Random, 95% CI) | ‐0.24 [‐0.33, ‐0.15] |
| 2.1 Average annual welfare benefit year 3 (USD) | 1 | 1469 | Std. Mean Difference (IV, Random, 95% CI) | ‐0.22 [‐0.32, ‐0.11] |
| 2.2 Total AFDC/TANF received year 4 (USD) | 1 | 1108 | Std. Mean Difference (IV, Random, 95% CI) | ‐0.35 [‐0.47, ‐0.23] |
| 2.3 Average Income Assistance year 3 (USD/CAD) | 1 | 4852 | Std. Mean Difference (IV, Random, 95% CI) | ‐0.18 [‐0.24, ‐0.13] |
| 3 Proportion of sample receiving welfare Show forest plot | 2 | 5210 | Risk Ratio (M‐H, Random, 95% CI) | 0.87 [0.83, 0.91] |
| 3.1 Social assistance/unemployment insurance receipt year 4 (%) | 1 | 358 | Risk Ratio (M‐H, Random, 95% CI) | 0.90 [0.71, 1.14] |
| 3.2 Income Assistance receipt year 3 (%) | 1 | 4852 | Risk Ratio (M‐H, Random, 95% CI) | 0.87 [0.83, 0.90] |
| Outcome or subgroup title | No. of studies | No. of participants | Statistical method | Effect size |
| 1 Total welfare benefit received Show forest plot | 4 | 9822 | Std. Mean Difference (IV, Random, 95% CI) | ‐0.06 [‐0.11, ‐0.00] |
| 1.1 Total AFDC/TANF receipt year 5 (USD) | 1 | 745 | Std. Mean Difference (IV, Random, 95% CI) | 0.01 [‐0.14, 0.15] |
| 1.2 Average Income Assistance received year 6 (CAD) | 1 | 2371 | Std. Mean Difference (IV, Random, 95% CI) | ‐0.12 [‐0.20, ‐0.04] |
| 1.3 Average Income Support received per wk (GBP) | 1 | 1854 | Std. Mean Difference (IV, Random, 95% CI) | 0.0 [‐0.09, 0.09] |
| 1.4 Average Income Assistance received year 5 (CAD) | 1 | 4852 | Std. Mean Difference (IV, Random, 95% CI) | ‐0.07 [‐0.12, ‐0.01] |
| 2 Total welfare payments years 1‐5 (USD) Show forest plot | 1 | 2124 | Std. Mean Difference (IV, Random, 95% CI) | ‐0.55 [‐0.63, ‐0.46] |
| 3 IWRE TANF receipt month before survey, annualised year 5 (USD) Show forest plot | Other data | No numeric data | ||
| 4 IFIP Average welfare received month prior to survey (USD) Show forest plot | Other data | No numeric data | ||
| 5 Proportion of sample receiving welfare Show forest plot | 6 | 12976 | Risk Ratio (M‐H, Random, 95% CI) | 0.92 [0.86, 0.99] |
| 5.1 Currently receiving TANF (%) | 1 | 1679 | Risk Ratio (M‐H, Random, 95% CI) | 0.79 [0.67, 0.93] |
| 5.2 Ever received AFDC/TANF year 5 (%) | 1 | 745 | Risk Ratio (M‐H, Random, 95% CI) | 0.91 [0.64, 1.29] |
| 5.3 Currently receiving Income Support or Jobseeker's Allowance (%) | 1 | 1854 | Risk Ratio (M‐H, Random, 95% CI) | 0.98 [0.87, 1.11] |
| 5.4 Currently receiving Family Independence Payment (%) | 1 | 1475 | Risk Ratio (M‐H, Random, 95% CI) | 1.09 [0.89, 1.33] |
| 5.5 Currently receiving Income Assistance (%) | 1 | 2371 | Risk Ratio (M‐H, Random, 95% CI) | 0.84 [0.72, 0.98] |
| 5.6 Currently receiving Income Assistance (%) | 1 | 4852 | Risk Ratio (M‐H, Random, 95% CI) | 0.94 [0.89, 0.99] |
| Outcome or subgroup title | No. of studies | No. of participants | Statistical method | Effect size |
| 1 Respondent has health insurance (%) Show forest plot | 4 | Risk Ratio (M‐H, Random, 95% CI) | Subtotals only | |
| 1.1 Respondent has Medicaid | 2 | 606 | Risk Ratio (M‐H, Random, 95% CI) | 1.16 [1.08, 1.25] |
| 1.2 Respondent had any health insurance since randomisation (24 months) | 1 | 590 | Risk Ratio (M‐H, Random, 95% CI) | 1.09 [1.03, 1.16] |
| 1.3 Respondent ever had employer‐provided health insurance since randomisation (24 months) | 1 | 2762 | Risk Ratio (M‐H, Random, 95% CI) | 1.40 [1.16, 1.69] |
| 2 Child health insurance (%) Show forest plot | 1 | 2762 | Risk Ratio (M‐H, Random, 95% CI) | 0.99 [0.96, 1.01] |
| Outcome or subgroup title | No. of studies | No. of participants | Statistical method | Effect size |
| 1 Health insurance (%) Show forest plot | 2 | Risk Ratio (M‐H, Random, 95% CI) | Subtotals only | |
| 1.1 Respondent has Medicaid or other health insurance within 2‐3 years of randomisation | 1 | 2193 | Risk Ratio (M‐H, Random, 95% CI) | 0.97 [0.93, 1.01] |
| 1.2 Children have continuous health insurance for past 36 months | 1 | 1531 | Risk Ratio (M‐H, Random, 95% CI) | 1.16 [1.08, 1.24] |
| Outcome or subgroup title | No. of studies | No. of participants | Statistical method | Effect size |
| 1 Health insurance Show forest plot | 3 | Risk Ratio (M‐H, Random, 95% CI) | Subtotals only | |
| 1.1 Family has health insurance (%) | 2 | 3599 | Risk Ratio (M‐H, Random, 95% CI) | 0.98 [0.92, 1.05] |
| 1.2 Respondent has health insurance (%) | 1 | 561 | Risk Ratio (M‐H, Random, 95% CI) | 0.97 [0.91, 1.04] |
| 1.3 All focal children have health insurance (%) | 1 | 561 | Risk Ratio (M‐H, Random, 95% CI) | 0.95 [0.89, 1.02] |
| Outcome or subgroup title | No. of studies | No. of participants | Statistical method | Effect size |
| 1 Maternal and child health outcomes Show forest plot | Other data | No numeric data | ||