Techniques of monitoring blood glucose during pregnancy for women with pre‐existing diabetes
References
References to studies included in this review
References to studies excluded from this review
References to ongoing studies
Additional references
References to other published versions of this review
Characteristics of studies
Characteristics of included studies [ordered by study ID]
Jump to:
| Methods | Women were sequentially assigned to telemedicine and control groups (not randomised). | |
| Participants | 88 women with gestational diabetes in the telemedicine group and 115 in the control group; Inclusion criteria: pregnant women with type 1 diabetes (enrolled in the study at their first visit after conception. Women with gestational diabetes included after a week from the diagnosis of gestational diabetes. Exclusion criteria: not described. | |
| Interventions | Intervention: automated telemedicine monitoring. Control: conventional system. | |
| Outcomes | Pre‐pregnancy BMI, week of gestation when diabetes was diagnosed (for gestational diabetes cases), duration of diabetes (for type 1 cases), therapy, HbA1c at enrolment and at the end of pregnancy. | |
| Notes | Setting: 12 diabetes clinics. Country: Italy. Funding: not mentioned. Comments: data for women with gestational diabetes and type 1 diabetes are presented separately. | |
| Risk of bias | ||
| Bias | Authors' judgement | Support for judgement |
| Random sequence generation (selection bias) | High risk | “Women were sequentially assigned to two groups: one patient was followed up using the telemedicine approach and the next using the conventional approach (usual care).” |
| Allocation concealment (selection bias) | High risk | No attempt was made to conceal allocation. |
| Blinding of participants and personnel (performance bias) | Low risk | No attempt was made to blind women or personnel. Women were aware of whether they were being monitored using telemedicine or usual care. However, the outcomes were measured objectively and would not have been influenced by blinding or not blinding. |
| Blinding of outcome assessment (detection bias) | Low risk | No blinding of outcome assessment. However, all outcomes were objectively measured. |
| Incomplete outcome data (attrition bias) | High risk | 4/36 women with type 1 diabetes and 37/240 women with gestational diabetes were excluded because they did not complete questionnaires at the end of the study. It is unclear whether these were women with type 1 diabetes or gestational diabetes. |
| Selective reporting (reporting bias) | Unclear risk | This study was assessed from a published report, without the study protocol. The main outcomes were reported separately for type 1 diabetes and GDM, however some outcomes were not reported separately or were only reported in the text. |
| Other bias | High risk | The study did not use an intention‐to‐treat analysis. There is no sample size calculation, or information on whether groups were comparable at baseline. Women with type 1 diabetes only make up a small part of the whole study (32 out of 235 women). |
| Methods | Randomised, parallel‐group, open‐label, 2‐armed, active controlled trial. Period of study: not mentioned. | |
| Participants | Number randomised: 20. Eligible were type 1 diabetes mellitus (IDDM) pregnant patients attending the Diabetes Unit specialising in the treatment of diabetes in pregnancy during the period of study. Inclusion criteria:
Exclusion criteria:
| |
| Interventions | Intervention: DIANET system ‐ continuous automated monitoring system using a telemedicine system ‐ patient unit, diabetes workstation and the communication link (n = 10). Control: Conventional monitoring ‐ performed 3 or more tests of blood glucose per day using BM20‐800 strips (n = 10). | |
| Outcomes | Outcomes used in this review: 1) Mean blood glucose. 2) Occurence (weekly) of hypoglycaemic reactions. Outcomes not used in this review: 1) Insulin requirement. | |
| Notes | Setting: Diabetes Unit specialising in the treatment of diabetes in pregnancy. Country: Italy. Funding: not mentioned. Comments:
| |
| Risk of bias | ||
| Bias | Authors' judgement | Support for judgement |
| Random sequence generation (selection bias) | Unclear risk | Quote from report ‐ "Patients were consecutively chosen by 1 of the investigators. Stratified block randomisation was used to divide patients into 2 groups at baseline." The patients were randomly assigned to a control of DIANET group. Comment ‐ Methods of sequence allocation not stated. |
| Allocation concealment (selection bias) | Unclear risk | Comment ‐ Not mentioned. |
| Blinding of participants and personnel (performance bias) | Low risk | Comment ‐ No blinding of participants and personnel. However, this may not affect the results as all outcomes were objectively measured. |
| Blinding of outcome assessment (detection bias) | Low risk | Comment ‐ No blinding of outcome assessment. However, all outcomes were objectively measured. |
| Incomplete outcome data (attrition bias) | Low risk | Comment ‐ Reported results of all participants (n = 20). |
| Selective reporting (reporting bias) | Low risk | As reported in the article all outcomes listed have been mentioned. |
| Other bias | Low risk | No obvious risk to other bias. |
| Methods | Randomised, parallel‐group, open‐label, 2‐armed, active controlled trial. Period of study: 1 October 1979 ‐ 1 October 1982. | |
| Participants | Number randomised: 100. Eligible were type 1 diabetes mellitus (IDDM) and type 2 diabetes mellitus (NIDDM) pregnant patients attending the from 5 hospitals in Stockholm during the period of study. Inclusion criteria:
Exclusion criteria:
| |
| Interventions | Intervention: Patients self‐monitored their blood glucose at home from the 32nd week until the 36th week of gestation. Weekly hospital visit from 32‐36 weeks and then hospitalised during the 37th week until delivery (n = 54). Control: Patients were hospitalised from 32nd week until delivery (n = 46). | |
| Outcomes | Outcomes used in this review: 1) Mean blood glucose. 2) HbA1c. 3) Antenatal hospital stay (% requiring admission, length of stay). 4) Caesarean section rates. 5) Preterm birth. 6) Neonatal hypoglycaemia. 7) Perinatal death. 8) Neonatal hospital stay. Outcomes not used in this review: Maternal complications
Neonatal outcomes
| |
| Notes | Setting: 5 hospitals in Stockholm. Country: Sweden. Funding: Expressens Perinatal forskningsfond, AIImanna Barnbordshusets Minnesfond, Svenska Diabetesstiftelsen, Nordisk Insulinfond, Swedish Medical Research Council (Project No. 3787), and Tielman's Fund for Pediatric Research. Comments:
| |
| Risk of bias | ||
| Bias | Authors' judgement | Support for judgement |
| Random sequence generation (selection bias) | Unclear risk | Comment ‐ Not mentioned. |
| Allocation concealment (selection bias) | Unclear risk | Comment ‐ Not mentioned. |
| Blinding of participants and personnel (performance bias) | Low risk | Comment ‐ No blinding of participants and personnel. However, this may not affect the results as all outcomes were objectively measured. |
| Blinding of outcome assessment (detection bias) | Low risk | Comment ‐ No blinding of outcome assessment. Objective measurements used. |
| Incomplete outcome data (attrition bias) | High risk | Comment ‐ 1 excluded for severe drug addiction, 8 spontaneous abortions and 1 mother died. |
| Selective reporting (reporting bias) | Low risk | No obvious risk to selective reporting. |
| Other bias | Low risk | No obvious risk to other bias. |
| Methods | Randomised, parallel‐group, open‐label, 2‐armed, active controlled trial. Period of study: not mentioned. | |
| Participants | Number randomised: 61 Eligible were type 1 diabetes mellitus (IDDM) pregnant patients attending or referred to the Regional Joint Metabolic/Antenatal Clinic at the Royal Maternity Hospital, Belfast during the period of study. Inclusion criteria:
Exclusion criteria:
| |
| Interventions | Intervention: Pre‐prandial glucose monitoring (n = 31). Control: Post‐prandial glucose monitoring (n = 30). | |
| Outcomes | Outcomes used in this review: 1) Maternal glycaemic control (HbA1c, fasting blood glucose, post‐prandial blood glucose, fructosamine). 2) Birthweight. 3) Caesarean section rates. 4) Gestational age (at birth). 5) Frequency of neonatal hypoglycaemia. 6) Neonatal intensive care admissions. 7) Stillbirth. Outcomes not used in this review: 1) Insulin dosage. 2) Pre‐eclampsia. 3) Success in glycaemic control. 4) Compliance with schedule. 5) Birth trauma. 6) Cord Insulin. 7) Cord IGF‐1. 8) Neonatal glucose at age 1 hour. 9) Triceps skinfold thickness. 10) Subscapula skinfold thickness. | |
| Notes | Setting: Regional Joint Metabolic/Antenatal Clinic at the Royal Maternity Hospital, Belfast. Country: UK. Funding: Department of Health and Social Sevices, Northern lreland, the Northern Ireland Mother and Baby Appeal, the Metabolic Unit Research Fund, Royal Victoria Hospital, Belfast, the Royal Maternity Hospital, Royal Victoria Hospital, Belfast, and the Irish Perinatal Society. Comments:
| |
| Risk of bias | ||
| Bias | Authors' judgement | Support for judgement |
| Random sequence generation (selection bias) | Unclear risk | Quote ‐ "Women were randomly assigned at 16 weeks' gestation to 1 of 2 blood glucose monitoring protocols". Comment ‐ method not mentioned. |
| Allocation concealment (selection bias) | Low risk | Quote ‐ "allocations were via a sealed envelope system, which the patient selected from a box at the clinic visit". |
| Blinding of participants and personnel (performance bias) | Low risk | Comment ‐ No blinding of participants and personnel. |
| Blinding of outcome assessment (detection bias) | Low risk | Comment ‐ No blinding of outcome assessment. However, all outcomes were objectively measured. |
| Incomplete outcome data (attrition bias) | High risk | Quote ‐ "74 patients were recruited. 13 were excluded because they did not have results for analysis. This left 61 diabetic women (31 pre‐prandial and 30 post‐prandial monitoring) with results suitable for analysis". |
| Selective reporting (reporting bias) | Low risk | No obvious risk to selective reporting. |
| Other bias | Low risk | No obvious risk to other bias. |
| Methods | Randomised, parallel‐group, open‐label, 2‐armed, active controlled trial. Period of study: September 2003‐2006. | |
| Participants | Number randomised: 71. Eligible were type 1 (IDDM) and type 2 (NIDDM) diabetes mellitus pregnant patients attending 2 secondary care diabetic antenatal clinics in the UK during the period of study. Inclusion criteria:
Exclusion criteria:
| |
| Interventions | Intervention: Continuous glucose monitor which measured glucose in subcutaneous tissues every 10 seconds and an average value is stored every 5 minutes, providing up to 288 measurements per day (n = 38). The participants were required to wear the CGMS for 7 days at intervals of 4‐6 weeks. They were also advised to measure blood glucose at least 7 times a day. Control: Intermittent self‐monitoring of glucose levels (n = 33), at least 7 times a day (standard care). | |
| Outcomes | Outcomes used in this review: 1) Maternal glycaemic control (HbA1c). 2) Birthweight. 3) Gestational age. 4) Frequency of maternal hypoglycaemia. 5) Caesarean section rates. 6) Frequency of neonatal hypoglycaemia. 7) Preterm birth. 8) Death of baby (stillbirth/neonatal death). 9) Neonatal intensive care admissions. Outcomes not used in this review: 1) Number of women with pre‐eclampsia. 2) Number of terminations. 3) Small‐for‐gestational age. 4) Macrosomia (more than 90th centile) ‐ definition differ from the review. | |
| Notes | Setting: secondary care diabetic antenatal clinics. Country: UK. Funding: this was an investigator initiated study funded by the Ipswich Diabetes Centre Charity Research Fund. HRM also received salary support from Diabetes UK. The study equipment (6 x CGMS Gold monitors and 300 sensors) was donated free of charge by Medtronic UK. The research was sponsored by Ipswich Hospital NHS Trust and was independent of all the study funders. Comments:
| |
| Risk of bias | ||
| Bias | Authors' judgement | Support for judgement |
| Random sequence generation (selection bias) | Low risk | Quote ‐ "The study statistician used computer generated randomised numbers in blocks of 20". |
| Allocation concealment (selection bias) | Low risk | Quote ‐ "Concealed in sealed envelopes. Research nurses trained in accordance with good clinical practice guidelines provided the women with their group allocation". |
| Blinding of participants and personnel (performance bias) | Low risk | Comment ‐ No blinding of participants and personnel. However, this may not affect the results as all outcomes were objectively measured. |
| Blinding of outcome assessment (detection bias) | Low risk | Comment ‐ No blinding of outcome assessment. However, all outcomes were objectively measured. |
| Incomplete outcome data (attrition bias) | Low risk | Comment ‐ Intention‐to‐treat analysis was applied. |
| Selective reporting (reporting bias) | Unclear risk | Unclear. |
| Other bias | Low risk | No obvious risk to other bias. |
| Methods | Randomised, parallel‐group, open‐label, 2‐armed, active controlled trial. Period of study: not mentioned. | |
| Participants | Number randomised: 25. Eligible were type 1 diabetes mellitus (IDDM) pregnant patients attending the University Clinic of Endocrinology, Diabetes and Metabolic Disorders in Skopje during the period of study. Inclusion criteria:
Exclusion criteria:
| |
| Interventions | Intervention: Constant CGM ‐ 24 hours/day (n = 12). Control: Intermittent CGM ‐ 14 days per month (n = 13), measured blood glucose at least 6 times a day every second week (when not using the CGM). | |
| Outcomes | Outcomes used in this review: 1) Maternal glycaemic control (HbA1c, mean blood glucose). 2) Severe hypoglycaemia (maternal). 3) Caesarean section rates. 4) Preterm birth. 5) Neonatal hypoglycaemia. Outcomes not used in this review: 1) Birthweight greater than 4 kg ‐ not used as macrosomia is defined as birthweight > 4.5k g. 2) Insulin dosage. 3) Weight gain. 4) Diabetic ketoacidosis. | |
| Notes | Setting: University Clinic of Endocrinology, Diabetes and Metabolic Disorders in Skopje. Country: Macedonia. Funding: Macedonion Ministry of Health and the Health Care Fund of Macedonia. Comments:
| |
| Risk of bias | ||
| Bias | Authors' judgement | Support for judgement |
| Random sequence generation (selection bias) | Unclear risk | Quote ‐ "Patients were randomised into 2 groups". Comment ‐ Method not mentioned. |
| Allocation concealment (selection bias) | Unclear risk | Not mentioned. |
| Blinding of participants and personnel (performance bias) | Low risk | Comment ‐ No blinding of participants and personnel. However, this may not affect the results as all outcomes were objectively measured. |
| Blinding of outcome assessment (detection bias) | Low risk | Comment ‐ No blinding of outcome assessment. However, all outcomes were objectively measured. |
| Incomplete outcome data (attrition bias) | Low risk | Intention‐to‐treat analysis. |
| Selective reporting (reporting bias) | Unclear risk | Not mentioned. |
| Other bias | Low risk | No obvious risk to other bias. |
| Methods | Randomised, parallel‐group, open‐label, 2‐armed, active controlled trial. Period of study: 15 February 2009 to 15 February 2011. | |
| Participants | Number randomised: 154. Eligible were 123 type 1 (IDDM) and 31 type 2 (NIDDM) pregnant patients referred to the Centre for Pregnant Women with Diabetes, Rigshospitalet, before 14 completed gestational weeks. Inclusion criteria:
Exclusion criteria:
| |
| Interventions | Intervention: Real time CGM for 6 days at pregnancy visits during 8, 12, 21, 27 and 33 weeks, in addition to routine pregnancy care. Control: Routine pregnancy care with self‐monitored plasma glucose measurements of 7 times daily. | |
| Outcomes | Outcomes used in this review: 1) Gycemic control (HbA1c, plasma glucose). 2) Live births. 3) Miscarriage. 4) Caeserean section. 5) Gestational age at birth. 6) Preterm delivery. 7) Birthweight. 8) Neonatal hypoglycaemia. Outcomes not used in this review: 1) Weight gain in pregnancy. 2) Pre‐eclampsia. 3) Large‐for‐gestational age infant. | |
| Notes | Setting: Centre for Pregnant women with Diabetes, Rigshospitalet. Country: Denmark. Funding: the real‐time CGM monitors and links were supplied, and glucose sensors were offered at a reduced price by Medtronic. Comments: | |
| Risk of bias | ||
| Bias | Authors' judgement | Support for judgement |
| Random sequence generation (selection bias) | Low risk | Quote ‐ "a computer generated randomization program was used". |
| Allocation concealment (selection bias) | Low risk | Quote ‐ "..treatment allocation was properly concealed using automated telephone allocation service (Paravox) provided by an independent organization". |
| Blinding of participants and personnel (performance bias) | Low risk | Comment ‐ No blinding of participants and personnel. However, this may not affect the results as all outcomes were objectively measured. |
| Blinding of outcome assessment (detection bias) | Low risk | Comment ‐ No blinding of outcome assessment. However, all outcomes were objectively measured. |
| Incomplete outcome data (attrition bias) | Low risk | Quote ‐ "Intention‐to‐treat analysis was carried out". |
| Selective reporting (reporting bias) | Unclear risk | Not mentioned. |
| Other bias | Low risk | No obvious risk to other bias. |
| Methods | Randomised, parallel‐group, open‐label, 2‐armed, active controlled trial. Period of study: not mentioned. | |
| Participants | Number randomised: 13. Eligible were type 1 (IDDM) diabetes mellitus pregnant patients attending King College's Hospital. Inclusion criteria:
Exclusion criteria:
| |
| Interventions | Intervention: 1) Glucometer group (n = 7) measured blood glucose at home ‐ 7 times a day, twice weekly (before and after each main meal and before bedtime). Control: Non‐meter group (n = 6) ‐ checked urine glucose 4 times daily, random blood glucose measured at the fortnightly clinic visits. | |
| Outcomes | Outcomes used in this review: 1) Maternal glycaemic control (post‐prandial blood glucose). 2) Birthweight. Outcomes not used in this review: 1) Blood metabolite (lactate, alanine, glycerol, 3‐hydroxybutyrate). | |
| Notes | Setting: King's College hospital. Country: UK. Funding: Medical Research Council Project Grant and the British Diabetic Association. Comments:
| |
| Risk of bias | ||
| Bias | Authors' judgement | Support for judgement |
| Random sequence generation (selection bias) | Unclear risk | Comment ‐ not mentioned. |
| Allocation concealment (selection bias) | Unclear risk | Comment ‐ not mentioned. |
| Blinding of participants and personnel (performance bias) | Low risk | Comment ‐ No blinding of participants and personnel. However, this may not affect the results as all outcomes were objectively measured. |
| Blinding of outcome assessment (detection bias) | Low risk | Comment ‐ No blinding of outcome assessment. However, all outcomes were objectively measured. |
| Incomplete outcome data (attrition bias) | Low risk | Comment ‐ intention‐to‐treat. |
| Selective reporting (reporting bias) | Unclear risk | Not mentioned. |
| Other bias | Low risk | No obvious risk to other bias. |
| Methods | Randomised, parallel‐group, open‐label, 2‐armed, active controlled trial. Period of study: 1 February 1980 to 16 September 1981. | |
| Participants | Number randomised: 30. Eligible were type 1 diabetes mellitus (IDDM) pregnant patients attending the High Risk Obstetric Clinic at the University of Iowa Hospitals and Clinics during the period of study. Inclusion criteria:
Exclusion criteria:
| |
| Interventions | Intervention: Daily home glucose monitoring (n = 15) ‐ fasting, 2‐hour post‐prandial morning, afternoon and evening glucose values were measured daily. Control: Weekly venipuncture (n = 15) ‐ fasting, 2 hours after breakfast, and 2 hours after lunch glucose levels measured on 1 day each week. | |
| Outcomes | Outcomes used in this review: 1) Maternal glycaemic control (HbA1c). 2) Birthweight. 3) Caesarean section. 4) Gestational age. Outcomes not used in this review: 1) Cord vein C‐peptide. | |
| Notes | Setting: High Risk Obstetric Clinic at the University of Iowa Hospitals and Clinics, Iowa. Country: USA. Funding: Research Fellowship from the Iowa Affiliate of the American Diabetes Association. Comments:
| |
| Risk of bias | ||
| Bias | Authors' judgement | Support for judgement |
| Random sequence generation (selection bias) | Low risk | Quote ‐ "Patients were assigned to control and experimental groups using a random number sequence". |
| Allocation concealment (selection bias) | Unclear risk | Comment ‐ Not mentioned. |
| Blinding of participants and personnel (performance bias) | Low risk | Comment ‐ No blinding of participants and personnel. However, this may not affect the results as all outcomes were objectively measured. |
| Blinding of outcome assessment (detection bias) | Low risk | Comment ‐ No blinding of outcome assessment. However, all outcomes were objectively measured. |
| Incomplete outcome data (attrition bias) | High risk | 2 patients from each group had a first trimester spontaneous miscarriage and were excluded (2 out of 30 = 7%). |
| Selective reporting (reporting bias) | Unclear risk | Not mentioned. |
| Other bias | Low risk | No obvious risk to other bias. |
| Methods | Randomised, parallel‐group, open‐label, 2‐armed, active controlled trial. Period of study: not mentioned. | |
| Participants | Number randomised: 32. Eligible were type 1 diabetes mellitus (IDDM) pregnant patients attending the Clinic of Gastroenterology and Metabolic Diseases of the Medical Academy in Warsaw during the period of study. Inclusion criteria:
Exclusion criteria:
| |
| Interventions | Intervention: Telematic Management System (Central Clinical Unit and Patients' Teletransmission Modules) (n = 15) ‐ daily transfer of glycaemic data to diabetologist, at least 6 blood glucose measurements daily. Control: Standard care without Telematic Management System (n = 15), 6 blood glucose measurement daily and routine clinic visit every 3 weeks. | |
| Outcomes | Outcomes used in this review: 1) Maternal glycaemic control (HbA1c, mean blood glucose). 2) Hypoglycaemia (maternal). Outcomes not used in this review: 1) Hyperglycaemia (maternal). | |
| Notes | Setting: Clinic of Gastroenterology and Metabolic Diseases of the Medical Academy in Warsaw. Country: Poland. Funding: not mentioned. Comments:
| |
| Risk of bias | ||
| Bias | Authors' judgement | Support for judgement |
| Random sequence generation (selection bias) | Unclear risk | Randomisation stated but method of sequence generation not clear "Before randomization written consent was taken........". |
| Allocation concealment (selection bias) | High risk | Not possible as the same diabetologist was seeing both groups and knew to which group the participant belonged (control group could access the diabetologist by phone any time). |
| Blinding of participants and personnel (performance bias) | Low risk | Comment ‐ No blinding of participants and personnel. However, this may not affect the results as all outcomes were objectively measured. |
| Blinding of outcome assessment (detection bias) | Low risk | Comment ‐ No blinding of participants and personnel. However, all outcomes were objectively measured. |
| Incomplete outcome data (attrition bias) | Low risk | All participants accounted for and all data reported. |
| Selective reporting (reporting bias) | Low risk | No obvious risk to selective reporting. |
| Other bias | Low risk | No obvious risk to other bias. |
BMI: body mass index
CGM: continuous glucose monitoring
CGMS: continuous glucose monitoring system
DM: diabetes mellitus
GDM: gestational diabetes mellitus
IDDM: insulin‐dependent diabetes mellitus
IGF‐1: insulin‐like growth factor‐1
NIDDM: non insulin‐dependent diabetes mellitus
Characteristics of excluded studies [ordered by study ID]
Jump to:
| Study | Reason for exclusion |
| Cross‐over trial. Included women with GDM AND pre‐existing type 2 diabetes: results are not presented separately. | |
| Clinical trial registration ‐ for gestational diabetics only ‐ started in January 2012, expected to complete by April 2013. | |
| Abstract of an observational study of 8 type 1 diabetic pregnant women using CGMS. | |
| Clinical trial registration ‐ contacted author, no published data or report available. |
CGMS: continuous glucose monitoring system
GDM: gestational diabetes mellitus
Characteristics of ongoing studies [ordered by study ID]
Jump to:
| Trial name or title | Continuous glucose monitoring in women with type 1 diabetes in pregnancy trial (CONCEPTT). |
| Methods | Open‐label, parallel, 2‐arm, randomised controlled trial. |
| Participants | Type 1 diabetic pregnant women. |
| Interventions | Real time CGM versus home glucose monitoring (standard care). |
| Outcomes | HbA1c, pre‐eclampsia, caesarean sections, gestational weight gain, incidence of clinical events, hospital admission, birthweight, pregnancy loss (miscarriage, still birth, neonatal death), preterm delivery, birth injury, shoulder dystocia, neonatal hypoglycaemia, neonatal intensive care unit admission, etc. |
| Starting date | March 2013. |
| Contact information | Sonya Mergler, 416‐480‐5627, Email: [email protected] |
| Notes | Expected to complete by December 2015. |
| Trial name or title | Effectiveness of continuous glucose monitoring during diabetic pregnancy (GlucoMOMS trial); a randomised controlled trial. |
| Methods | Multicentre open‐label randomised controlled trial. |
| Participants | Type 1 or type 2 diabetics pregnant women, gestational diabetic women. |
| Interventions | CGM with standard care versus standard care. |
| Outcomes | Macrosomia, birthweight, composite neonatal morbidity, maternal outcome and costs. |
| Starting date | July 2011. |
| Contact information | Munster, van; +31 (0)88 7555555, Email: GlucoMOMS@studies‐obsgyn.nl |
| Notes | Expected to complete by July 2014. In September 2015 (Evers 2016) type 1 DM n = 109, type 2 DM n = 83, GDM n = 108. |
CGM: continuous glucose monitoring
Data and analyses
| Outcome or subgroup title | No. of studies | No. of participants | Statistical method | Effect size |
| 1 Caesarean section Show forest plot | 1 | 28 | Risk Ratio (M‐H, Fixed, 95% CI) | 0.78 [0.40, 1.49] |
| Analysis 1.1  Comparison 1 Self‐monitoring versus standard care, Outcome 1 Caesarean section. | ||||
| 2 Perinatal mortality Show forest plot | 1 | 28 | Risk Ratio (M‐H, Fixed, 95% CI) | 3.0 [0.13, 67.91] |
| Analysis 1.2 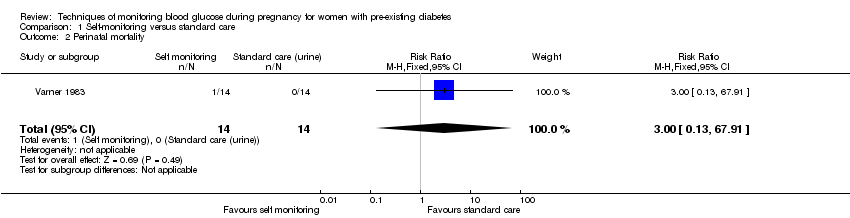 Comparison 1 Self‐monitoring versus standard care, Outcome 2 Perinatal mortality. | ||||
| 3 Neonatal mortality and morbidity composite Show forest plot | 1 | 28 | Risk Ratio (M‐H, Fixed, 95% CI) | 3.0 [0.13, 67.91] |
| Analysis 1.3  Comparison 1 Self‐monitoring versus standard care, Outcome 3 Neonatal mortality and morbidity composite. | ||||
| 4 Glycaemic control during/end of treatment (maternal post‐prandial blood glucose) Show forest plot | 1 | 13 | Mean Difference (IV, Fixed, 95% CI) | ‐0.70 [‐2.15, 0.75] |
| Analysis 1.4 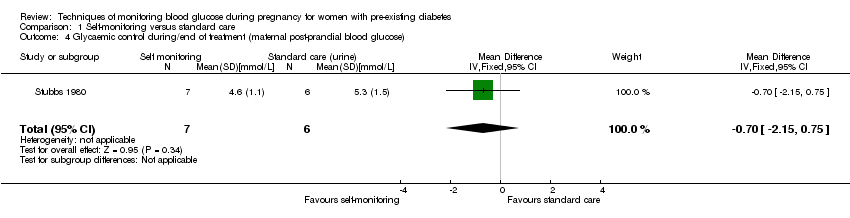 Comparison 1 Self‐monitoring versus standard care, Outcome 4 Glycaemic control during/end of treatment (maternal post‐prandial blood glucose). | ||||
| 5 Glycaemic control during/end of treatment (maternal HbA1c) Show forest plot | 1 | 28 | Mean Difference (IV, Fixed, 95% CI) | ‐0.10 [‐1.93, 1.73] |
| Analysis 1.5  Comparison 1 Self‐monitoring versus standard care, Outcome 5 Glycaemic control during/end of treatment (maternal HbA1c). | ||||
| 6 Miscarriage Show forest plot | 1 | 30 | Risk Ratio (M‐H, Fixed, 95% CI) | 1.0 [0.07, 14.55] |
| Analysis 1.6 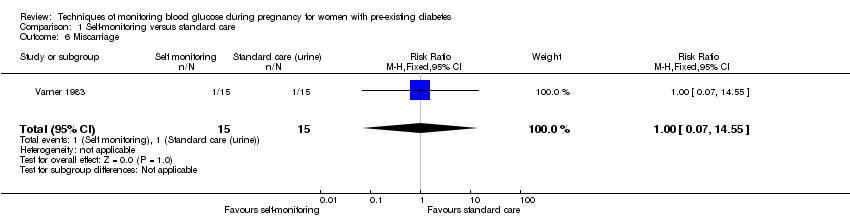 Comparison 1 Self‐monitoring versus standard care, Outcome 6 Miscarriage. | ||||
| 7 Neonatal mortality Show forest plot | 1 | 28 | Risk Ratio (M‐H, Fixed, 95% CI) | 3.0 [0.13, 67.91] |
| Analysis 1.7  Comparison 1 Self‐monitoring versus standard care, Outcome 7 Neonatal mortality. | ||||
| 8 Gestational age at birth Show forest plot | 1 | 28 | Mean Difference (IV, Fixed, 95% CI) | 0.40 [‐1.65, 2.45] |
| Analysis 1.8 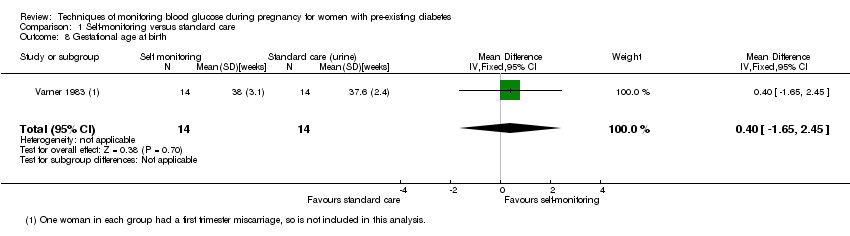 Comparison 1 Self‐monitoring versus standard care, Outcome 8 Gestational age at birth. | ||||
| 9 Birthweight Show forest plot | 2 | 41 | Mean Difference (IV, Fixed, 95% CI) | ‐0.18 [‐0.49, 0.13] |
| Analysis 1.9  Comparison 1 Self‐monitoring versus standard care, Outcome 9 Birthweight. | ||||
| 10 Respiratory distress syndrome Show forest plot | 1 | 28 | Risk Ratio (M‐H, Fixed, 95% CI) | 3.0 [0.13, 67.91] |
| Analysis 1.10 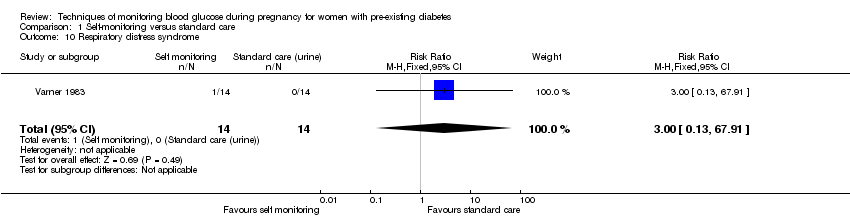 Comparison 1 Self‐monitoring versus standard care, Outcome 10 Respiratory distress syndrome. | ||||
| 11 Neonatal hypoglycaemia Show forest plot | 1 | 28 | Risk Ratio (M‐H, Fixed, 95% CI) | 0.57 [0.21, 1.52] |
| Analysis 1.11 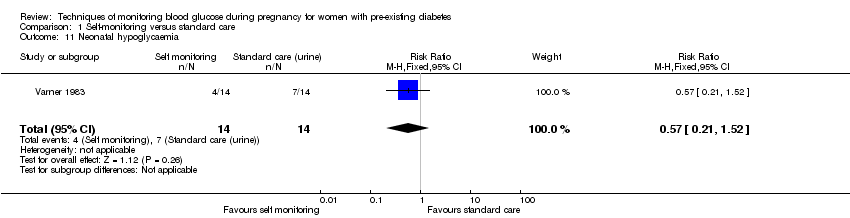 Comparison 1 Self‐monitoring versus standard care, Outcome 11 Neonatal hypoglycaemia. | ||||
| 12 Neonatal jaundice (hyperbilirubinaemia) Show forest plot | 1 | 28 | Risk Ratio (M‐H, Fixed, 95% CI) | 0.56 [0.25, 1.24] |
| Analysis 1.12  Comparison 1 Self‐monitoring versus standard care, Outcome 12 Neonatal jaundice (hyperbilirubinaemia). | ||||
| 13 Neonatal hypocalcaemia Show forest plot | 1 | 28 | Risk Ratio (M‐H, Fixed, 95% CI) | 1.0 [0.07, 14.45] |
| Analysis 1.13  Comparison 1 Self‐monitoring versus standard care, Outcome 13 Neonatal hypocalcaemia. | ||||
| 14 Neonatal polycythaemia Show forest plot | 1 | 28 | Risk Ratio (M‐H, Fixed, 95% CI) | 0.33 [0.01, 7.55] |
| Analysis 1.14  Comparison 1 Self‐monitoring versus standard care, Outcome 14 Neonatal polycythaemia. | ||||
| 15 Neonatal cord vein C‐peptide Show forest plot | 1 | 28 | Mean Difference (IV, Fixed, 95% CI) | 0.13 [‐0.50, 0.76] |
| Analysis 1.15  Comparison 1 Self‐monitoring versus standard care, Outcome 15 Neonatal cord vein C‐peptide. | ||||
| Outcome or subgroup title | No. of studies | No. of participants | Statistical method | Effect size |
| 1 Pre‐eclampsia Show forest plot | 1 | 100 | Risk Ratio (M‐H, Fixed, 95% CI) | 4.26 [0.52, 35.16] |
| Analysis 2.1  Comparison 2 Self‐monitoring versus hospitalisation, Outcome 1 Pre‐eclampsia. | ||||
| 2 Hypertension in pregnancy Show forest plot | 1 | 100 | Risk Ratio (M‐H, Fixed, 95% CI) | 0.43 [0.08, 2.22] |
| Analysis 2.2  Comparison 2 Self‐monitoring versus hospitalisation, Outcome 2 Hypertension in pregnancy. | ||||
| 3 Caesarean section Show forest plot | 1 | 100 | Risk Ratio (M‐H, Fixed, 95% CI) | 0.96 [0.65, 1.44] |
| Analysis 2.3  Comparison 2 Self‐monitoring versus hospitalisation, Outcome 3 Caesarean section. | ||||
| 4 Perinatal mortality Show forest plot | 1 | 100 | Risk Ratio (M‐H, Fixed, 95% CI) | 0.85 [0.05, 13.24] |
| Analysis 2.4  Comparison 2 Self‐monitoring versus hospitalisation, Outcome 4 Perinatal mortality. | ||||
| 5 Placental abruption Show forest plot | 1 | 100 | Risk Ratio (M‐H, Fixed, 95% CI) | 1.70 [0.16, 18.19] |
| Analysis 2.5  Comparison 2 Self‐monitoring versus hospitalisation, Outcome 5 Placental abruption. | ||||
| 6 Preterm birth < 37 weeks Show forest plot | 1 | 100 | Risk Ratio (M‐H, Fixed, 95% CI) | 0.85 [0.45, 1.60] |
| Analysis 2.6 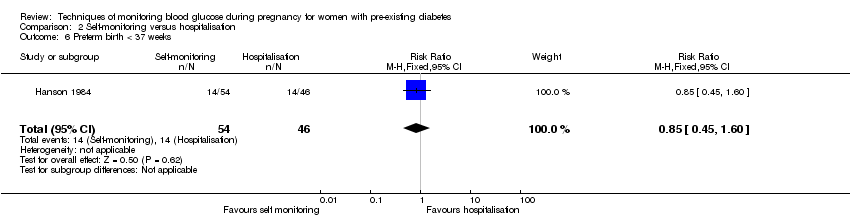 Comparison 2 Self‐monitoring versus hospitalisation, Outcome 6 Preterm birth < 37 weeks. | ||||
| 7 Respiratory distress syndrome Show forest plot | 1 | 100 | Risk Ratio (M‐H, Fixed, 95% CI) | 2.56 [0.28, 23.74] |
| Analysis 2.7  Comparison 2 Self‐monitoring versus hospitalisation, Outcome 7 Respiratory distress syndrome. | ||||
| 8 Neonatal hypoglycaemia Show forest plot | 1 | 100 | Risk Ratio (M‐H, Fixed, 95% CI) | 1.01 [0.50, 2.03] |
| Analysis 2.8  Comparison 2 Self‐monitoring versus hospitalisation, Outcome 8 Neonatal hypoglycaemia. | ||||
| 9 Neonatal jaundice (hyperbilirubinaemia) Show forest plot | 1 | 100 | Risk Ratio (M‐H, Fixed, 95% CI) | 2.27 [0.64, 8.07] |
| Analysis 2.9 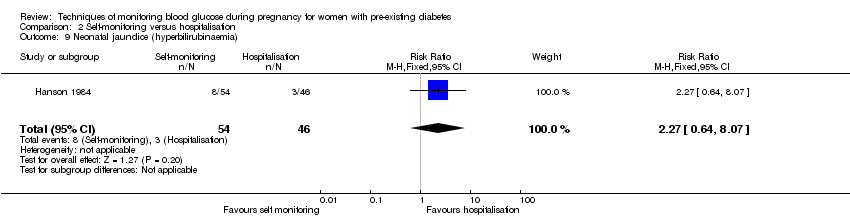 Comparison 2 Self‐monitoring versus hospitalisation, Outcome 9 Neonatal jaundice (hyperbilirubinaemia). | ||||
| 10 Major anomalies Show forest plot | 1 | 102 | Risk Ratio (M‐H, Fixed, 95% CI) | 0.27 [0.03, 2.54] |
| Analysis 2.10 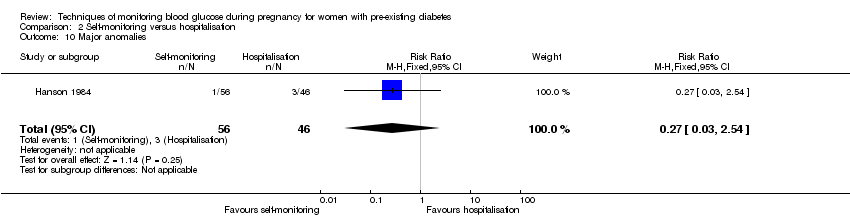 Comparison 2 Self‐monitoring versus hospitalisation, Outcome 10 Major anomalies. | ||||
| 11 Antenatal hospital admission Show forest plot | 1 | 100 | Risk Ratio (M‐H, Fixed, 95% CI) | 0.19 [0.11, 0.33] |
| Analysis 2.11  Comparison 2 Self‐monitoring versus hospitalisation, Outcome 11 Antenatal hospital admission. | ||||
| 12 Feeding difficulties (not pre‐specified) Show forest plot | 1 | 100 | Risk Ratio (M‐H, Fixed, 95% CI) | 0.85 [0.41, 1.78] |
| Analysis 2.12 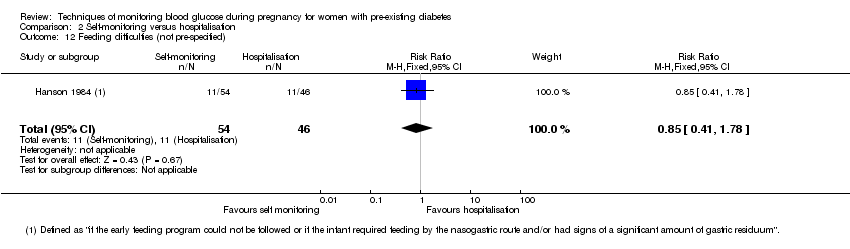 Comparison 2 Self‐monitoring versus hospitalisation, Outcome 12 Feeding difficulties (not pre‐specified). | ||||
| Outcome or subgroup title | No. of studies | No. of participants | Statistical method | Effect size |
| 1 Pre‐eclampsia Show forest plot | 1 | 58 | Risk Ratio (M‐H, Fixed, 95% CI) | 6.43 [0.82, 50.11] |
| Analysis 3.1  Comparison 3 Pre‐prandial versus post‐prandial glucose monitoring, Outcome 1 Pre‐eclampsia. | ||||
| 2 Caesarean section Show forest plot | 1 | 61 | Risk Ratio (M‐H, Fixed, 95% CI) | 1.45 [0.92, 2.28] |
| Analysis 3.2  Comparison 3 Pre‐prandial versus post‐prandial glucose monitoring, Outcome 2 Caesarean section. | ||||
| 3 Large‐for‐gestational age Show forest plot | 1 | 61 | Risk Ratio (M‐H, Fixed, 95% CI) | 1.16 [0.73, 1.85] |
| Analysis 3.3  Comparison 3 Pre‐prandial versus post‐prandial glucose monitoring, Outcome 3 Large‐for‐gestational age. | ||||
| 4 Perinatal mortality Show forest plot | 1 | 61 | Risk Ratio (M‐H, Fixed, 95% CI) | 2.91 [0.12, 68.66] |
| Analysis 3.4  Comparison 3 Pre‐prandial versus post‐prandial glucose monitoring, Outcome 4 Perinatal mortality. | ||||
| 5 Weight gain during pregnancy Show forest plot | 1 | 61 | Mean Difference (IV, Fixed, 95% CI) | ‐0.90 [‐3.86, 2.06] |
| Analysis 3.5  Comparison 3 Pre‐prandial versus post‐prandial glucose monitoring, Outcome 5 Weight gain during pregnancy. | ||||
| 6 Insulin dose Show forest plot | 1 | 61 | Mean Difference (IV, Fixed, 95% CI) | ‐17.40 [‐43.41, 8.61] |
| Analysis 3.6  Comparison 3 Pre‐prandial versus post‐prandial glucose monitoring, Outcome 6 Insulin dose. | ||||
| 7 Glycaemic control ‐ Insulin dose Show forest plot | 1 | 61 | Mean Difference (IV, Fixed, 95% CI) | ‐0.20 [‐0.45, 0.05] |
| Analysis 3.7 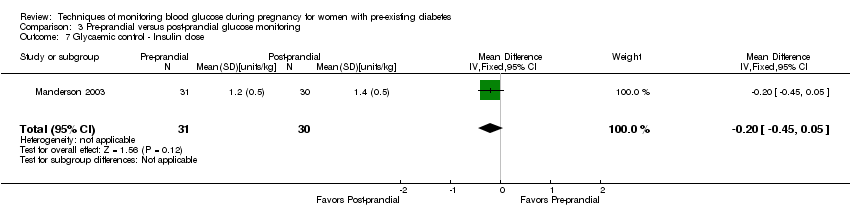 Comparison 3 Pre‐prandial versus post‐prandial glucose monitoring, Outcome 7 Glycaemic control ‐ Insulin dose. | ||||
| 8 Glycaemic control ‐ HbA1c Show forest plot | 1 | 61 | Mean Difference (IV, Fixed, 95% CI) | 0.30 [‐0.08, 0.68] |
| Analysis 3.8  Comparison 3 Pre‐prandial versus post‐prandial glucose monitoring, Outcome 8 Glycaemic control ‐ HbA1c. | ||||
| 9 Stillbirth Show forest plot | 1 | 61 | Risk Ratio (M‐H, Fixed, 95% CI) | 2.91 [0.12, 68.66] |
| Analysis 3.9 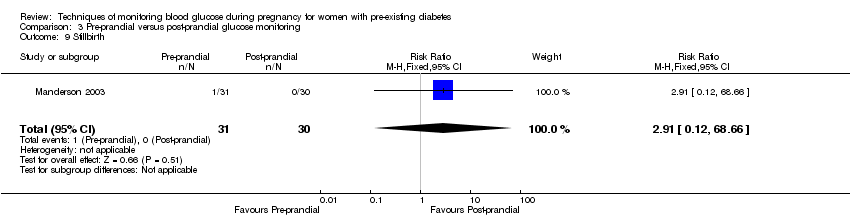 Comparison 3 Pre‐prandial versus post‐prandial glucose monitoring, Outcome 9 Stillbirth. | ||||
| 10 Gestational age at birth Show forest plot | 1 | 61 | Mean Difference (IV, Fixed, 95% CI) | 0.20 [‐0.84, 1.24] |
| Analysis 3.10  Comparison 3 Pre‐prandial versus post‐prandial glucose monitoring, Outcome 10 Gestational age at birth. | ||||
| 11 Preterm birth < 37 weeks Show forest plot | 1 | 61 | Risk Ratio (M‐H, Fixed, 95% CI) | 1.33 [0.62, 2.84] |
| Analysis 3.11 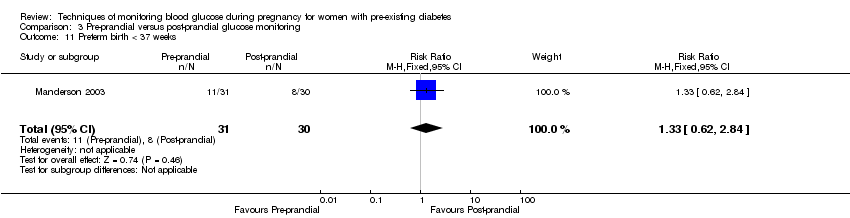 Comparison 3 Pre‐prandial versus post‐prandial glucose monitoring, Outcome 11 Preterm birth < 37 weeks. | ||||
| 12 Macrosomia Show forest plot | 1 | 61 | Risk Ratio (M‐H, Fixed, 95% CI) | 2.18 [0.75, 6.32] |
| Analysis 3.12  Comparison 3 Pre‐prandial versus post‐prandial glucose monitoring, Outcome 12 Macrosomia. | ||||
| 13 Birthweight Show forest plot | 1 | 61 | Mean Difference (IV, Fixed, 95% CI) | 0.24 [‐0.10, 0.58] |
| Analysis 3.13  Comparison 3 Pre‐prandial versus post‐prandial glucose monitoring, Outcome 13 Birthweight. | ||||
| 14 Adiposity ‐ Subscapula skinfold thickness Show forest plot | 1 | 61 | Mean Difference (IV, Fixed, 95% CI) | 0.60 [‐0.18, 1.38] |
| Analysis 3.14 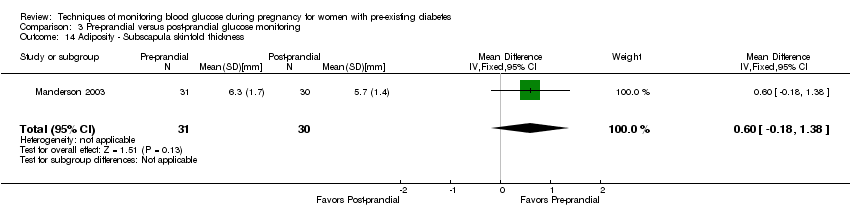 Comparison 3 Pre‐prandial versus post‐prandial glucose monitoring, Outcome 14 Adiposity ‐ Subscapula skinfold thickness. | ||||
| 15 Adiposity ‐ Triceps skinfold thickness Show forest plot | 1 | 61 | Mean Difference (IV, Fixed, 95% CI) | 0.60 [0.04, 1.16] |
| Analysis 3.15 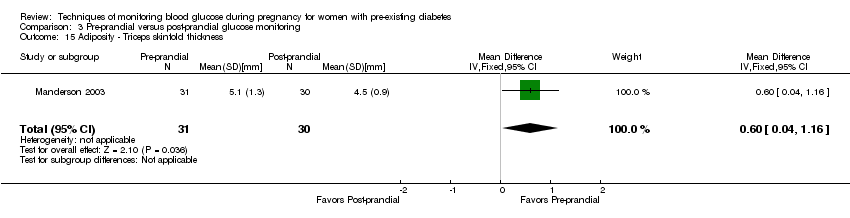 Comparison 3 Pre‐prandial versus post‐prandial glucose monitoring, Outcome 15 Adiposity ‐ Triceps skinfold thickness. | ||||
| 16 Birth trauma (shoulder dystocia, bone fracture, nerve palsy) (not pre‐specified as a composite) Show forest plot | 1 | 61 | Risk Ratio (M‐H, Fixed, 95% CI) | 0.48 [0.05, 5.06] |
| Analysis 3.16  Comparison 3 Pre‐prandial versus post‐prandial glucose monitoring, Outcome 16 Birth trauma (shoulder dystocia, bone fracture, nerve palsy) (not pre‐specified as a composite). | ||||
| 17 Respiratory distress syndrome Show forest plot | 1 | 61 | Risk Ratio (M‐H, Fixed, 95% CI) | 0.97 [0.06, 14.78] |
| Analysis 3.17 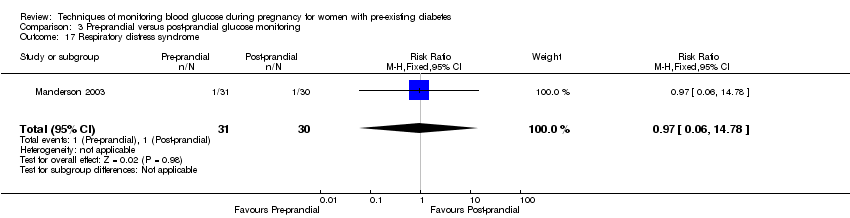 Comparison 3 Pre‐prandial versus post‐prandial glucose monitoring, Outcome 17 Respiratory distress syndrome. | ||||
| 18 Neonatal hypoglycaemia Show forest plot | 1 | 61 | Risk Ratio (M‐H, Fixed, 95% CI) | 1.09 [0.48, 2.45] |
| Analysis 3.18 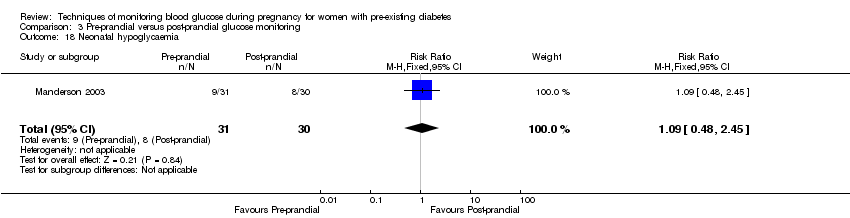 Comparison 3 Pre‐prandial versus post‐prandial glucose monitoring, Outcome 18 Neonatal hypoglycaemia. | ||||
| 19 Neonatal jaundice (hyperbilirubinaemia) Show forest plot | 1 | 61 | Risk Ratio (M‐H, Fixed, 95% CI) | 1.16 [0.40, 3.40] |
| Analysis 3.19 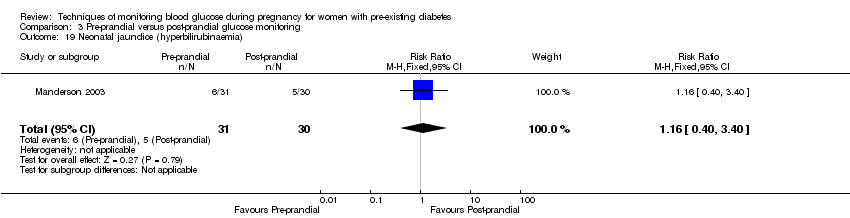 Comparison 3 Pre‐prandial versus post‐prandial glucose monitoring, Outcome 19 Neonatal jaundice (hyperbilirubinaemia). | ||||
| 20 Cord IGF‐1 Show forest plot | 1 | 61 | Mean Difference (IV, Fixed, 95% CI) | 1.30 [‐0.70, 3.30] |
| Analysis 3.20 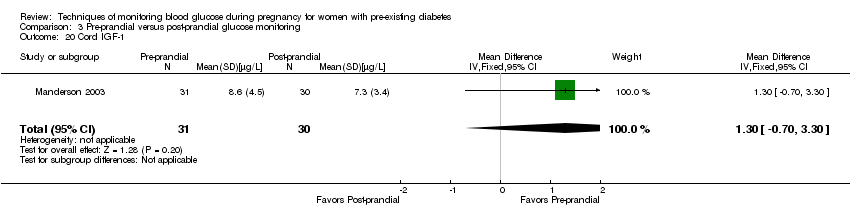 Comparison 3 Pre‐prandial versus post‐prandial glucose monitoring, Outcome 20 Cord IGF‐1. | ||||
| 21 Neonatal glucose at age 1 hour (not pre‐specified) Show forest plot | 1 | 61 | Mean Difference (IV, Fixed, 95% CI) | ‐0.20 [‐0.88, 0.48] |
| Analysis 3.21 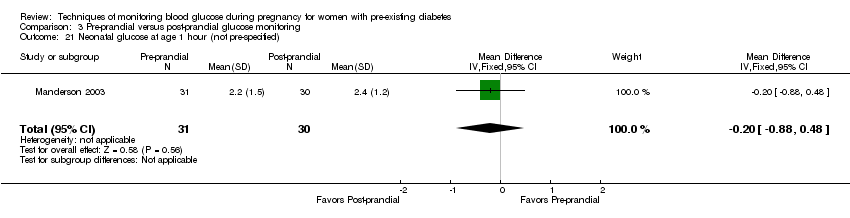 Comparison 3 Pre‐prandial versus post‐prandial glucose monitoring, Outcome 21 Neonatal glucose at age 1 hour (not pre‐specified). | ||||
| 22 Transient tachypnea (not pre‐specified) Show forest plot | 1 | 61 | Risk Ratio (M‐H, Fixed, 95% CI) | 2.58 [0.76, 8.81] |
| Analysis 3.22  Comparison 3 Pre‐prandial versus post‐prandial glucose monitoring, Outcome 22 Transient tachypnea (not pre‐specified). | ||||
| 23 Neonatal intensive care admissions Show forest plot | 1 | 59 | Risk Ratio (M‐H, Fixed, 95% CI) | 1.04 [0.62, 1.74] |
| Analysis 3.23  Comparison 3 Pre‐prandial versus post‐prandial glucose monitoring, Outcome 23 Neonatal intensive care admissions. | ||||
| Outcome or subgroup title | No. of studies | No. of participants | Statistical method | Effect size |
| 1 Caesarean section Show forest plot | 1 | 32 | Risk Ratio (M‐H, Fixed, 95% CI) | 0.96 [0.62, 1.48] |
| Analysis 4.1  Comparison 4 Automated telemedicine monitoring versus conventional, Outcome 1 Caesarean section. | ||||
| 2 Neonatal morbidity composite Show forest plot | 1 | 32 | Risk Ratio (M‐H, Fixed, 95% CI) | 1.18 [0.53, 2.62] |
| Analysis 4.2  Comparison 4 Automated telemedicine monitoring versus conventional, Outcome 2 Neonatal morbidity composite. | ||||
| 3 Weight gain during pregnancy [kg] Show forest plot | 1 | 32 | Mean Difference (IV, Fixed, 95% CI) | ‐0.70 [‐4.95, 3.55] |
| Analysis 4.3 ![Comparison 4 Automated telemedicine monitoring versus conventional, Outcome 3 Weight gain during pregnancy [kg].](/cdsr/doi/10.1002/14651858.CD009613.pub3/media/CDSR/CD009613/rel0003/CD009613/image_n/nCD009613-CMP-004-03.png) Comparison 4 Automated telemedicine monitoring versus conventional, Outcome 3 Weight gain during pregnancy [kg]. | ||||
| 4 Use of additional insulin therapy Show forest plot | 1 | 32 | Risk Ratio (M‐H, Fixed, 95% CI) | 1.0 [0.89, 1.12] |
| Analysis 4.4  Comparison 4 Automated telemedicine monitoring versus conventional, Outcome 4 Use of additional insulin therapy. | ||||
| 5 Insulin requirement at end of study Show forest plot | 1 | 20 | Mean Difference (IV, Fixed, 95% CI) | 18.4 [12.88, 23.92] |
| Analysis 4.5  Comparison 4 Automated telemedicine monitoring versus conventional, Outcome 5 Insulin requirement at end of study. | ||||
| 6 Glycaemic control ‐ Maternal fasting blood glucose: before breakfast Show forest plot | 1 | 20 | Mean Difference (IV, Fixed, 95% CI) | ‐1.0 [‐1.22, ‐0.78] |
| Analysis 4.6 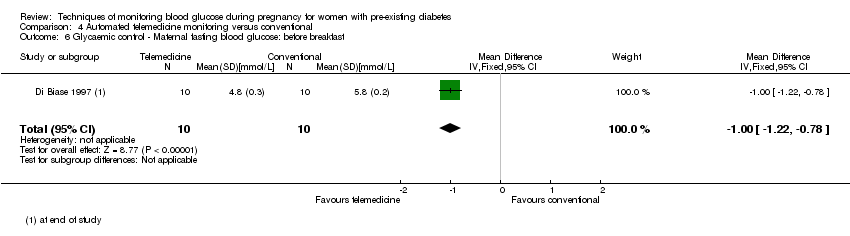 Comparison 4 Automated telemedicine monitoring versus conventional, Outcome 6 Glycaemic control ‐ Maternal fasting blood glucose: before breakfast. | ||||
| 7 Glycaemic control ‐ Maternal fasting blood glucose: before lunch Show forest plot | 1 | 20 | Mean Difference (IV, Fixed, 95% CI) | ‐1.10 [‐1.32, ‐0.88] |
| Analysis 4.7  Comparison 4 Automated telemedicine monitoring versus conventional, Outcome 7 Glycaemic control ‐ Maternal fasting blood glucose: before lunch. | ||||
| 8 Glycaemic control ‐ Maternal HbA1c Show forest plot | 3 | 82 | Mean Difference (IV, Random, 95% CI) | ‐0.17 [‐0.82, 0.48] |
| Analysis 4.8  Comparison 4 Automated telemedicine monitoring versus conventional, Outcome 8 Glycaemic control ‐ Maternal HbA1c. | ||||
| 9 Glycaemic control ‐ Maternal post‐prandial blood glucose Show forest plot | 2 | 50 | Mean Difference (IV, Random, 95% CI) | ‐0.80 [‐1.67, 0.08] |
| Analysis 4.9 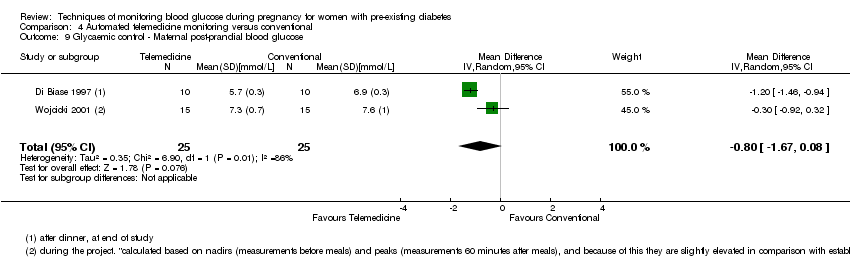 Comparison 4 Automated telemedicine monitoring versus conventional, Outcome 9 Glycaemic control ‐ Maternal post‐prandial blood glucose. | ||||
| 10 Gestational age at birth Show forest plot | 3 | 84 | Mean Difference (IV, Fixed, 95% CI) | 0.13 [‐0.14, 0.39] |
| Analysis 4.10 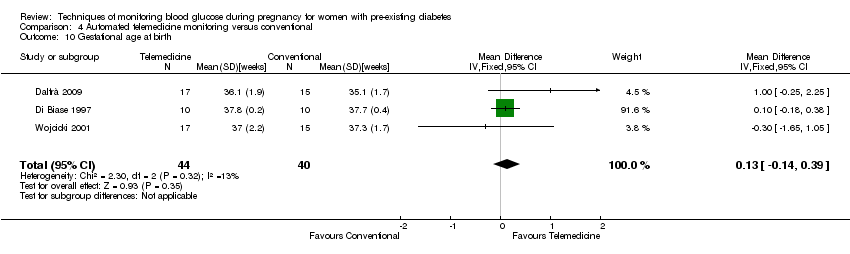 Comparison 4 Automated telemedicine monitoring versus conventional, Outcome 10 Gestational age at birth. | ||||
| 11 Macrosomia Show forest plot | 1 | 32 | Risk Ratio (M‐H, Fixed, 95% CI) | 1.18 [0.31, 4.43] |
| Analysis 4.11 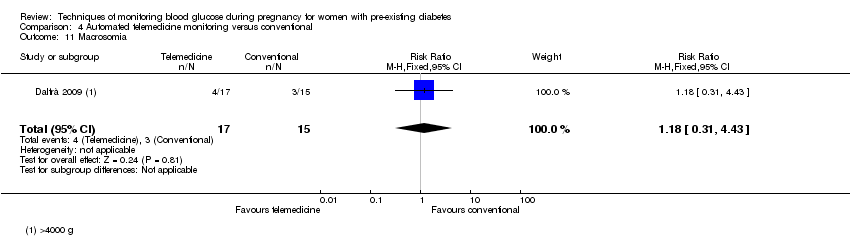 Comparison 4 Automated telemedicine monitoring versus conventional, Outcome 11 Macrosomia. | ||||
| 12 Birthweight Show forest plot | 1 | 32 | Mean Difference (IV, Fixed, 95% CI) | ‐0.16 [‐0.64, 0.32] |
| Analysis 4.12 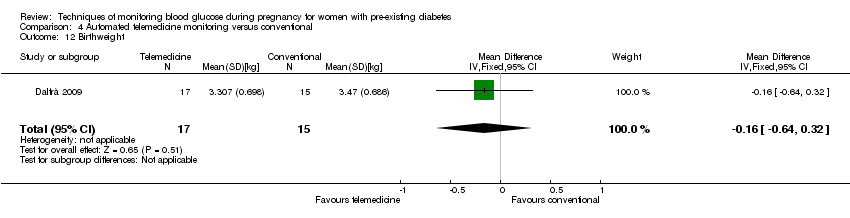 Comparison 4 Automated telemedicine monitoring versus conventional, Outcome 12 Birthweight. | ||||
| Outcome or subgroup title | No. of studies | No. of participants | Statistical method | Effect size |
| 1 Pre‐eclampsia Show forest plot | 2 | 225 | Risk Ratio (M‐H, Fixed, 95% CI) | 1.37 [0.52, 3.59] |
| Analysis 5.1 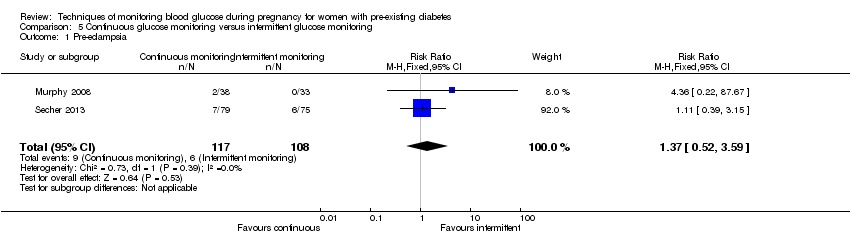 Comparison 5 Continuous glucose monitoring versus intermittent glucose monitoring, Outcome 1 Pre‐eclampsia. | ||||
| 2 Caesarean section Show forest plot | 2 | 225 | Risk Ratio (M‐H, Random, 95% CI) | 1.00 [0.65, 1.54] |
| Analysis 5.2  Comparison 5 Continuous glucose monitoring versus intermittent glucose monitoring, Outcome 2 Caesarean section. | ||||
| 3 Large‐for‐gestational age Show forest plot | 2 | 221 | Risk Ratio (M‐H, Random, 95% CI) | 0.89 [0.41, 1.92] |
| Analysis 5.3 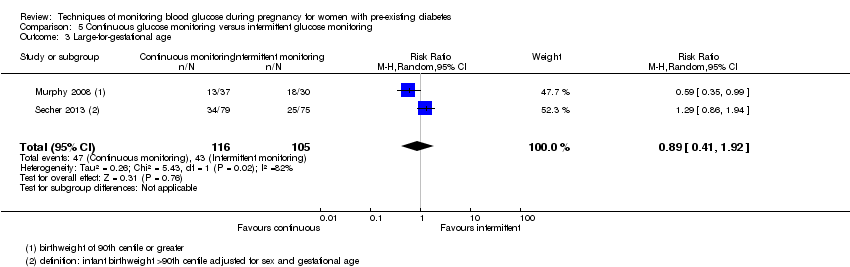 Comparison 5 Continuous glucose monitoring versus intermittent glucose monitoring, Outcome 3 Large‐for‐gestational age. | ||||
| 4 Perinatal mortality Show forest plot | 1 | 71 | Risk Ratio (M‐H, Fixed, 95% CI) | 0.82 [0.05, 12.61] |
| Analysis 5.4  Comparison 5 Continuous glucose monitoring versus intermittent glucose monitoring, Outcome 4 Perinatal mortality. | ||||
| 5 Glycaemic control ‐ Maternal HbA1c Show forest plot | 1 | 71 | Mean Difference (IV, Fixed, 95% CI) | ‐0.60 [‐0.91, ‐0.29] |
| Analysis 5.5  Comparison 5 Continuous glucose monitoring versus intermittent glucose monitoring, Outcome 5 Glycaemic control ‐ Maternal HbA1c. | ||||
| 6 Miscarriage Show forest plot | 2 | 228 | Risk Ratio (M‐H, Fixed, 95% CI) | 1.21 [0.28, 5.24] |
| Analysis 5.6  Comparison 5 Continuous glucose monitoring versus intermittent glucose monitoring, Outcome 6 Miscarriage. | ||||
| 7 Neonatal mortality Show forest plot | 1 | 74 | Risk Ratio (M‐H, Fixed, 95% CI) | 0.80 [0.05, 12.39] |
| Analysis 5.7  Comparison 5 Continuous glucose monitoring versus intermittent glucose monitoring, Outcome 7 Neonatal mortality. | ||||
| 8 Gestational age at birth Show forest plot | 1 | 68 | Mean Difference (IV, Fixed, 95% CI) | 0.10 [‐0.57, 0.77] |
| Analysis 5.8 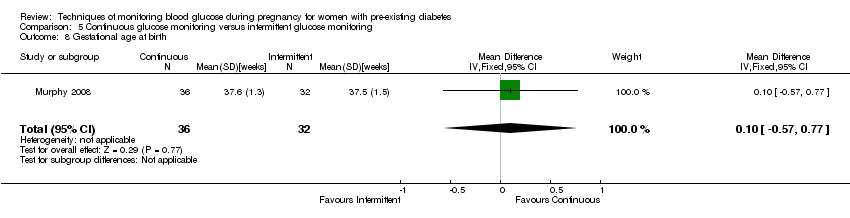 Comparison 5 Continuous glucose monitoring versus intermittent glucose monitoring, Outcome 8 Gestational age at birth. | ||||
| 9 Preterm birth < 37 weeks Show forest plot | 2 | 228 | Risk Ratio (M‐H, Fixed, 95% CI) | 1.10 [0.63, 1.94] |
| Analysis 5.9 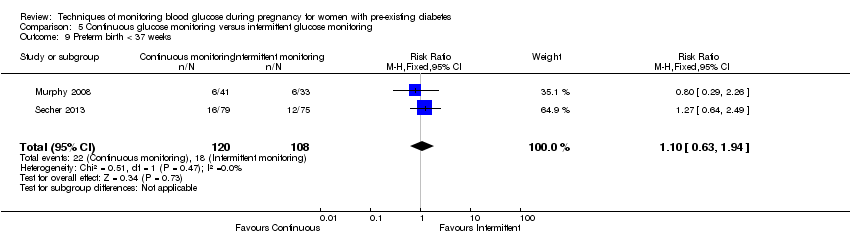 Comparison 5 Continuous glucose monitoring versus intermittent glucose monitoring, Outcome 9 Preterm birth < 37 weeks. | ||||
| 10 Small‐for‐gestational age Show forest plot | 1 | 67 | Risk Ratio (M‐H, Fixed, 95% CI) | 7.34 [0.41, 131.18] |
| Analysis 5.10  Comparison 5 Continuous glucose monitoring versus intermittent glucose monitoring, Outcome 10 Small‐for‐gestational age. | ||||
| 11 Birthweight Show forest plot | 1 | 67 | Mean Difference (IV, Fixed, 95% CI) | ‐0.29 [‐0.59, 0.01] |
| Analysis 5.11 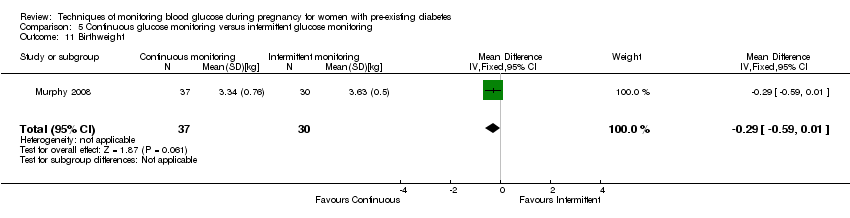 Comparison 5 Continuous glucose monitoring versus intermittent glucose monitoring, Outcome 11 Birthweight. | ||||
| 12 Neonatal hypoglycaemia Show forest plot | 2 | 228 | Risk Ratio (M‐H, Fixed, 95% CI) | 0.77 [0.51, 1.16] |
| Analysis 5.12 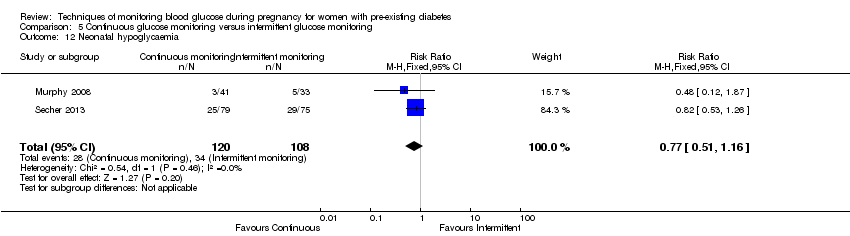 Comparison 5 Continuous glucose monitoring versus intermittent glucose monitoring, Outcome 12 Neonatal hypoglycaemia. | ||||
| 13 Major anomalies Show forest plot | 1 | 74 | Risk Ratio (M‐H, Fixed, 95% CI) | 0.80 [0.05, 12.39] |
| Analysis 5.13 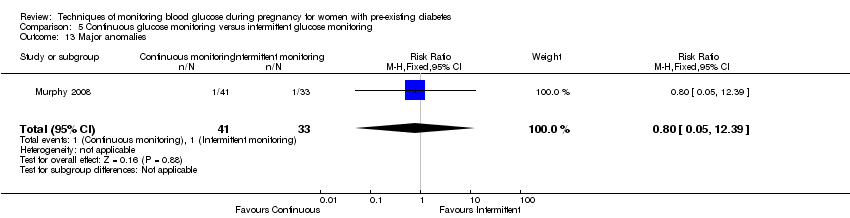 Comparison 5 Continuous glucose monitoring versus intermittent glucose monitoring, Outcome 13 Major anomalies. | ||||
| 14 Neonatal intensive care unit admissions Show forest plot | 1 | 74 | Risk Ratio (M‐H, Fixed, 95% CI) | 1.21 [0.48, 3.05] |
| Analysis 5.14  Comparison 5 Continuous glucose monitoring versus intermittent glucose monitoring, Outcome 14 Neonatal intensive care unit admissions. | ||||
| Outcome or subgroup title | No. of studies | No. of participants | Statistical method | Effect size |
| 1 Caesarean section Show forest plot | 1 | 25 | Risk Ratio (M‐H, Fixed, 95% CI) | 0.77 [0.33, 1.79] |
| Analysis 6.1  Comparison 6 Constant CGM versus intermittent CGM, Outcome 1 Caesarean section. | ||||
| 2 Weight gain during pregnancy Show forest plot | 1 | 25 | Mean Difference (IV, Fixed, 95% CI) | 0.5 [‐1.82, 2.82] |
| Analysis 6.2 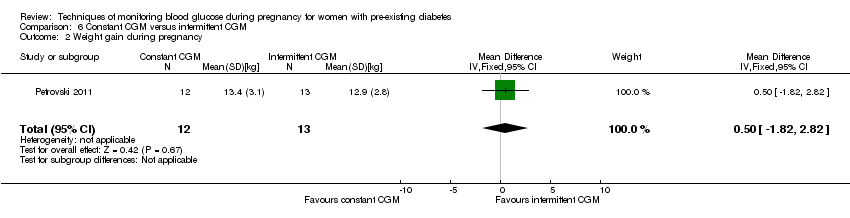 Comparison 6 Constant CGM versus intermittent CGM, Outcome 2 Weight gain during pregnancy. | ||||
| 3 Insulin dosage, 3rd trimester (IU/kg/day) Show forest plot | 1 | 25 | Mean Difference (IV, Fixed, 95% CI) | ‐0.03 [‐1.30, 1.24] |
| Analysis 6.3 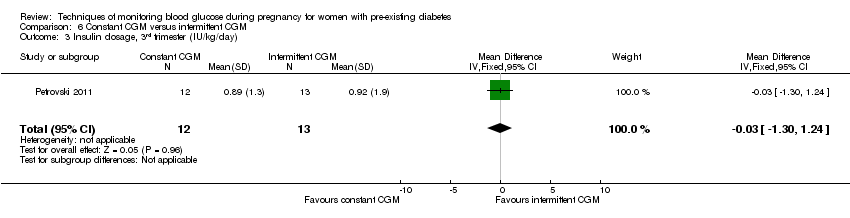 Comparison 6 Constant CGM versus intermittent CGM, Outcome 3 Insulin dosage, 3rd trimester (IU/kg/day). | ||||
| 4 Glycaemic control ‐ Maternal blood glucose (1st trimester) Show forest plot | 1 | 25 | Mean Difference (IV, Fixed, 95% CI) | ‐0.5 [‐2.70, 1.70] |
| Analysis 6.4  Comparison 6 Constant CGM versus intermittent CGM, Outcome 4 Glycaemic control ‐ Maternal blood glucose (1st trimester). | ||||
| 5 Glycaemic control ‐ Maternal blood glucose (3rd trimester) Show forest plot | 1 | 25 | Mean Difference (IV, Fixed, 95% CI) | ‐0.14 [‐2.00, 1.72] |
| Analysis 6.5  Comparison 6 Constant CGM versus intermittent CGM, Outcome 5 Glycaemic control ‐ Maternal blood glucose (3rd trimester). | ||||
| 6 Glycaemic control ‐ Maternal HbA1c (1st trimester) Show forest plot | 1 | 25 | Mean Difference (IV, Fixed, 95% CI) | ‐0.30 [‐1.13, 0.53] |
| Analysis 6.6  Comparison 6 Constant CGM versus intermittent CGM, Outcome 6 Glycaemic control ‐ Maternal HbA1c (1st trimester). | ||||
| 7 Glycaemic control ‐ Maternal HbA1c (3rd trimester) Show forest plot | 1 | 25 | Mean Difference (IV, Fixed, 95% CI) | ‐0.09 [‐0.69, 0.51] |
| Analysis 6.7 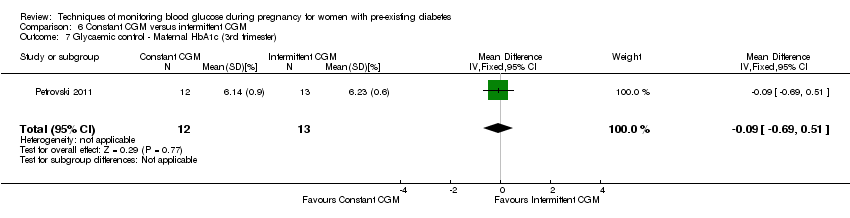 Comparison 6 Constant CGM versus intermittent CGM, Outcome 7 Glycaemic control ‐ Maternal HbA1c (3rd trimester). | ||||
| 8 Maternal hypoglycemia Show forest plot | 1 | 25 | Risk Ratio (M‐H, Fixed, 95% CI) | 0.54 [0.06, 5.24] |
| Analysis 6.8 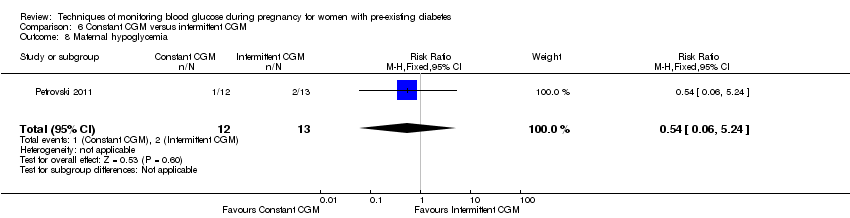 Comparison 6 Constant CGM versus intermittent CGM, Outcome 8 Maternal hypoglycemia. | ||||
| 9 Diabetic ketoacidosis (not pre‐specified) Show forest plot | 1 | 25 | Risk Ratio (M‐H, Fixed, 95% CI) | 0.36 [0.02, 8.05] |
| Analysis 6.9 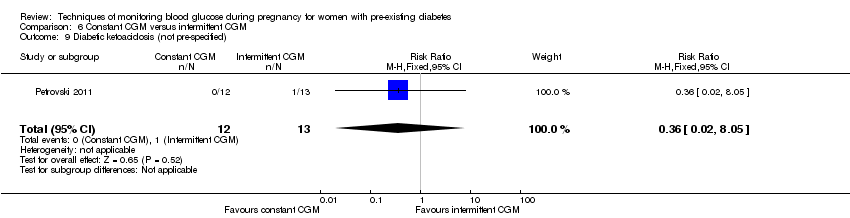 Comparison 6 Constant CGM versus intermittent CGM, Outcome 9 Diabetic ketoacidosis (not pre‐specified). | ||||
| 10 Preterm birth < 37 weeks Show forest plot | 1 | 25 | Risk Ratio (M‐H, Fixed, 95% CI) | 1.08 [0.08, 15.46] |
| Analysis 6.10 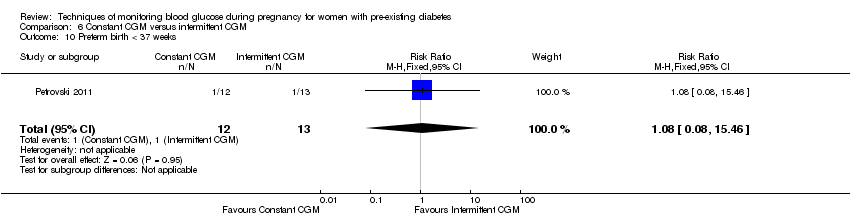 Comparison 6 Constant CGM versus intermittent CGM, Outcome 10 Preterm birth < 37 weeks. | ||||
| 11 Macrosomia Show forest plot | 1 | 25 | Risk Ratio (M‐H, Fixed, 95% CI) | 1.08 [0.08, 15.46] |
| Analysis 6.11 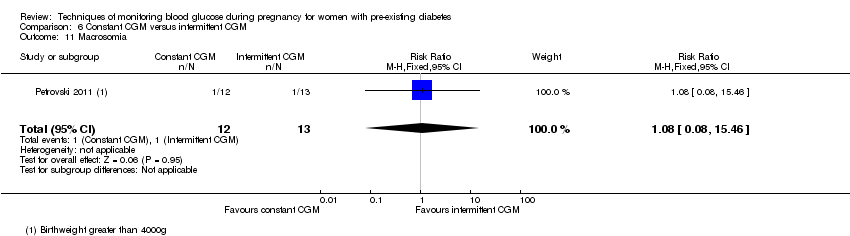 Comparison 6 Constant CGM versus intermittent CGM, Outcome 11 Macrosomia. | ||||
| 12 Neonatal hypoglycaemia Show forest plot | 1 | 25 | Risk Ratio (M‐H, Fixed, 95% CI) | 0.0 [0.0, 0.0] |
| Analysis 6.12 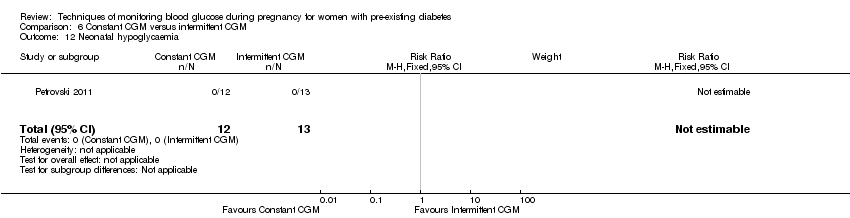 Comparison 6 Constant CGM versus intermittent CGM, Outcome 12 Neonatal hypoglycaemia. | ||||


'Risk of bias' summary: review authors' judgements about each risk of bias item for each included study.
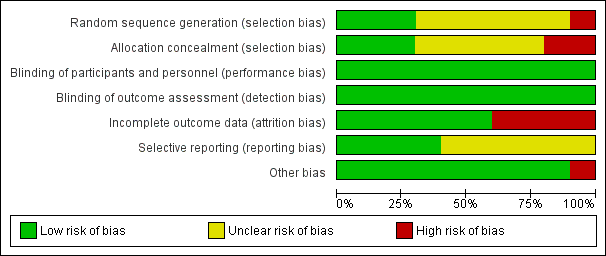
'Risk of bias' graph: review authors' judgements about each risk of bias item presented as percentages across all included studies.
Comparison 1 Self‐monitoring versus standard care, Outcome 1 Caesarean section.
Comparison 1 Self‐monitoring versus standard care, Outcome 2 Perinatal mortality.
Comparison 1 Self‐monitoring versus standard care, Outcome 3 Neonatal mortality and morbidity composite.
Comparison 1 Self‐monitoring versus standard care, Outcome 4 Glycaemic control during/end of treatment (maternal post‐prandial blood glucose).
Comparison 1 Self‐monitoring versus standard care, Outcome 5 Glycaemic control during/end of treatment (maternal HbA1c).
Comparison 1 Self‐monitoring versus standard care, Outcome 6 Miscarriage.
Comparison 1 Self‐monitoring versus standard care, Outcome 7 Neonatal mortality.
Comparison 1 Self‐monitoring versus standard care, Outcome 8 Gestational age at birth.
Comparison 1 Self‐monitoring versus standard care, Outcome 9 Birthweight.
Comparison 1 Self‐monitoring versus standard care, Outcome 10 Respiratory distress syndrome.
Comparison 1 Self‐monitoring versus standard care, Outcome 11 Neonatal hypoglycaemia.
Comparison 1 Self‐monitoring versus standard care, Outcome 12 Neonatal jaundice (hyperbilirubinaemia).
Comparison 1 Self‐monitoring versus standard care, Outcome 13 Neonatal hypocalcaemia.
Comparison 1 Self‐monitoring versus standard care, Outcome 14 Neonatal polycythaemia.
Comparison 1 Self‐monitoring versus standard care, Outcome 15 Neonatal cord vein C‐peptide.
Comparison 2 Self‐monitoring versus hospitalisation, Outcome 1 Pre‐eclampsia.
Comparison 2 Self‐monitoring versus hospitalisation, Outcome 2 Hypertension in pregnancy.
Comparison 2 Self‐monitoring versus hospitalisation, Outcome 3 Caesarean section.
Comparison 2 Self‐monitoring versus hospitalisation, Outcome 4 Perinatal mortality.
Comparison 2 Self‐monitoring versus hospitalisation, Outcome 5 Placental abruption.
Comparison 2 Self‐monitoring versus hospitalisation, Outcome 6 Preterm birth < 37 weeks.
Comparison 2 Self‐monitoring versus hospitalisation, Outcome 7 Respiratory distress syndrome.
Comparison 2 Self‐monitoring versus hospitalisation, Outcome 8 Neonatal hypoglycaemia.
Comparison 2 Self‐monitoring versus hospitalisation, Outcome 9 Neonatal jaundice (hyperbilirubinaemia).
Comparison 2 Self‐monitoring versus hospitalisation, Outcome 10 Major anomalies.
Comparison 2 Self‐monitoring versus hospitalisation, Outcome 11 Antenatal hospital admission.
Comparison 2 Self‐monitoring versus hospitalisation, Outcome 12 Feeding difficulties (not pre‐specified).
Comparison 3 Pre‐prandial versus post‐prandial glucose monitoring, Outcome 1 Pre‐eclampsia.
Comparison 3 Pre‐prandial versus post‐prandial glucose monitoring, Outcome 2 Caesarean section.
Comparison 3 Pre‐prandial versus post‐prandial glucose monitoring, Outcome 3 Large‐for‐gestational age.
Comparison 3 Pre‐prandial versus post‐prandial glucose monitoring, Outcome 4 Perinatal mortality.
Comparison 3 Pre‐prandial versus post‐prandial glucose monitoring, Outcome 5 Weight gain during pregnancy.
Comparison 3 Pre‐prandial versus post‐prandial glucose monitoring, Outcome 6 Insulin dose.
Comparison 3 Pre‐prandial versus post‐prandial glucose monitoring, Outcome 7 Glycaemic control ‐ Insulin dose.
Comparison 3 Pre‐prandial versus post‐prandial glucose monitoring, Outcome 8 Glycaemic control ‐ HbA1c.
Comparison 3 Pre‐prandial versus post‐prandial glucose monitoring, Outcome 9 Stillbirth.
Comparison 3 Pre‐prandial versus post‐prandial glucose monitoring, Outcome 10 Gestational age at birth.
Comparison 3 Pre‐prandial versus post‐prandial glucose monitoring, Outcome 11 Preterm birth < 37 weeks.
Comparison 3 Pre‐prandial versus post‐prandial glucose monitoring, Outcome 12 Macrosomia.
Comparison 3 Pre‐prandial versus post‐prandial glucose monitoring, Outcome 13 Birthweight.
Comparison 3 Pre‐prandial versus post‐prandial glucose monitoring, Outcome 14 Adiposity ‐ Subscapula skinfold thickness.
Comparison 3 Pre‐prandial versus post‐prandial glucose monitoring, Outcome 15 Adiposity ‐ Triceps skinfold thickness.
Comparison 3 Pre‐prandial versus post‐prandial glucose monitoring, Outcome 16 Birth trauma (shoulder dystocia, bone fracture, nerve palsy) (not pre‐specified as a composite).
Comparison 3 Pre‐prandial versus post‐prandial glucose monitoring, Outcome 17 Respiratory distress syndrome.
Comparison 3 Pre‐prandial versus post‐prandial glucose monitoring, Outcome 18 Neonatal hypoglycaemia.
Comparison 3 Pre‐prandial versus post‐prandial glucose monitoring, Outcome 19 Neonatal jaundice (hyperbilirubinaemia).
Comparison 3 Pre‐prandial versus post‐prandial glucose monitoring, Outcome 20 Cord IGF‐1.
Comparison 3 Pre‐prandial versus post‐prandial glucose monitoring, Outcome 21 Neonatal glucose at age 1 hour (not pre‐specified).
Comparison 3 Pre‐prandial versus post‐prandial glucose monitoring, Outcome 22 Transient tachypnea (not pre‐specified).
Comparison 3 Pre‐prandial versus post‐prandial glucose monitoring, Outcome 23 Neonatal intensive care admissions.
Comparison 4 Automated telemedicine monitoring versus conventional, Outcome 1 Caesarean section.
Comparison 4 Automated telemedicine monitoring versus conventional, Outcome 2 Neonatal morbidity composite.
Comparison 4 Automated telemedicine monitoring versus conventional, Outcome 3 Weight gain during pregnancy [kg].
Comparison 4 Automated telemedicine monitoring versus conventional, Outcome 4 Use of additional insulin therapy.
Comparison 4 Automated telemedicine monitoring versus conventional, Outcome 5 Insulin requirement at end of study.
Comparison 4 Automated telemedicine monitoring versus conventional, Outcome 6 Glycaemic control ‐ Maternal fasting blood glucose: before breakfast.
Comparison 4 Automated telemedicine monitoring versus conventional, Outcome 7 Glycaemic control ‐ Maternal fasting blood glucose: before lunch.
Comparison 4 Automated telemedicine monitoring versus conventional, Outcome 8 Glycaemic control ‐ Maternal HbA1c.
Comparison 4 Automated telemedicine monitoring versus conventional, Outcome 9 Glycaemic control ‐ Maternal post‐prandial blood glucose.
Comparison 4 Automated telemedicine monitoring versus conventional, Outcome 10 Gestational age at birth.
Comparison 4 Automated telemedicine monitoring versus conventional, Outcome 11 Macrosomia.
Comparison 4 Automated telemedicine monitoring versus conventional, Outcome 12 Birthweight.
Comparison 5 Continuous glucose monitoring versus intermittent glucose monitoring, Outcome 1 Pre‐eclampsia.
Comparison 5 Continuous glucose monitoring versus intermittent glucose monitoring, Outcome 2 Caesarean section.
Comparison 5 Continuous glucose monitoring versus intermittent glucose monitoring, Outcome 3 Large‐for‐gestational age.
Comparison 5 Continuous glucose monitoring versus intermittent glucose monitoring, Outcome 4 Perinatal mortality.
Comparison 5 Continuous glucose monitoring versus intermittent glucose monitoring, Outcome 5 Glycaemic control ‐ Maternal HbA1c.
Comparison 5 Continuous glucose monitoring versus intermittent glucose monitoring, Outcome 6 Miscarriage.
Comparison 5 Continuous glucose monitoring versus intermittent glucose monitoring, Outcome 7 Neonatal mortality.
Comparison 5 Continuous glucose monitoring versus intermittent glucose monitoring, Outcome 8 Gestational age at birth.
Comparison 5 Continuous glucose monitoring versus intermittent glucose monitoring, Outcome 9 Preterm birth < 37 weeks.
Comparison 5 Continuous glucose monitoring versus intermittent glucose monitoring, Outcome 10 Small‐for‐gestational age.
Comparison 5 Continuous glucose monitoring versus intermittent glucose monitoring, Outcome 11 Birthweight.
Comparison 5 Continuous glucose monitoring versus intermittent glucose monitoring, Outcome 12 Neonatal hypoglycaemia.
Comparison 5 Continuous glucose monitoring versus intermittent glucose monitoring, Outcome 13 Major anomalies.
Comparison 5 Continuous glucose monitoring versus intermittent glucose monitoring, Outcome 14 Neonatal intensive care unit admissions.
Comparison 6 Constant CGM versus intermittent CGM, Outcome 1 Caesarean section.
Comparison 6 Constant CGM versus intermittent CGM, Outcome 2 Weight gain during pregnancy.
Comparison 6 Constant CGM versus intermittent CGM, Outcome 3 Insulin dosage, 3rd trimester (IU/kg/day).
Comparison 6 Constant CGM versus intermittent CGM, Outcome 4 Glycaemic control ‐ Maternal blood glucose (1st trimester).
Comparison 6 Constant CGM versus intermittent CGM, Outcome 5 Glycaemic control ‐ Maternal blood glucose (3rd trimester).
Comparison 6 Constant CGM versus intermittent CGM, Outcome 6 Glycaemic control ‐ Maternal HbA1c (1st trimester).
Comparison 6 Constant CGM versus intermittent CGM, Outcome 7 Glycaemic control ‐ Maternal HbA1c (3rd trimester).
Comparison 6 Constant CGM versus intermittent CGM, Outcome 8 Maternal hypoglycemia.
Comparison 6 Constant CGM versus intermittent CGM, Outcome 9 Diabetic ketoacidosis (not pre‐specified).
Comparison 6 Constant CGM versus intermittent CGM, Outcome 10 Preterm birth < 37 weeks.
Comparison 6 Constant CGM versus intermittent CGM, Outcome 11 Macrosomia.
Comparison 6 Constant CGM versus intermittent CGM, Outcome 12 Neonatal hypoglycaemia.
| Self‐monitoring compared to standard care for women with pre‐existing diabetes | ||||||
| Patient or population: women with pre‐existing diabetes | ||||||
| Outcomes | Anticipated absolute effects* (95% CI) | Relative effect | № of participants | Quality of the evidence | Comments | |
| Risk with standard care | Risk with self‐monitoring | |||||
| Hypertensive disorders of pregnancy: pre‐eclampsia | Study population | (0 studies) | The included study did not report this outcome. | |||
| Hypertensive disorders of pregnancy: gestational hypertension | Study population | (0 studies) | The included study did not report this outcome. | |||
| Caesarean section | Study population | RR 0.78 | 28 | ⊕⊝⊝⊝ | ||
| 643 per 1000 | 501 per 1000 | |||||
| Glycaemic control during/end of treatment: Maternal HbA1c (%) | The mean maternal HbA1c was 7.2% | The mean maternal HbA1c with self‐monitoring was 0.10 lower (1.93 lower to 1.73 higher) | 28 | ⊕⊝⊝⊝ | ||
| Glycaemic control during/end of treatment: Maternal post‐prandial blood glucose (mmmol/L) | The mean maternal post‐prandial blood glucose was 5.3 mmol/L | MD 0.70 lower | 13 | ⊕⊝⊝⊝ | ||
| Large‐for‐gestational age | Study population | (0 studies) | The included study did not report this outcome. | |||
| Perinatal mortality | Study population | RR 3.00 | 28 | ⊕⊝⊝⊝ | There were no events in the standard care group and so anticipated absolute effects could not be calculated. | |
| 0 per 1000 | 0 per 1000 | |||||
| Preterm birth less than 37 weeks' gestation | Study population | (0 studies) | The included study did not report this outcome. | |||
| Preterm birth less than 34 weeks' gestation | Study population | (0 studies) | The included study did not report this outcome. | |||
| *The risk in the intervention group (and its 95% confidence interval) is based on the assumed risk in the comparison group and the relative effect of the intervention (and its 95% CI). | ||||||
| GRADE Working Group grades of evidence | ||||||
| 1 One study with design limitations. 2 Wide CI crossing the line of no effect, few events and small sample size. 3 Wide CI crossing the line of no effect, and small sample size. | ||||||
| Self‐monitoring compared to hospitalisation for women with pre‐existing diabetes | ||||||
| Patient or population: women with pre‐existing diabetes | ||||||
| Outcomes | Anticipated absolute effects* (95% CI) | Relative effect | № of participants | Quality of the evidence | Comments | |
| Risk with hospitalisation | Risk with self‐monitoring | |||||
| Hypertensive disorders of pregnancy: pre‐eclampsia | Study population | RR 4.26 | 100 | ⊕⊝⊝⊝ | ||
| 22 per 1000 | 93 per 1000 | |||||
| Hypertensive disorders of pregnancy: hypertension in pregnancy | Study population | RR 0.43 | 100 | ⊕⊝⊝⊝ | ||
| 87 per 1000 | 37 per 1000 | |||||
| Caesarean section | Study population | RR 0.96 | 100 | ⊕⊝⊝⊝ | ||
| 500 per 1000 | 480 per 1000 | |||||
| Glycaemic control during/end of treatment: maternal HbA1c | (0 studies) | The included study did not report this outcome. | ||||
| Glycaemic control during/end of treatment: maternal post‐prandial blood glucose | (0 studies) | The included study did not report this outcome. | ||||
| Large‐for‐gestational age | Study population | (0 studies) | The included study did not report this outcome. | |||
| Perinatal mortality | Study population | RR 0.85 | 100 | ⊕⊝⊝⊝ | ||
| 22 per 1000 | 18 per 1000 | |||||
| Preterm birth less than 37 weeks' gestation | Study population | RR 0.85 | 100 | ⊕⊝⊝⊝ | ||
| 304 per 1000 | 259 per 1000 | |||||
| Preterm birth less than 34 weeks' gestation | Study population | (0 studies) | The included study did not report this outcome. | |||
| *The risk in the intervention group (and its 95% confidence interval) is based on the assumed risk in the comparison group and the relative effect of the intervention (and its 95% CI). | ||||||
| GRADE Working Group grades of evidence | ||||||
| 1 One study with design limitations. 2 Wide CI crossing the line of no effect, few events and small sample size. | ||||||
| Pre‐prandial compared to post‐prandial glucose monitoring for women with pre‐existing diabetes | ||||||
| Patient or population: women with pre‐existing diabetes | ||||||
| Outcomes | Anticipated absolute effects* (95% CI) | Relative effect | № of participants | Quality of the evidence | Comments | |
| Risk with post‐prandial glucose monitoring | Risk with pre‐prandial | |||||
| Hypertensive disorders of pregnancy: pre‐eclampsia | Study population | RR 6.43 | 58 | ⊕⊝⊝⊝ | ||
| 33 per 1000 | 214 per 1000 | |||||
| Hypertensive disorders of pregnancy: gestational hypertension | Study population | (0 studies) | The included study did not report this outcome. | |||
| Caesarean section | Study population | RR 1.45 | 61 | ⊕⊝⊝⊝ | ||
| 467 per 1000 | 677 per 1000 | |||||
| Glycaemic control during/end of treatment: HbA1c (%) | The mean hbA1c was 6% | The mean maternal HbA1c with pre‐prandial monitoring as 0.30 higher (0.08 lower to 0.68 higher) | 61 | ⊕⊝⊝⊝ | ||
| Glycaemic control during/end of treatment: post‐prandial blood glucose | (0 studies) | The included study did not report this outcome. | ||||
| Large‐for‐gestational age | Study population | RR 1.16 | 61 | ⊕⊝⊝⊝ | ||
| 500 per 1000 | 580 per 1000 | |||||
| Perinatal mortality | Study population | RR 2.91 | 61 | ⊕⊝⊝⊝ | There were no events in the standard care group and so anticipated absolute effects could not be calculated. | |
| 0 per 1000 | 0 per 1000 | |||||
| Preterm birth less than 37 weeks | Study population | RR 1.33 | 61 | ⊕⊝⊝⊝ | ||
| 267 per 1000 | 355 per 1000 | |||||
| Preterm birth less than 34 weeks' gestation | Study population | (0 studies) | The included study did not report this outcome. | |||
| *The risk in the intervention group (and its 95% confidence interval) is based on the assumed risk in the comparison group and the relative effect of the intervention (and its 95% CI). | ||||||
| GRADE Working Group grades of evidence | ||||||
| 1 One study with design limitations. 2 Wide CI crossing the line of no effect, few events and small sample size. 3 Wide CI crossing the line of no effect, and small sample size. | ||||||
| Automated telemedicine monitoring compared to conventional for women with pre‐existing diabetes | ||||||
| Patient or population: women with pre‐existing diabetes | ||||||
| Outcomes | Anticipated absolute effects* (95% CI) | Relative effect | № of participants | Quality of the evidence | Comments | |
| Risk with conventional monitoring | Risk with automated telemedicine monitoring | |||||
| Hypertensive disorders of pregnancy: pre‐eclampsia, gestational hypertension | Study population | (0 studies) | The included studies did not report this outcome. | |||
| Hypertensive disorders of pregnancy: gestational hypertension | Study population | (0 studies) | The included studies did not report this outcome. | |||
| Caesarean section | Study population | RR 0.96 | 32 | ⊕⊝⊝⊝ | ||
| 733 per 1000 | 704 per 1000 | |||||
| Glycaemic control during/end of treatment: maternal HbA1c (%) | The mean maternal HbA1c ranged from 5.7 to 6.7% | The mean maternal HbA1c with automated telemedicine monitoring as 0.17 lower (0.82 lower to 0.48 higher) | 82 | ⊕⊝⊝⊝ | ||
| Glycaemic control during/end of treatment: maternal post‐prandial blood glucose (mmol/L) | The mean maternal post‐prandial blood glucose ranged from 6.9 to 7.6% | The mean post‐prandial blood glucose with automated telemedicine monitoring as 0.80 lower (1.67 lower to 0.08 higher) | 50 | ⊕⊝⊝⊝ | ||
| Large‐for‐gestational age | Study population | (0 studies) | The included studies did not report this outcome. | |||
| Perinatal mortality | Study population | (0 studies) | The included studies did not report this outcome. | |||
| Preterm birth less than 37 weeks' gestation | Study population | (0 studies) | The included studies did not report this outcome. | |||
| Preterm birth less than 34 weeks' gestation | Study population | (0 studies) | The included studies did not report this outcome. | |||
| *The risk in the intervention group (and its 95% confidence interval) is based on the assumed risk in the comparison group and the relative effect of the intervention (and its 95% CI). | ||||||
| GRADE Working Group grades of evidence | ||||||
| 1 One study with serious design limitations. 2 Wide CI crossing the line of no effect, few events and small sample size. 3 Studies had design limitations. 4 Statistical heterogeneity (I² = 82%). 5 Wide CI crossing the line of no effect, and small sample size. 6 Statistical heterogeneity (I² = 86%). | ||||||
| Continuous glucose monitoring compared to intermittent glucose monitoring for women with pre‐existing diabetes | ||||||
| Patient or population: women with pre‐existing diabetes | ||||||
| Outcomes | Anticipated absolute effects* (95% CI) | Relative effect | № of participants | Quality of the evidence | Comments | |
| Risk with intermittent glucose monitoring | Risk with continuous glucose monitoring | |||||
| Hypertensive disorders of pregnancy: pre‐eclampsia | Study population | RR 1.37 | 225 | ⊕⊕⊝⊝ | ||
| 56 per 1000 | 76 per 1000 | |||||
| Hypertensive disorders of pregnancy: gestational hypertension | Study population | (0 studies) | The included studies did not report this outcome. | |||
| Caesarean section | Study population | RR 1.00 | 225 | ⊕⊝⊝⊝ | ||
| 481 per 1000 | 481 per 1000 | |||||
| Glycaemic control during/end of treatment: maternal HbA1c (%) | The mean maternal HbA1c was 6.4% | The mean maternal HbA1c with continuous glucose monitoring was 0.60 lower (0.91 lower to 0.29 higher) | 71 | ⊕⊕⊕⊝ | ||
| Glycaemic control during/end of treatment: post‐prandial blood glucose | (0 studies) | The included studies did not report this outcome. | ||||
| Large‐for‐gestational age | Study population | RR 0.89 | 221 | ⊕⊝⊝⊝ | ||
| 410 per 1000 | 364 per 1000 | |||||
| Perinatal mortality | Study population | RR 0.82 | 71 | ⊕⊕⊝⊝ | ||
| 31 per 1000 | 26 per 1000 | |||||
| Preterm birth less than 37 weeks | Study population | RR 1.10 | 228 | ⊕⊕⊝⊝ | ||
| 167 per 1000 | 183 per 1000 | |||||
| Preterm birth less than 34 weeks' gestation | Study population | (0 studies) | The included studies did not report this outcome. | |||
| *The risk in the intervention group (and its 95% confidence interval) is based on the assumed risk in the comparison group and the relative effect of the intervention (and its 95% CI). | ||||||
| GRADE Working Group grades of evidence | ||||||
| 1 Wide CI crossing the line of no effect, few events and small sample size. 2 Statistical heterogeneity (I² = 62%). 3 Wide CI crossing the line of no effect, and small sample size. 4 Small sample size. 5 Statistical heterogeneity (I² = 82%). | ||||||
| Constant CGM compared to Intermittent CGM for women with pre‐existing diabetes | ||||||
| Patient or population: women with pre‐existing diabetes | ||||||
| Outcomes | Anticipated absolute effects* (95% CI) | Relative effect | № of participants | Quality of the evidence | Comments | |
| Risk with Intermittent CGM | Risk with constant CGM | |||||
| Hypertensive disorders of pregnancy: pre‐eclampsia | Study population | (0 studies) | The included study did not report this outcome. | |||
| Hypertensive disorders of pregnancy: gestational hypertension | Study population | (0 studies) | The included study did not report this outcome. | |||
| Caesarean section | Study population | RR 0.77 | 25 | ⊕⊝⊝⊝ | ||
| 538 per 1000 | 415 per 1000 | |||||
| Glycaemic control during/end of treatment: maternal HbA1c (3rd trimester) (%) | The mean maternal HbA1c (3rd trimester) was 6.23% | The mean maternal HbA1c with constant CGM was 0.09 lower (0.69 lower to 0.51 higher) | 25 | ⊕⊝⊝⊝ | ||
| Glycaemic control during/end of treatment: maternal blood glucose (3rd trimester) (mmmol/L) | The mean maternal blood glucose (3rd trimester) was 0 | The mean maternal blood glucose (3rd trimester) with constant CGM was 0.14 lower (2.00 lower to 1.72 higher) | 25 | ⊕⊝⊝⊝ | ||
| Large‐for‐gestational age | Study population | (0 studies) | The included study did not report this outcome. | |||
| Perinatal mortality | Study population | (0 studies) | The included study did not report this outcome. | |||
| Preterm birth less than 37 weeks' gestation | Study population | RR 1.08 | 25 | ⊕⊝⊝⊝ | ||
| 77 per 1000 | 83 per 1000 | |||||
| Preterm birth less than 34 weeks' gestation | Study population | (0 studies) | The included study did not report this outcome. | |||
| *The risk in the intervention group (and its 95% confidence interval) is based on the assumed risk in the comparison group and the relative effect of the intervention (and its 95% CI). | ||||||
| GRADE Working Group grades of evidence | ||||||
| 1 One study with design limitations. 2 Wide CI crossing the line of no effect, few events and small sample size. 3 Wide CI crossing the line of no effect, and small sample size. | ||||||
| Outcome or subgroup title | No. of studies | No. of participants | Statistical method | Effect size |
| 1 Caesarean section Show forest plot | 1 | 28 | Risk Ratio (M‐H, Fixed, 95% CI) | 0.78 [0.40, 1.49] |
| 2 Perinatal mortality Show forest plot | 1 | 28 | Risk Ratio (M‐H, Fixed, 95% CI) | 3.0 [0.13, 67.91] |
| 3 Neonatal mortality and morbidity composite Show forest plot | 1 | 28 | Risk Ratio (M‐H, Fixed, 95% CI) | 3.0 [0.13, 67.91] |
| 4 Glycaemic control during/end of treatment (maternal post‐prandial blood glucose) Show forest plot | 1 | 13 | Mean Difference (IV, Fixed, 95% CI) | ‐0.70 [‐2.15, 0.75] |
| 5 Glycaemic control during/end of treatment (maternal HbA1c) Show forest plot | 1 | 28 | Mean Difference (IV, Fixed, 95% CI) | ‐0.10 [‐1.93, 1.73] |
| 6 Miscarriage Show forest plot | 1 | 30 | Risk Ratio (M‐H, Fixed, 95% CI) | 1.0 [0.07, 14.55] |
| 7 Neonatal mortality Show forest plot | 1 | 28 | Risk Ratio (M‐H, Fixed, 95% CI) | 3.0 [0.13, 67.91] |
| 8 Gestational age at birth Show forest plot | 1 | 28 | Mean Difference (IV, Fixed, 95% CI) | 0.40 [‐1.65, 2.45] |
| 9 Birthweight Show forest plot | 2 | 41 | Mean Difference (IV, Fixed, 95% CI) | ‐0.18 [‐0.49, 0.13] |
| 10 Respiratory distress syndrome Show forest plot | 1 | 28 | Risk Ratio (M‐H, Fixed, 95% CI) | 3.0 [0.13, 67.91] |
| 11 Neonatal hypoglycaemia Show forest plot | 1 | 28 | Risk Ratio (M‐H, Fixed, 95% CI) | 0.57 [0.21, 1.52] |
| 12 Neonatal jaundice (hyperbilirubinaemia) Show forest plot | 1 | 28 | Risk Ratio (M‐H, Fixed, 95% CI) | 0.56 [0.25, 1.24] |
| 13 Neonatal hypocalcaemia Show forest plot | 1 | 28 | Risk Ratio (M‐H, Fixed, 95% CI) | 1.0 [0.07, 14.45] |
| 14 Neonatal polycythaemia Show forest plot | 1 | 28 | Risk Ratio (M‐H, Fixed, 95% CI) | 0.33 [0.01, 7.55] |
| 15 Neonatal cord vein C‐peptide Show forest plot | 1 | 28 | Mean Difference (IV, Fixed, 95% CI) | 0.13 [‐0.50, 0.76] |
| Outcome or subgroup title | No. of studies | No. of participants | Statistical method | Effect size |
| 1 Pre‐eclampsia Show forest plot | 1 | 100 | Risk Ratio (M‐H, Fixed, 95% CI) | 4.26 [0.52, 35.16] |
| 2 Hypertension in pregnancy Show forest plot | 1 | 100 | Risk Ratio (M‐H, Fixed, 95% CI) | 0.43 [0.08, 2.22] |
| 3 Caesarean section Show forest plot | 1 | 100 | Risk Ratio (M‐H, Fixed, 95% CI) | 0.96 [0.65, 1.44] |
| 4 Perinatal mortality Show forest plot | 1 | 100 | Risk Ratio (M‐H, Fixed, 95% CI) | 0.85 [0.05, 13.24] |
| 5 Placental abruption Show forest plot | 1 | 100 | Risk Ratio (M‐H, Fixed, 95% CI) | 1.70 [0.16, 18.19] |
| 6 Preterm birth < 37 weeks Show forest plot | 1 | 100 | Risk Ratio (M‐H, Fixed, 95% CI) | 0.85 [0.45, 1.60] |
| 7 Respiratory distress syndrome Show forest plot | 1 | 100 | Risk Ratio (M‐H, Fixed, 95% CI) | 2.56 [0.28, 23.74] |
| 8 Neonatal hypoglycaemia Show forest plot | 1 | 100 | Risk Ratio (M‐H, Fixed, 95% CI) | 1.01 [0.50, 2.03] |
| 9 Neonatal jaundice (hyperbilirubinaemia) Show forest plot | 1 | 100 | Risk Ratio (M‐H, Fixed, 95% CI) | 2.27 [0.64, 8.07] |
| 10 Major anomalies Show forest plot | 1 | 102 | Risk Ratio (M‐H, Fixed, 95% CI) | 0.27 [0.03, 2.54] |
| 11 Antenatal hospital admission Show forest plot | 1 | 100 | Risk Ratio (M‐H, Fixed, 95% CI) | 0.19 [0.11, 0.33] |
| 12 Feeding difficulties (not pre‐specified) Show forest plot | 1 | 100 | Risk Ratio (M‐H, Fixed, 95% CI) | 0.85 [0.41, 1.78] |
| Outcome or subgroup title | No. of studies | No. of participants | Statistical method | Effect size |
| 1 Pre‐eclampsia Show forest plot | 1 | 58 | Risk Ratio (M‐H, Fixed, 95% CI) | 6.43 [0.82, 50.11] |
| 2 Caesarean section Show forest plot | 1 | 61 | Risk Ratio (M‐H, Fixed, 95% CI) | 1.45 [0.92, 2.28] |
| 3 Large‐for‐gestational age Show forest plot | 1 | 61 | Risk Ratio (M‐H, Fixed, 95% CI) | 1.16 [0.73, 1.85] |
| 4 Perinatal mortality Show forest plot | 1 | 61 | Risk Ratio (M‐H, Fixed, 95% CI) | 2.91 [0.12, 68.66] |
| 5 Weight gain during pregnancy Show forest plot | 1 | 61 | Mean Difference (IV, Fixed, 95% CI) | ‐0.90 [‐3.86, 2.06] |
| 6 Insulin dose Show forest plot | 1 | 61 | Mean Difference (IV, Fixed, 95% CI) | ‐17.40 [‐43.41, 8.61] |
| 7 Glycaemic control ‐ Insulin dose Show forest plot | 1 | 61 | Mean Difference (IV, Fixed, 95% CI) | ‐0.20 [‐0.45, 0.05] |
| 8 Glycaemic control ‐ HbA1c Show forest plot | 1 | 61 | Mean Difference (IV, Fixed, 95% CI) | 0.30 [‐0.08, 0.68] |
| 9 Stillbirth Show forest plot | 1 | 61 | Risk Ratio (M‐H, Fixed, 95% CI) | 2.91 [0.12, 68.66] |
| 10 Gestational age at birth Show forest plot | 1 | 61 | Mean Difference (IV, Fixed, 95% CI) | 0.20 [‐0.84, 1.24] |
| 11 Preterm birth < 37 weeks Show forest plot | 1 | 61 | Risk Ratio (M‐H, Fixed, 95% CI) | 1.33 [0.62, 2.84] |
| 12 Macrosomia Show forest plot | 1 | 61 | Risk Ratio (M‐H, Fixed, 95% CI) | 2.18 [0.75, 6.32] |
| 13 Birthweight Show forest plot | 1 | 61 | Mean Difference (IV, Fixed, 95% CI) | 0.24 [‐0.10, 0.58] |
| 14 Adiposity ‐ Subscapula skinfold thickness Show forest plot | 1 | 61 | Mean Difference (IV, Fixed, 95% CI) | 0.60 [‐0.18, 1.38] |
| 15 Adiposity ‐ Triceps skinfold thickness Show forest plot | 1 | 61 | Mean Difference (IV, Fixed, 95% CI) | 0.60 [0.04, 1.16] |
| 16 Birth trauma (shoulder dystocia, bone fracture, nerve palsy) (not pre‐specified as a composite) Show forest plot | 1 | 61 | Risk Ratio (M‐H, Fixed, 95% CI) | 0.48 [0.05, 5.06] |
| 17 Respiratory distress syndrome Show forest plot | 1 | 61 | Risk Ratio (M‐H, Fixed, 95% CI) | 0.97 [0.06, 14.78] |
| 18 Neonatal hypoglycaemia Show forest plot | 1 | 61 | Risk Ratio (M‐H, Fixed, 95% CI) | 1.09 [0.48, 2.45] |
| 19 Neonatal jaundice (hyperbilirubinaemia) Show forest plot | 1 | 61 | Risk Ratio (M‐H, Fixed, 95% CI) | 1.16 [0.40, 3.40] |
| 20 Cord IGF‐1 Show forest plot | 1 | 61 | Mean Difference (IV, Fixed, 95% CI) | 1.30 [‐0.70, 3.30] |
| 21 Neonatal glucose at age 1 hour (not pre‐specified) Show forest plot | 1 | 61 | Mean Difference (IV, Fixed, 95% CI) | ‐0.20 [‐0.88, 0.48] |
| 22 Transient tachypnea (not pre‐specified) Show forest plot | 1 | 61 | Risk Ratio (M‐H, Fixed, 95% CI) | 2.58 [0.76, 8.81] |
| 23 Neonatal intensive care admissions Show forest plot | 1 | 59 | Risk Ratio (M‐H, Fixed, 95% CI) | 1.04 [0.62, 1.74] |
| Outcome or subgroup title | No. of studies | No. of participants | Statistical method | Effect size |
| 1 Caesarean section Show forest plot | 1 | 32 | Risk Ratio (M‐H, Fixed, 95% CI) | 0.96 [0.62, 1.48] |
| 2 Neonatal morbidity composite Show forest plot | 1 | 32 | Risk Ratio (M‐H, Fixed, 95% CI) | 1.18 [0.53, 2.62] |
| 3 Weight gain during pregnancy [kg] Show forest plot | 1 | 32 | Mean Difference (IV, Fixed, 95% CI) | ‐0.70 [‐4.95, 3.55] |
| 4 Use of additional insulin therapy Show forest plot | 1 | 32 | Risk Ratio (M‐H, Fixed, 95% CI) | 1.0 [0.89, 1.12] |
| 5 Insulin requirement at end of study Show forest plot | 1 | 20 | Mean Difference (IV, Fixed, 95% CI) | 18.4 [12.88, 23.92] |
| 6 Glycaemic control ‐ Maternal fasting blood glucose: before breakfast Show forest plot | 1 | 20 | Mean Difference (IV, Fixed, 95% CI) | ‐1.0 [‐1.22, ‐0.78] |
| 7 Glycaemic control ‐ Maternal fasting blood glucose: before lunch Show forest plot | 1 | 20 | Mean Difference (IV, Fixed, 95% CI) | ‐1.10 [‐1.32, ‐0.88] |
| 8 Glycaemic control ‐ Maternal HbA1c Show forest plot | 3 | 82 | Mean Difference (IV, Random, 95% CI) | ‐0.17 [‐0.82, 0.48] |
| 9 Glycaemic control ‐ Maternal post‐prandial blood glucose Show forest plot | 2 | 50 | Mean Difference (IV, Random, 95% CI) | ‐0.80 [‐1.67, 0.08] |
| 10 Gestational age at birth Show forest plot | 3 | 84 | Mean Difference (IV, Fixed, 95% CI) | 0.13 [‐0.14, 0.39] |
| 11 Macrosomia Show forest plot | 1 | 32 | Risk Ratio (M‐H, Fixed, 95% CI) | 1.18 [0.31, 4.43] |
| 12 Birthweight Show forest plot | 1 | 32 | Mean Difference (IV, Fixed, 95% CI) | ‐0.16 [‐0.64, 0.32] |
| Outcome or subgroup title | No. of studies | No. of participants | Statistical method | Effect size |
| 1 Pre‐eclampsia Show forest plot | 2 | 225 | Risk Ratio (M‐H, Fixed, 95% CI) | 1.37 [0.52, 3.59] |
| 2 Caesarean section Show forest plot | 2 | 225 | Risk Ratio (M‐H, Random, 95% CI) | 1.00 [0.65, 1.54] |
| 3 Large‐for‐gestational age Show forest plot | 2 | 221 | Risk Ratio (M‐H, Random, 95% CI) | 0.89 [0.41, 1.92] |
| 4 Perinatal mortality Show forest plot | 1 | 71 | Risk Ratio (M‐H, Fixed, 95% CI) | 0.82 [0.05, 12.61] |
| 5 Glycaemic control ‐ Maternal HbA1c Show forest plot | 1 | 71 | Mean Difference (IV, Fixed, 95% CI) | ‐0.60 [‐0.91, ‐0.29] |
| 6 Miscarriage Show forest plot | 2 | 228 | Risk Ratio (M‐H, Fixed, 95% CI) | 1.21 [0.28, 5.24] |
| 7 Neonatal mortality Show forest plot | 1 | 74 | Risk Ratio (M‐H, Fixed, 95% CI) | 0.80 [0.05, 12.39] |
| 8 Gestational age at birth Show forest plot | 1 | 68 | Mean Difference (IV, Fixed, 95% CI) | 0.10 [‐0.57, 0.77] |
| 9 Preterm birth < 37 weeks Show forest plot | 2 | 228 | Risk Ratio (M‐H, Fixed, 95% CI) | 1.10 [0.63, 1.94] |
| 10 Small‐for‐gestational age Show forest plot | 1 | 67 | Risk Ratio (M‐H, Fixed, 95% CI) | 7.34 [0.41, 131.18] |
| 11 Birthweight Show forest plot | 1 | 67 | Mean Difference (IV, Fixed, 95% CI) | ‐0.29 [‐0.59, 0.01] |
| 12 Neonatal hypoglycaemia Show forest plot | 2 | 228 | Risk Ratio (M‐H, Fixed, 95% CI) | 0.77 [0.51, 1.16] |
| 13 Major anomalies Show forest plot | 1 | 74 | Risk Ratio (M‐H, Fixed, 95% CI) | 0.80 [0.05, 12.39] |
| 14 Neonatal intensive care unit admissions Show forest plot | 1 | 74 | Risk Ratio (M‐H, Fixed, 95% CI) | 1.21 [0.48, 3.05] |
| Outcome or subgroup title | No. of studies | No. of participants | Statistical method | Effect size |
| 1 Caesarean section Show forest plot | 1 | 25 | Risk Ratio (M‐H, Fixed, 95% CI) | 0.77 [0.33, 1.79] |
| 2 Weight gain during pregnancy Show forest plot | 1 | 25 | Mean Difference (IV, Fixed, 95% CI) | 0.5 [‐1.82, 2.82] |
| 3 Insulin dosage, 3rd trimester (IU/kg/day) Show forest plot | 1 | 25 | Mean Difference (IV, Fixed, 95% CI) | ‐0.03 [‐1.30, 1.24] |
| 4 Glycaemic control ‐ Maternal blood glucose (1st trimester) Show forest plot | 1 | 25 | Mean Difference (IV, Fixed, 95% CI) | ‐0.5 [‐2.70, 1.70] |
| 5 Glycaemic control ‐ Maternal blood glucose (3rd trimester) Show forest plot | 1 | 25 | Mean Difference (IV, Fixed, 95% CI) | ‐0.14 [‐2.00, 1.72] |
| 6 Glycaemic control ‐ Maternal HbA1c (1st trimester) Show forest plot | 1 | 25 | Mean Difference (IV, Fixed, 95% CI) | ‐0.30 [‐1.13, 0.53] |
| 7 Glycaemic control ‐ Maternal HbA1c (3rd trimester) Show forest plot | 1 | 25 | Mean Difference (IV, Fixed, 95% CI) | ‐0.09 [‐0.69, 0.51] |
| 8 Maternal hypoglycemia Show forest plot | 1 | 25 | Risk Ratio (M‐H, Fixed, 95% CI) | 0.54 [0.06, 5.24] |
| 9 Diabetic ketoacidosis (not pre‐specified) Show forest plot | 1 | 25 | Risk Ratio (M‐H, Fixed, 95% CI) | 0.36 [0.02, 8.05] |
| 10 Preterm birth < 37 weeks Show forest plot | 1 | 25 | Risk Ratio (M‐H, Fixed, 95% CI) | 1.08 [0.08, 15.46] |
| 11 Macrosomia Show forest plot | 1 | 25 | Risk Ratio (M‐H, Fixed, 95% CI) | 1.08 [0.08, 15.46] |
| 12 Neonatal hypoglycaemia Show forest plot | 1 | 25 | Risk Ratio (M‐H, Fixed, 95% CI) | 0.0 [0.0, 0.0] |