Gases para el establecimiento del neumoperitoneo durante la cirugía abdominal laparoscópica
Appendices
Appendix 1. Cochrane Central Register of Controlled Trials (CENTRAL) search strategy
#1 MeSH descriptor: [Surgical Procedures, Minimally Invasive] explode all trees
#2 MeSH descriptor: [Laparoscopy] explode all trees
#3 MeSH descriptor: [Video‐Assisted Surgery] explode all trees
#4 (laparoscop* or coelioscop* or celioscop* or peritoneoscop* or minimally invasive or video assisted surgery)
#5 (#1 or #2 or #3 or #4)
#6 MeSH descriptor: [Carbon Dioxide] explode all trees
#7 MeSH descriptor: [Nitrogen Oxides] explode all trees
#8 MeSH descriptor: [Nitrogen] explode all trees
#9 MeSH descriptor: [Argon] explode all trees
#10 MeSH descriptor: [Helium] explode all trees
#11 (gas* or carbon dioxide or CO2 or nitrous oxide or laughing gas or N2O or nitrogen or N2 or helium or argon)
#12 (#6 or #7 or #8 or #9 or #10 or #11)
#13 MeSH descriptor: [Pneumoperitoneum] explode all trees
#14 (pneumoperitoneum*)
#15 (#13 or #14)
#16 (#5 and #12 and #15)
Appendix 2. MEDLINE (Ovid) search strategy
1. exp Surgical Procedures, Minimally Invasive/
2. exp Laparoscopy/
3. exp Video‐Assisted Surgery/
4. (laparoscop* or coelioscop* or celioscop* or peritoneoscop* or minimally invasive or video assisted surgery).mp.
5. 1 or 2 or 3 or 4
6. exp Carbon Dioxide/
7. exp Nitrogen Oxides/
8. exp Nitrogen/
9. exp Argon/
10. exp Helium/
11. (gas* or carbon dioxide or CO2 or nitrous oxide or laughing gas or N2O or nitrogen or N2 or helium or argon).mp.
12. 6 or 7 or 8 or 9 or 10 or 11
13. exp Pneumoperitoneum/
14. pneumoperitoneum*.mp.
15. 13 or 14
16. 5 and 12 and 15
17. randomized controlled trial.pt.
18. controlled clinical trial.pt.
19. randomized.ab.
20. placebo.ab.
21. clinical trial as topic.sh.
22. randomly.ab.
23. trial.ti.
24. 17 or 18 or 19 or 20 or 21 or 22 or 23
25. exp animals/ not humans.sh.
26. 24 not 25
27. 16 and 26
Appendix 3. Embase (Ovid) search strategy
1. exp minimally invasive surgery/
2. exp laparoscopy/
3. (laparoscop* or coelioscop* or celioscop* or peritoneoscop* or minimally invasive or video assisted surgery).mp.
4. 1 or 2 or 3
5. exp carbon dioxide/
6. exp nitrous oxide/
7. exp nitrogen/
8. exp argon/
9. exp helium/
10. exp gas/
11. (gas* or carbon dioxide or CO2 or nitrous oxide or laughing gas or N2O or nitrogen or N2 or helium or argon).mp.
12. 5 or 6 or 7 or 8 or 9 or 10 or 11
13. exp pneumoperitoneum/
14. pneumoperitoneum*.mp.
15. 13 or 14
16. 4 and 12 and 15
17. CROSSOVER PROCEDURE.sh
18. DOUBLE‐BLIND PROCEDURE.sh
19. SINGLE‐BLIND PROCEDURE.sh
20. (crossover* or cross over*).ti,ab.
21. placebo*.ti,ab.
22. (doubl* adj blind*).ti,ab.
23. allocate*.ti,ab.
24. trial.ti.
25. RANDOMIZED CONTROLLED TRIAL.sh.
26. random*.ti,ab.
27. 17 or 18 or 19 or 20 or 21 or 22 or 23 or 24 or 25 or 26
28. (exp animal/ or exp invertebrate/ or animal.hw or nonhuman/) not (exp human/ or human cell/ or (human or humans or man or men or wom?n).ti.)
29. 27 not 28
30. 16 and 29
Appendix 4. Science Citation Index Expanded search strategy
#1 Topic=(laparoscop* or coelioscop* or celioscop* or peritoneoscop* or minimally invasive or video assisted surgery)
#2 Topic=(gas* or carbon dioxide or CO2 or nitrous oxide or laughing gas or N2O or nitrogen or N2 or helium or argon)
#3 Topic=(pneumoperitoneum*)
#4 Topic=(randomized or randomised or controlled or trial or clinical or placebo or clinical or randomly or trial)
#5 (#4 AND #3 AND #2 AND #1)
Appendix 5. Criteria for judging risk of bias in the 'Risk of bias' assessment tool
| Random sequence generation Selection bias (biased allocation to interventions) due to inadequate generation of a randomised sequence. | |
| Criteria for a judgement of 'Low risk' of bias. | The investigators described a random component in the sequence generation process such as:
*Minimisation may be implemented without a random element, and this is considered to be equivalent to being random. |
| Criteria for the judgement of 'High risk' of bias. | The investigators described a non‐random component in the sequence generation process. Usually, the description would involve some systematic, non‐random approach, e.g.:
Other non‐random approaches happen much less frequently than the systematic approaches mentioned above and tend to be obvious. They usually involve judgement or some method of non‐random categorisation of participants, e.g.:
|
| Criteria for the judgement of 'Unclear risk' of bias. | Insufficient information about the sequence generation process to permit judgement of 'Low risk' or 'High risk.' |
| Allocation concealment Selection bias (biased allocation to interventions) due to inadequate concealment of allocations prior to assignment. | |
| Criteria for a judgement of 'Low risk' of bias. | Participants and investigators enrolling participants could not have foreseen assignment because 1 of the following, or an equivalent method, was used to conceal allocation:
|
| Criteria for the judgement of 'High risk' of bias. | Participants or investigators enrolling participants could possibly have foreseen assignments and thus introduced selection bias, such as allocation based on:
|
| Criteria for the judgement of 'Unclear risk' of bias. | Insufficient information to permit judgement of 'Low risk' or 'High risk.' This is usually the case if the method of concealment was not described or not described in sufficient detail to allow a definite judgement; e.g. if the use of assignment envelopes was described, but it remained unclear whether envelopes were sequentially numbered, opaque and sealed. |
| Blinding of participants and personnel Performance bias due to knowledge of the allocated interventions by participants and personnel during the study. | |
| Criteria for a judgement of 'Low risk' of bias. | Any 1 of the following:
|
| Criteria for the judgement of 'High risk' of bias. | Any 1 of the following:
|
| Criteria for the judgement of 'Unclear risk' of bias. | Any 1 of the following:
|
| Blinding of outcome assessment Detection bias due to knowledge of the allocated interventions by outcome assessors. | |
| Criteria for a judgement of 'Low risk' of bias. | Any 1 of the following:
|
| Criteria for the judgement of 'High risk' of bias. | Any 1 of the following:
|
| Criteria for the judgement of 'Unclear risk' of bias. | Any 1 of the following:
|
| Incomplete outcome data Attrition bias due to amount, nature, or handling of incomplete outcome data. | |
| Criteria for a judgement of 'Low risk' of bias. | Any 1 of the following:
|
| Criteria for the judgement of 'High risk' of bias. | Any 1 of the following:
|
| Criteria for the judgement of 'Unclear risk' of bias. | Any 1 of the following:
|
| Selective reporting Reporting bias due to selective outcome reporting. | |
| Criteria for a judgement of 'Low risk' of bias. | Any of the following:
|
| Criteria for the judgement of 'High risk' of bias. | Any 1 of the following:
|
| Criteria for the judgement of 'Unclear risk' of bias. | Insufficient information to permit judgement of 'Low risk' or 'High risk.' It is likely that the majority of studies will fall into this category. |
| Other bias Bias due to problems not covered elsewhere in the table. | |
| Criteria for a judgement of 'Low risk' of bias. | Study appeared to be free of other sources of bias. |
| Criteria for the judgement of 'High risk' of bias. | There was ≥ 1 important risk of bias; e.g. the study:
|
| Criteria for the judgement of 'Unclear risk' of bias. | There may be a risk of bias, but there was either:
|


Risk of bias graph: review authors' judgements about each risk of bias item presented as percentages across all included studies.

Risk of bias summary: review authors' judgements about each risk of bias item for each included study.
Trial sequential analysis of nitrous oxide pneumoperitoneum versus carbon dioxide pneumoperitoneum for cardiopulmonary complications. Analysis was performed with an event rate of 2.9% (Pc) in the control group, a risk ratio reduction of 20%, alpha 5%, beta 20%, and observed diversity 0%. The accrued sample size was so small that the trial sequential boundaries could not be drawn. The cumulative Z‐curve did not cross the naive 5% statistical boundaries (red horizontal lines). The results showed that the observed diversity‐adjusted required information size was 3781 participants, corresponding to 3.7% of the total sample size in the included trials. Accordingly, the meta‐analysis did not support or refute an intervention effect as data were too few.

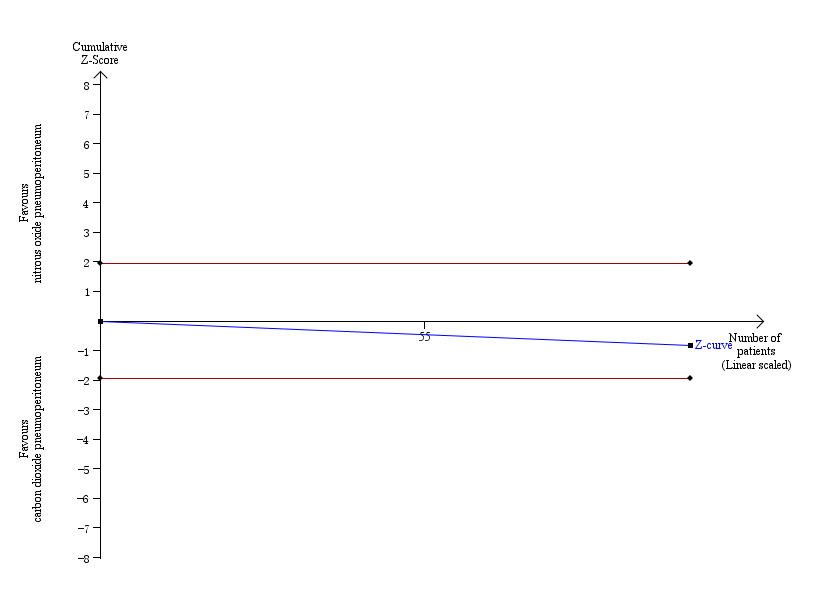
Trial sequential analysis of nitrous oxide pneumoperitoneum versus carbon dioxide pneumoperitoneum for surgical morbidity. Analysis was performed with an event rate of 2.8% (Pc) in the control group, a risk ratio reduction of 20%, alpha 5%, beta 20%, and observed diversity 0%. The cumulative Z‐curve did not cross the naive 5% statistical boundaries (red horizontal lines). The results showed that the observed diversity adjusted required information size was 3919 participants, corresponding to 3.6% of the total sample size in the included trials. Accordingly, the meta‐analysis did not support or refute an intervention effect as data were too few.
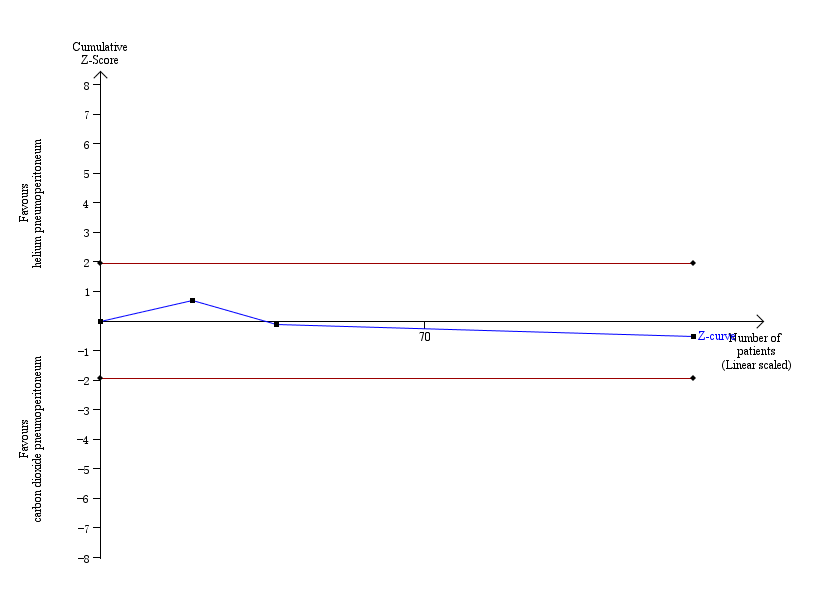
Trial sequential analysis of helium pneumoperitoneum versus carbon dioxide pneumoperitoneum for cardiopulmonary complications. Analysis was performed with an event rate of 3.0% (Pc) in the control group, a risk ratio reduction of 20%, alpha 5%, beta 20%, and observed diversity 0%. The cumulative Z‐curve did not cross the naive 5% statistical boundaries (red horizontal lines). The results showed that the observed diversity adjusted required information size was 3651 participants, corresponding to 3.5% of the total sample size in the included trials. Accordingly, the meta‐analysis did not support or refute an intervention effect as data were too few.
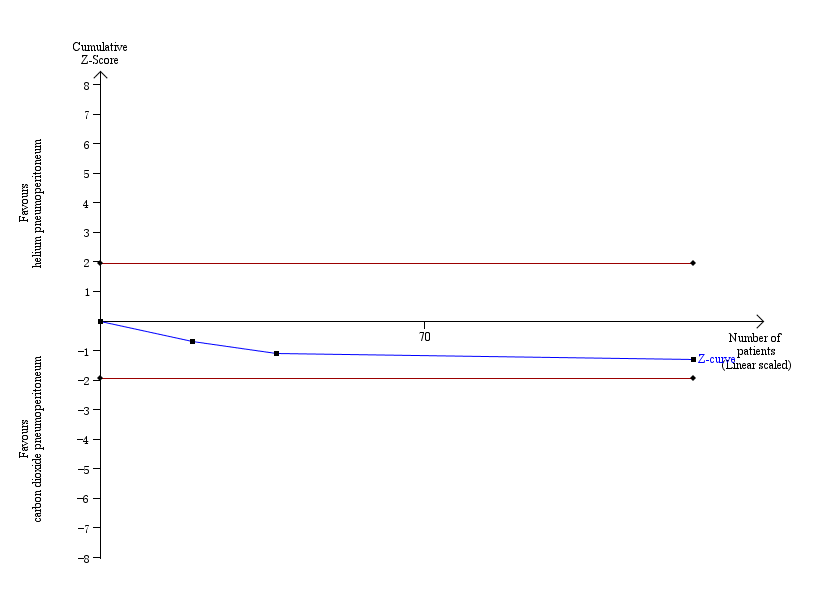
Trial sequential analysis of helium pneumoperitoneum versus carbon dioxide pneumoperitoneum for serious adverse events. Analysis was performed with an event rate of 2.3% (Pc) in the control group, a risk ratio reduction of 20%, alpha 5%, beta 20%, and observed diversity 0%. The cumulative Z‐curve did not cross the naive 5% statistical boundaries (red horizontal lines). The results showed that the observed diversity adjusted required information size was 4793 participants, corresponding to 2.7% of the total sample size in the included trials. Accordingly, the meta‐analysis did not support or refute an intervention effect as data were too few.

Comparison 1 Nitrous oxide pneumoperitoneum versus carbon dioxide pneumoperitoneum, Outcome 1 Cardiopulmonary complications.
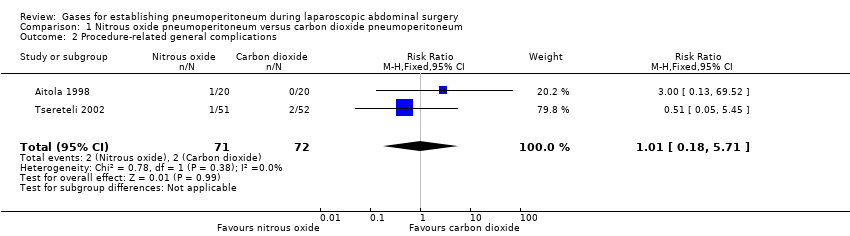
Comparison 1 Nitrous oxide pneumoperitoneum versus carbon dioxide pneumoperitoneum, Outcome 2 Procedure‐related general complications.
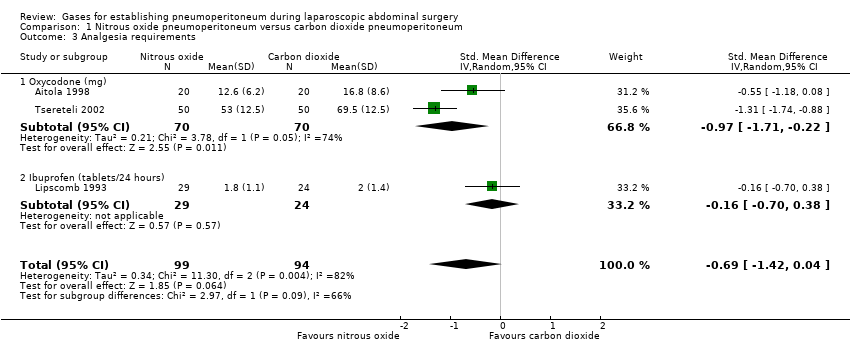
Comparison 1 Nitrous oxide pneumoperitoneum versus carbon dioxide pneumoperitoneum, Outcome 3 Analgesia requirements.

Comparison 1 Nitrous oxide pneumoperitoneum versus carbon dioxide pneumoperitoneum, Outcome 4 Cardiopulmonary changes.

Comparison 2 Helium pneumoperitoneum versus carbon dioxide pneumoperitoneum, Outcome 1 Cardiopulmonary complications.
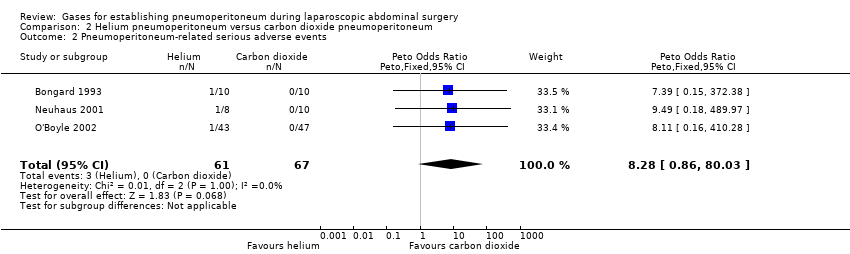
Comparison 2 Helium pneumoperitoneum versus carbon dioxide pneumoperitoneum, Outcome 2 Pneumoperitoneum‐related serious adverse events.
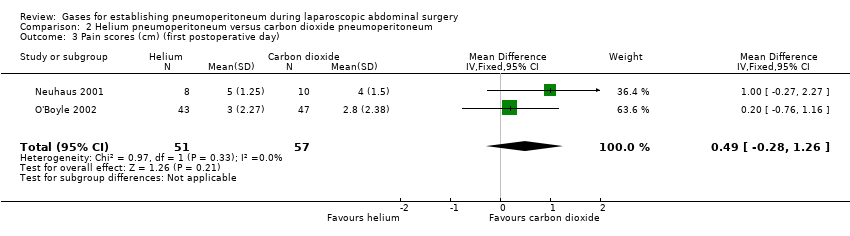
Comparison 2 Helium pneumoperitoneum versus carbon dioxide pneumoperitoneum, Outcome 3 Pain scores (cm) (first postoperative day).

Comparison 2 Helium pneumoperitoneum versus carbon dioxide pneumoperitoneum, Outcome 4 Analgesia requirements (morphine mg).

Comparison 2 Helium pneumoperitoneum versus carbon dioxide pneumoperitoneum, Outcome 5 Number of participants requiring analgesia.

Comparison 2 Helium pneumoperitoneum versus carbon dioxide pneumoperitoneum, Outcome 6 Cardiopulmonary parameters.

Comparison 3 Room air pneumoperitoneum versus carbon dioxide pneumoperitoneum, Outcome 1 Cardiopulmonary complications.
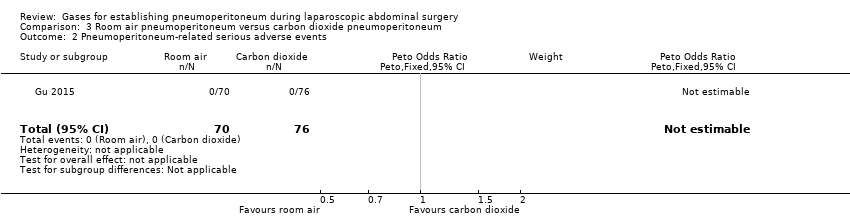
Comparison 3 Room air pneumoperitoneum versus carbon dioxide pneumoperitoneum, Outcome 2 Pneumoperitoneum‐related serious adverse events.
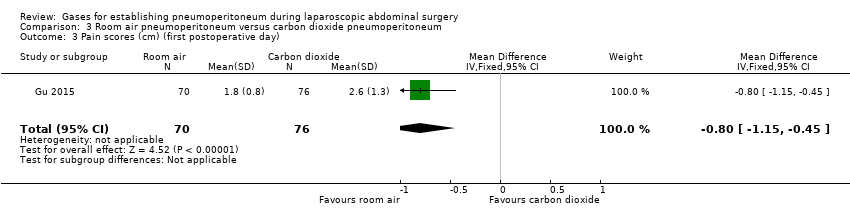
Comparison 3 Room air pneumoperitoneum versus carbon dioxide pneumoperitoneum, Outcome 3 Pain scores (cm) (first postoperative day).

Comparison 3 Room air pneumoperitoneum versus carbon dioxide pneumoperitoneum, Outcome 4 Hospital costs (CNY).

Comparison 3 Room air pneumoperitoneum versus carbon dioxide pneumoperitoneum, Outcome 5 Cardiopulmonary parameters.
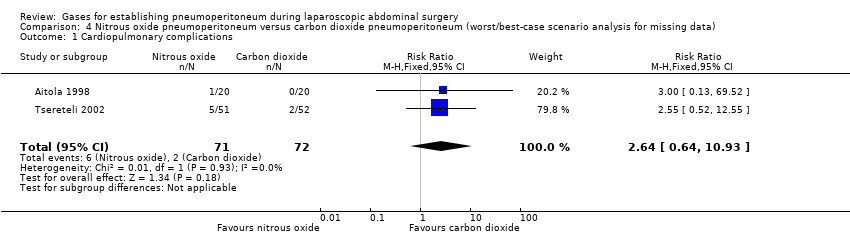
Comparison 4 Nitrous oxide pneumoperitoneum versus carbon dioxide pneumoperitoneum (worst/best‐case scenario analysis for missing data), Outcome 1 Cardiopulmonary complications.
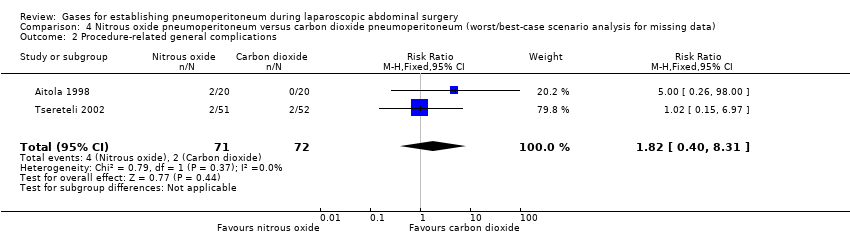
Comparison 4 Nitrous oxide pneumoperitoneum versus carbon dioxide pneumoperitoneum (worst/best‐case scenario analysis for missing data), Outcome 2 Procedure‐related general complications.

Comparison 4 Nitrous oxide pneumoperitoneum versus carbon dioxide pneumoperitoneum (worst/best‐case scenario analysis for missing data), Outcome 3 Pneumoperitoneum‐related serious adverse events.
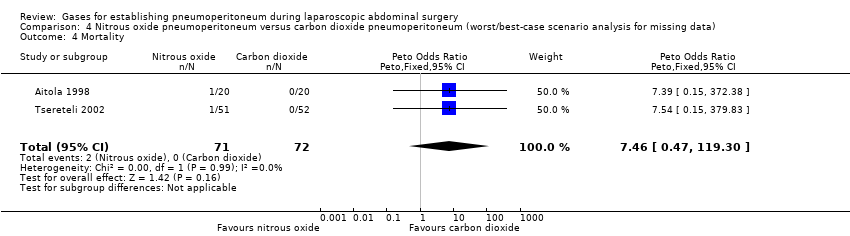
Comparison 4 Nitrous oxide pneumoperitoneum versus carbon dioxide pneumoperitoneum (worst/best‐case scenario analysis for missing data), Outcome 4 Mortality.

Comparison 5 Nitrous oxide pneumoperitoneum versus carbon dioxide pneumoperitoneum (best/worst‐case scenario analysis for missing data, Outcome 1 Cardiopulmonary complications.

Comparison 5 Nitrous oxide pneumoperitoneum versus carbon dioxide pneumoperitoneum (best/worst‐case scenario analysis for missing data, Outcome 2 Procedure‐related general complications.

Comparison 5 Nitrous oxide pneumoperitoneum versus carbon dioxide pneumoperitoneum (best/worst‐case scenario analysis for missing data, Outcome 3 Pneumoperitoneum‐related serious adverse events.

Comparison 5 Nitrous oxide pneumoperitoneum versus carbon dioxide pneumoperitoneum (best/worst‐case scenario analysis for missing data, Outcome 4 Mortality.

Comparison 6 Helium pneumoperitoneum versus carbon dioxide pneumoperitoneum (worst/best‐case scenario analysis for missing data), Outcome 1 Cardiopulmonary complications.
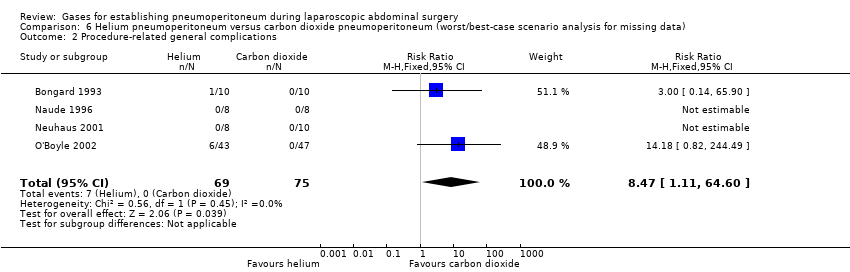
Comparison 6 Helium pneumoperitoneum versus carbon dioxide pneumoperitoneum (worst/best‐case scenario analysis for missing data), Outcome 2 Procedure‐related general complications.

Comparison 6 Helium pneumoperitoneum versus carbon dioxide pneumoperitoneum (worst/best‐case scenario analysis for missing data), Outcome 3 Pneumoperitoneum‐related serious adverse events.

Comparison 6 Helium pneumoperitoneum versus carbon dioxide pneumoperitoneum (worst/best‐case scenario analysis for missing data), Outcome 4 Mortality.
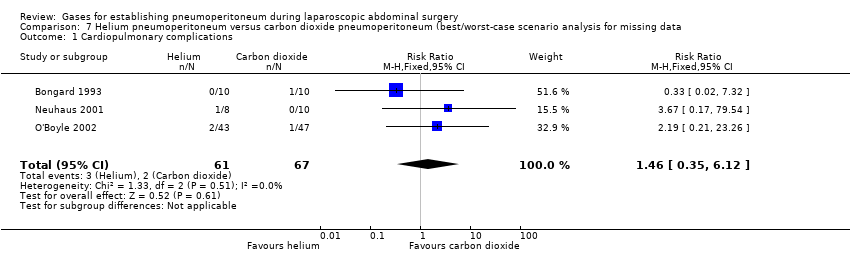
Comparison 7 Helium pneumoperitoneum versus carbon dioxide pneumoperitoneum (best/worst‐case scenario analysis for missing data, Outcome 1 Cardiopulmonary complications.
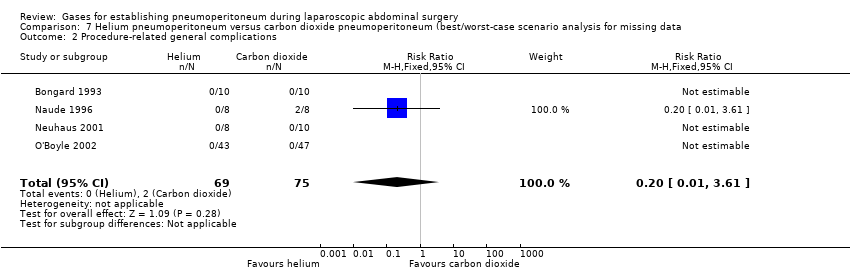
Comparison 7 Helium pneumoperitoneum versus carbon dioxide pneumoperitoneum (best/worst‐case scenario analysis for missing data, Outcome 2 Procedure‐related general complications.

Comparison 7 Helium pneumoperitoneum versus carbon dioxide pneumoperitoneum (best/worst‐case scenario analysis for missing data, Outcome 3 Pneumoperitoneum‐related serious adverse events.

Comparison 7 Helium pneumoperitoneum versus carbon dioxide pneumoperitoneum (best/worst‐case scenario analysis for missing data, Outcome 4 Mortality.
| Nitrous oxide versus carbon dioxide for establishing pneumoperitoneum during laparoscopic abdominal surgery | ||||||
| Patient or population: people undergoing laparoscopic general abdominal or gynaecological pelvic surgery under general anaesthesia Setting: secondary and tertiary care Intervention: nitrous oxide pneumoperitoneum Comparison: carbon dioxide pneumoperitoneum | ||||||
| Outcomes | Anticipated absolute effects* (95% CI) | Relative effect | No of participants | Quality of the evidence | Comments | |
| Risk with carbon dioxide pneumoperitoneum | Risk with nitrous oxide pneumoperitoneum | |||||
| Cardiopulmonary complications Follow‐up: 0 to 1 month | 29 per 1000 | 57 per 1000 | RR 2.00 | 140 | ⊕⊝⊝⊝ | Trial sequential analysis showed a diversity‐adjusted required information size of 3781 participants to support or refute nitrous oxide pneumoperitoneum. |
| Procedure‐related general complications Follow‐up: 0 to 1 month | 28 per 1000 | 28 per 1000 | RR 1.01 | 143 | ⊕⊝⊝⊝ | Trial sequential analysis showed a diversity‐adjusted required information size of 3919 participants to support or refute nitrous oxide pneumoperitoneum. |
| Pneumoperitoneum‐related serious adverse events Follow‐up: 0 to 1 month | See comment | See comment | Not estimable | 196 | ⊕⊕⊝⊝ | None of the studies reported any pneumoperitoneum‐related serious adverse events. |
| Mortality Follow‐up: 0 to 1 month | See comment | See comment | Not estimable | 196 | ⊕⊕⊝⊝ | None of the studies reported any deaths. |
| Quality of life | None of the studies reported quality of life. | |||||
| Pain scores (first postoperative day) VAS, lower score indicates less pain. Follow‐up: 1 day | See comment | See comment | Not estimable | 140 | ⊕⊝⊝⊝ | Neither trials reported the standard deviation for pain scores on the VAS scale. Substantial clinical heterogeneity in between the 2 studies. |
| Analgesia requirements Follow‐up: 1 week | The mean analgesia requirement in the carbon dioxide pneumoperitoneum was 54.4 mg of oxycodone and 2.0 tablets/24 hours of ibuprofen | The mean analgesia requirement in the nitrous oxide pneumoperitoneum was 0.69 standard deviations lower | SMD ‐0.69 | 193 | ⊕⊝⊝⊝ | ‐ |
| Hospital costs | None of the studies reported costs. | |||||
| *The basis for the assumed risk is the mean comparison group proportion in the studies. The risk in the intervention group (and its 95% confidence interval) is based on the assumed risk in the comparison group and the relative effect of the intervention (and its 95% CI). CI: confidence interval; RR: risk ratio; SMD: standardised mean difference; VAS: visual analogue scale. | ||||||
| GRADE Working Group grades of evidence | ||||||
| 1 Downgraded two levels for very serious risk of bias. 2 Downgraded one level for serious imprecision (the confidence interval of risk ratio overlapped 0.75 and 1.25, and small sample size). 3 Downgraded one level for serious imprecision (small sample size). 4 Downgraded one level for serious risk of bias. 5 Downgraded one level for indirectness. 6 Downgraded one level for severe inconsistency (substantial heterogeneity as indicated by the I2 statistic). | ||||||
| Helium versus carbon dioxide for establishing pneumoperitoneum during laparoscopic abdominal surgery | ||||||
| Patient or population: people undergoing laparoscopic general abdominal or gynaecological pelvic surgery under general anaesthesia Setting: secondary and tertiary care Intervention: helium pneumoperitoneum Comparison: carbon dioxide pneumoperitoneum | ||||||
| Outcomes | Anticipated absolute effects* (95% CI) | Relative effect | No of participants | Quality of the evidence | Comments | |
| Risk with carbon dioxide pneumoperitoneum | Risk with helium pneumoperitoneum | |||||
| Cardiopulmonary complications Follow‐up: 0 to 1 month | 30 per 1000 | 44 per 1000 | RR 1.46 | 128 | ⊕⊝⊝⊝ | Trial sequential analysis showed a diversity‐adjusted required information size of 3651 participants to support or refute helium pneumoperitoneum. |
| Procedure‐related general complications Follow‐up: 0 to 1 month | See comment | See comment | Not estimable | 144 | ⊕⊝⊝⊝ Very low3,4 | None of the studies reported any significant procedure‐related general complications in either group. |
| Pneumoperitoneum‐related serious adverse events Follow‐up: 0 to 1 month | 0 per 1000 | 44 per 1000 | Peto OR 8.28 | 128 | ⊕⊝⊝⊝ | Trial sequential analysis showed a diversity‐adjusted required information size of 4793 participants to support or refute helium pneumoperitoneum. |
| Mortality Follow‐up: 0 to 1 month | See comment | See comment | Not estimable | 144 | ⊕⊕⊝⊝ | None of the studies reported any deaths. |
| Quality of life | None of the studies reported quality of life. | |||||
| Pain scores (first postoperative day) Visual analogue scale, lower score indicates less pain. Follow‐up: 1 day | The mean pain scores (first postoperative day) in the carbon dioxide pneumoperitoneum was 3.01 cm | The mean pain scores (first postoperative day) in the helium pneumoperitoneum was | MD 0.49 (‐0.28 to 1.26) | 108 | ⊕⊝⊝⊝ | ‐ |
| Analgesia requirements (morphine mg) Follow‐up: 2 days | The mean analgesia requirements (morphine) in the carbon dioxide pneumoperitoneum was 36.6 mg | The mean analgesia requirements (morphine) in the helium pneumoperitoneum was 12 mg higher | MD 12.00 (4.44 to 19.56) | 90 | ⊕⊝⊝⊝ | ‐ |
| Hospital costs | None of the studies reported costs. | |||||
| *The basis for the assumed risk is the mean comparison group proportion in the studies. The risk in the intervention group (and its 95% confidence interval) is based on the assumed risk in the comparison group and the relative effect of the intervention (and its 95% CI). CI: confidence interval; MD: mean difference; OR: odds ratio; RR: risk ratio. | ||||||
| GRADE Working Group grades of evidence | ||||||
| 1 Downgraded one level for serious risk of bias. 2 Downgraded two levels for very serious imprecision (the confidence interval of risk ratio overlapped 0.75 and 1.25, and small sample size). 3 Downgraded one level for serious imprecision (small sample size). 4 Downgraded two levels for very serious risk of bias. 5 Downgraded one level for indirectness. | ||||||
| Room air versus carbon dioxide for establishing pneumoperitoneum during laparoscopic abdominal surgery | ||||||
| Patient or population: people undergoing laparoscopic general abdominal or gynaecological pelvic surgery under general anaesthesia Setting: secondary and tertiary care Intervention: room air pneumoperitoneum Comparison: carbon dioxide pneumoperitoneum | ||||||
| Outcomes | Anticipated absolute effects* (95% CI) | Relative effect | No of participants | Quality of the evidence | Comments | |
| Risk with carbon dioxide pneumoperitoneum | Risk with room air pneumoperitoneum | |||||
| Cardiopulmonary complications Follow‐up: 1 month | See comment | See comment | Not estimable | 146 | ⊕⊝⊝⊝ | Trial did not report any cardiopulmonary complications. |
| Procedure‐related general complications | The study did not report procedure‐related general complications. | |||||
| Pneumoperitoneum‐related serious adverse events Follow‐up: 1 month | See comment | See comment | Not estimable | 146 | ⊕⊝⊝⊝ | Trial did not report any pneumoperitoneum‐related serious adverse events. |
| Mortality Follow‐up: 1 month | See comment | See comment | Not estimable | 146 | ⊕⊕⊝⊝ | The study did not report any deaths. |
| Quality of life | The study did not report quality of life. | |||||
| Pain scores (first postoperative day) Visual analogue scale, lower score indicates less pain. Follow‐up: 1 day | The mean pain scores (first postoperative day) in the carbon dioxide pneumoperitoneum was 2.60 cm | The mean pain scores (first postoperative day) in the room air pneumoperitoneum was | MD ‐0.80 (‐1.15 to ‐0.45) | 146 | ⊕⊝⊝⊝ | ‐ |
| Analgesia requirements | The study did not report analgesia requirements. | |||||
| Hospital costs (CNY) Follow‐up: 1 month | The mean hospital costs in the carbon dioxide pneumoperitoneum was CNY12,012.00 | The mean hospital costs in the room air pneumoperitoneum was CNY2667.00 lower | MD ‐2667.00 (‐3275.68 to ‐2058.32) | 146 | ⊕⊝⊝⊝ | ‐ |
| *The basis for the assumed risk is the mean comparison group proportion in the studies. The risk in the intervention group (and its 95% confidence interval) is based on the assumed risk in the comparison group and the relative effect of the intervention (and its 95% CI). CI: confidence interval; MD: mean difference. | ||||||
| GRADE Working Group grades of evidence | ||||||
| 1 Downgraded two levels for very serious risk of bias. 2 Downgraded one level for serious imprecision (small sample size). 3 Downgraded one level for serious risk of bias. | ||||||
| Changing between worst‐case scenario analysis and best‐case scenario analysis for missing data | |||
| Outcomes | Risk ratio (95% CI) | ||
| Main analysis | Worst/best‐case | Best/worst‐case | |
| Cardiopulmonary complications (nitrous oxide vs carbon dioxide) | 2.00 (0.38, 10.43) | 2.64 (0.64, 10.93) | 1.02 (0.27, 3.86) |
| Procedure‐related general complications/surgical morbidity (nitrous oxide vs carbon dioxide) | 1.01 (0.18, 5.71) | 1.82 (0.40, 8.31) | 0.56 (0.12, 2.58) |
| Pneumoperitoneum‐related serious adverse events (nitrous oxide vs carbon dioxide) | No events | Peto OR 7.46 (0.47, 119.30) | Peto OR 0.14 (0.01, 2.19) |
| Mortality (nitrous oxide vs carbon dioxide) | No events | Peto OR 7.46 (0.47, 119.30) | Peto OR 0.14 (0.01, 2.19) |
| Cardiopulmonary complications (helium vs carbon dioxide) | 1.46 (0.35, 6.12) | 4.58 (1.21, 17.36) | 1.46 (0.35, 6.12) |
| Procedure‐related general complications/surgical morbidity (helium vs carbon dioxide) | No events | 8.47 (1.11, 64.60) | 0.20 (0.01, 3.61) |
| Pneumoperitoneum‐related serious adverse events (helium vs carbon dioxide) | Peto OR 8.28 (0.86, 80.03) | Peto OR 9.19 (2.56, 33.01) | Peto OR 8.28 (0.86, 80.03) |
| Mortality (helium vs carbon dioxide) | No events | Peto OR 8.89 (1.94, 40.64) | Peto OR 0.12 (0.01, 2.07) |
| Peto OR: Peto odds ratio, which was calculated for rare events (mortality, serious adverse events). | |||
| Outcome or subgroup title | No. of studies | No. of participants | Statistical method | Effect size |
| 1 Cardiopulmonary complications Show forest plot | 2 | 140 | Risk Ratio (M‐H, Fixed, 95% CI) | 2.0 [0.38, 10.43] |
| 2 Procedure‐related general complications Show forest plot | 2 | 143 | Risk Ratio (M‐H, Fixed, 95% CI) | 1.01 [0.18, 5.71] |
| 3 Analgesia requirements Show forest plot | 3 | 193 | Std. Mean Difference (IV, Random, 95% CI) | ‐0.69 [‐1.42, 0.04] |
| 3.1 Oxycodone (mg) | 2 | 140 | Std. Mean Difference (IV, Random, 95% CI) | ‐0.97 [‐1.71, ‐0.22] |
| 3.2 Ibuprofen (tablets/24 hours) | 1 | 53 | Std. Mean Difference (IV, Random, 95% CI) | ‐0.16 [‐0.70, 0.38] |
| 4 Cardiopulmonary changes Show forest plot | 1 | Mean Difference (IV, Fixed, 95% CI) | Subtotals only | |
| 4.1 Heart rate (beats/minute) | 1 | 100 | Mean Difference (IV, Fixed, 95% CI) | ‐0.60 [‐4.13, 2.93] |
| 4.2 Mean arterial pressure (mmHg) | 1 | 100 | Mean Difference (IV, Fixed, 95% CI) | ‐3.80 [‐7.90, 0.30] |
| 4.3 Oxygen saturation (%) | 1 | 100 | Mean Difference (IV, Fixed, 95% CI) | 0.0 [‐0.39, 0.39] |
| 4.4 Peak airway pressure (cm H2O) | 1 | 100 | Mean Difference (IV, Fixed, 95% CI) | ‐0.30 [‐2.17, 1.57] |
| Outcome or subgroup title | No. of studies | No. of participants | Statistical method | Effect size |
| 1 Cardiopulmonary complications Show forest plot | 3 | 128 | Risk Ratio (M‐H, Fixed, 95% CI) | 1.46 [0.35, 6.12] |
| 2 Pneumoperitoneum‐related serious adverse events Show forest plot | 3 | 128 | Peto Odds Ratio (Peto, Fixed, 95% CI) | 8.28 [0.86, 80.03] |
| 3 Pain scores (cm) (first postoperative day) Show forest plot | 2 | 108 | Mean Difference (IV, Fixed, 95% CI) | 0.49 [‐0.28, 1.26] |
| 4 Analgesia requirements (morphine mg) Show forest plot | 1 | 90 | Mean Difference (IV, Fixed, 95% CI) | 12.0 [4.44, 19.56] |
| 5 Number of participants requiring analgesia Show forest plot | 1 | 18 | Risk Ratio (M‐H, Fixed, 95% CI) | 0.42 [0.17, 1.04] |
| 6 Cardiopulmonary parameters Show forest plot | 3 | Mean Difference (IV, Fixed, 95% CI) | Subtotals only | |
| 6.1 Blood pH (start) | 2 | 34 | Mean Difference (IV, Fixed, 95% CI) | 0.01 [‐0.01, 0.04] |
| 6.2 Blood pH (middle) | 3 | 52 | Mean Difference (IV, Fixed, 95% CI) | ‐0.00 [‐0.03, 0.02] |
| 6.3 Blood pH (end) | 2 | 34 | Mean Difference (IV, Fixed, 95% CI) | 0.10 [0.06, 0.14] |
| 6.4 Partial pressure of carbon dioxide (mmHg) (start) | 2 | 34 | Mean Difference (IV, Fixed, 95% CI) | 0.31 [‐1.79, 2.40] |
| 6.5 Partial pressure of carbon dioxide (mmHg) (middle) | 3 | 52 | Mean Difference (IV, Fixed, 95% CI) | ‐0.84 [‐3.70, 2.02] |
| 6.6 Partial pressure of carbon dioxide (mmHg) (end) | 2 | 34 | Mean Difference (IV, Fixed, 95% CI) | ‐12.78 [‐16.78, ‐8.77] |
| Outcome or subgroup title | No. of studies | No. of participants | Statistical method | Effect size |
| 1 Cardiopulmonary complications Show forest plot | 1 | 146 | Risk Ratio (M‐H, Fixed, 95% CI) | 0.0 [0.0, 0.0] |
| 2 Pneumoperitoneum‐related serious adverse events Show forest plot | 1 | 146 | Peto Odds Ratio (Peto, Fixed, 95% CI) | 0.0 [0.0, 0.0] |
| 3 Pain scores (cm) (first postoperative day) Show forest plot | 1 | 146 | Mean Difference (IV, Fixed, 95% CI) | ‐0.8 [‐1.15, ‐0.45] |
| 4 Hospital costs (CNY) Show forest plot | 1 | 146 | Mean Difference (IV, Fixed, 95% CI) | ‐2667.0 [‐3275.68, ‐2058.32] |
| 5 Cardiopulmonary parameters Show forest plot | 1 | Mean Difference (IV, Fixed, 95% CI) | Subtotals only | |
| 5.1 Heart rate (beats/minute) (start) | 1 | 146 | Mean Difference (IV, Fixed, 95% CI) | ‐0.10 [‐3.11, 2.91] |
| 5.2 Heart rate (beats/minute) (middle) | 1 | 146 | Mean Difference (IV, Fixed, 95% CI) | ‐7.30 [‐9.78, ‐4.82] |
| 5.3 Heart rate (beats/minute) (end) | 1 | 146 | Mean Difference (IV, Fixed, 95% CI) | ‐8.70 [‐11.72, ‐5.68] |
| 5.4 Blood systolic pressure (mmHg) (start) | 1 | 146 | Mean Difference (IV, Fixed, 95% CI) | ‐1.0 [‐5.12, 3.12] |
| 5.5 Blood systolic pressure (mmHg) (middle) | 1 | 146 | Mean Difference (IV, Fixed, 95% CI) | 2.80 [‐0.44, 6.04] |
| 5.6 Blood systolic pressure (mmHg) (end) | 1 | 146 | Mean Difference (IV, Fixed, 95% CI) | ‐2.0 [‐5.42, 1.42] |
| 5.7 Partial pressure of carbon dioxide (mmHg) (start) | 1 | 146 | Mean Difference (IV, Fixed, 95% CI) | ‐0.20 [‐1.39, 0.99] |
| 5.8 Partial pressure of carbon dioxide (mmHg) (middle) | 1 | 146 | Mean Difference (IV, Fixed, 95% CI) | ‐0.30 [‐1.37, 0.77] |
| 5.9 Partial pressure of carbon dioxide (mmHg) (end) | 1 | 146 | Mean Difference (IV, Fixed, 95% CI) | 0.10 [‐1.43, 1.63] |
| Outcome or subgroup title | No. of studies | No. of participants | Statistical method | Effect size |
| 1 Cardiopulmonary complications Show forest plot | 2 | 143 | Risk Ratio (M‐H, Fixed, 95% CI) | 2.64 [0.64, 10.93] |
| 2 Procedure‐related general complications Show forest plot | 2 | 143 | Risk Ratio (M‐H, Fixed, 95% CI) | 1.82 [0.40, 8.31] |
| 3 Pneumoperitoneum‐related serious adverse events Show forest plot | 2 | 143 | Peto Odds Ratio (Peto, Fixed, 95% CI) | 7.46 [0.47, 119.30] |
| 4 Mortality Show forest plot | 2 | 143 | Peto Odds Ratio (Peto, Fixed, 95% CI) | 7.46 [0.47, 119.30] |
| Outcome or subgroup title | No. of studies | No. of participants | Statistical method | Effect size |
| 1 Cardiopulmonary complications Show forest plot | 2 | 143 | Risk Ratio (M‐H, Fixed, 95% CI) | 1.02 [0.27, 3.86] |
| 2 Procedure‐related general complications Show forest plot | 2 | 143 | Risk Ratio (M‐H, Fixed, 95% CI) | 0.56 [0.12, 2.58] |
| 3 Pneumoperitoneum‐related serious adverse events Show forest plot | 2 | 143 | Peto Odds Ratio (Peto, Fixed, 95% CI) | 0.14 [0.01, 2.19] |
| 4 Mortality Show forest plot | 2 | 143 | Peto Odds Ratio (Peto, Fixed, 95% CI) | 0.14 [0.01, 2.19] |
| Outcome or subgroup title | No. of studies | No. of participants | Statistical method | Effect size |
| 1 Cardiopulmonary complications Show forest plot | 3 | 128 | Risk Ratio (M‐H, Fixed, 95% CI) | 4.58 [1.21, 17.36] |
| 2 Procedure‐related general complications Show forest plot | 4 | 144 | Risk Ratio (M‐H, Fixed, 95% CI) | 8.47 [1.11, 64.60] |
| 3 Pneumoperitoneum‐related serious adverse events Show forest plot | 3 | 128 | Peto Odds Ratio (Peto, Fixed, 95% CI) | 9.19 [2.56, 33.01] |
| 4 Mortality Show forest plot | 4 | 144 | Peto Odds Ratio (Peto, Fixed, 95% CI) | 8.89 [1.94, 40.64] |
| Outcome or subgroup title | No. of studies | No. of participants | Statistical method | Effect size |
| 1 Cardiopulmonary complications Show forest plot | 3 | 128 | Risk Ratio (M‐H, Fixed, 95% CI) | 1.46 [0.35, 6.12] |
| 2 Procedure‐related general complications Show forest plot | 4 | 144 | Risk Ratio (M‐H, Fixed, 95% CI) | 0.2 [0.01, 3.61] |
| 3 Pneumoperitoneum‐related serious adverse events Show forest plot | 3 | 128 | Peto Odds Ratio (Peto, Fixed, 95% CI) | 8.28 [0.86, 80.03] |
| 4 Mortality Show forest plot | 4 | 144 | Peto Odds Ratio (Peto, Fixed, 95% CI) | 0.12 [0.01, 2.07] |