| Transarterial embolisation and transarterial chemoembolisation compared with no intervention for liver metastases |
| Patient or population: people with liver metastases
Settings: hospital
Intervention: transarterial embolisation (TAE) and transarterial chemoembolisation (TACE)
Comparison: no intervention |
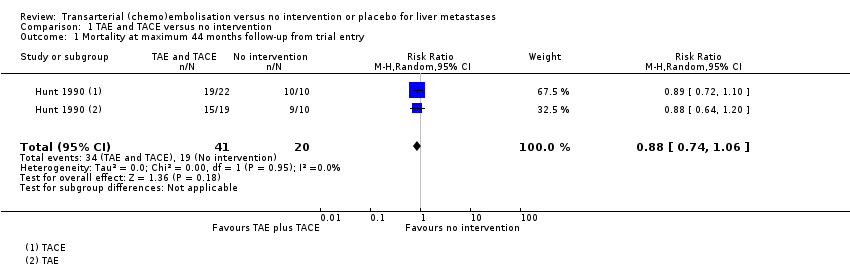
| Mortality at 44 months from trial entry Number of participants | 950 per 1000 | 836 per 1000
(703 to 1000) | RR 0.88
(0.74 to 1.06) | 61 (1 RCT) | ⊕⊝⊝⊝
Very lowa,b,c | |
| Survival time Median (range) survival time after trial entry Survival time Median (range) survival time from diagnosis | The median (range) survival time after trial entry in the control group was 7.9 months (1 month to 26 months) | The median survival time after trial entry in the TAE group was 0.9 months lower and in the TACE group was 2.8 months higher. | ‐‐ | 61
(1 RCT) | ⊕⊝⊝⊝
Very lowa,b,d | Median survival after trial entry was 7.0 months (range 2 to 44) in the TAE group, 10.7 months (range 3 to 38) in the TACE group and 7.9 months (range 1 to 26) in the control group. Authors reported that the difference was not statistically significant. |
| The median (range) survival time after from diagnosis in the control group was 9.6 months (1 month to 27 months) | The median survival time from diagnosis in the TAE group was 0.9 months lower and in the TACE group was 3.4 months higher. | ‐‐ | 61
(1 RCT) | ⊕⊝⊝⊝
Very lowa,b,d | Median survival after diagnosis was 8.7 months (range 2 to 49 months) in the TAE group, 13.0 months (range 3 to 38 months) in the TACE group, and 9.6 months (range 1 to 27 months) in the control group. The trial authors reported the differences were not statistically significant. |
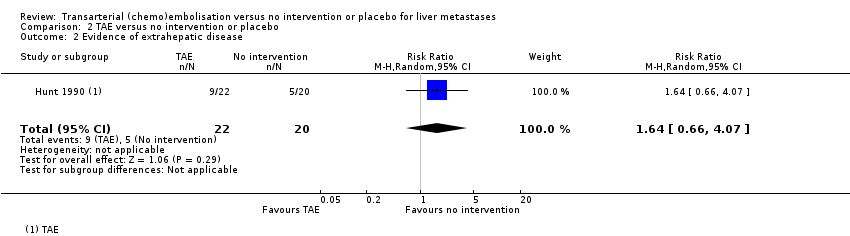
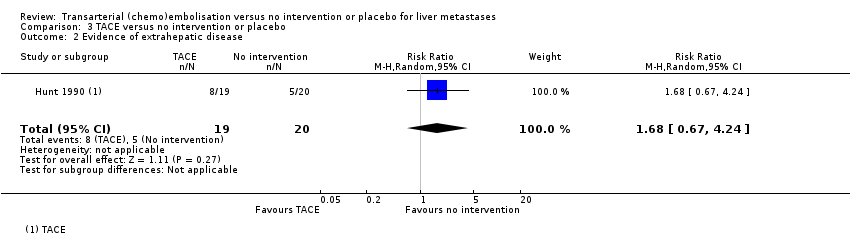
| Failure to clear liver metastases or recurrence of liver metastases | Local recurrence was reported in 10 participants without any details about the group to which they had been allocated to. | ‐‐ | 61
(1 RCT) | ⊕⊝⊝⊝
Very lowa,b,e | Number of participants who developed evidence of extrahepatic disease was 9/22 participants in the TAE group, 8/19 participants in the TACE group, and 5/20 participants in the control group. |
| Time to progression of liver metastases | Outcome not reported | ‐‐ | | | |
| Tumour response measures | Outcome not reported | ‐‐ | | | |
| Health‐related quality of life | Outcome not reported | ‐‐ | | | |
| Adverse events and complications | No adverse events reported | 82% of TAE recipients reported short‐term pain, nausea, vomiting, and pyrexia, which resolved with symptomatic treatment. All TACE recipients reported short‐term nausea with or without vomiting immediately after most of the treatment sessions, and short‐lived pain or discomfort. Single cases of local puncture site haematoma, wound infection, and deep vein thrombosis were reported. | ‐‐ | 61
(1 RCT) | ⊕⊝⊝⊝
Very lowa,b,f | |
| *The risk in the intervention group (corresponding risk and its 95% confidence interval) is based on the assumed risk in the comparison group and the relative effect of the intervention (and its 95% CI). CI: confidence interval; RR: risk ratio; RCT: randomised clinical trial; OIS: optimal information size |
| GRADE Working Group grades of evidence.
High certainty: we are very confident that the true effect lies close to that of the estimate of the effect.
Moderate certainty: we are moderately confident in the effect estimate; the true effect is likely to be close to the estimate of the effect, but there is a possibility that it is substantially different.
Low certainty: our confidence in the effect estimate is limited; the true effect may be substantially different from the estimate of the effect.
Very low certainty: we have very little confidence in the effect estimate; the true effect is likely to be substantially different from the estimate of effect. |