Primjena izotonične u odnosu na hipotonične otopine za intravensku hidraciju djece
References
References to studies included in this review
References to studies excluded from this review
References to studies awaiting assessment
References to ongoing studies
Additional references
References to other published versions of this review
Characteristics of studies
Characteristics of included studies [ordered by study ID]
| Methods | Randomised controlled trial | |
| Participants | 12 female, adolescent patients undergoing primary corrective surgery for idiopathic scoliosis | |
| Interventions | Isotonic (Hartmann's) Hypotonic (either 0.3% saline + 3% dextrose or 0.18% saline + 4% dextrose) Rate: 1.5 ml/kg/hr | |
| Outcomes | Development of SIADH | |
| Notes | — | |
| Risk of bias | ||
| Bias | Authors' judgement | Support for judgement |
| Random sequence generation (selection bias) | High risk | Alternated solutions for sequential patients |
| Allocation concealment (selection bias) | High risk | No allocation concealment as alternated solutions for sequential patients |
| Blinding of participants and personnel (performance bias) | Low risk | No blinding, but outcomes (blood tests) were objective |
| Blinding of outcome assessment (detection bias) | Low risk | No blinding, but blood test results were objective |
| Incomplete outcome data (attrition bias) | Low risk | ‐ |
| Selective reporting (reporting bias) | Unclear risk | No registered protocol |
| Other bias | Unclear risk | Method of blood sampling not described. If blood was taken from the same IV line into which the study fluid was administered, potential contamination could have occurred, artefactually affecting the laboratory sodium result |
| Methods | Randomised controlled trial | |
| Participants | 258 elective surgical patients aged 6 months to 16 years | |
| Interventions | 0.9% saline + 5% dextrose 0.45% saline + 5% dextrose Rate determined by treating physician | |
| Outcomes | Hyponatraemia < 135 mmol/L | |
| Notes | — | |
| Risk of bias | ||
| Bias | Authors' judgement | Support for judgement |
| Random sequence generation (selection bias) | Low risk | Computer‐generated randomisation sequence prepared by a statistician (in a 1:1 ratio), using block sizes of 6 and stratified according to postoperative admission ward |
| Allocation concealment (selection bias) | Low risk | Randomisation code maintained by the research pharmacist and concealed from all research personnel. Masked study solutions were numbered consecutively and stored in individual, correspondingly numbered containers. Research assistants enrolled participants and assigned the intervention from the sequentially numbered study containers |
| Blinding of participants and personnel (performance bias) | Low risk | Participants, medical and research staff members, investigators and data safety monitoring committee members were blinded. Solutions were repackaged individually in identical, sealed, opaque bags, identified only with the study number, additives (e.g. potassium chloride concentration) and the patient's name |
| Blinding of outcome assessment (detection bias) | Low risk | All caregivers were blinded to study‐specific investigation results |
| Incomplete outcome data (attrition bias) | Low risk | 83% primary outcome data in isotonic group, 86% in hypotonic group (lack of attrition well described) |
| Selective reporting (reporting bias) | Low risk | Registered protocol |
| Other bias | Unclear risk | ‐ |
| Methods | Randomised controlled trial | |
| Participants | 82 children undergoing spinal instrumentation, craniotomy for brain tumour resection or cranial vault remodelling | |
| Interventions | Hartmann's + 5% dextrose at full maintenance rate 0.45% saline + 5% dextrose at 2/3 maintenance rate | |
| Outcomes | Mean plasma sodium 16 to 18 hrs postoperatively | |
| Notes | Different fluid compositions were given at different rates | |
| Risk of bias | ||
| Bias | Authors' judgement | Support for judgement |
| Random sequence generation (selection bias) | Low risk | Computer‐generated random numbers in blocks of 10, stratified by type of surgery (spinal or cranial) |
| Allocation concealment (selection bias) | Low risk | Consecutively numbered, opaque envelopes |
| Blinding of participants and personnel (performance bias) | Low risk | Not blinded. Low risk of bias as strict pathways existed to alter management |
| Blinding of outcome assessment (detection bias) | Low risk | Not blinded. Risk of bias low as clinical care pathway followed |
| Incomplete outcome data (attrition bias) | Low risk | No patient withdrew after recruitment, 3 lost to follow‐up because of early discharge to ward, from both groups |
| Selective reporting (reporting bias) | Low risk | Registered protocol |
| Other bias | Unclear risk | ‐ |
| Methods | Randomised controlled trial | |
| Participants | 72 participants aged 16 months to 14 years with either of 2 conditions: a) gastroenteritis with moderate dehydration and unable to tolerate fluids; b) children requiring non‐urgent surgery and requiring maintenance intravenous hydration during their admission | |
| Interventions | 0.9% saline + 5% dextrose +/‐ 20 mmol/L KCl at maintenance rate 0.2% saline + 5% dextrose +/‐ 20 mmol/L KCl at maintenance rate | |
| Outcomes | Main outcome was plasma sodium at 4 (T4) and 8 (T8) hours, and the percentage of patients who developed hyponatraemia (> 125 mEq/L and < 135 mEq/L) | |
| Notes | Abstract only published to date | |
| Risk of bias | ||
| Bias | Authors' judgement | Support for judgement |
| Random sequence generation (selection bias) | Low risk | Used permuted blocks of 10 participants. A list was generated using Internet‐based software (randomization.com) |
| Allocation concealment (selection bias) | Low risk | The list was concealed by the main investigator (CC); text messages were sent to the investigator/clinician in turn when a patient agreed to participate in the study |
| Blinding of participants and personnel (performance bias) | Low risk | Participants, but not personnel, were blinded. Outcomes (blood tests) were objective and performed at predetermined time points |
| Blinding of outcome assessment (detection bias) | Low risk | No blinding, but blood test results were objective |
| Incomplete outcome data (attrition bias) | Low risk | No patient withdrawals |
| Selective reporting (reporting bias) | Unclear risk | Protocol not registered, but outcomes studied were similar to other studies |
| Other bias | Unclear risk | Abstract only published to date. Full text yet to be peer reviewed |
| Methods | Randomised controlled trial | |
| Participants | Broad paediatric population aged 3 months to 12 years (university hospital in India); 167 participants | |
| Interventions | 0.9% saline + 5% dextrose at standard maintenance rate 0.18% saline + 5% dextrose at standard maintenance rate 0.18% saline + 5% dextrose at 2/3 restricted rate | |
| Outcomes | Hyponatraemia < 130 mEq/L | |
| Notes | — | |
| Risk of bias | ||
| Bias | Authors' judgement | Support for judgement |
| Random sequence generation (selection bias) | Low risk | Separate randomisation sequence for each stratum using Stata version 7.0 |
| Allocation concealment (selection bias) | Low risk | Randomisation list and numbered envelopes prepared offsite by independent staff. Sealed, opaque envelopes |
| Blinding of participants and personnel (performance bias) | Low risk | No blinding, but outcome measures objective |
| Blinding of outcome assessment (detection bias) | Low risk | No blinding, but outcome measures objective |
| Incomplete outcome data (attrition bias) | Unclear risk | Not stated |
| Selective reporting (reporting bias) | Low risk | Registered protocol |
| Other bias | Unclear risk | ‐ |
| Methods | Randomised controlled trial | |
| Participants | 122 paediatric intensive care unit patients | |
| Interventions | Isotonic fluid (sodium 140 mEq/L) Hypotonic fluid (sodium between 20 and 100 mEq/L corresponding to 2 to 4 mEq/kg/24 hr) Exact composition of fluids not stated Rate: standard maintenance | |
| Outcomes | Hyponatraemia < 135 mEq/L | |
| Notes | — | |
| Risk of bias | ||
| Bias | Authors' judgement | Support for judgement |
| Random sequence generation (selection bias) | Low risk | Binary series with randomised numbers, using randomisation function of the MS‐Excel XP program of Windows. Balanced block sampling with 2 block sizes: 4 and 6 |
| Allocation concealment (selection bias) | Unclear risk | First author aware of sequence. Following admission, he was contacted and provided the group allocation |
| Blinding of participants and personnel (performance bias) | Low risk | Not blinded, but primary outcome objective |
| Blinding of outcome assessment (detection bias) | Low risk | Not blinded, but primary outcome objective |
| Incomplete outcome data (attrition bias) | Low risk | 84% analysed ‐ most drop‐outs due to finishing fluid prior to 6 hours |
| Selective reporting (reporting bias) | Unclear risk | Protocol not registered |
| Other bias | Unclear risk | Method of blood sampling not described. If blood was taken from the same IV line into which the study fluid was administered, potential contamination could have occurred, artefactually affecting the laboratory sodium result |
| Methods | Randomised controlled trial | |
| Participants | 147 children undergoing elective or emergency surgery | |
| Interventions | 0.9% saline + 2.5% dextrose at standard maintenance rate 0.9% saline + 5% dextrose at 50% maintenance rate 0.45% saline + 2.5% dextrose at standard maintenance rate 0.45% saline + 5% dextrose at 50% maintenance | |
| Outcomes | Change in plasma sodium from induction of anaesthesia to T8 and rates of hyponatraemia | |
| Notes | — | |
| Risk of bias | ||
| Bias | Authors' judgement | Support for judgement |
| Random sequence generation (selection bias) | Low risk | Not computer‐generated, but opaque envelopes in completely random order |
| Allocation concealment (selection bias) | Low risk | Sequential selection of an opaque, sealed envelope containing the fluid choice in a random order |
| Blinding of participants and personnel (performance bias) | Low risk | Not blinded, but primary outcome objective |
| Blinding of outcome assessment (detection bias) | Low risk | Not blinded, but primary outcome objective |
| Incomplete outcome data (attrition bias) | Low risk | 84% analysed, similar proportion in each group. Well explained |
| Selective reporting (reporting bias) | Unclear risk | Protocol not registered |
| Other bias | Unclear risk | Method of blood sampling not described. If blood was taken from the same IV line into which the study fluid was administered, potential contamination could have occurred, artefactually affecting the laboratory sodium result |
| Methods | Randomised controlled trial | |
| Participants | 134 paediatric intensive care unit patients | |
| Interventions | Isotonic (sodium 136 mmol/L) Hypotonic (sodium 30 to 50 mmol/L) Exact composition not stated Rate: standard maintenance | |
| Outcomes | Change in plasma sodium from admission to 12 and 24 hours later | |
| Notes | — | |
| Risk of bias | ||
| Bias | Authors' judgement | Support for judgement |
| Random sequence generation (selection bias) | Low risk | Patient group assignment was previously made using the random number generator of the free software R.10.0 (www.r‐project.org). Random seed was initialised by the particular date |
| Allocation concealment (selection bias) | Unclear risk | Not described |
| Blinding of participants and personnel (performance bias) | Low risk | Not blinded, but primary outcome objective |
| Blinding of outcome assessment (detection bias) | Low risk | Not blinded, but primary outcome objective |
| Incomplete outcome data (attrition bias) | Low risk | 93% analysed |
| Selective reporting (reporting bias) | Low risk | Registered protocol |
| Other bias | Unclear risk | Method of blood sampling not described. If blood was taken from the same IV line into which the study fluid was administered, potential contamination could have occurred, artefactually affecting the laboratory sodium result |
| Methods | Randomised controlled trial | |
| Participants | 59 patients including medical patients admitted via the Emergency Department and elective surgical patients | |
| Interventions | 0.9% saline + 5% dextrose 0.45% saline + 5% dextrose Rate: physician's discretion | |
| Outcomes | Rate of change of sodium | |
| Notes | — | |
| Risk of bias | ||
| Bias | Authors' judgement | Support for judgement |
| Random sequence generation (selection bias) | Low risk | Stratified by admission type (medical versus surgical), carried out in blocks of 6 using a computerised random number generator |
| Allocation concealment (selection bias) | Unclear risk | Not described |
| Blinding of participants and personnel (performance bias) | Low risk | Participants, the treating team and the research team were blinded ‐ solutions covered with opaque plastic covering by the pharmacist |
| Blinding of outcome assessment (detection bias) | Low risk | Not blinded, but primary outcome objective |
| Incomplete outcome data (attrition bias) | High risk | Planned to enrol 25 patients per group, only 16 and 21 completed. Also, large "declined to participate" numbers (83/142) |
| Selective reporting (reporting bias) | Low risk | Registered protocol |
| Other bias | Unclear risk | Method of blood sampling not described. If blood was taken from the same IV line into which the study fluid was administered, potential contamination could have occurred, artefactually affecting the laboratory sodium result |
| Methods | Randomised controlled trial | |
| Participants | 53 paediatric intensive care unit patients | |
| Interventions | 0.9% saline at standard maintenance rate 0.9% saline at 2/3 maintenance rate 0.18% saline + 4% dextrose at standard maintenance rate 0.18% saline + 4% dextrose at 2/3 maintenance rate | |
| Outcomes | Change in plasma sodium from admission to 12 to 24 hours later | |
| Notes | — | |
| Risk of bias | ||
| Bias | Authors' judgement | Support for judgement |
| Random sequence generation (selection bias) | Low risk | Random numbers using blocks of 6 |
| Allocation concealment (selection bias) | Low risk | Fluids and rate kept in sealed box |
| Blinding of participants and personnel (performance bias) | Low risk | Blinded to type but not rate. Primary outcome objective |
| Blinding of outcome assessment (detection bias) | Low risk | Not blinded, but primary outcome objective |
| Incomplete outcome data (attrition bias) | Low risk | 94% analysed |
| Selective reporting (reporting bias) | Low risk | Registered protocol |
| Other bias | Unclear risk | Method of blood sampling not described. If blood was taken from the same IV line into which the study fluid was administered, potential contamination could have occurred, artefactually affecting the laboratory sodium result |
hr: hour
IV: intravenous
SIADH: syndrome of inappropriate antidiuretic hormone secretion
Characteristics of excluded studies [ordered by study ID]
| Study | Reason for exclusion |
| Published only as a conference abstract. Insufficient detail available | |
| Predominantly examined intraoperative fluid replacement rather than maintenance hydration | |
| Study published only in protocol form. Contact with the researchers indicated that the study has been ceased due to insufficient recruitment. | |
| Intravenous fluids primarily given to replace a pre‐existing deficit rather than for maintenance hydration |
Characteristics of studies awaiting assessment [ordered by study ID]
| Methods | Blinded randomised controlled trial |
| Participants | 63 intensive care patients |
| Interventions | 0.9% sodium chloride + 5% dextrose 0.45% sodium chloride + 5% dextrose (maintenance rates) |
| Outcomes | Change in sodium between baseline and after maintenance infusion was ceased |
| Notes | Published after our search was completed |
| Methods | Blinded randomised controlled trial |
| Participants | 690 hospitalised children requiring intravenous maintenance fluid |
| Interventions | Plasmalyte148 + 5% dextrose 0.45% sodium chloride + 5% dextrose |
| Outcomes | Proportion of patients developing hyponatraemia (serum sodium <135 mmol/L with a decrease of at least 3 mmol/L compared with baseline) |
| Notes | Published after our search was completed |
| Methods | Blinded randomised controlled trial (3 armed) |
| Participants | 92 patients aged 3 months to 5 years with suspected central nervous system infections |
| Interventions | 0.9% sodium chloride + 5% dextrose 0.45% sodium chloride + 5% dextrose 0.18% sodium chloride + 5% dextrose (maintenance rates) |
| Outcomes | Proportion of patients developing hyponatremia (serum sodium < 135 mmol/L) after 24 h and serum sodium values at 6, 12, 18, 24 h of receiving maintenance fluids |
| Notes | Published after our search was completed |
Characteristics of ongoing studies [ordered by study ID]
| Trial name or title | Randomised controlled trial comparing isotonic and hypotonic intravenous fluids for maintenance fluid therapy in children Registration ID: CTRI/2010/091/000398 |
| Methods | |
| Participants | 60 children |
| Interventions | 0.9% sodium chloride + 5% dextrose at 60% maintenance rate 0.18% sodium chloride + 5% dextrose at 100% maintenance rate |
| Outcomes | Incidence of hyponatraemia 24 and 48 hours after initiating intervention |
| Starting date | |
| Contact information | |
| Notes |
| Trial name or title | Randomised, double‐blind, controlled trial of 0.9% NaCl/dextrose 5% versus 0.45% NaCl/dextrose 5% as maintenance intravenous fluids in hospitalised children Registration ID: NCT00632775 |
| Methods | |
| Participants | 110 children |
| Interventions | 0.9% sodium chloride + 5% dextrose 0.45% sodium chloride + 5% dextrose (maintenance rates) |
| Outcomes | Plasma urea, creatinine, glucose and electrolyte levels at the time of IV start and every 24 hours thereafter |
| Starting date | December 2007 |
| Contact information | |
| Notes |
Data and analyses
| Outcome or subgroup title | No. of studies | No. of participants | Statistical method | Effect size |
| 1 Hyponatraemia Show forest plot | 10 | 970 | Risk Ratio (M‐H, Fixed, 95% CI) | 0.48 [0.38, 0.60] |
| Analysis 1.1 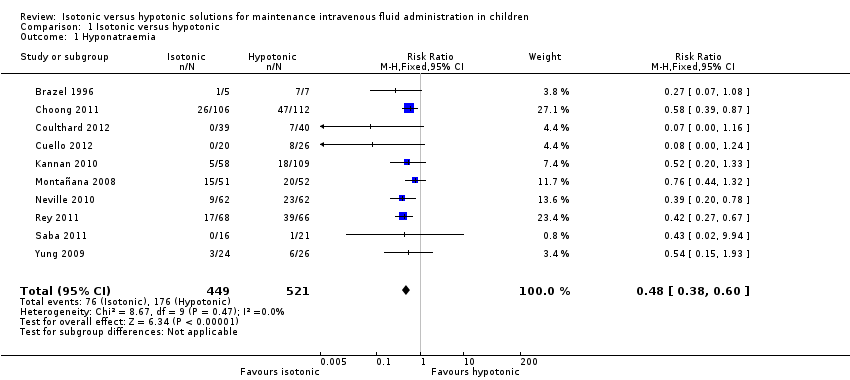 Comparison 1 Isotonic versus hypotonic, Outcome 1 Hyponatraemia. | ||||
| 2 Hypernatraemia Show forest plot | 9 | 937 | Risk Ratio (M‐H, Fixed, 95% CI) | 1.24 [0.65, 2.38] |
| Analysis 1.2  Comparison 1 Isotonic versus hypotonic, Outcome 2 Hypernatraemia. | ||||
| 3 Mean serum sodium T6‐T12 Show forest plot | 7 | 851 | Mean Difference (IV, Fixed, 95% CI) | 1.99 [1.55, 2.42] |
| Analysis 1.3  Comparison 1 Isotonic versus hypotonic, Outcome 3 Mean serum sodium T6‐T12. | ||||
| 4 Mean serum sodium at T > T12 to T24 Show forest plot | 6 | 579 | Mean Difference (IV, Fixed, 95% CI) | 1.33 [0.81, 1.85] |
| Analysis 1.4  Comparison 1 Isotonic versus hypotonic, Outcome 4 Mean serum sodium at T > T12 to T24. | ||||
| 5 Death Show forest plot | 10 | 996 | Risk Ratio (M‐H, Fixed, 95% CI) | 5.59 [0.23, 135.17] |
| Analysis 1.5  Comparison 1 Isotonic versus hypotonic, Outcome 5 Death. | ||||
| 6 Seizures Show forest plot | 10 | 996 | Risk Ratio (M‐H, Fixed, 95% CI) | 0.62 [0.03, 15.02] |
| Analysis 1.6  Comparison 1 Isotonic versus hypotonic, Outcome 6 Seizures. | ||||
| 7 Cerebral oedema Show forest plot | 9 | Risk Ratio (M‐H, Fixed, 95% CI) | Subtotals only | |
| Analysis 1.7  Comparison 1 Isotonic versus hypotonic, Outcome 7 Cerebral oedema. | ||||
| 8 Overhydration Show forest plot | 5 | 615 | Risk Ratio (M‐H, Fixed, 95% CI) | 1.14 [0.46, 2.87] |
| Analysis 1.8 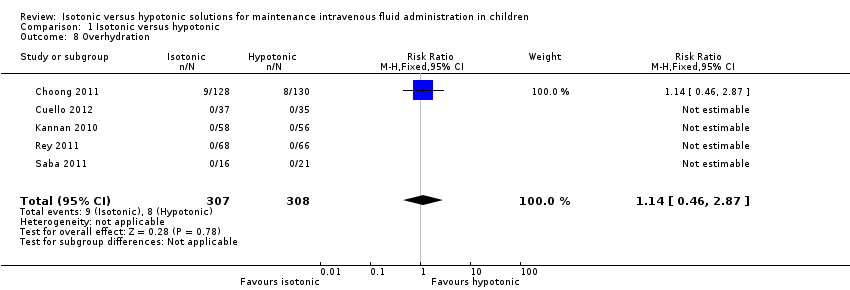 Comparison 1 Isotonic versus hypotonic, Outcome 8 Overhydration. | ||||
| 9 Urine osmolarity at T24 Show forest plot | 3 | 278 | Mean Difference (IV, Fixed, 95% CI) | 12.68 [‐34.20, 59.56] |
| Analysis 1.9 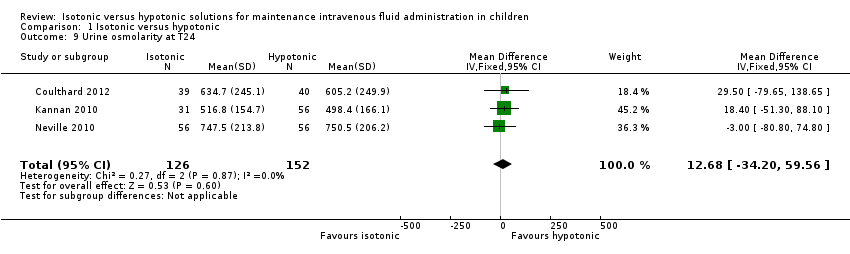 Comparison 1 Isotonic versus hypotonic, Outcome 9 Urine osmolarity at T24. | ||||
| 10 Urinary sodium concentration at T24 Show forest plot | 4 | 516 | Mean Difference (IV, Fixed, 95% CI) | 14.72 [9.02, 20.42] |
| Analysis 1.10  Comparison 1 Isotonic versus hypotonic, Outcome 10 Urinary sodium concentration at T24. | ||||
| 11 Hyponatraemia (by concentration of hypotonic fluid) Show forest plot | 9 | Risk Ratio (M‐H, Fixed, 95% CI) | Subtotals only | |
| Analysis 1.11 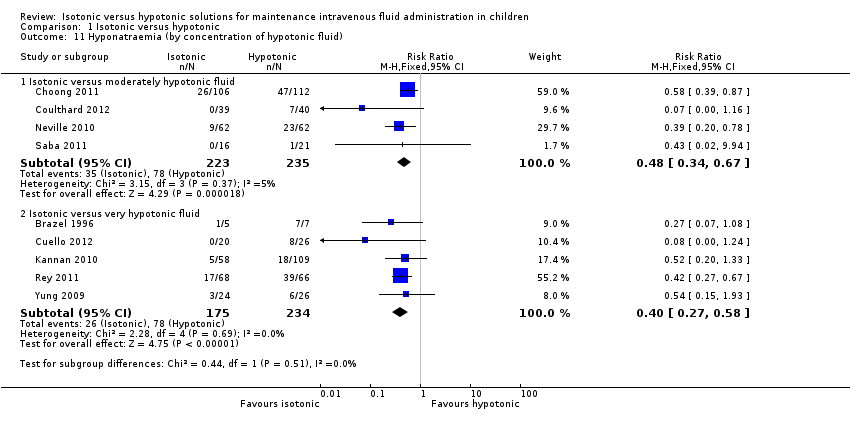 Comparison 1 Isotonic versus hypotonic, Outcome 11 Hyponatraemia (by concentration of hypotonic fluid). | ||||
| 11.1 Isotonic versus moderately hypotonic fluid | 4 | 458 | Risk Ratio (M‐H, Fixed, 95% CI) | 0.48 [0.34, 0.67] |
| 11.2 Isotonic versus very hypotonic fluid | 5 | 409 | Risk Ratio (M‐H, Fixed, 95% CI) | 0.40 [0.27, 0.58] |
| 12 Hyponatraemia (surgical/medical) Show forest plot | 8 | Risk Ratio (M‐H, Fixed, 95% CI) | Subtotals only | |
| Analysis 1.12 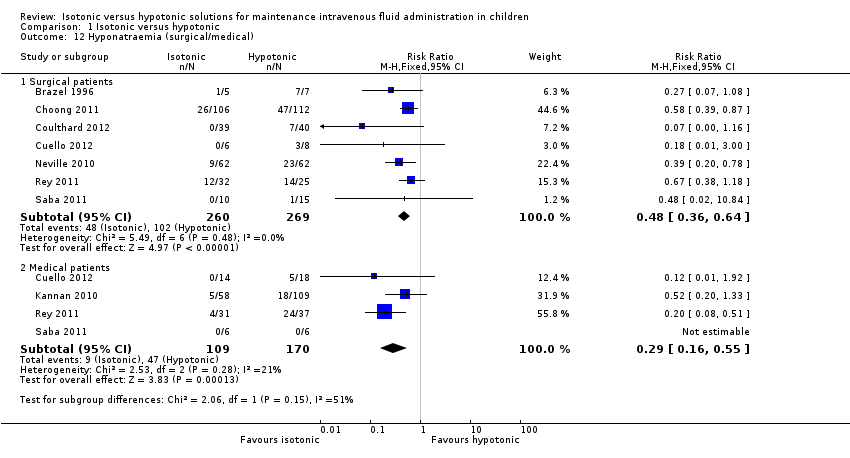 Comparison 1 Isotonic versus hypotonic, Outcome 12 Hyponatraemia (surgical/medical). | ||||
| 12.1 Surgical patients | 7 | 529 | Risk Ratio (M‐H, Fixed, 95% CI) | 0.48 [0.36, 0.64] |
| 12.2 Medical patients | 4 | 279 | Risk Ratio (M‐H, Fixed, 95% CI) | 0.29 [0.16, 0.55] |
| 13 Hyponatraemia (by fluid rate) Show forest plot | 5 | Risk Ratio (M‐H, Fixed, 95% CI) | Subtotals only | |
| Analysis 1.13  Comparison 1 Isotonic versus hypotonic, Outcome 13 Hyponatraemia (by fluid rate). | ||||
| 13.1 Full maintenance | 5 | 459 | Risk Ratio (M‐H, Fixed, 95% CI) | 0.45 [0.33, 0.61] |
| 13.2 Restricted rate | 1 | 62 | Risk Ratio (M‐H, Fixed, 95% CI) | 0.45 [0.18, 1.16] |
| 14 Hyponatraemia (by age) Show forest plot | 8 | Risk Ratio (M‐H, Fixed, 95% CI) | Subtotals only | |
| Analysis 1.14  Comparison 1 Isotonic versus hypotonic, Outcome 14 Hyponatraemia (by age). | ||||
| 14.1 Age < 1 year | 7 | 100 | Risk Ratio (M‐H, Fixed, 95% CI) | 0.33 [0.12, 0.88] |
| 14.2 Age 1 to 5 years | 7 | 243 | Risk Ratio (M‐H, Fixed, 95% CI) | 0.33 [0.19, 0.57] |
| 14.3 Age > 5 years | 8 | 465 | Risk Ratio (M‐H, Fixed, 95% CI) | 0.51 [0.38, 0.69] |
| 15 Hyponatraemia (by severity of illness) Show forest plot | 9 | Risk Ratio (M‐H, Fixed, 95% CI) | Subtotals only | |
| Analysis 1.15 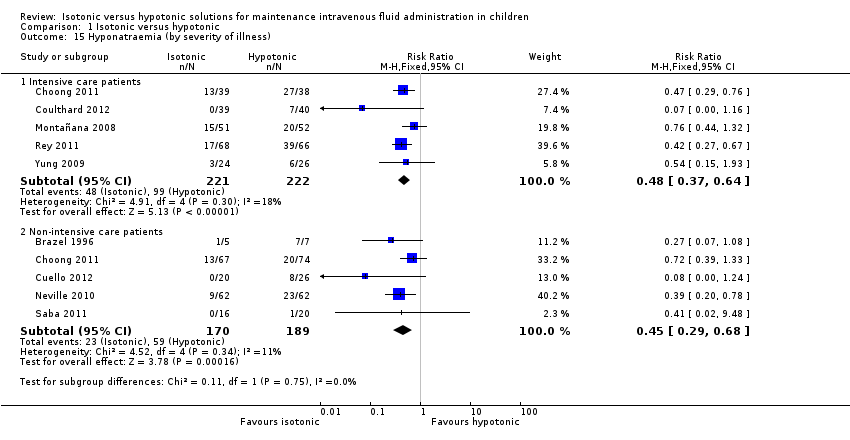 Comparison 1 Isotonic versus hypotonic, Outcome 15 Hyponatraemia (by severity of illness). | ||||
| 15.1 Intensive care patients | 5 | 443 | Risk Ratio (M‐H, Fixed, 95% CI) | 0.48 [0.37, 0.64] |
| 15.2 Non‐intensive care patients | 5 | 359 | Risk Ratio (M‐H, Fixed, 95% CI) | 0.45 [0.29, 0.68] |
| 16 Sensitivity analysis ‐ balanced fluid rates Show forest plot | 8 | 735 | Risk Ratio (M‐H, Fixed, 95% CI) | 0.45 [0.35, 0.58] |
| Analysis 1.16  Comparison 1 Isotonic versus hypotonic, Outcome 16 Sensitivity analysis ‐ balanced fluid rates. | ||||
| 17 Sensitivity analysis ‐ normonatraemic at baseline Show forest plot | 4 | 326 | Risk Ratio (M‐H, Fixed, 95% CI) | 0.49 [0.34, 0.71] |
| Analysis 1.17 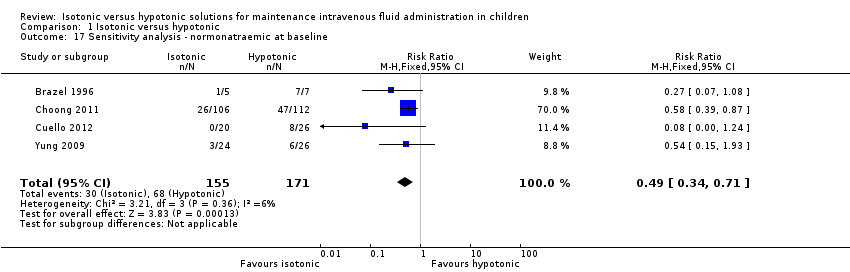 Comparison 1 Isotonic versus hypotonic, Outcome 17 Sensitivity analysis ‐ normonatraemic at baseline. | ||||

Comparison 1 Isotonic versus hypotonic, Outcome 1 Hyponatraemia.
Comparison 1 Isotonic versus hypotonic, Outcome 2 Hypernatraemia.
Comparison 1 Isotonic versus hypotonic, Outcome 3 Mean serum sodium T6‐T12.
Comparison 1 Isotonic versus hypotonic, Outcome 4 Mean serum sodium at T > T12 to T24.
Comparison 1 Isotonic versus hypotonic, Outcome 5 Death.
Comparison 1 Isotonic versus hypotonic, Outcome 6 Seizures.
Comparison 1 Isotonic versus hypotonic, Outcome 7 Cerebral oedema.
Comparison 1 Isotonic versus hypotonic, Outcome 8 Overhydration.
Comparison 1 Isotonic versus hypotonic, Outcome 9 Urine osmolarity at T24.
Comparison 1 Isotonic versus hypotonic, Outcome 10 Urinary sodium concentration at T24.
Comparison 1 Isotonic versus hypotonic, Outcome 11 Hyponatraemia (by concentration of hypotonic fluid).
Comparison 1 Isotonic versus hypotonic, Outcome 12 Hyponatraemia (surgical/medical).
Comparison 1 Isotonic versus hypotonic, Outcome 13 Hyponatraemia (by fluid rate).
Comparison 1 Isotonic versus hypotonic, Outcome 14 Hyponatraemia (by age).
Comparison 1 Isotonic versus hypotonic, Outcome 15 Hyponatraemia (by severity of illness).
Comparison 1 Isotonic versus hypotonic, Outcome 16 Sensitivity analysis ‐ balanced fluid rates.
Comparison 1 Isotonic versus hypotonic, Outcome 17 Sensitivity analysis ‐ normonatraemic at baseline.
| Isotonic intravenous fluid compared with hypotonic intravenous fluid to maintain hydration | ||||||
| Patient or population: children requiring intravenous fluid to maintain hydration Settings: inpatient hospital setting Intervention: isotonic intravenous fluid Comparison: hypotonic intravenous fluid | ||||||
| Outcomes | Illustrative comparative risks* (95% CI) | Relative effect | No of participants | Quality of the evidence | Comments | |
| Assumed risk | Corresponding risk | |||||
| Hypotonic intravenous fluid | Isotonic intravenous fluid | |||||
| Hyponatraemia (serum sodium < 135 mmol/L) | Study population | RR 0.48 (0.38 to 0.60) | 970 | ⊕⊕⊕⊕ | ||
| 338 per 1000 | 169 per 1000 | |||||
| Surgical patients | RR 0.48 (0.36 to 0.64) | 529 (7) | ⊕⊕⊕⊕ | |||
| 379 per 1000 | 185 per 1000 | |||||
| Medical patients | RR 0.29 (0.16 to 0.55) | 279 (4) | ⊕⊕⊕⊝ | |||
| 276 per 1000 | 83 per 1000 | |||||
| Intensive care patients | RR 0.48 (0.37 to 0.64) | 443 (5) | ⊕⊕⊕⊕ | |||
| 446 per 1000 | 217 per 1000 | |||||
| Non‐intensive care patients | RR 0.45 (0.29 to 0.68) | 359 (5) | ⊕⊕⊕⊝ | |||
| 312 per 1000 | 135 per 1000 | |||||
| Hypernatraemia | Study population | RR 1.24 (0.65 to 2.38) | 937 | ⊕⊕⊝⊝ | Quality of evidence downgraded due to imprecision ‐ small number of events, wide confidence interval | |
| 34 per 1000 | 37 per 1000 | |||||
| Death | Study population | 5.59 (0.23 to 135.17) | 996 | ⊕⊕⊝⊝ | Quality of evidence downgraded due to imprecision ‐ small number of events, wide confidence interval Study design reduced the likelihood of this outcome | |
| 0 per 1000 | 2 per 1000 | |||||
| Seizures | Study population | RR 0.62 (0.03 to 15.02) | 996 | ⊕⊕⊝⊝ | Quality of evidence downgraded due to imprecision ‐ small number of events, wide confidence interval Study design reduced the likelihood of this outcome | |
| 2 per 1000 | 0 per 1000 | |||||
| Cerebral oedema | Study population | RR incalculable | 9 studies | ⊕⊝⊝⊝ | Quality of evidence downgraded due to imprecision ‐ no events, incalculable confidence interval Study design reduced the likelihood of this outcome | |
| 0 per 1000 | 0 per 1000 | |||||
| Overhydration | Study population | RR 1.14 (0.46 to 2.87) | 615 | ⊕⊕⊝⊝ | Quality of evidence downgraded due to imprecision ‐ small number of events, wide confidence interval Heterogeneity in the criteria for assessing this outcome | |
| 26 per 1000 | 30 per 1000 | |||||
| *The basis for the assumed risk (e.g. the median control group risk across studies) is provided in footnotes. The corresponding risk (and its 95% confidence interval) is based on the assumed risk in the comparison group and the relative effect of the intervention (and its 95% CI). | ||||||
| GRADE Working Group grades of evidence | ||||||
|
| Na+ (mmol/L) | Cl‐ (mmol/L) | K+ (mmol/L) | Mg++ (mmol/L) | Calcium (mmol/L) | Lactate (mmol/L) | Acetate (mmol/L) | Gluconate (mmol/L) | Glucose (gram/L) |
| Physiologically isotonic/near isotonic | |||||||||
| 0.9% sodium chloride | 154 | 154 | ‐ | ‐ | ‐ | ‐ | ‐ | ‐ | ‐ |
| 0.9% sodium chloride with 2.5/5% dextrose | 154 | 154 | ‐ | ‐ | ‐ | ‐ | ‐ | ‐ | 25 / 50 |
| Hartmann's solution (similar in ionic composition to Ringer's lactate) | 131 | 111 | 5 | ‐ | 2 | 29 | ‐ | ‐ | ‐ |
| Plasmalyte 148 solution | 140 | 98 | 5 | 1.5 | ‐ | ‐ | 27 | 23 | ‐ |
| Plasmalyte 148 solution with 5% dextrose | 140 | 98 | 5 | 1.5 | ‐ | ‐ | 27 | 23 | 50 |
| Physiologically moderately hypotonic | |||||||||
| 0.45% sodium chloride (N/2) with 5% dextrose | 77 | 77 | ‐ | ‐ | ‐ | ‐ | ‐ | ‐ | 50 |
| Physiologically very hypotonic | |||||||||
| 0.3% sodium chloride (N/3) with 3.3% dextrose | 51 | 51 | ‐ | ‐ | ‐ | ‐ | ‐ | ‐ | 33 |
| 0.18% sodium chloride (N/5) with 4% dextrose | 30 | 30 | ‐ | ‐ | ‐ | ‐ | ‐ | ‐ | 40 |
| Note: Minor variations in composition occur at the point of manufacture. | |||||||||
| Study | Number of participants | Population | Study arms | Primary outcome |
| 12 | Patients undergoing primary corrective surgery for idiopathic scoliosis | Isotonic (Hartmann's) Hypotonic (either 0.3% saline + 3% dextrose or 0.18% saline + 4% dextrose) Rate: 1.5 ml/kg/hr | Development of SIADH | |
| 122 | PICU patients | Isotonic fluid (sodium 140 mEq/L) Hypotonic fluid (sodium between 20 and 100 mEq/L corresponding to 2 to 4 mEq/kg/24 hr) Exact composition of fluids not stated Rate: standard maintenance | Hyponatraemia < 135 mEq/L | |
| 50 | PICU patients | 0.9% saline at standard maintenance rate 0.9% saline at 2/3 restricted rate 0.18% saline + 4% dextrose at standard maintenance rate 0.18% saline + 4% dextrose at 2/3 restricted rate | Change in plasma sodium from admission to 12 to 24 hrs later | |
| 167 | Broad paediatric population (university hospital in India) | 0.9% saline + 5% dextrose at standard maintenance rate 0.18% saline + 5% dextrose at standard maintenance rate 0.18% saline + 5% dextrose at 2/3 restricted rate | Hyponatraemia < 130mEq/L | |
| 124 | Elective or emergency surgery | 0.9% saline + 2.5% dextrose at standard maintenance rate 0.9% saline + 5% dextrose at 50% restricted rate 0.45% saline + 2.5% dextrose at standard maintenance rate 0.45% saline + 5% dextrose at 50% restricted rate | Change in plasma sodium from induction of anaesthesia to T8 | |
| 125 | PICU patients | Isotonic (sodium 136 mmol/L) Hypotonic (sodium 30 to 50 mmol/L) Exact composition not stated Rate: standard maintenance | Change in plasma sodium from admission to 12 and 24 hrs later | |
| 258 | Surgical patients | 0.9% saline + 5% dextrose 0.45% saline + 5% dextrose Rate: Physician's discretion | Hyponatraemia < 135 mmol/L | |
| 37 | Medical patients admitted via ED Elective surgical patients | 0.9% saline + 5% dextrose 0.45% saline + 5% dextrose Rate: physician's discretion | Rate of change of sodium | |
| 82 | Patients undergoing spinal instrumentation, craniotomy for brain tumour resection or cranial vault remodelling | Hartmann's + 5% dextrose at full maintenance rate 0.45% saline + 5% dextrose at 2/3 restricted rate | Mean plasma sodium 16 to 18 hrs postoperatively | |
| (abstract only) | 72 | Participants with either of 2 conditions: a) gastroenteritis with moderate dehydration and unable to tolerate fluids b) children requiring non‐urgent surgery and requiring maintenance intravenous hydration during their admission | 0.9% saline + 5% dextrose +/‐ 20 mmol/L KCl 0.2% saline + 5% dextrose +/‐ 20 mmol/L KCl Rate: standard maintenance | Mean plasma sodium at 4 (T4) and 8 (T8) hours, and the percentage of patients who developed hyponatraemia (> 125 mEq/L and < 135 mEq/L) |
| ED: emergency department KCl: potassium choride | ||||
| First author | Duration of fluid therapy | Timing of outcome measurements |
| Brazel | Max 72 hrs | End of procedure, T6, T24, T48, T72
|
| Montañana | Max 24 hrs | T6, T24 (only T6 primary outcome data included in analysis) |
| Yung | 12 to 24 hrs | T12 to 24 |
| Kannan | Max 72 hrs | T12, T24, T36, T48, T60, T72
|
| Neville | Max 24 hrs | At intubation, T8, T24 |
| Rey | Max 24 hrs | T12, T24 |
| Choong | Max 48 hrs | T12, T24, T36, T48 |
| Saba | 8 to 12 hrs | T12 |
| Coulthard | 16 to 18 hrs | T16 to 18 |
| Cuello | 8 hrs | T4, T8 |
| hr: hour | ||
| Primary author | Inclusion criteria | Exclusion criteria |
| Brazel | Adolescent patients undergoing primary corrective surgery for adolescent idiopathic scoliosis
| — |
| Montañana | PICU patients requiring maintenance intravenous fluid
| Chronic or acute kidney failure Patients at risk of cerebral oedema (diabetic ketoacidosis or craneoencephalic trauma) Patients with plasma sodium level at admission < 130 mEq/L or > 150 mEq/L, and/or dehydration > 5% of the patient's body weight
|
| Yung | Patients admitted to PICU who would normally require IV fluids at standard maintenance rates for 12 hrs, with normal sodium levels and not hypoglycaemic
| Neonates, diabetes, renal failure, shock Cardiac and neurosurgical patients were eligible for the restricted rate arm only |
| Kannan | Patients aged between 3 months and 12 years requiring IV maintenance fluid administration for at least 24 hrs
| Na < 130mEq/L, Na > 150mEq/L, blood glucose > 180 mg/dL, dehydration, shock, severe malnutrition, cirrhosis of liver, congestive heart failure, acute or chronic renal failure and nephrotic syndrome Patients receiving drugs that may alter plasma sodium levels Patients requiring fluid boluses for volume depletion and/or shock |
| Neville | Patients undergoing elective or emergency surgery, expected to take nothing by mouth after surgery for at least 8 hrs. Weight > 8kg | Significant blood loss expected during surgery Surgery types known to be associated with excess ADH secretion (cranial and thoracic surgery) Known abnormality of ADH secretion, nephrogenic diabetes insipidus, pituitary or hypothalamic disease, kidney disease, acute or chronic lung disease Patients receiving drugs known to stimulate ADH secretion |
| Rey | PICU patients requiring maintenance IV fluids
| Impairment in body water homeostasis (e.g. congestive heart failure) Electrolytic alterations requiring a different IV fluid than that in the study Renal function abnormalities Patients requiring fluid restriction |
| Choong | Euvolaemic patients within 6 hours after elective surgery if anticipated need for IV maintenance was > 24 hours
| Uncorrected plasma sodium level abnormalities before the end of surgery Patients with known abnormalities of ADH secretion Patients requiring volume resuscitation and/or vasoactive infusions Recent loop diuretic use Total parenteral nutrition required with 24 hours following surgery Patients for whom either a hypotonic or isotonic Isotonic fluid was considered necessary or contraindicated (e.g. because of a risk of cerebral oedema, acute burns or the risk of third space and/or sodium overload in patients with pre‐existing congestive cardiac failure, renal failure, liver failure or cirrhosis) |
| Saba | Patients requiring at least 8 hours of IV fluids
| Baseline Na of < 133 or > 145 mmol/L Patients with any of renal disease, cardiac dysfunction, pre‐existing hypertension, diuretic use, oedema, known adrenal dysfunction, acute or severe chronic neurological illness |
| Coulthard | Patients admitted to PICU following spinal instrumentation for correction of scoliosis, craniotomy for excision of brain tumours and cranial vault remodelling | Lengthening only of spinal instrumentation rods, insertion or revision of ventriculoperitoneal shunts, intracerebral cyst fenestration or previously enrolled |
| Cuello | Patients 6 months to 14 years old; with a serum sodium level between 125 mmol/L to 150 mmol/L; previously healthy, admitted to the emergency room or hospitalisation ward with any of 2 conditions: a) gastroenteritis with moderate dehydration and unable to drink fluids; b) children undergoing non‐urgent surgery and requiring maintenance IV hydration during their hospitalisation (i.e. non‐incarcerated hernia, adenotonsillectomies, tympanostomy, fracture reductions of the extremities, etc.) | Chronic illnesses (e.g. cystic fibrosis, cerebral palsy, etc.); taking antidiuretics; major trauma that required intensive care; hyper or hyponatraemia at admission; severe dehydration |
| ADH: antidiuretic hormone secretion | ||
| Outcome or subgroup title | No. of studies | No. of participants | Statistical method | Effect size |
| 1 Hyponatraemia Show forest plot | 10 | 970 | Risk Ratio (M‐H, Fixed, 95% CI) | 0.48 [0.38, 0.60] |
| 2 Hypernatraemia Show forest plot | 9 | 937 | Risk Ratio (M‐H, Fixed, 95% CI) | 1.24 [0.65, 2.38] |
| 3 Mean serum sodium T6‐T12 Show forest plot | 7 | 851 | Mean Difference (IV, Fixed, 95% CI) | 1.99 [1.55, 2.42] |
| 4 Mean serum sodium at T > T12 to T24 Show forest plot | 6 | 579 | Mean Difference (IV, Fixed, 95% CI) | 1.33 [0.81, 1.85] |
| 5 Death Show forest plot | 10 | 996 | Risk Ratio (M‐H, Fixed, 95% CI) | 5.59 [0.23, 135.17] |
| 6 Seizures Show forest plot | 10 | 996 | Risk Ratio (M‐H, Fixed, 95% CI) | 0.62 [0.03, 15.02] |
| 7 Cerebral oedema Show forest plot | 9 | Risk Ratio (M‐H, Fixed, 95% CI) | Subtotals only | |
| 8 Overhydration Show forest plot | 5 | 615 | Risk Ratio (M‐H, Fixed, 95% CI) | 1.14 [0.46, 2.87] |
| 9 Urine osmolarity at T24 Show forest plot | 3 | 278 | Mean Difference (IV, Fixed, 95% CI) | 12.68 [‐34.20, 59.56] |
| 10 Urinary sodium concentration at T24 Show forest plot | 4 | 516 | Mean Difference (IV, Fixed, 95% CI) | 14.72 [9.02, 20.42] |
| 11 Hyponatraemia (by concentration of hypotonic fluid) Show forest plot | 9 | Risk Ratio (M‐H, Fixed, 95% CI) | Subtotals only | |
| 11.1 Isotonic versus moderately hypotonic fluid | 4 | 458 | Risk Ratio (M‐H, Fixed, 95% CI) | 0.48 [0.34, 0.67] |
| 11.2 Isotonic versus very hypotonic fluid | 5 | 409 | Risk Ratio (M‐H, Fixed, 95% CI) | 0.40 [0.27, 0.58] |
| 12 Hyponatraemia (surgical/medical) Show forest plot | 8 | Risk Ratio (M‐H, Fixed, 95% CI) | Subtotals only | |
| 12.1 Surgical patients | 7 | 529 | Risk Ratio (M‐H, Fixed, 95% CI) | 0.48 [0.36, 0.64] |
| 12.2 Medical patients | 4 | 279 | Risk Ratio (M‐H, Fixed, 95% CI) | 0.29 [0.16, 0.55] |
| 13 Hyponatraemia (by fluid rate) Show forest plot | 5 | Risk Ratio (M‐H, Fixed, 95% CI) | Subtotals only | |
| 13.1 Full maintenance | 5 | 459 | Risk Ratio (M‐H, Fixed, 95% CI) | 0.45 [0.33, 0.61] |
| 13.2 Restricted rate | 1 | 62 | Risk Ratio (M‐H, Fixed, 95% CI) | 0.45 [0.18, 1.16] |
| 14 Hyponatraemia (by age) Show forest plot | 8 | Risk Ratio (M‐H, Fixed, 95% CI) | Subtotals only | |
| 14.1 Age < 1 year | 7 | 100 | Risk Ratio (M‐H, Fixed, 95% CI) | 0.33 [0.12, 0.88] |
| 14.2 Age 1 to 5 years | 7 | 243 | Risk Ratio (M‐H, Fixed, 95% CI) | 0.33 [0.19, 0.57] |
| 14.3 Age > 5 years | 8 | 465 | Risk Ratio (M‐H, Fixed, 95% CI) | 0.51 [0.38, 0.69] |
| 15 Hyponatraemia (by severity of illness) Show forest plot | 9 | Risk Ratio (M‐H, Fixed, 95% CI) | Subtotals only | |
| 15.1 Intensive care patients | 5 | 443 | Risk Ratio (M‐H, Fixed, 95% CI) | 0.48 [0.37, 0.64] |
| 15.2 Non‐intensive care patients | 5 | 359 | Risk Ratio (M‐H, Fixed, 95% CI) | 0.45 [0.29, 0.68] |
| 16 Sensitivity analysis ‐ balanced fluid rates Show forest plot | 8 | 735 | Risk Ratio (M‐H, Fixed, 95% CI) | 0.45 [0.35, 0.58] |
| 17 Sensitivity analysis ‐ normonatraemic at baseline Show forest plot | 4 | 326 | Risk Ratio (M‐H, Fixed, 95% CI) | 0.49 [0.34, 0.71] |