Losigamone add‐on therapy for partial epilepsy
References
References to studies included in this review
References to studies excluded from this review
Additional references
References to other published versions of this review
Characteristics of studies
Characteristics of included studies [ordered by study ID]
Jump to:
| Methods | Double‐blind, placebo‐controlled, add‐on study Random allocation of patients was mentioned in the original article but without details; allocation concealment was not mentioned. We could not obtain additional information after correspondence with the authors ITT analysis: yes | |
| Participants | Setting: Germany 203 patients with partial epilepsy and had a stable co‐medication with no more than 3 AEDs Losigamone: 99 patients; F/M: 38/61; aged: 18 to 63 years; mean age: 36.1 years; disease duration: 23.5 years; mean seizure frequency: 8.77 seizures/28 days; number of other AEDs: 1 (28.7%), 2 (48.9%) or 3 (22.3%) Placebo: 104 patients; F/M: 46/58; aged: 19 to 74 years; mean age: 35.2 years; disease duration: 22.0 years; mean seizure frequency: 9.33 seizures/28 days; number of other AEDs: 1 (24.3%), 2 (55.3%) or 3 (20.4%) The baseline clinical characteristics were comparable between the 2 groups | |
| Interventions | The study lasted for 16 weeks and consisted of an 8‐week baseline phase and an 8‐week double‐blind treatment phase Losigamone: administered 750 mg/day in the first 2 days after randomization and then maintained at 1500 mg/day from the third day during double‐blind treatment phase Placebo: during double‐blind treatment phase | |
| Outcomes |
| |
| Notes | Of the 203 ITT population, 171 completed the study; 21 patients dropped out in the losigamone‐treated group, and 11 dropped out in the placebo group. The reasons for dropouts have been carefully recorded, adverse events were the main reason The study was sponsored by Dr. Willmar Schwabe GmbH & Co., Karlsruhe, Germany | |
| Risk of bias | ||
| Bias | Authors' judgement | Support for judgement |
| Random sequence generation (selection bias) | Unclear risk | No description |
| Allocation concealment (selection bias) | Unclear risk | No description |
| Blinding of participants and personnel (performance bias) | Low risk | Double blinded |
| Blinding of outcome assessment (detection bias) | Low risk | Double blinded, but no additional information has been provided |
| Incomplete outcome data (attrition bias) | High risk | The number of and the reasons for withdrawals were carefully reported but seem unbalanced across groups, the percentage of dropouts was 21.2% (21/99) in the losigamone group and 10.6% (11/104) in the placebo group; we classified the trial at a high risk of incomplete outcome data bias |
| Selective reporting (reporting bias) | Low risk | Favorable and unfavorable results were reported |
| Other bias | Low risk | Not identified |
| Methods | Multicenter, randomized, double‐blind, placebo‐controlled, add‐on study Random list generated using a random number generator‐based blocking method by a third party, who was not involved in the assignment, besides, all data collected were entered to a specified database that was not exposed until the study was finished Double blinded: the intervention drug and placebo were provided with identical appearance, shape, smell and taste ITT analysis: yes | |
| Participants | 264 patients aged 18 to 65 years with partial epilepsy who also had 1 to 3 AEDs Losigamone 1200 mg/day: 87 patients; F/M: 40/47; number of other AEDs: 1 (25.3%), 2 (55.2%) or 3 (19.5%) Losigamone 1500 mg/day: 92 patients; F/M: 29/63; number of other AEDs: 1 (29.3%), 2 (48.9%) or 3 (21.8%) Placebo: 85 patients; F/M: 39/46; number of other AEDs: 1 (23.5%), 2 (53.0%) or 3 (23.5%) The mean age of the study population was 35.7 years, the mean duration of the disease was 21 years and the mean seizure frequency per month before randomization was 9.2 seizures The baseline clinical characteristics were comparable across groups | |
| Interventions | The study lasted for 28 weeks and consisted of a 12‐week baseline period, a 12‐week double‐blind treatment phase and a 4‐week post‐treatment period for safety observations Group 1: losigamone 1200 mg/day add‐on treatment during double‐blind treatment phase Group 2: losigamone 1500 mg/day add‐on treatment during double‐blind treatment phase Group 3: placebo during double‐blind treatment phase | |
| Outcomes |
| |
| Notes | Of the 264 ITT population, 228 patients completed the study, 11 were withdrawn in losigamone 1200 mg/day group, 19 in losigamone 1500 mg/day group, 6 in placebo group, while 28 (77.8%) of the withdrawals were due to adverse events The number of patients dropped out due to adverse events in the losigamone 1200 mg/day, 1500 mg/day and placebo groups were 10, 15 and 3, respectively The study was sponsored by Dr. Willmar Schwabe GmbH & Co., Karlsruhe, Germany | |
| Risk of bias | ||
| Bias | Authors' judgement | Support for judgement |
| Random sequence generation (selection bias) | Low risk | Random list generated using random permuted blocks |
| Allocation concealment (selection bias) | Low risk | Allocation sequence was conducted by a third party |
| Blinding of participants and personnel (performance bias) | Low risk | Double blinded |
| Blinding of outcome assessment (detection bias) | Low risk | Double blinded, but no additional information has been provided |
| Incomplete outcome data (attrition bias) | High risk | The number of and the reasons for withdrawals were carefully reported but seems unbalanced across groups; the percentage of dropouts in losigamone 1200 mg/day was 12.6% (11/87), losigamone 1500 mg/day was 20.7% (19/92) and 7.1% (6/85) in the placebo group; we classified the trial at a high risk of incomplete outcome data bias |
| Selective reporting (reporting bias) | Low risk | Favorable and unfavorable results were reported |
| Other bias | Low risk | Not identified |
AEDs: antiepileptic drugs
F/M: female/male
ITT: intention‐to‐treat
Characteristics of excluded studies [ordered by study ID]
Jump to:
| Study | Reason for exclusion |
| A preliminary observational study without a control group | |
| Open‐label study without a control group | |
| A randomized controlled trial assessed losigamone monotherapy in 16 patients with pharmacoresistant partial seizures undergoing presurgical evaluation |
Data and analyses
| Outcome or subgroup title | No. of studies | No. of participants | Statistical method | Effect size |
| 1 All doses Show forest plot | 2 | 467 | Risk Ratio (M‐H, Fixed, 95% CI) | 1.76 [1.14, 2.72] |
| Analysis 1.1  Comparison 1 Losigamone versus placebo: 50% or greater reduction in seizure frequency, Outcome 1 All doses. | ||||
| 2 1500 mg/day Show forest plot | 2 | 380 | Risk Ratio (M‐H, Fixed, 95% CI) | 1.94 [1.25, 3.01] |
| Analysis 1.2  Comparison 1 Losigamone versus placebo: 50% or greater reduction in seizure frequency, Outcome 2 1500 mg/day. | ||||
| 3 1200 mg/day Show forest plot | 1 | 172 | Risk Ratio (M‐H, Fixed, 95% CI) | 1.47 [0.70, 3.08] |
| Analysis 1.3 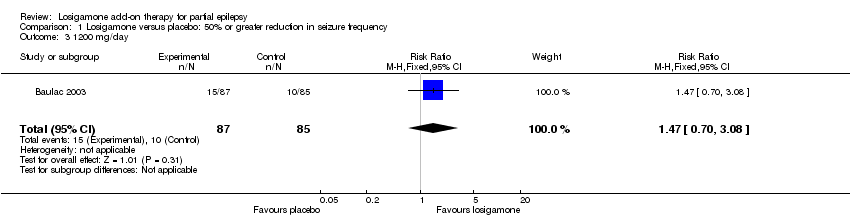 Comparison 1 Losigamone versus placebo: 50% or greater reduction in seizure frequency, Outcome 3 1200 mg/day. | ||||
| Outcome or subgroup title | No. of studies | No. of participants | Statistical method | Effect size |
| 1 All doses Show forest plot | 2 | 467 | Risk Ratio (M‐H, Fixed, 95% CI) | 2.16 [1.28, 3.67] |
| Analysis 2.1 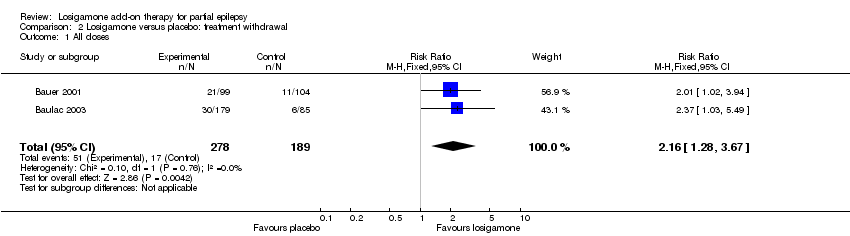 Comparison 2 Losigamone versus placebo: treatment withdrawal, Outcome 1 All doses. | ||||
| 2 1500 mg/day Show forest plot | 2 | 380 | Risk Ratio (M‐H, Fixed, 95% CI) | 2.34 [1.38, 3.99] |
| Analysis 2.2  Comparison 2 Losigamone versus placebo: treatment withdrawal, Outcome 2 1500 mg/day. | ||||
| 3 1200 mg/day Show forest plot | 1 | 172 | Risk Ratio (M‐H, Fixed, 95% CI) | 1.79 [0.69, 4.63] |
| Analysis 2.3  Comparison 2 Losigamone versus placebo: treatment withdrawal, Outcome 3 1200 mg/day. | ||||
| Outcome or subgroup title | No. of studies | No. of participants | Statistical method | Effect size |
| 1 The proportion of participants experiencing any adverse events (random model) Show forest plot | 2 | Risk Ratio (M‐H, Random, 95% CI) | Subtotals only | |
| Analysis 3.1 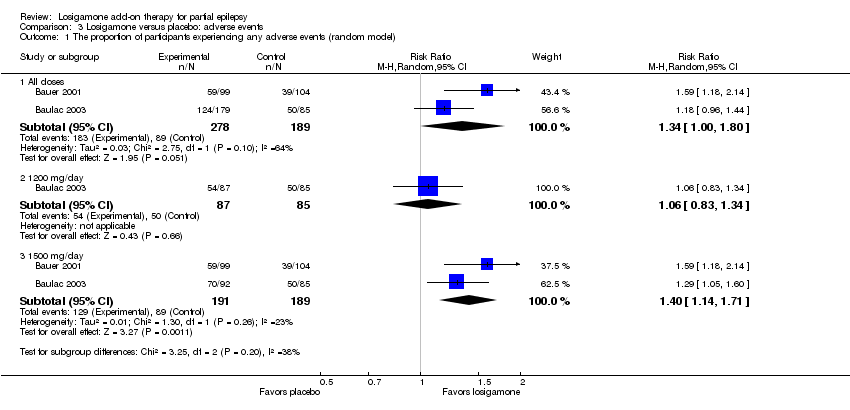 Comparison 3 Losigamone versus placebo: adverse events, Outcome 1 The proportion of participants experiencing any adverse events (random model). | ||||
| 1.1 All doses | 2 | 467 | Risk Ratio (M‐H, Random, 95% CI) | 1.34 [1.00, 1.80] |
| 1.2 1200 mg/day | 1 | 172 | Risk Ratio (M‐H, Random, 95% CI) | 1.06 [0.83, 1.34] |
| 1.3 1500 mg/day | 2 | 380 | Risk Ratio (M‐H, Random, 95% CI) | 1.40 [1.14, 1.71] |
| 2 The proportion of participants experiencing any adverse events (fixed model) Show forest plot | 2 | Risk Ratio (M‐H, Fixed, 95% CI) | Subtotals only | |
| Analysis 3.2  Comparison 3 Losigamone versus placebo: adverse events, Outcome 2 The proportion of participants experiencing any adverse events (fixed model). | ||||
| 2.1 All doses | 2 | 467 | Risk Ratio (M‐H, Fixed, 95% CI) | 1.33 [1.12, 1.57] |
| 3 Dizziness Show forest plot | 2 | Risk Ratio (M‐H, Fixed, 99% CI) | Subtotals only | |
| Analysis 3.3  Comparison 3 Losigamone versus placebo: adverse events, Outcome 3 Dizziness. | ||||
| 3.1 All doses | 2 | 467 | Risk Ratio (M‐H, Fixed, 99% CI) | 3.82 [1.69, 8.64] |
| 3.2 1200 mg/day | 1 | 172 | Risk Ratio (M‐H, Fixed, 99% CI) | 5.37 [0.77, 37.42] |
| 3.3 1500 mg/day | 2 | 380 | Risk Ratio (M‐H, Fixed, 99% CI) | 3.96 [1.79, 8.76] |
| 4 Headache Show forest plot | 1 | Risk Ratio (M‐H, Fixed, 99% CI) | Subtotals only | |
| Analysis 3.4  Comparison 3 Losigamone versus placebo: adverse events, Outcome 4 Headache. | ||||
| 4.1 All doses | 1 | 264 | Risk Ratio (M‐H, Fixed, 99% CI) | 1.19 [0.43, 3.30] |
| 4.2 1200 mg/day | 1 | 172 | Risk Ratio (M‐H, Fixed, 99% CI) | 0.85 [0.24, 3.06] |
| 4.3 1500 mg/day | 1 | 177 | Risk Ratio (M‐H, Fixed, 99% CI) | 1.50 [0.50, 4.47] |
| 5 Somnolence Show forest plot | 1 | Risk Ratio (M‐H, Fixed, 99% CI) | Subtotals only | |
| Analysis 3.5 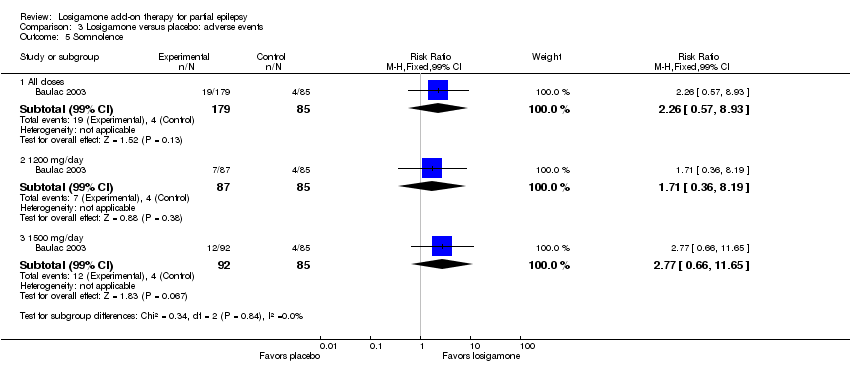 Comparison 3 Losigamone versus placebo: adverse events, Outcome 5 Somnolence. | ||||
| 5.1 All doses | 1 | 264 | Risk Ratio (M‐H, Fixed, 99% CI) | 2.26 [0.57, 8.93] |
| 5.2 1200 mg/day | 1 | 172 | Risk Ratio (M‐H, Fixed, 99% CI) | 1.71 [0.36, 8.19] |
| 5.3 1500 mg/day | 1 | 177 | Risk Ratio (M‐H, Fixed, 99% CI) | 2.77 [0.66, 11.65] |
| 6 Fatigue Show forest plot | 1 | Risk Ratio (M‐H, Fixed, 99% CI) | Subtotals only | |
| Analysis 3.6  Comparison 3 Losigamone versus placebo: adverse events, Outcome 6 Fatigue. | ||||
| 6.1 All doses | 1 | 264 | Risk Ratio (M‐H, Fixed, 99% CI) | 2.26 [0.57, 8.93] |
| 6.2 1200 mg/day | 1 | 172 | Risk Ratio (M‐H, Fixed, 99% CI) | 1.71 [0.36, 8.19] |
| 6.3 1500 mg/day | 1 | 177 | Risk Ratio (M‐H, Fixed, 99% CI) | 2.77 [0.66, 11.65] |
| 7 Ataxia Show forest plot | 1 | Risk Ratio (M‐H, Fixed, 99% CI) | Subtotals only | |
| Analysis 3.7  Comparison 3 Losigamone versus placebo: adverse events, Outcome 7 Ataxia. | ||||
| 7.1 All doses | 1 | 264 | Risk Ratio (M‐H, Fixed, 99% CI) | 10.03 [0.24, 411.20] |
| 7.2 1200 mg/day | 1 | 172 | Risk Ratio (M‐H, Fixed, 99% CI) | 10.75 [0.24, 473.22] |
| 7.3 1500 mg/day | 1 | 177 | Risk Ratio (M‐H, Fixed, 99% CI) | 10.17 [0.23, 448.02] |
| 8 Nausea Show forest plot | 1 | Risk Ratio (M‐H, Fixed, 99% CI) | Subtotals only | |
| Analysis 3.8  Comparison 3 Losigamone versus placebo: adverse events, Outcome 8 Nausea. | ||||
| 8.1 All doses | 1 | 264 | Risk Ratio (M‐H, Fixed, 99% CI) | 0.85 [0.21, 3.45] |
| 8.2 1200 mg/day | 1 | 172 | Risk Ratio (M‐H, Fixed, 99% CI) | 0.39 [0.05, 3.25] |
| 8.3 1500 mg/day | 1 | 177 | Risk Ratio (M‐H, Fixed, 99% CI) | 1.29 [0.30, 5.56] |
| 9 Diplopia Show forest plot | 1 | Risk Ratio (M‐H, Fixed, 99% CI) | Subtotals only | |
| Analysis 3.9 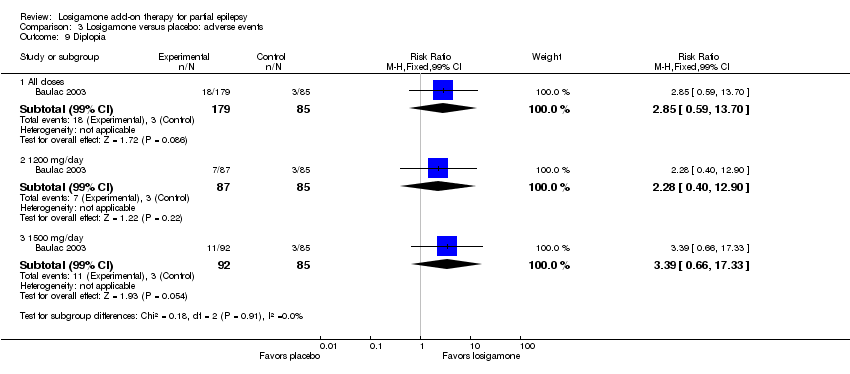 Comparison 3 Losigamone versus placebo: adverse events, Outcome 9 Diplopia. | ||||
| 9.1 All doses | 1 | 264 | Risk Ratio (M‐H, Fixed, 99% CI) | 2.85 [0.59, 13.70] |
| 9.2 1200 mg/day | 1 | 172 | Risk Ratio (M‐H, Fixed, 99% CI) | 2.28 [0.40, 12.90] |
| 9.3 1500 mg/day | 1 | 177 | Risk Ratio (M‐H, Fixed, 99% CI) | 3.39 [0.66, 17.33] |
| 10 Abnormal vision Show forest plot | 1 | Risk Ratio (M‐H, Fixed, 99% CI) | Subtotals only | |
| Analysis 3.10  Comparison 3 Losigamone versus placebo: adverse events, Outcome 10 Abnormal vision. | ||||
| 10.1 All doses | 1 | 264 | Risk Ratio (M‐H, Fixed, 99% CI) | 2.37 [0.48, 11.68] |
| 10.2 1200 mg/day | 1 | 172 | Risk Ratio (M‐H, Fixed, 99% CI) | 1.63 [0.26, 10.25] |
| 11 Vertigo Show forest plot | 1 | Risk Ratio (M‐H, Fixed, 99% CI) | Subtotals only | |
| Analysis 3.11  Comparison 3 Losigamone versus placebo: adverse events, Outcome 11 Vertigo. | ||||
| 11.1 All doses | 1 | 264 | Risk Ratio (M‐H, Fixed, 99% CI) | 6.17 [0.44, 87.50] |
| 11.2 1200 mg/day | 1 | 172 | Risk Ratio (M‐H, Fixed, 99% CI) | 5.86 [0.37, 92.10] |
| 11.3 1500 mg/day | 1 | 177 | Risk Ratio (M‐H, Fixed, 99% CI) | 6.47 [0.42, 98.79] |
| 12 Depression Show forest plot | 1 | Risk Ratio (M‐H, Fixed, 99% CI) | Subtotals only | |
| Analysis 3.12 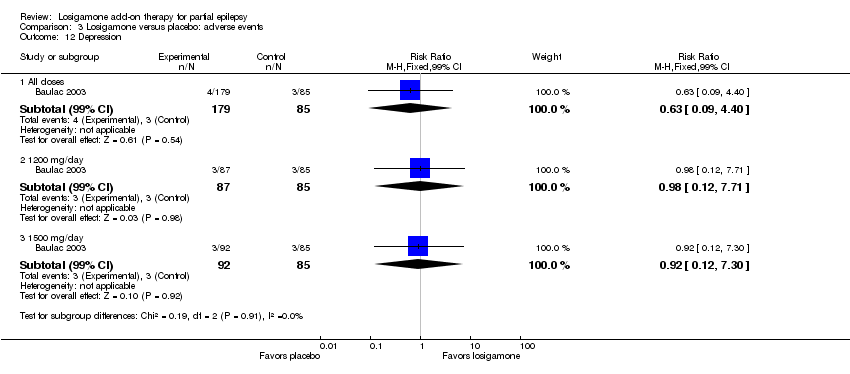 Comparison 3 Losigamone versus placebo: adverse events, Outcome 12 Depression. | ||||
| 12.1 All doses | 1 | 264 | Risk Ratio (M‐H, Fixed, 99% CI) | 0.63 [0.09, 4.40] |
| 12.2 1200 mg/day | 1 | 172 | Risk Ratio (M‐H, Fixed, 99% CI) | 0.98 [0.12, 7.71] |
| 12.3 1500 mg/day | 1 | 177 | Risk Ratio (M‐H, Fixed, 99% CI) | 0.92 [0.12, 7.30] |

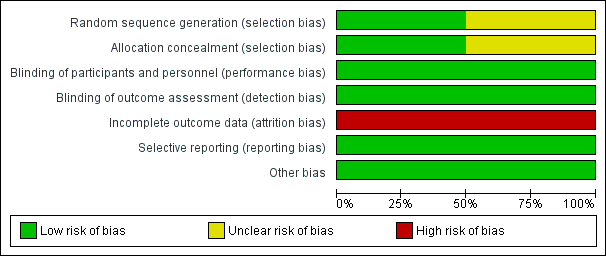
Risk of bias graph: review authors' judgments about each risk of bias item presented as percentages across all included studies.
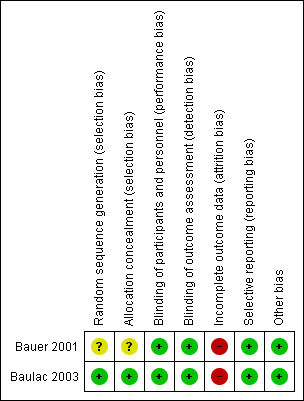
Risk of bias summary: review authors' judgments about each risk of bias item for each included study.
Comparison 1 Losigamone versus placebo: 50% or greater reduction in seizure frequency, Outcome 1 All doses.
Comparison 1 Losigamone versus placebo: 50% or greater reduction in seizure frequency, Outcome 2 1500 mg/day.
Comparison 1 Losigamone versus placebo: 50% or greater reduction in seizure frequency, Outcome 3 1200 mg/day.
Comparison 2 Losigamone versus placebo: treatment withdrawal, Outcome 1 All doses.
Comparison 2 Losigamone versus placebo: treatment withdrawal, Outcome 2 1500 mg/day.
Comparison 2 Losigamone versus placebo: treatment withdrawal, Outcome 3 1200 mg/day.
Comparison 3 Losigamone versus placebo: adverse events, Outcome 1 The proportion of participants experiencing any adverse events (random model).
Comparison 3 Losigamone versus placebo: adverse events, Outcome 2 The proportion of participants experiencing any adverse events (fixed model).
Comparison 3 Losigamone versus placebo: adverse events, Outcome 3 Dizziness.
Comparison 3 Losigamone versus placebo: adverse events, Outcome 4 Headache.
Comparison 3 Losigamone versus placebo: adverse events, Outcome 5 Somnolence.
Comparison 3 Losigamone versus placebo: adverse events, Outcome 6 Fatigue.
Comparison 3 Losigamone versus placebo: adverse events, Outcome 7 Ataxia.
Comparison 3 Losigamone versus placebo: adverse events, Outcome 8 Nausea.
Comparison 3 Losigamone versus placebo: adverse events, Outcome 9 Diplopia.
Comparison 3 Losigamone versus placebo: adverse events, Outcome 10 Abnormal vision.
Comparison 3 Losigamone versus placebo: adverse events, Outcome 11 Vertigo.
Comparison 3 Losigamone versus placebo: adverse events, Outcome 12 Depression.
| Losigamone compared to placebo for partial epilepsy | |||||
| Patient or population: partial epilepsy | |||||
| Outcomes | Illustrative comparative risks* (95% CI) | Relative effect | No of Participants | Quality of the evidence | |
| Assumed risk | Corresponding risk | ||||
| Placebo | Losigamone | ||||
| 50% or greater reduction in seizure frequency | Study population | RR 1.76 | 467 | ⊕⊕⊕⊝ | |
| 132 per 1000 | 233 per 1000 | ||||
| Moderate | |||||
| 131 per 1000 | 231 per 1000 | ||||
| Treatment withdrawal | Study population | RR 2.16 | 467 | ⊕⊕⊕⊝ | |
| 90 per 1000 | 194 per 1000 | ||||
| Moderate | |||||
| 88 per 1000 | 190 per 1000 | ||||
| The proportion of participants experiencing any adverse events | Study population | RR 1.34 | 467 | ⊕⊕⊕⊝ | |
| 471 per 1000 | 631 per 1000 | ||||
| Moderate | |||||
| 482 per 1000 | 646 per 1000 | ||||
| Adverse event (dizziness) | Study population | RR 3.82 | 467 | ⊕⊕⊕⊝ | |
| 63 per 1000 | 243 per 1000 | ||||
| Moderate | |||||
| 60 per 1000 | 229 per 1000 | ||||
| *The basis for the assumed risk (e.g. the median control group risk across studies) is provided in footnotes. The corresponding risk (and its 95% confidence interval) is based on the assumed risk in the comparison group and the relative effect of the intervention (and its 95% CI). | |||||
| GRADE Working Group grades of evidence | |||||
| 1 One of the two included trials did not describe the method used to generate the random list and did not mention allocation concealment | |||||
| Study ID | Review's primary outcomes | Review's secondary outcomes | Other study outcomes | |||
| 50% or greater reduction in seizure frequency | Seizure freedom | Treatment withdrawal | Adverse events | Change in seizure frequency | The percentage reduction in seizure frequency | |
| √ | × | √ | √ | √ | × | |
| √ | × | √ | √ | × | √ | |
| √Full reporting of outcomes for treatment comparison × No reporting of outcomes for treatment comparison | ||||||
| Outcome or subgroup title | No. of studies | No. of participants | Statistical method | Effect size |
| 1 All doses Show forest plot | 2 | 467 | Risk Ratio (M‐H, Fixed, 95% CI) | 1.76 [1.14, 2.72] |
| 2 1500 mg/day Show forest plot | 2 | 380 | Risk Ratio (M‐H, Fixed, 95% CI) | 1.94 [1.25, 3.01] |
| 3 1200 mg/day Show forest plot | 1 | 172 | Risk Ratio (M‐H, Fixed, 95% CI) | 1.47 [0.70, 3.08] |
| Outcome or subgroup title | No. of studies | No. of participants | Statistical method | Effect size |
| 1 All doses Show forest plot | 2 | 467 | Risk Ratio (M‐H, Fixed, 95% CI) | 2.16 [1.28, 3.67] |
| 2 1500 mg/day Show forest plot | 2 | 380 | Risk Ratio (M‐H, Fixed, 95% CI) | 2.34 [1.38, 3.99] |
| 3 1200 mg/day Show forest plot | 1 | 172 | Risk Ratio (M‐H, Fixed, 95% CI) | 1.79 [0.69, 4.63] |
| Outcome or subgroup title | No. of studies | No. of participants | Statistical method | Effect size |
| 1 The proportion of participants experiencing any adverse events (random model) Show forest plot | 2 | Risk Ratio (M‐H, Random, 95% CI) | Subtotals only | |
| 1.1 All doses | 2 | 467 | Risk Ratio (M‐H, Random, 95% CI) | 1.34 [1.00, 1.80] |
| 1.2 1200 mg/day | 1 | 172 | Risk Ratio (M‐H, Random, 95% CI) | 1.06 [0.83, 1.34] |
| 1.3 1500 mg/day | 2 | 380 | Risk Ratio (M‐H, Random, 95% CI) | 1.40 [1.14, 1.71] |
| 2 The proportion of participants experiencing any adverse events (fixed model) Show forest plot | 2 | Risk Ratio (M‐H, Fixed, 95% CI) | Subtotals only | |
| 2.1 All doses | 2 | 467 | Risk Ratio (M‐H, Fixed, 95% CI) | 1.33 [1.12, 1.57] |
| 3 Dizziness Show forest plot | 2 | Risk Ratio (M‐H, Fixed, 99% CI) | Subtotals only | |
| 3.1 All doses | 2 | 467 | Risk Ratio (M‐H, Fixed, 99% CI) | 3.82 [1.69, 8.64] |
| 3.2 1200 mg/day | 1 | 172 | Risk Ratio (M‐H, Fixed, 99% CI) | 5.37 [0.77, 37.42] |
| 3.3 1500 mg/day | 2 | 380 | Risk Ratio (M‐H, Fixed, 99% CI) | 3.96 [1.79, 8.76] |
| 4 Headache Show forest plot | 1 | Risk Ratio (M‐H, Fixed, 99% CI) | Subtotals only | |
| 4.1 All doses | 1 | 264 | Risk Ratio (M‐H, Fixed, 99% CI) | 1.19 [0.43, 3.30] |
| 4.2 1200 mg/day | 1 | 172 | Risk Ratio (M‐H, Fixed, 99% CI) | 0.85 [0.24, 3.06] |
| 4.3 1500 mg/day | 1 | 177 | Risk Ratio (M‐H, Fixed, 99% CI) | 1.50 [0.50, 4.47] |
| 5 Somnolence Show forest plot | 1 | Risk Ratio (M‐H, Fixed, 99% CI) | Subtotals only | |
| 5.1 All doses | 1 | 264 | Risk Ratio (M‐H, Fixed, 99% CI) | 2.26 [0.57, 8.93] |
| 5.2 1200 mg/day | 1 | 172 | Risk Ratio (M‐H, Fixed, 99% CI) | 1.71 [0.36, 8.19] |
| 5.3 1500 mg/day | 1 | 177 | Risk Ratio (M‐H, Fixed, 99% CI) | 2.77 [0.66, 11.65] |
| 6 Fatigue Show forest plot | 1 | Risk Ratio (M‐H, Fixed, 99% CI) | Subtotals only | |
| 6.1 All doses | 1 | 264 | Risk Ratio (M‐H, Fixed, 99% CI) | 2.26 [0.57, 8.93] |
| 6.2 1200 mg/day | 1 | 172 | Risk Ratio (M‐H, Fixed, 99% CI) | 1.71 [0.36, 8.19] |
| 6.3 1500 mg/day | 1 | 177 | Risk Ratio (M‐H, Fixed, 99% CI) | 2.77 [0.66, 11.65] |
| 7 Ataxia Show forest plot | 1 | Risk Ratio (M‐H, Fixed, 99% CI) | Subtotals only | |
| 7.1 All doses | 1 | 264 | Risk Ratio (M‐H, Fixed, 99% CI) | 10.03 [0.24, 411.20] |
| 7.2 1200 mg/day | 1 | 172 | Risk Ratio (M‐H, Fixed, 99% CI) | 10.75 [0.24, 473.22] |
| 7.3 1500 mg/day | 1 | 177 | Risk Ratio (M‐H, Fixed, 99% CI) | 10.17 [0.23, 448.02] |
| 8 Nausea Show forest plot | 1 | Risk Ratio (M‐H, Fixed, 99% CI) | Subtotals only | |
| 8.1 All doses | 1 | 264 | Risk Ratio (M‐H, Fixed, 99% CI) | 0.85 [0.21, 3.45] |
| 8.2 1200 mg/day | 1 | 172 | Risk Ratio (M‐H, Fixed, 99% CI) | 0.39 [0.05, 3.25] |
| 8.3 1500 mg/day | 1 | 177 | Risk Ratio (M‐H, Fixed, 99% CI) | 1.29 [0.30, 5.56] |
| 9 Diplopia Show forest plot | 1 | Risk Ratio (M‐H, Fixed, 99% CI) | Subtotals only | |
| 9.1 All doses | 1 | 264 | Risk Ratio (M‐H, Fixed, 99% CI) | 2.85 [0.59, 13.70] |
| 9.2 1200 mg/day | 1 | 172 | Risk Ratio (M‐H, Fixed, 99% CI) | 2.28 [0.40, 12.90] |
| 9.3 1500 mg/day | 1 | 177 | Risk Ratio (M‐H, Fixed, 99% CI) | 3.39 [0.66, 17.33] |
| 10 Abnormal vision Show forest plot | 1 | Risk Ratio (M‐H, Fixed, 99% CI) | Subtotals only | |
| 10.1 All doses | 1 | 264 | Risk Ratio (M‐H, Fixed, 99% CI) | 2.37 [0.48, 11.68] |
| 10.2 1200 mg/day | 1 | 172 | Risk Ratio (M‐H, Fixed, 99% CI) | 1.63 [0.26, 10.25] |
| 11 Vertigo Show forest plot | 1 | Risk Ratio (M‐H, Fixed, 99% CI) | Subtotals only | |
| 11.1 All doses | 1 | 264 | Risk Ratio (M‐H, Fixed, 99% CI) | 6.17 [0.44, 87.50] |
| 11.2 1200 mg/day | 1 | 172 | Risk Ratio (M‐H, Fixed, 99% CI) | 5.86 [0.37, 92.10] |
| 11.3 1500 mg/day | 1 | 177 | Risk Ratio (M‐H, Fixed, 99% CI) | 6.47 [0.42, 98.79] |
| 12 Depression Show forest plot | 1 | Risk Ratio (M‐H, Fixed, 99% CI) | Subtotals only | |
| 12.1 All doses | 1 | 264 | Risk Ratio (M‐H, Fixed, 99% CI) | 0.63 [0.09, 4.40] |
| 12.2 1200 mg/day | 1 | 172 | Risk Ratio (M‐H, Fixed, 99% CI) | 0.98 [0.12, 7.71] |
| 12.3 1500 mg/day | 1 | 177 | Risk Ratio (M‐H, Fixed, 99% CI) | 0.92 [0.12, 7.30] |