Métodos para el pujo/expulsión utilizados durante el periodo expulsivo del trabajo de parto
References
References to studies included in this review
References to studies excluded from this review
References to ongoing studies
Additional references
References to other published versions of this review
Characteristics of studies
Characteristics of included studies [ordered by study ID]
Jump to:
| Methods | RCT | |
| Participants | Setting: trial conducted in the UK. Inclusion criteria: singleton vertex presentations, age 17 to 35 years old. Exclusion criteria: 4 previous deliveries, obstetric complications or indication for a short second stage and upon diagnosis of full cervical dilation a fetal scalp blood sample was obtained and if any patient with occult fetal acidosis (pH < 7.3; base excess > ‐6.0 mmol/L) was detected, the patient was excluded from the study. 42 women randomised. | |
| Interventions | “Pushing group”: commenced organised pushing immediately (19 women). “Delayed pushing group”: remained sitting or in the lateral position for up to 3 hours or until the vertex became visible and organised pushing commenced immediately (23 women). | |
| Outcomes | Length of second stage, length of pushing, mode of delivery vaginal, caesarean and forceps (rotational and non rotational). | |
| Notes | Trial funding not clear. | |
| Risk of bias | ||
| Bias | Authors' judgement | Support for judgement |
| Random sequence generation (selection bias) | Low risk | Computer‐derived random number series. |
| Allocation concealment (selection bias) | Unclear risk | There is no report about allocation concealment or when the randomisation was done. |
| Blinding of participants and personnel (performance bias) | High risk | No blinding. |
| Blinding of outcome assessment (detection bias) | Unclear risk | Not mentioned. |
| Incomplete outcome data (attrition bias) | Unclear risk | It does not show any fluxogram. It just says: "one women was withdrawn at the onset of 2 stage – occult fetal acidosis". |
| Selective reporting (reporting bias) | High risk | Most of the important outcomes are missing. |
| Other bias | Low risk | No other problems detected that could put the study at a risk of bias. |
| Methods | RCT | |
| Participants | Setting: trial conducted in Ireland. Inclusion criteria: primiparae, in either spontaneous or induced labour with a singleton fetus, cephalic presentation between 37 and 42 weeks of gestation and had effective epidural analgesia in situ Exclusion criteria: patients with diabetes, irritable bowel syndrome or other bowel or neurological disorder were excluded from the study. Or if after randomisation the vertex was visible at the introitus. 178 women randomised. | |
| Interventions | “Immediate pushing”: pushing right after full dilatation (90 women). “Delayed pushing”: 60 min delay (88 women). | |
| Outcomes | Length of second stage, length of pushing episiotomy, perineal laceration second degree and third degree, mode of delivery vaginal, caesarean and forceps, dyspareunia at 3 months postpartum, fecal incontinence. | |
| Notes | Labours were managed according to the Active Management protocol, which included early amniotomy and subsequent augmentation with intravenous oxytocin if cervical dilation did not progress at 1 cm per hour. It was stated that the study "was supported by a grant from the Irish Research Board". | |
| Risk of bias | ||
| Bias | Authors' judgement | Support for judgement |
| Random sequence generation (selection bias) | Low risk | Numbered opaque sealed envelopes containing computer‐generated random allocations in a ratio of 1:1 in balanced blocks of 10. |
| Allocation concealment (selection bias) | Low risk | Upon a diagnosis of full dilation sealed envelopes were opened and the patient was randomised by the attending midwife. |
| Blinding of participants and personnel (performance bias) | High risk | No blinding of participants and key study personnel. |
| Blinding of outcome assessment (detection bias) | Low risk | All the clinical staff who measured the outcomes were blinded to the patient's history. |
| Incomplete outcome data (attrition bias) | Low risk | 1412 approached antenatal. 1030 consented (73%). 650 had epidural. 178 randomised (27%). 90 immediate pushing. 88 delayed pushing. Follow‐up (3 months). 90 immediate pushing. 88 delayed pushing. |
| Selective reporting (reporting bias) | High risk | More than 1 outcome of interest in the review was reported incompletely so that they could not be entered in the meta‐analyses. |
| Other bias | Low risk | No other problems detected that could put the study at a risk of bias. |
| Methods | RCT | |
| Participants | Setting: trial conducted in Canada. Inclusion criteria: nulliparous, ≥ 37 weeks' gestation (≥ 259 days' gestation), single fetus with cephalic presentation, spontaneous or induced labour with normal fetal heart status and effective epidural analgesia (pain < 3 cm on a 10 cm VAS) with a standardised continuous‐infusion technique. Exclusion criteria: if women were already pushing spontaneously, if they had fever with a temperature > 38° C, if the pregnancy was complicated by hypertension, a recent haemorrhage, suspicion of fetal malformation, or intrauterine growth restriction, or if any condition was present that necessitated shortening of the second stage of labour. 1862 women randomised. | |
| Interventions | “Early pushing group”: was encouraged to commence pushing immediately (926 women). “Delayed pushing group”: was advised to avoid voluntary expulsive efforts for 2 hours unless: 1 ‐ she felt an irresistible urge to push, 2 ‐ the fetal head was visualised during the course of routine (every 15 mins) inspection of the perineum or 3 ‐ a medical indication to shorten the second stage of labour developed (936 women). | |
| Outcomes | Length of second stage, length of pushing, admission to NICU, mode of delivery vaginal and caesarean. Intrapartum care costs, postnatal care costs and total costs. | |
| Notes | 1 report (Le Ray 2008) did not contribute to the analysis because it was a secondary analysis considering the data from both groups together. It was stated that the work was supported by the Medical Research Council of Canada (who provided salary support for 1 of the trial authors). AstraZeneca R&D Montreal (Montreal, Quebec, Canada) provided medication and salary support for a research fellow (one of the trial authors). | |
| Risk of bias | ||
| Bias | Authors' judgement | Support for judgement |
| Random sequence generation (selection bias) | Unclear risk | Randomisation was centralised and stratified according to centre and to the use of oxytocin during the first stage of labour. There is no description of the random sequence generation. This was done when the women were full dilated. |
| Allocation concealment (selection bias) | Low risk | Randomisation was centralised. |
| Blinding of participants and personnel (performance bias) | High risk | No blinding of participants. |
| Blinding of outcome assessment (detection bias) | Unclear risk | Not mentioned. |
| Incomplete outcome data (attrition bias) | Low risk | Intention‐to‐treat analysis. |
| Selective reporting (reporting bias) | High risk | Incomplete outcomes to enter in the meta‐analysis. |
| Other bias | Low risk | No other problems detected that could put the study at a risk of bias. |
| Methods | RCT | |
| Participants | Setting: trial conducted in the USA. Inclusion criteria: nulliparous women, with continuous standard dose, lumbar epidurals who reached the 2nd stage of labour. Age > 16 years; viable vertex singleton fetus, and fetal age >= 36 weeks, Exclusion criteria: scheduled caesarean delivery, administration of magnesium sulphate therapy, and/or maternal cardiac condition. Maternal weight >= 275 pounds was an additional exclusion criterion. 77 women randomised. | |
| Interventions | Immediate pushing: began pushing within 15 mins of the time the cervix was determined to be completely dilated. Instruction was to bear down 3 to 4 times with each contraction, but was not limited (39 women). Delayed pushing: delayed the onset of pushing for 2 hours or until the patient experienced an irresistible urge to push or spontaneous delivery was imminent (38 women). | |
| Outcomes | Length of second stage, length of pushing, episiotomy, laceration first, second, third and fourth degree, mode of delivery vaginal, caesarean and forceps. | |
| Notes | Funding sources not stated. Authors report no conflict of interest. | |
| Risk of bias | ||
| Bias | Authors' judgement | Support for judgement |
| Random sequence generation (selection bias) | Low risk | Computer‐generated randomisation scheme. |
| Allocation concealment (selection bias) | Unclear risk | Randomisation at full dilation but methods for allocation concealment were not mentioned. |
| Blinding of participants and personnel (performance bias) | High risk | No blinding of participants. |
| Blinding of outcome assessment (detection bias) | Unclear risk | Not mentioned. |
| Incomplete outcome data (attrition bias) | Low risk | 85 consented. 8 were excluded. 77 were randomised. Intention‐to‐treat analysis. |
| Selective reporting (reporting bias) | High risk | Incomplete outcomes to enter in the meta‐analysis. |
| Other bias | Low risk | No other problems detected that could put the study at a risk of bias. |
| Methods | RCT | |
| Participants | Setting: trial conducted in the UK. Inclusion criteria: normal primagravidae 158 cm or more in height. Exclusion criteria: those with inadequate epidurals or complications such as fetal distress were excluded from allocation. 37 women randomised. | |
| Interventions | “Control group”: made expulsive effort without delay and no increase was made in the rate of oxytocin infusion (16 women). “Treatment group”: treated patients lay on their sides without making expulsive efforts. The rate of oxytocin infusion was increased by 4 miliunits per min every 4 mins in the absence of excessive uterine activity to a maximum of 32 mu/mi. When the fetal head became visible or an hour had elapsed expulsive efforts were encouraged (21 women). | |
| Outcomes | Mode of delivery vaginal, caesarean and forceps. | |
| Notes | Funding sources not specified. | |
| Risk of bias | ||
| Bias | Authors' judgement | Support for judgement |
| Random sequence generation (selection bias) | Unclear risk | At the onset of full dilation patients were allocated randomly to treatment or control groups. |
| Allocation concealment (selection bias) | Unclear risk | Not mentioned. |
| Blinding of participants and personnel (performance bias) | High risk | No blinding of participants. |
| Blinding of outcome assessment (detection bias) | Unclear risk | Not mentioned. |
| Incomplete outcome data (attrition bias) | Unclear risk | Not mentioned. |
| Selective reporting (reporting bias) | High risk | Missing most of the important outcomes and the study fails to include result from 1 of the key outcomes (length of second stage). |
| Other bias | Low risk | No other problems detected that could put the study at a risk of bias. |
| Methods | RCT | |
| Participants | Setting: trial conducted in the USA. Inclusion criteria: primigravid and multigravid. Exclusion criteria: refused an epidural, first epidural dose after complete dilation, known fetal anomaly, multiple gestation, nonvertex presentation, gestational age less than 37 weeks or over 42 weeks, and pregnancy complicated by pregnancy‐induced hypertension, heart disease, or insulin‐dependent diabetes. 312 women randomised, data available for 252. | |
| Interventions | “Passive fetal descent”: began a period of rest and descend at the time of complete dilatation and continued until the head was seen at the introitus or after 120 mins in primigravidas or 60 mins in multigravidas. These women were encouraged not to push. The introitus was examined in this manner every 30 mins or sooner if signs of imminent delivery occurred (130 women included in the analysis (not clear how many randomised)). “Active pushing”: both the primigravidas and multigravidas in the control group were encouraged to begin pushing as soon as they were found to be completely dilated (122 women included in the analysis (not clear how many randomised)). In both control and experimental group pushing consisted of coached Valsalva Maneuver direct by the nurse or physician during contractions. | |
| Outcomes | Length of second stage, length of pushing, mode of delivery forceps. | |
| Notes | Reported to be funded by the Deseret Foundation. | |
| Risk of bias | ||
| Bias | Authors' judgement | Support for judgement |
| Random sequence generation (selection bias) | Low risk | Computer–generated randomised list. |
| Allocation concealment (selection bias) | Unclear risk | Methods for allocation concealment and the onset of the randomisation are not reported. |
| Blinding of participants and personnel (performance bias) | High risk | No blinding of the participants. |
| Blinding of outcome assessment (detection bias) | Unclear risk | Not mentioned. |
| Incomplete outcome data (attrition bias) | High risk | Initial enrolment: 312. Completed the study: 252. Lost: 60. |
| Selective reporting (reporting bias) | High risk | Incomplete outcomes to enter in the meta‐analysis. |
| Other bias | Low risk | No other problems detected that could put the study at a risk of bias. |
| Methods | RCT | |
| Participants | Setting: trial conducted in Iran. Inclusion criteria: low‐risk pregnancies with singleton fetus with estimated birthweight of 2500 g to 4000 g, vertex presentation, gestational age between 37 and 42 weeks, parity between 1 and 5, maternal age: 18‐40 years. Exclusion criteria: did not wish to participate, had maternal medical or obstetric complications which would affect the management of the second stage of labour, had a baby with congenital anomalies or when fetal compromise was suspected. 258 women randomised. | |
| Interventions | Directed pushing group: women were coached by the midwife to use closed‐glottis pushing 3 to 4 times during each contraction immediately when cervical dilation reached 10 cm and a fetal head plus 1 and to continue pushing using this method with each contraction until birth. The breath was held for 10 seconds. They were limited to bed in supine position (130 women). Physiological pushing group: women commenced pushing only when they felt urge to do so and no specific instructions about the timing and duration of pushing was given. They used upright position including: standing, sitting, and squatting (128 women). In both groups if delivery was not imminent after 120 mins for primiparous and 60 mins for multiparous, the method used was whatever clinical management deemed necessary to facilitate birth. Both groups delivered in a birthing chair in a sitting position. | |
| Outcomes | Duration of second stage, mode of birth, Apgar scores. | |
| Notes | Funded by the Islamic Azad University, Tehran Medical Branch and Tehran University of Medical Sciences. | |
| Risk of bias | ||
| Bias | Authors' judgement | Support for judgement |
| Random sequence generation (selection bias) | Unclear risk | Randomisation occurred upon confirmation of full dilatation of the cervix by block randomisation from a set of 10 envelopes. Does not mention how the sequence generation was done. |
| Allocation concealment (selection bias) | Unclear risk | Not mentioned. |
| Blinding of participants and personnel (performance bias) | High risk | No blinding. |
| Blinding of outcome assessment (detection bias) | Unclear risk | Not mentioned. |
| Incomplete outcome data (attrition bias) | Unclear risk | There is no report on missing and drops. |
| Selective reporting (reporting bias) | High risk | Important outcomes are missing and incomplete results to put in meta‐analysis. |
| Other bias | Low risk | No other problems detected that could put the study at a risk of bias. |
| Methods | RCT | |
| Participants | Setting: trial conducted in the USA. Inclusion criteria: spontaneous, elective or medically‐indicated labour induction; reassuring fetal heart rate at enrolment in study, fetal gestational age >= 38 weeks, maternal age 18 to 40 years, and pain scores of <= 3 with a numeric pain scale from 0 to 10. Exclusion criteria: first epidural dose after complete dilation, known fetal anomaly before birth, multiple gestation, non‐vertex presentation, maternal heart disease, administration of magnesium sulphate and poor comprehension of English. 59 women randomised (44 analysed). | |
| Interventions | “Immediate pushing”: after dilation of 10 cm was reached, the VAS was completed and women were then directed to begin pushing. Women were instructed to push 3 to 4 times during each contraction by bearing down in a manner similar to the bearing‐down effort used to have a bowel movement. No provider counting during pushing occurred. Both open and closed glottis methods were used, depending on participant's preference and effectiveness of pushing effort as determined by progressive fetal decent (33 women (28 included in analysis). “Delayed pushing”: after dilation of 10 cm was reached, the VAS was completed and women randomised were told to rest for 90 mins or until they felt an uncontrollable urge to push (whichever came first) before they began pushing. Instructions for pushing were provided in the same manner as for the immediate pushing group (26 women (16 included in the analysis). | |
| Outcomes | Length of second stage, length of pushing perineal laceration third degree and fourth degree, mode of delivery vaginal and caesarean. | |
| Notes | Authors report "no financial relationships related to this article". | |
| Risk of bias | ||
| Bias | Authors' judgement | Support for judgement |
| Random sequence generation (selection bias) | Low risk | Randomly assigned by a computerised random‐number generator to 1 of 2 groups before complete dilation. |
| Allocation concealment (selection bias) | Unclear risk | Not mentioned. |
| Blinding of participants and personnel (performance bias) | High risk | No blinding of participants. |
| Blinding of outcome assessment (detection bias) | High risk | Other variables (length of second stage, length of pushing, spontaneous birth, perineal trauma, fetal Apgar) were obtained form existing medical records by unblinded investigators. |
| Incomplete outcome data (attrition bias) | Low risk | 59 consented and randomised. Immediate 33. Delayed 26. 4 exclusion (immediate) ‐ 28. 10 exclusion (delayed) ‐ 16. Intention‐to‐treat analysis. |
| Selective reporting (reporting bias) | High risk | Incomplete results to enter in the meta‐analysis. |
| Other bias | Low risk | No other problems detected that could put the study at a risk of bias. |
| Methods | RCT | |
| Participants | Setting: trial conducted in the USA. Inclusion criteria: primigravidas between 20 and 30 years, 37‐42 weeks' gestation, who had attended a prepared childbirth program. Exclusion criteria: not mentioned. Not clear how many women were randomised; 94 women recruited, 27 included in the analysis. | |
| Interventions | “Breath in holding pushing”: take 2 deep breaths with the onset of each contraction; inhale deeply once more, let out a small amount of air, hold breath, close mouth; raise head, round shoulders, bring chin forward, place hands underneath knees letting legs abduct and relax, keep elbows out and bear down forcefully, consciously tightening the abdominal muscles; while pushing keep pelvis tilted and concentrate on relaxing pelvic floor and leg muscles; push as long and as hard as you can (about 10‐15 seconds); when you can no longer hold your breath, release your breath, inhale again, and repeat technique as long as contraction continues. At the end of the contractions, take 2 deep breaths and relax (10 women included in the analysis). “Exhalation pushing”: with the onset of each contraction begin to take normal, relaxing breaths. Continue until an urge to push is felt. At this point take a normal breath, hold it for a few seconds (2‐3), assume pelvic tilt position, bend head to chest; as you slowly exhale through pursed lips consciously pull in abdominal muscles. Direct effort through area where pressure is felt, usually rectum; continue to exhale slowly in a controlled manner with a crescent effect, increasing the volume exhaled gradually. Practice exhaling into fist as if blowing a trumpet. During this time continue to assume pelvic tilt position, contract abdominal muscles, and relax pelvic floor muscles ‐ keep chin forward and jaw relaxed. At the end of exhalation, quickly inhale, and repeat previous pattern as long as an urge to push is felt. At the end of contraction, take 2 normal breaths, relax (17 women included in the analysis). | |
| Outcomes | Length of second stage (incomplete). | |
| Notes | Sources of funding not clear. | |
| Risk of bias | ||
| Bias | Authors' judgement | Support for judgement |
| Random sequence generation (selection bias) | Unclear risk | "subjects were randomly divided into two groups". |
| Allocation concealment (selection bias) | Unclear risk | Allocation concealment and the onset of the randomisation process were not reported. |
| Blinding of participants and personnel (performance bias) | High risk | No Blinding of participants. |
| Blinding of outcome assessment (detection bias) | Unclear risk | Not mentioned. |
| Incomplete outcome data (attrition bias) | High risk | 94 recruited. 67 dropped*. 27 stayed. 10 control group. 17 intervention group. |
| Selective reporting (reporting bias) | High risk | Important outcomes are missing and incomplete results. |
| Other bias | Low risk | No other problems detected that could put the study at a risk of bias. |
| Methods | RCT | |
| Participants | Setting: trial conducted in Hong Kong. 396 nulliparous women were enrolled into this study. 73 women completed the study randomly allocated to either the directed pushing group (n = 38) or spontaneous pushing group (n = 35). Inclusion criteria: nulliparous women aged 18‐40 years with a healthy singleton baby (cephalic presentation), at full term, planned vaginal birth and be able to read Chinese or English. Labour could be spontaneous, or induced as a result of either premature rupture of membranes or post dates pregnancy. Exclusion criteria: not wishing to participate, already in established labour, epidural analgesia, maternal complications (medical or obstetric) which could potentially affect management of labour during the second stage. Suspected fetal compromise or having a baby with congenital anomalies. | |
| Interventions | “Directed pushing”: when it was confirmed that the cervix was fully dilated and the fetal head station was assessed as being plus 1 below the level of the ischial spines of the pelvis, the midwife suggested the woman commenced pushing using the directed pushing technique regardless of whether she felt an urge to push or not (38 women). “Spontaneous pushing”: when it was confirmed that the cervix was fully dilated and the fetal head station was assessed as being plus 1 below the level of the ischial spines of the pelvis, the midwife suggested the woman commenced pushing only when she felt the urge to do so and gave no specific instructions about the timing and duration of pushing (35 women). In both groups, if midwives or obstetricians were concerned about the maternal and/or fetal well‐being at any time, or delivery was not imminent after 60 mins (prolonged second stage of labour), the woman was reassessed to gauge maternal and fetal condition and adopt whatever clinical management was deemed necessary to facilitate a safe birth. | |
| Outcomes | Length of second stage, admission to NICU, spontaneous vaginal delivery. | |
| Notes | Funding source not stated. | |
| Risk of bias | ||
| Bias | Authors' judgement | Support for judgement |
| Random sequence generation (selection bias) | High risk | Randomisation upon full dilation of the cervix. The woman was asked to select 1 envelope from a set of 20. |
| Allocation concealment (selection bias) | Unclear risk | It is not clear who conducted the randomisation. |
| Blinding of participants and personnel (performance bias) | High risk | No blinding. |
| Blinding of outcome assessment (detection bias) | Unclear risk | Not mentioned. |
| Incomplete outcome data (attrition bias) | Unclear risk | "396 eligible nulliparous women consented to take part in the study... Among these, 97 chose epidural analgesia during the first stage of labour. Another 117 did not continue with the study at different stages. The major reasons for discontinuation included 51 who were admitted in active labour, 17 who had suspected fetal distress, moderate meconium‐stained liquor, or a non‐reassuring cardiotocography during the second stage of labour. Overall, 73 women successfully completed the four fatigue assessment forms." |
| Selective reporting (reporting bias) | High risk | There are incomplete results to put in meta‐analysis. |
| Other bias | Low risk | No other problems detected that could put the study at a risk of bias. |
| Methods | RCT | |
| Participants | Setting: trial conducted in the USA. Inclusion criteria: 18 years of age, no history of genitourinary pathology, continent during first 20 weeks of pregnancy by self‐report and continent at 20 weeks' gestation by negative standing stress test. First pregnancy. Exclusion criteria: ability to contract the pelvic floor muscles voluntarily as assessed by manual examination at 20 weeks' gestation. It was reported that 249 women were randomised (but data reported for only 145). | |
| Interventions | There were 4 groups: 1. Directed group or coached group using a closed glottis Valsalva Maneuver, which was routine care provided at the recruitment hospital (data for 39 women); 2. Spontaneous group with instruction provided prenatally via a standardised training video. This method included instructing the woman to follow her bodily sensations and push as she felt the urge. Directions given to the woman in any form regarding her pushing position, length of pushing or how to hold her breath were discouraged. Statements such as "you are so strong" or "good work" were considered supportive, not directive and were allowed (data for 32 women); 3. prenatal perineal massage initiated in the third trimester with a standardised training regarding its use and then directed pushing during second‐stage labour (data for 34 women); 4. combination of group 2 and 3 treatment, with spontaneous pushing plus perineal massage (data for 40 women). | |
| Outcomes | Second stage length, delivery method (vaginal and caesarean section). | |
| Notes | This study resulted in another report: a secondary analysis 1‐year follow‐up to assess the fecal incontinence, but this report did not contribute to the analysis because this secondary analysis did not distinguish between the groups. The authors reported no conflict of interest. Reported funding from the Natinal Institute of Nursing Research. | |
| Risk of bias | ||
| Bias | Authors' judgement | Support for judgement |
| Random sequence generation (selection bias) | Low risk | Computer‐generated table. |
| Allocation concealment (selection bias) | Unclear risk | Allocation concealment not described. |
| Blinding of participants and personnel (performance bias) | High risk | The provider was informed of group assignment of the woman upon admission to labour. The participants were not blinded to the group assignment. |
| Blinding of outcome assessment (detection bias) | Low risk | Collection of self‐reports was blinded to the group assignment. |
| Incomplete outcome data (attrition bias) | High risk | 41% for the follow‐up of 12 months. |
| Selective reporting (reporting bias) | High risk | The purpose of the trial was to test the effect of spontaneous pushing (either with or without prenatal perineal massage) compared to direct pushing on incontinence outcomes in women evaluated 1 year after their first birth. Birth data (including perineal lacerations and episiotomy) were reported for the study population overall but data were not reported by treatment group. A table reporting 'obstetric characteristics by treatment condition' is restricted to the following outcomes: epidural; second stage length; delivery method (vaginal/caesarean section). |
| Other bias | Low risk | No other problems detected that could put the study at a risk of bias. |
| Methods | Quasi‐randomised trial. | |
| Participants | Setting: trial conducted in UK. Inclusion criteria: at or beyond 37 weeks' gestation and singleton cephalic presentations. Exclusion criteria: no major obstetric complications. 76 women randomised. | |
| Interventions | “Early pushing group”: once full dilation of the cervix had been reached they were encouraged to push as soon as they had the desire (40 women). “Delayed pushing group”: continued to lie on their side and if they had the desire to bear down and the head was not visible on parting the labia, 1 epidural top‐up was allowed. Every 15 mins the vulva was inspected to see whether the head was visible. If, after 2 hours, the head was not visible, the labia were parted and a visual assessment of the level of the head was made. If at 2 subsequent 15 min‐inspections there appeared to be no further descent the patient was encouraged to push as soon as she had the desire (36 women). Pushing was managed in the routine labour ward manner. | |
| Outcomes | Length of second stage, length of pushing, 5‐min Apgar score, mode of delivery vaginal, caesarean and forceps (straight and rotational). | |
| Notes | Funding source not specified. | |
| Risk of bias | ||
| Bias | Authors' judgement | Support for judgement |
| Random sequence generation (selection bias) | High risk | Quasi‐randomised. According to the last digit of their hospital number: even numbers to group 1 (early pushing) and odd numbers to group 2 (late pushing). |
| Allocation concealment (selection bias) | High risk | No allocation concealment. |
| Blinding of participants and personnel (performance bias) | High risk | No blinding of participants. |
| Blinding of outcome assessment (detection bias) | Unclear risk | Not mentioned. |
| Incomplete outcome data (attrition bias) | Unclear risk | Not mentioned. |
| Selective reporting (reporting bias) | High risk | Incomplete results to be entered in the meta‐analysis. |
| Other bias | Low risk | No other problems detected that could put the study at a risk of bias. |
| Methods | RCT | |
| Participants | Setting: trial conducted in the USA. Inclusion criteria: nulliparous women, English speaking, with healthy, singleton, and full‐term pregnancies. Exclusion criteria: evidence of fetal complications. 153 women randomised. | |
| Interventions | “Non‐delayed pushing group”: commencement of pushing efforts immediately following confirmation of full cervical dilation, regardless of the presence or lack of bearing‐down pressures experienced (72 women). “Delayed pushing group”: commencement of directed pushing efforts (following confirmation of full cervical dilation by the attending labour and delivery nurse, either after 1‐hour rest period or in the presence of involuntary pressure accompanied by the urge to bear down (81 women). Type of pushing: breath holding no longer than 6‐8 seconds, with a documented adequate contraction pattern (minimum of 3 to a maximum of 5 uterine contractions in 10‐min period or a Montevideo score of 95 to 395 mmHg; average of 200 to 250 mmHg) if and change bed positions at least every 20 to 30 mins. | |
| Outcomes | Length of second stage, perineal laceration third degree, mode of delivery vaginal, caesarean and instrumental. | |
| Notes | Reported to be funded by A School of Nursing Grant. | |
| Risk of bias | ||
| Bias | Authors' judgement | Support for judgement |
| Random sequence generation (selection bias) | Low risk | “…Using sets of sealed envelopes (containing assignments based on sequences of random numbers).“ The randomisation process occurred before 8 cm dilation. |
| Allocation concealment (selection bias) | Low risk | “…prepared for each site by the research team biostatistician.” |
| Blinding of participants and personnel (performance bias) | High risk | No blinding of participants. |
| Blinding of outcome assessment (detection bias) | Unclear risk | Not mentioned. |
| Incomplete outcome data (attrition bias) | Unclear risk | Not mentioned. |
| Selective reporting (reporting bias) | High risk | Incomplete results to enter in the meta‐analysis. |
| Other bias | Low risk | No other problems detected that could put the study at a risk of bias. |
| Methods | RCT | |
| Participants | Setting: trial conducted in the USA. Inclusion criteria: nulliparous women at term with a fetus in a cephalic presentation and who received neuraxial analgesia. Exclusion criteria: women with gestational or pre‐gestational diabetes mellitus or a contraindication to pushing in the second stage were excluded. 202 women randomised. | |
| Interventions | “Immediate pushing group”: were encouraged to begin pushing efforts upon reaching complete dilatation (85 women). “Delayed pushing group”: were instructed to wait until they appreciated a strong urge to push, defined as 50 mm or greater on an unmarked 100 mm VAS. The limits of the scale were verbally defined as no urge to push (0 mm) and an overwhelming urge to push (100 mm). If patients did not feel a strong urge to push after 90 mins, they were asked to start pushing without an urge (117 women). | |
| Outcomes | Umbilical artery pH < 7.1, admission to NICU, mode of delivery vaginal, caesarean, postpartum haemorrhage. | |
| Notes | Reported to be funded by a National Research Service Award from the Agency for Healthcare Research and Quality. | |
| Risk of bias | ||
| Bias | Authors' judgement | Support for judgement |
| Random sequence generation (selection bias) | Low risk | Randomised assignments were determined through the use of a computer‐generated random numbers table. |
| Allocation concealment (selection bias) | Low risk | Assignments were kept in opaque envelopes until after patient consent was obtained. There is no report when the randomisation process started. |
| Blinding of participants and personnel (performance bias) | High risk | No blinding of participants. |
| Blinding of outcome assessment (detection bias) | Unclear risk | Not mentioned. |
| Incomplete outcome data (attrition bias) | Low risk | 202: consented to participate. 117: delayed pushing. 85: pushing immediately. |
| Selective reporting (reporting bias) | High risk | Incomplete results to be entered in the meta‐analysis. |
| Other bias | Low risk | No other problems detected that could put the study at a risk of bias. |
| Methods | RCT | |
| Participants | Setting: trial conducted in the USA. The women ranged from 17 to 25 years of age and were primigravidas or secundigravidas. 200 women randomised. | |
| Interventions | Group 1: were encourage to bear down with the uterine contractions and deliver the infant spontaneously (100 women). Group 2: were urged not to bear down following administration of spinal anaesthesia (100 women). | |
| Outcomes | Postlumbar puncture headache. | |
| Notes | This study did not contribute to the analysis. Lumbar puncture was done upon "crowning of the fetal head" with the patient in the sitting position. Sources of funding not specified. | |
| Risk of bias | ||
| Bias | Authors' judgement | Support for judgement |
| Random sequence generation (selection bias) | Unclear risk | The patients were randomly assigned to 1 group or the other. |
| Allocation concealment (selection bias) | Unclear risk | Not clear who conducted the randomisation. |
| Blinding of participants and personnel (performance bias) | High risk | No blinding. |
| Blinding of outcome assessment (detection bias) | Unclear risk | Not mentioned. |
| Incomplete outcome data (attrition bias) | Unclear risk | Not mentioned. |
| Selective reporting (reporting bias) | High risk | It only shows the results for postlumbar puncture headache. |
| Other bias | Low risk | No other problems detected that could put the study at a risk of bias. |
| Methods | RCT | |
| Participants | Setting: trial conducted in USA. Inclusion criteria: nulliparous women, between 36 and 41 weeks, singleton fetus in cephalic presentation, regular uterine contractions with cervical dilatation of at least 4 cm. Exclusion criteria: prior history of urinary incontinence, anal incontinence, pelvic organ prolapsed, any known complication of pregnancy, estimated fetal weight greater than 4000 g/use of oxytocin or epidural analgesia and chorioamnionitis prior to the 2nd stage. 325 women randomised (320 some data, 128 in analysis at 3 months postpartum). | |
| Interventions | “Coached pushing”: pushing using a closed glottis ‐ take a deep breath and hold during the peak of a contraction the bear down and push for 10 seconds; repeat this as long as the contraction continues. Coach patient to pull back on both knees and tuck her chin in while the provider or partner supports the legs (not clear, data for 157 for some outcomes, 67 for 3 months postpartum analysis). “Uncoached pushing”: not given specific instructions on pushing technique ‐ “do what comes naturally” or” whatever the patient feels the urge to do while in bed.” (Some data for 163 women, data for 61 at 3 months postpartum.) | |
| Outcomes | Length of second stage, episiotomy, perineal laceration first, second, third and fourth degree, 5‐min Apgar score, Umbilical artery pH 7.1, admission to NICU, mode of delivery vaginal, caesarean and forceps from 1 report (2005) and Urodynamic results 3 months postpartum: Detrusor overactivity, urinary stress incontinence from the other report (2006). | |
| Notes | This study was the result of the primary outcome to see the difference in the maximal urethral closure pressure between the coached and uncoached group. The sample was calculated to obtain a 3‐month postpartum urodynamic testing of 106 women. So to ensure enough women to their postpartum evaluation, it was estimated that about 3 times the number of women actually required should be recruited to the randomised phase. The study was terminated when the sample size for urethral closure pressure had been obtained. This study resulted in 2 publications: 1 in 2005 with 128 women and the other 1 in 2006 with 320 woman. 1 report (Wai 2011) did not contribute to the analysis because this secondary analysis is from data of both groups (coached and uncoached) together. Sources of funding not specified. | |
| Risk of bias | ||
| Bias | Authors' judgement | Support for judgement |
| Random sequence generation (selection bias) | Low risk | Computer‐generated randomisation scheme in blocks of 10 patients. |
| Allocation concealment (selection bias) | Low risk | Assigment was masked to the providers by use of opaque envelopes at the onset of the second stage of labour. |
| Blinding of participants and personnel (performance bias) | High risk | No blinding for the participants and key study personnel. |
| Blinding of outcome assessment (detection bias) | Low risk | Blinding for the outcome assessment. |
| Incomplete outcome data (attrition bias) | High risk | 1534 were screened. 988 consented. 546 declined to participate. 325 stayed. 128 returned for the 3‐month postpartum. 67 coached. 61 uncoached. 97 did not returned (29.84%). Intention‐to‐treat analysis. |
| Selective reporting (reporting bias) | Low risk | No selective reporting. |
| Other bias | Low risk | No other problems detected that could put the study at a risk of bias. |
| Methods | RCT | |
| Participants | Setting: trial conducted in the USA. Inclusion criteria: nulliparous women at term (> 37 weeks' gestation) in the second stage of labour with a singleton fetus in a vertex presentation who were having an elective induction of labour, and had a reassuring fetal heart rate pattern at the time of enrolment. Exclusion criteria: women with medical or obstetrical complications or a maternal condition that could potentially influence oxygen saturation including history of smoking, asthma, chronic or acute pulmonary, or cardiac disease. 45 women randomised. | |
| Interventions | “Immediate pushing group”: use closed‐glottis pushing 3 to 4 times during each contractions immediately when cervical dilation reached 10 cm and to continue pushing using this method with each contraction until birth. The nurse counted to 10 during each pushing effort to assist the woman in holding her breath for at least 10 seconds (22 women). “Delayed pushing group”: women were assisted to a left lateral position at 10 cm where they remained until they felt the urge to push or the second stage had lasted 2 hours (whichever came first). Then they were encouraged by the nurse to bear down with contractions without holding their breath (open‐glottis) for no more than 6‐8 seconds and continue bearing down no more than 3 times with each contraction until birth (23 women). | |
| Outcomes | Length of second stage, length of pushing. | |
| Notes | Research funded by a grant from the American Nurses Foundation sponsored by GlaxoSmithKline. | |
| Risk of bias | ||
| Bias | Authors' judgement | Support for judgement |
| Random sequence generation (selection bias) | Low risk | Computer–generated allocation. |
| Allocation concealment (selection bias) | Unclear risk | Not described (randomisation at 10 cm cervical dilation). |
| Blinding of participants and personnel (performance bias) | High risk | No blinding of participants. |
| Blinding of outcome assessment (detection bias) | Unclear risk | Not mentioned. |
| Incomplete outcome data (attrition bias) | Low risk | Eligible: 60. Declined participation: 4. Consented in early labour: 56. Enrolled and randomised: 45. CG: 22/TG: 23. No loss after randomisation. |
| Selective reporting (reporting bias) | High risk | Incomplete results to be entered in the meta‐analysis. |
| Other bias | Low risk | No other problems detected that could put the study at a risk of bias. |
| Methods | RCT | |
| Participants | Setting: trial conducted in UK. Inclusion criteria: aged 18 or over, primiparous, singleton pregnancy, > 37 weeks, cephalic presentation, no epidural, no maternal condition (obstetric or medical) or fetal condition which would affect the management of the second stage. Exclusion criteria: conception in‐vitro, where the baby was to be adopted or where a “ care order” was to be taken out on the baby after delivery, use of epidural. 32 women randomised. | |
| Interventions | “Valsalva group”: take a deep breath, hold it and push for as long as possible (17 women). “Exhalation pushing”: spontaneous pushing activity (15 women). If delivery is not imminent in 90 min please adopt whatever clinical management you and the woman think fit. If you are concerned about maternal and/or fetal well‐being at any time please discontinue the trial and institute normal clinical management for that situation. All women were free to adopt any position they wanted. | |
| Outcomes | Length of second stage, mode of delivery vaginal, estimated blood loss. | |
| Notes | 1 report did not contribute to the data 1 it was a qualitative analysis. Source of funding not specified. | |
| Risk of bias | ||
| Bias | Authors' judgement | Support for judgement |
| Random sequence generation (selection bias) | Low risk | Table of random numbers. |
| Allocation concealment (selection bias) | Low risk | When the second stage was diagnosed the midwife was given a sealed piece of paper which contained the group of allocation and instructions. |
| Blinding of participants and personnel (performance bias) | High risk | No blinding for the participants or the key study personnel. |
| Blinding of outcome assessment (detection bias) | Unclear risk | Not clear if it was blinding. |
| Incomplete outcome data (attrition bias) | Low risk | 32 were recruited. 15 – IG. 17 ‐ CG. |
| Selective reporting (reporting bias) | High risk | The study included few main expected outcomes, but some were reported incompletely to be entered in a meta‐analysis. |
| Other bias | High risk | The main author was present: “in order to ensure reliability of group allocation AMT was present for all the second stages". |
| Methods | RCT | |
| Participants | Setting: trial conducted in UK. Inclusion criteria: nulliparous women in spontaneous or induced labour, with a singleton fetus between 37 and 42 weeks of gestation, and with an effective epidural, were eligible. Exclusion criteria: women with a non vertex presentation, or any complication which might influence second stage management, such as raised blood pressure, heart disease, or a dural tap were excluded. 135 women randomised. | |
| Interventions | “Early pushing”: pushing would commence within 1 hour of full dilation, whether the vertex was visible or not (67 women). “Delayed pushing”: women were encouraged to rest without pushing for a maximum of 3 hours from the time of full dilation, unless the vertex was visible ate the introitus earlier (68 women). | |
| Outcomes | Episiotomy, perineal laceration second degree, 5‐min Apgar score, admission to NICU, oxytocin use in second stage after randomisation, mode of delivery caesarean and forceps (nonrotational and rotational). | |
| Notes | Funding source not specified. | |
| Risk of bias | ||
| Bias | Authors' judgement | Support for judgement |
| Random sequence generation (selection bias) | Low risk | Numbered opaque sealed envelopes containing computer‐generated random allocations in a ratio of 1:1 in balanced blocks of 10.
|
| Allocation concealment (selection bias) | Low risk | The randomisation was done either in the first stage or within 1 hour of the start of the second stage. Opaque sealed envelopes. |
| Blinding of participants and personnel (performance bias) | High risk | No. |
| Blinding of outcome assessment (detection bias) | Unclear risk | Not mentioned. |
| Incomplete outcome data (attrition bias) | Low risk | 135 participated. 67 early pushing. 68 delayed pushing. |
| Selective reporting (reporting bias) | High risk | Incomplete results to be entered in the meta‐analysis including the key outcome. |
| Other bias | Low risk | No other problems detected that could put the study at a risk of bias. |
| Methods | RCT | |
| Participants | Setting: trial conducted in Iran. Inclusion criteria: nulliparous mothers, live fetus with vertex presentation, gestational age of 37‐40 weeks, spontaneous labour. Exclusion criteria: chronic diseases, pregnancy complications (pre‐eclampsia and placental abruption), premature rupture of membranes, caesarean section. 72 women randomised. | |
| Interventions | Intervention group: women pushed when they felt the urge to push while being in the lateral position during pushing (36 women). Control group: women pushed from the onset of the second stage using the Valsalva method while being in the supine position, according tho the routine practice in the maternity unit (36 women). | |
| Outcomes | Maternal outcomes: duration of the second stage, duration of pushing, pain, fatigue and pain severity in the second stage. Fetal outcomes: fetal heart rate patterns (late deceleration, variable deceleration, bradycardia and tachycardia), Apgar score and pH and pO2 of the umbilical cord blood. | |
| Notes | Research supported by Shiraz University of Medical Sciences. | |
| Risk of bias | ||
| Bias | Authors' judgement | Support for judgement |
| Random sequence generation (selection bias) | Low risk | Stratified and block random sampling. |
| Allocation concealment (selection bias) | Unclear risk | Not reported. |
| Blinding of participants and personnel (performance bias) | High risk | No. |
| Blinding of outcome assessment (detection bias) | Unclear risk | Not reported. |
| Incomplete outcome data (attrition bias) | Low risk | 72 were randomised. 34 for the control group (lost of 2 participants). 35 for the intervention group (lost of 1 participant). |
| Selective reporting (reporting bias) | High risk | Incomplete results to be entered in the meta‐analysis. |
| Other bias | Low risk | No other problems detected that could put the study at a risk of bias. |
| Methods | RCT | |
| Participants | Setting:trial conducted in Turkey. Researcher went into hospital twice a week during the day shift to recruit women who fitted the inclusion criteria. Inclusion criteria: low‐risk, primiparous, 38‐42 weeks' gestation, single vertex fetus, peso 2.500 e 3999. The study women had no knowledge or preparation about birth and pushing techniques. 100 women randomised. | |
| Interventions | Pushing began in both groups with full dilatation of the cervix, when uterine contractions became intense, and the fetal head had completed its rotation and descended to at least the + 1 level in the pelvis. “Valsalva pushing”: women were encouraged and supported in using Valsalva‐type pushing in the second stage of labour (50 women). “Spontaneous pushing”: women were encouraged and supported to push spontaneously in the second stage of labour bearing down in response to contractions (50 women). If delivery is not imminent in 90 mins please adopt whatever clinical management you and the woman think fit. If you are concerned about maternal and/or fetal well‐being at any time please discontinue the trial and institute normal clinical management for that situation. | |
| Outcomes | Length of second stage, length of pushing, episiotomy, 5‐min Apgar scores, umbilical arterial pH. | |
| Notes | All women delivered in the lithotomy position. The authors report 'increase in oxytocin dose' by treatment groups but not the outcome of 'oxytocin use'. The authors state only that there were no differences in oxytocin use between treatment arms. Reported to be supported by the Research Fund of Instanbul University, Turkey. | |
| Risk of bias | ||
| Bias | Authors' judgement | Support for judgement |
| Random sequence generation (selection bias) | High risk | The Valsalva and spontaneous groups were randomised using envelopes. The random sequence generation is not described. |
| Allocation concealment (selection bias) | Unclear risk | Randomisation at full dilation. Methods of allocation concealment not clear. |
| Blinding of participants and personnel (performance bias) | High risk | No blinding. |
| Blinding of outcome assessment (detection bias) | Unclear risk | Not clear. |
| Incomplete outcome data (attrition bias) | High risk | 1920 were screened. 174 met the inclusion criteria. 74 declined to participate (13 had unplanned caesarean, 5 refused and 56 was not included because the study observation could not have been completed during the day shift). 100 stayed. |
| Selective reporting (reporting bias) | High risk | Incomplete data; 'use of oxytocin' not reported by treatment arm, only 'increase in oxytocin use'. |
| Other bias | Low risk | No other problems detected that could put the study at a risk of bias. |
min: minute
NICU: neonatal intensive care unit
RCT: randomised controlled trial
VAS: visual analogue scale
Characteristics of excluded studies [ordered by study ID]
Jump to:
| Study | Reason for exclusion |
| This trial aimed to determine the effect of a dental support device use on the course of labour and delivery. It does not report the type of pushing used. | |
| Not a randomised controlled trial. It does not report the randomisation method. It is only describe: "the study continued until 10 women who met both the pregnancy and labour criteria were monitored". | |
| Study only present in abstract form. | |
| Not a randomised controlled trial. The 2 groups (spontaneous versus directed) were matched by the investigators. | |
| Quasi‐experimental study. | |
| Not a randomised controlled trial. | |
| Quasi‐experimental study. | |
| Not a randomised controlled trial. Women were assigned into 1 of the 2 groups based on their personal choice once full dilation was confirmed. | |
| Study present in abstract form and registration of a controlled trial. | |
| Not a randomised controlled trial. Randomisation not stated. | |
| Intervention: use of a support dental device compared to non‐use in active pushing phase of second stage. Both groups were coached on Valsalva maneuver during contraction. | |
| Letter to the editor and uncertain methodology. | |
| The aim of this study was to compare different positions (squatting versus supine). It does not report the type of pushing used in both groups. | |
| Registration of clinical trial recruiting participants. The intervention was the McRobert's manoeuvre ‐ there is no evidence that the trial was completed. | |
| The randomisation was broken and the final analysis did not follow the initial allocation by the randomisation. | |
| Different type of intervention. The intervention was antenatal education with Valsalva maneuver and relaxed pelvic floor compared to control with no education. Both groups (intervention and control) pushed spontaneously in second stage according to standard of care from the labour ward. | |
| Study presented in abstract form. | |
| Registration of an ongoing trial ‐ there is no evidence that the trial was completed. | |
| Registration of an ongoing trial ‐ there is no evidence that the trial was completed. | |
| The method of pushing was the same in both groups. Most of the women did not feel the urge to push as a consequence of epidural anaesthesia and the push was directed by midwives not allowing any delayed time. | |
| Not a randomised controlled trial. |
Characteristics of ongoing studies [ordered by study ID]
Jump to:
| Trial name or title | Optimizing management of the 2nd Stage of labor: multicenter randomized trial (OMSS). |
| Methods | Large, multicentre, randomised clinical trial. |
| Participants |
|
| Interventions | Compare immediate versus delayed pushing in the second stage of labour. |
| Outcomes | Primary: spontaneous vaginal delivery. Secondary:
|
| Starting date | May 2014 |
| Contact information | Alison G. Cahill ([email protected]) and Methodius G. Tuuli ([email protected]) |
| Notes | NCT02137200 on ClinicalTrials.gov Archive site. |
| Trial name or title | Passive descent in obese nulliparous gravidae. |
| Methods | Randomised trial, single‐blind (investigator). |
| Participants | Obese (body mass index greater than or equal to 30), Nulliparous, gestational age of 37 weeks and greater, singleton pregnancy, regional anaesthesia. |
| Interventions | Compare passive descent versus immediate pushing. |
| Outcomes | Primary: spontaneous vaginal delivery. Secondary: rate of infections, third and fourth degree lacerations, postpartum haemorrhage, admission to NICU, umbilical cord pH < 7.1. |
| Starting date | Not provided. |
| Contact information | Alisse Hauspurg [email protected] |
| Notes |
NICU: neonatal intensive care unit
Data and analyses
| Outcome or subgroup title | No. of studies | No. of participants | Statistical method | Effect size |
| 1 Duration of second stage (minutes) Show forest plot | 6 | Mean Difference (IV, Random, 95% CI) | Subtotals only | |
| Analysis 1.1  Comparison 1 Analysis 1. Comparison 1: types of pushing: spontaneous pushing versus directed pushing, Outcome 1 Duration of second stage (minutes). | ||||
| 1.1 Nulliparous | 6 | 667 | Mean Difference (IV, Random, 95% CI) | 10.26 [‐1.12, 21.64] |
| 2 Perineal laceration (3rd or 4th degree) Show forest plot | 1 | 320 | Risk Ratio (M‐H, Fixed, 95% CI) | 0.87 [0.45, 1.66] |
| Analysis 1.2  Comparison 1 Analysis 1. Comparison 1: types of pushing: spontaneous pushing versus directed pushing, Outcome 2 Perineal laceration (3rd or 4th degree). | ||||
| 3 Episiotomy Show forest plot | 2 | 420 | Risk Ratio (M‐H, Random, 95% CI) | 1.05 [0.60, 1.85] |
| Analysis 1.3  Comparison 1 Analysis 1. Comparison 1: types of pushing: spontaneous pushing versus directed pushing, Outcome 3 Episiotomy. | ||||
| 4 Admission to neonatal intensive care Show forest plot | 2 | 393 | Risk Ratio (M‐H, Fixed, 95% CI) | 1.08 [0.30, 3.79] |
| Analysis 1.4  Comparison 1 Analysis 1. Comparison 1: types of pushing: spontaneous pushing versus directed pushing, Outcome 4 Admission to neonatal intensive care. | ||||
| 5 Five‐minute Apgar score < seven Show forest plot | 1 | 320 | Risk Ratio (M‐H, Fixed, 95% CI) | 0.35 [0.01, 8.43] |
| Analysis 1.5 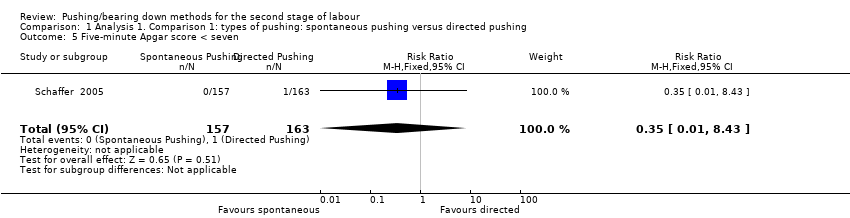 Comparison 1 Analysis 1. Comparison 1: types of pushing: spontaneous pushing versus directed pushing, Outcome 5 Five‐minute Apgar score < seven. | ||||
| 6 Duration of pushing (minutes) Show forest plot | 2 | 169 | Mean Difference (IV, Random, 95% CI) | ‐9.76 [‐19.54, 0.02] |
| Analysis 1.6  Comparison 1 Analysis 1. Comparison 1: types of pushing: spontaneous pushing versus directed pushing, Outcome 6 Duration of pushing (minutes). | ||||
| 6.1 Mixed parity | 2 | 169 | Mean Difference (IV, Random, 95% CI) | ‐9.76 [‐19.54, 0.02] |
| 7 Oxytocin use in second stage after randomisation Show forest plot | 1 | 128 | Risk Ratio (M‐H, Fixed, 95% CI) | 2.20 [0.80, 6.07] |
| Analysis 1.7  Comparison 1 Analysis 1. Comparison 1: types of pushing: spontaneous pushing versus directed pushing, Outcome 7 Oxytocin use in second stage after randomisation. | ||||
| 8 Spontaneous vaginal delivery Show forest plot | 5 | 688 | Risk Ratio (M‐H, Fixed, 95% CI) | 1.01 [0.97, 1.05] |
| Analysis 1.8 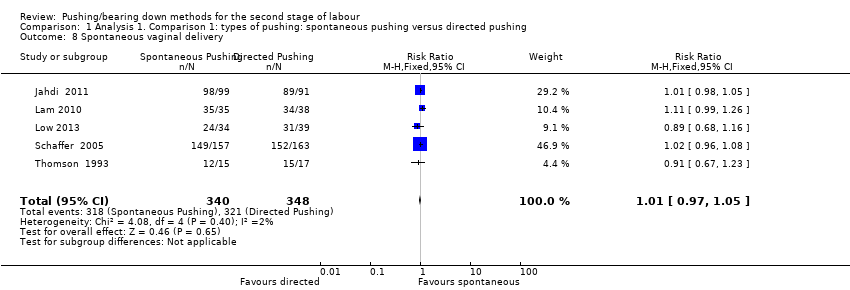 Comparison 1 Analysis 1. Comparison 1: types of pushing: spontaneous pushing versus directed pushing, Outcome 8 Spontaneous vaginal delivery. | ||||
| 9 Instrumental delivery Show forest plot | 2 | 393 | Risk Ratio (M‐H, Random, 95% CI) | 0.56 [0.06, 5.10] |
| Analysis 1.9 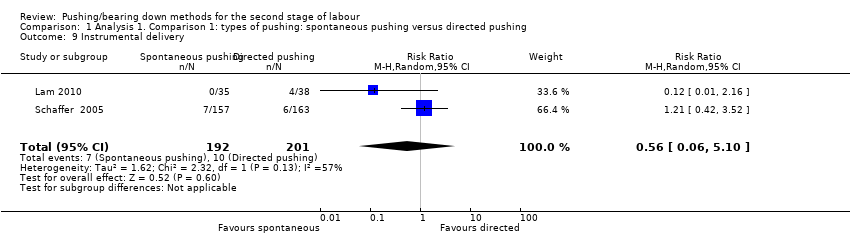 Comparison 1 Analysis 1. Comparison 1: types of pushing: spontaneous pushing versus directed pushing, Outcome 9 Instrumental delivery. | ||||
| 10 Caesarean delivery Show forest plot | 3 | 583 | Risk Ratio (M‐H, Random, 95% CI) | 0.79 [0.14, 4.39] |
| Analysis 1.10 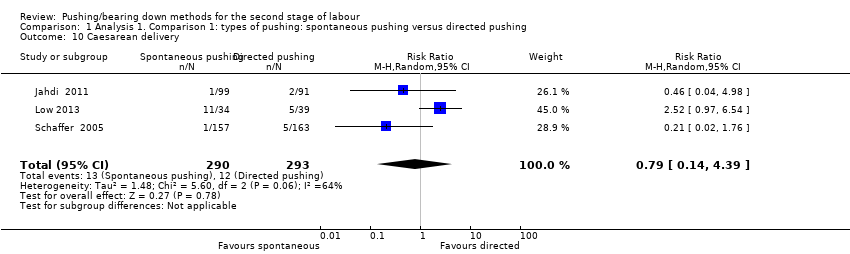 Comparison 1 Analysis 1. Comparison 1: types of pushing: spontaneous pushing versus directed pushing, Outcome 10 Caesarean delivery. | ||||
| 11 Fatigue after delivery Show forest plot | 2 | 142 | Std. Mean Difference (IV, Random, 95% CI) | ‐1.14 [‐3.29, 1.02] |
| Analysis 1.11 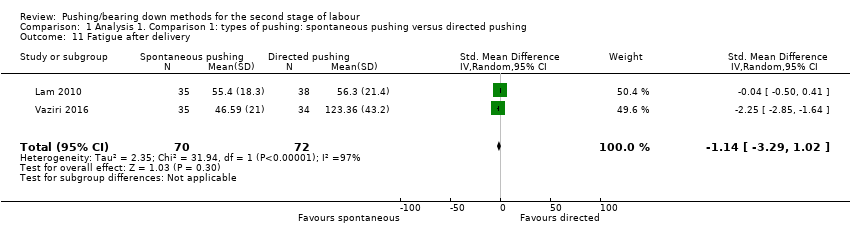 Comparison 1 Analysis 1. Comparison 1: types of pushing: spontaneous pushing versus directed pushing, Outcome 11 Fatigue after delivery. | ||||
| 12 Maternal satisfaction Show forest plot | 1 | 31 | Mean Difference (IV, Fixed, 95% CI) | 0.91 [‐1.30, 3.12] |
| Analysis 1.12 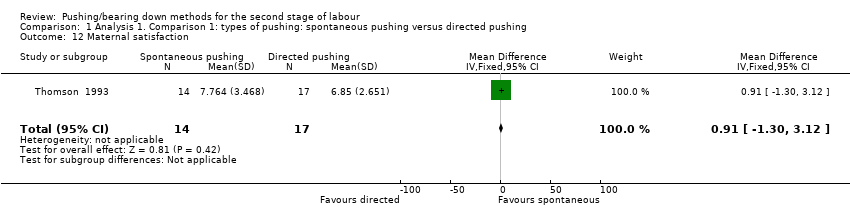 Comparison 1 Analysis 1. Comparison 1: types of pushing: spontaneous pushing versus directed pushing, Outcome 12 Maternal satisfaction. | ||||
| 13 Detrusor overactivity Show forest plot | 1 | 128 | Risk Ratio (M‐H, Fixed, 95% CI) | 0.50 [0.18, 1.36] |
| Analysis 1.13 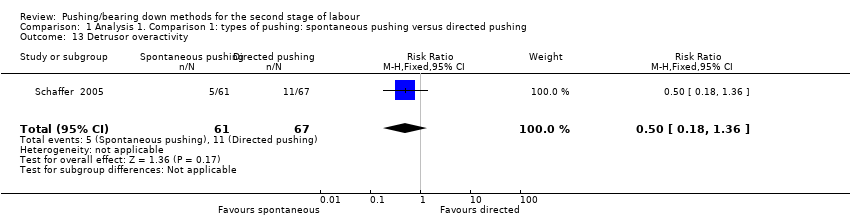 Comparison 1 Analysis 1. Comparison 1: types of pushing: spontaneous pushing versus directed pushing, Outcome 13 Detrusor overactivity. | ||||
| 14 Urinary stress incontinence Show forest plot | 1 | 128 | Risk Ratio (M‐H, Fixed, 95% CI) | 0.70 [0.29, 1.69] |
| Analysis 1.14 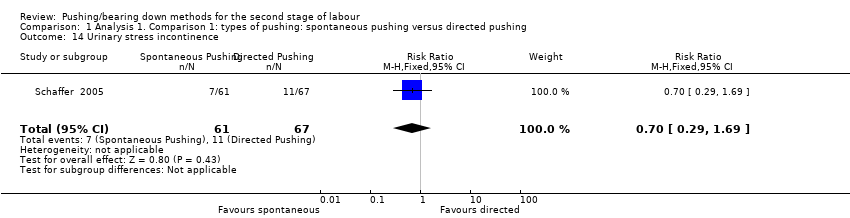 Comparison 1 Analysis 1. Comparison 1: types of pushing: spontaneous pushing versus directed pushing, Outcome 14 Urinary stress incontinence. | ||||
| 15 Low umbilical cord blood Show forest plot | 1 | 320 | Risk Ratio (M‐H, Fixed, 95% CI) | 0.74 [0.24, 2.29] |
| Analysis 1.15  Comparison 1 Analysis 1. Comparison 1: types of pushing: spontaneous pushing versus directed pushing, Outcome 15 Low umbilical cord blood. | ||||
| 15.1 Arterial umbilical cord pH < 7.2 | 1 | 320 | Risk Ratio (M‐H, Fixed, 95% CI) | 0.74 [0.24, 2.29] |
| 15.2 Venous umbilical cord < 7.3 | 0 | 0 | Risk Ratio (M‐H, Fixed, 95% CI) | 0.0 [0.0, 0.0] |
| 16 Delivery room resuscitation Show forest plot | 2 | 352 | Risk Ratio (M‐H, Fixed, 95% CI) | 0.83 [0.40, 1.75] |
| Analysis 1.16  Comparison 1 Analysis 1. Comparison 1: types of pushing: spontaneous pushing versus directed pushing, Outcome 16 Delivery room resuscitation. | ||||
| 17 Sensitivity analysis (trial quality): Duration of second stage (minutes) Show forest plot | 4 | Mean Difference (IV, Random, 95% CI) | Subtotals only | |
| Analysis 1.17  Comparison 1 Analysis 1. Comparison 1: types of pushing: spontaneous pushing versus directed pushing, Outcome 17 Sensitivity analysis (trial quality): Duration of second stage (minutes). | ||||
| 17.1 All studies | 4 | 494 | Mean Difference (IV, Random, 95% CI) | 17.62 [5.28, 29.95] |
| 18 Sensitivity analysis (trial quality): Duration of pushing (minutes) Show forest plot | 1 | 69 | Mean Difference (IV, Random, 95% CI) | ‐15.22 [‐21.64, ‐8.80] |
| Analysis 1.18 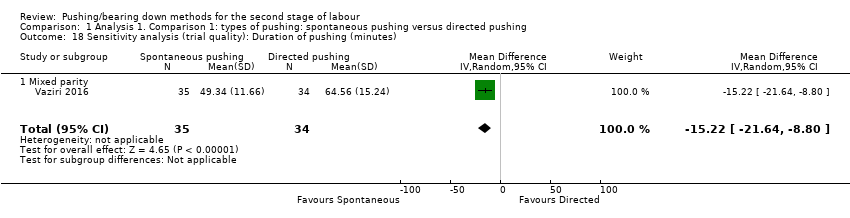 Comparison 1 Analysis 1. Comparison 1: types of pushing: spontaneous pushing versus directed pushing, Outcome 18 Sensitivity analysis (trial quality): Duration of pushing (minutes). | ||||
| 18.1 Mixed parity | 1 | 69 | Mean Difference (IV, Random, 95% CI) | ‐15.22 [‐21.64, ‐8.80] |
| Outcome or subgroup title | No. of studies | No. of participants | Statistical method | Effect size |
| 1 Duration of second stage (minutes) Show forest plot | 11 | 3049 | Mean Difference (IV, Random, 95% CI) | 56.40 [42.05, 70.76] |
| Analysis 2.1 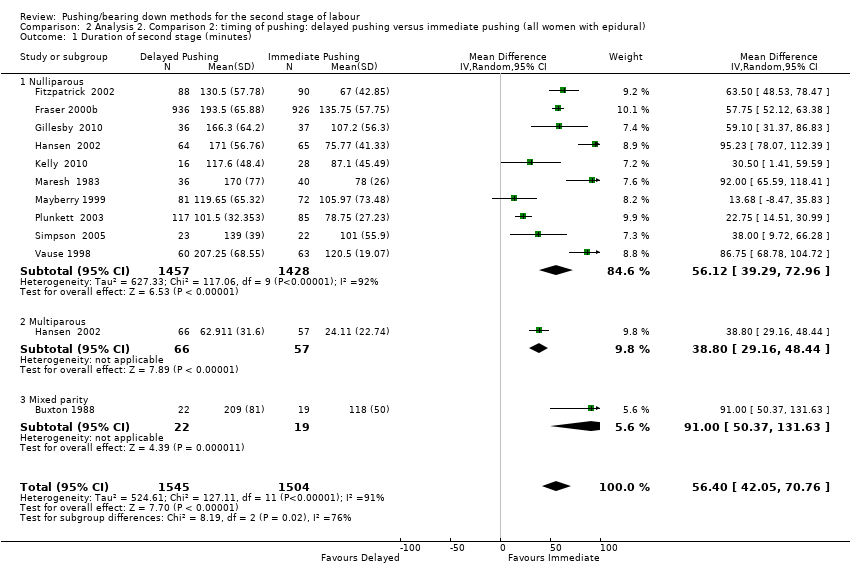 Comparison 2 Analysis 2. Comparison 2: timing of pushing: delayed pushing versus immediate pushing (all women with epidural), Outcome 1 Duration of second stage (minutes). | ||||
| 1.1 Nulliparous | 10 | 2885 | Mean Difference (IV, Random, 95% CI) | 56.12 [39.29, 72.96] |
| 1.2 Multiparous | 1 | 123 | Mean Difference (IV, Random, 95% CI) | 38.80 [29.16, 48.44] |
| 1.3 Mixed parity | 1 | 41 | Mean Difference (IV, Random, 95% CI) | 91.0 [50.37, 131.63] |
| 2 Perineal Laceration (3rd or 4th degree) Show forest plot | 7 | 2775 | Risk Ratio (M‐H, Fixed, 95% CI) | 0.94 [0.78, 1.14] |
| Analysis 2.2  Comparison 2 Analysis 2. Comparison 2: timing of pushing: delayed pushing versus immediate pushing (all women with epidural), Outcome 2 Perineal Laceration (3rd or 4th degree). | ||||
| 3 Episiotomy Show forest plot | 5 | 2320 | Risk Ratio (M‐H, Fixed, 95% CI) | 0.95 [0.87, 1.04] |
| Analysis 2.3  Comparison 2 Analysis 2. Comparison 2: timing of pushing: delayed pushing versus immediate pushing (all women with epidural), Outcome 3 Episiotomy. | ||||
| 4 Admission to neonatal intensive care Show forest plot | 3 | 2197 | Risk Ratio (M‐H, Fixed, 95% CI) | 0.98 [0.67, 1.41] |
| Analysis 2.4  Comparison 2 Analysis 2. Comparison 2: timing of pushing: delayed pushing versus immediate pushing (all women with epidural), Outcome 4 Admission to neonatal intensive care. | ||||
| 5 Five‐minute Apgar score < seven Show forest plot | 3 | 413 | Risk Ratio (M‐H, Fixed, 95% CI) | 0.15 [0.01, 3.00] |
| Analysis 2.5  Comparison 2 Analysis 2. Comparison 2: timing of pushing: delayed pushing versus immediate pushing (all women with epidural), Outcome 5 Five‐minute Apgar score < seven. | ||||
| 6 Duration of pushing (minutes) Show forest plot | 11 | 2932 | Mean Difference (IV, Random, 95% CI) | ‐19.05 [‐32.27, ‐5.83] |
| Analysis 2.6  Comparison 2 Analysis 2. Comparison 2: timing of pushing: delayed pushing versus immediate pushing (all women with epidural), Outcome 6 Duration of pushing (minutes). | ||||
| 6.1 Nulliparous | 10 | 2768 | Mean Difference (IV, Random, 95% CI) | ‐21.30 [‐36.87, ‐5.73] |
| 6.2 Multiparous | 1 | 123 | Mean Difference (IV, Random, 95% CI) | ‐11.35 [‐18.19, ‐4.51] |
| 6.3 Mixed parity | 1 | 41 | Mean Difference (IV, Random, 95% CI) | ‐2.0 [‐30.35, 26.35] |
| 7 Oxytocin use in second stage after randomisation Show forest plot | 2 | 177 | Risk Ratio (M‐H, Fixed, 95% CI) | 1.00 [0.79, 1.27] |
| Analysis 2.7 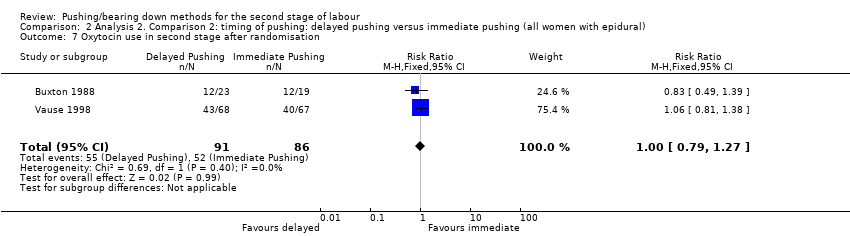 Comparison 2 Analysis 2. Comparison 2: timing of pushing: delayed pushing versus immediate pushing (all women with epidural), Outcome 7 Oxytocin use in second stage after randomisation. | ||||
| 8 Spontaneous vaginal delivery Show forest plot | 12 | 3114 | Risk Ratio (M‐H, Fixed, 95% CI) | 1.07 [1.02, 1.11] |
| Analysis 2.8  Comparison 2 Analysis 2. Comparison 2: timing of pushing: delayed pushing versus immediate pushing (all women with epidural), Outcome 8 Spontaneous vaginal delivery. | ||||
| 8.1 Nulliparous | 11 | 2953 | Risk Ratio (M‐H, Fixed, 95% CI) | 1.07 [1.03, 1.12] |
| 8.2 Multiparous | 1 | 120 | Risk Ratio (M‐H, Fixed, 95% CI) | 1.11 [1.00, 1.24] |
| 8.3 Mixed parity | 1 | 41 | Risk Ratio (M‐H, Fixed, 95% CI) | 0.47 [0.22, 1.03] |
| 9 Instrumental delivery Show forest plot | 10 | 3007 | Risk Ratio (M‐H, Random, 95% CI) | 0.89 [0.74, 1.07] |
| Analysis 2.9 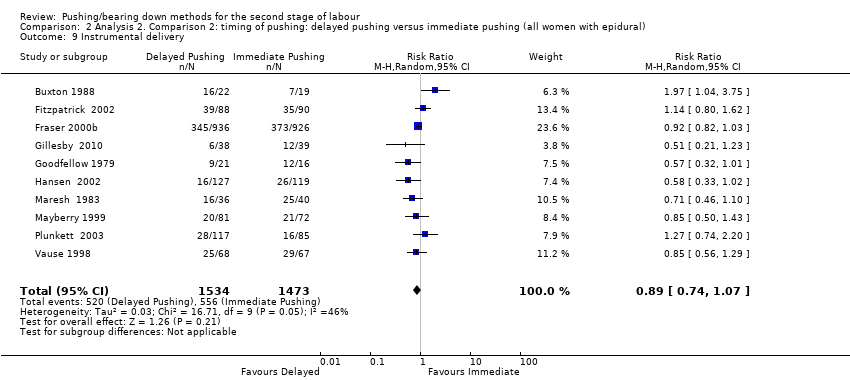 Comparison 2 Analysis 2. Comparison 2: timing of pushing: delayed pushing versus immediate pushing (all women with epidural), Outcome 9 Instrumental delivery. | ||||
| 10 Rotational or midpelvic or posterior forceps Show forest plot | 5 | 2151 | Risk Ratio (M‐H, Fixed, 95% CI) | 0.82 [0.61, 1.10] |
| Analysis 2.10  Comparison 2 Analysis 2. Comparison 2: timing of pushing: delayed pushing versus immediate pushing (all women with epidural), Outcome 10 Rotational or midpelvic or posterior forceps. | ||||
| 11 Caesarean delivery Show forest plot | 9 | 2783 | Risk Ratio (M‐H, Fixed, 95% CI) | 0.83 [0.65, 1.05] |
| Analysis 2.11 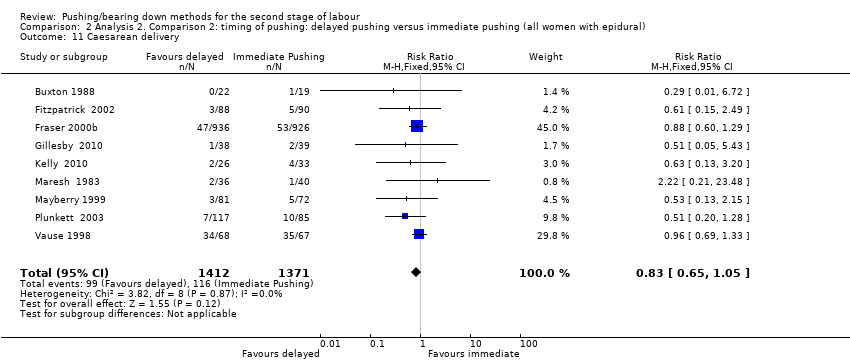 Comparison 2 Analysis 2. Comparison 2: timing of pushing: delayed pushing versus immediate pushing (all women with epidural), Outcome 11 Caesarean delivery. | ||||
| 12 Postpartum haemorrhage Show forest plot | 3 | 2199 | Risk Ratio (M‐H, Fixed, 95% CI) | 1.04 [0.86, 1.26] |
| Analysis 2.12  Comparison 2 Analysis 2. Comparison 2: timing of pushing: delayed pushing versus immediate pushing (all women with epidural), Outcome 12 Postpartum haemorrhage. | ||||
| 13 Fatigue after delivery Show forest plot | 1 | 73 | Mean Difference (IV, Fixed, 95% CI) | ‐6.40 [‐21.00, 8.20] |
| Analysis 2.13 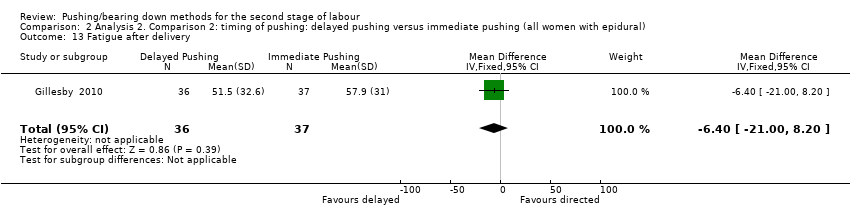 Comparison 2 Analysis 2. Comparison 2: timing of pushing: delayed pushing versus immediate pushing (all women with epidural), Outcome 13 Fatigue after delivery. | ||||
| 14 Maternal satisfaction Show forest plot | 1 | 73 | Mean Difference (IV, Fixed, 95% CI) | 0.40 [‐7.34, 8.14] |
| Analysis 2.14  Comparison 2 Analysis 2. Comparison 2: timing of pushing: delayed pushing versus immediate pushing (all women with epidural), Outcome 14 Maternal satisfaction. | ||||
| 15 Dyspareunia Show forest plot | 1 | 162 | Risk Ratio (M‐H, Fixed, 95% CI) | 1.15 [0.63, 2.10] |
| Analysis 2.15 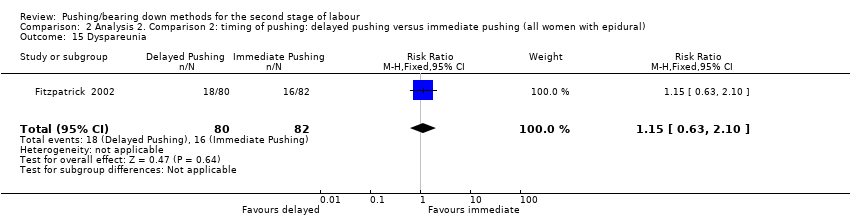 Comparison 2 Analysis 2. Comparison 2: timing of pushing: delayed pushing versus immediate pushing (all women with epidural), Outcome 15 Dyspareunia. | ||||
| 16 Fecal incontinence Show forest plot | 1 | 178 | Risk Ratio (M‐H, Fixed, 95% CI) | 1.47 [0.94, 2.29] |
| Analysis 2.16 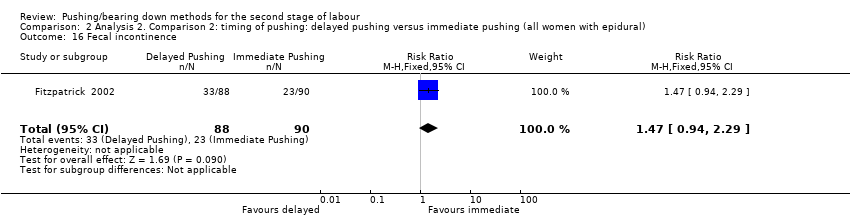 Comparison 2 Analysis 2. Comparison 2: timing of pushing: delayed pushing versus immediate pushing (all women with epidural), Outcome 16 Fecal incontinence. | ||||
| 17 Low umbilical cord pH Show forest plot | 4 | 2145 | Risk Ratio (M‐H, Fixed, 95% CI) | 2.24 [1.37, 3.68] |
| Analysis 2.17  Comparison 2 Analysis 2. Comparison 2: timing of pushing: delayed pushing versus immediate pushing (all women with epidural), Outcome 17 Low umbilical cord pH. | ||||
| 17.1 Arterial umbilical cord pH < 7.2 | 2 | 244 | Risk Ratio (M‐H, Fixed, 95% CI) | 1.84 [0.55, 6.16] |
| 17.2 Venous umbilical cord pH < 7.3 | 1 | 41 | Risk Ratio (M‐H, Fixed, 95% CI) | 1.70 [0.44, 6.66] |
| 17.3 Arterial < 7.2 and/or venous < 7.3 umbilical cord pH | 1 | 1860 | Risk Ratio (M‐H, Fixed, 95% CI) | 2.45 [1.35, 4.43] |
| 18 Total care costs (CND$) Show forest plot | 1 | Mean Difference (IV, Fixed, 95% CI) | Subtotals only | |
| Analysis 2.18 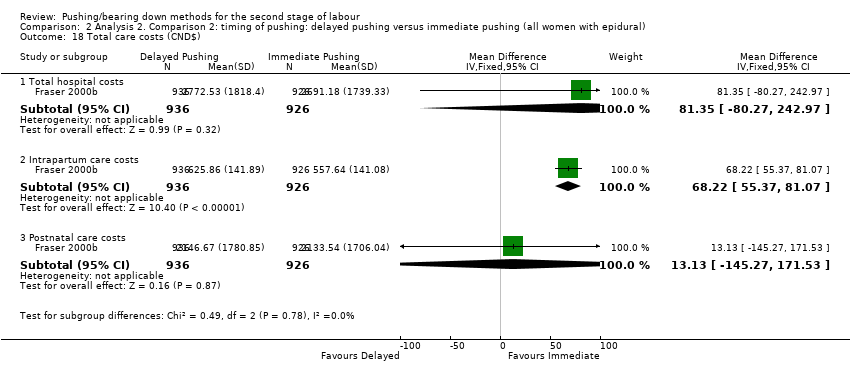 Comparison 2 Analysis 2. Comparison 2: timing of pushing: delayed pushing versus immediate pushing (all women with epidural), Outcome 18 Total care costs (CND$). | ||||
| 18.1 Total hospital costs | 1 | 1862 | Mean Difference (IV, Fixed, 95% CI) | 81.35 [‐80.27, 242.97] |
| 18.2 Intrapartum care costs | 1 | 1862 | Mean Difference (IV, Fixed, 95% CI) | 68.22 [55.37, 81.07] |
| 18.3 Postnatal care costs | 1 | 1862 | Mean Difference (IV, Fixed, 95% CI) | 13.13 [‐145.27, 171.53] |
| 19 Sensitivity analysis (trial quality): Duration of second stage (minutes) Show forest plot | 10 | 2973 | Mean Difference (IV, Random, 95% CI) | 53.46 [38.82, 68.10] |
| Analysis 2.19  Comparison 2 Analysis 2. Comparison 2: timing of pushing: delayed pushing versus immediate pushing (all women with epidural), Outcome 19 Sensitivity analysis (trial quality): Duration of second stage (minutes). | ||||
| 19.1 Nulliparous | 9 | 2809 | Mean Difference (IV, Random, 95% CI) | 52.54 [35.14, 69.93] |
| 19.2 Multiparous | 1 | 123 | Mean Difference (IV, Random, 95% CI) | 38.80 [29.16, 48.44] |
| 19.3 Mixed parity | 1 | 41 | Mean Difference (IV, Random, 95% CI) | 91.0 [50.37, 131.63] |
| 20 Sensitivity analysis (trial quality): Duration of pushing (minutes) Show forest plot | 10 | 2856 | Mean Difference (IV, Random, 95% CI) | ‐21.30 [‐34.97, ‐7.63] |
| Analysis 2.20  Comparison 2 Analysis 2. Comparison 2: timing of pushing: delayed pushing versus immediate pushing (all women with epidural), Outcome 20 Sensitivity analysis (trial quality): Duration of pushing (minutes). | ||||
| 20.1 Nulliparous | 9 | 2692 | Mean Difference (IV, Random, 95% CI) | ‐24.25 [‐40.43, ‐8.07] |
| 20.2 Multiparous | 1 | 123 | Mean Difference (IV, Random, 95% CI) | ‐11.35 [‐18.19, ‐4.51] |
| 20.3 Mixed parity | 1 | 41 | Mean Difference (IV, Random, 95% CI) | ‐2.0 [‐30.35, 26.35] |
| 21 Sensitivity analysis (median and IQR): Duration of second stage (minutes) Show forest plot | 7 | 684 | Mean Difference (IV, Random, 95% CI) | 56.48 [34.24, 78.72] |
| Analysis 2.21 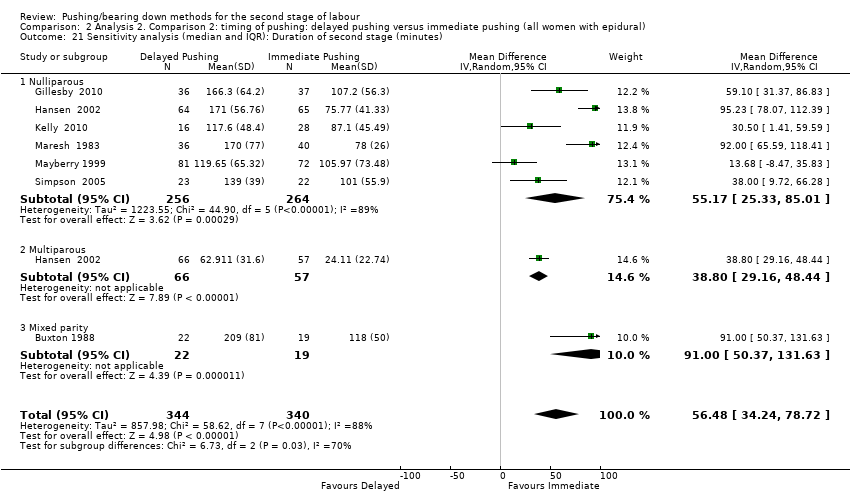 Comparison 2 Analysis 2. Comparison 2: timing of pushing: delayed pushing versus immediate pushing (all women with epidural), Outcome 21 Sensitivity analysis (median and IQR): Duration of second stage (minutes). | ||||
| 21.1 Nulliparous | 6 | 520 | Mean Difference (IV, Random, 95% CI) | 55.17 [25.33, 85.01] |
| 21.2 Multiparous | 1 | 123 | Mean Difference (IV, Random, 95% CI) | 38.80 [29.16, 48.44] |
| 21.3 Mixed parity | 1 | 41 | Mean Difference (IV, Random, 95% CI) | 91.0 [50.37, 131.63] |
| 22 Sensitivity analysis (median and IQR): Duration of pushing (minutes) Show forest plot | 6 | 531 | Mean Difference (IV, Random, 95% CI) | ‐17.22 [‐28.92, ‐5.52] |
| Analysis 2.22  Comparison 2 Analysis 2. Comparison 2: timing of pushing: delayed pushing versus immediate pushing (all women with epidural), Outcome 22 Sensitivity analysis (median and IQR): Duration of pushing (minutes). | ||||
| 22.1 Nulliparous | 5 | 367 | Mean Difference (IV, Random, 95% CI) | ‐22.51 [‐41.53, ‐3.50] |
| 22.2 Multiparous | 1 | 123 | Mean Difference (IV, Random, 95% CI) | ‐11.35 [‐18.19, ‐4.51] |
| 22.3 Mixed parity | 1 | 41 | Mean Difference (IV, Random, 95% CI) | ‐2.0 [‐30.35, 26.35] |
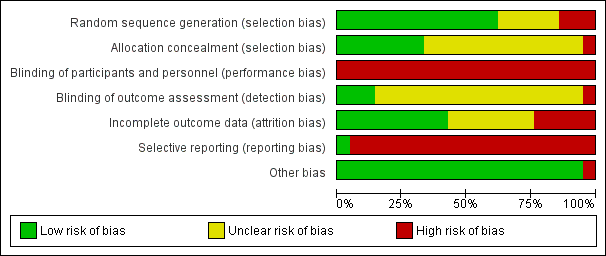
'Risk of bias' graph: review authors' judgements about each risk of bias item presented as percentages across all included studies.

'Risk of bias' summary: review authors' judgements about each risk of bias item for each included study.
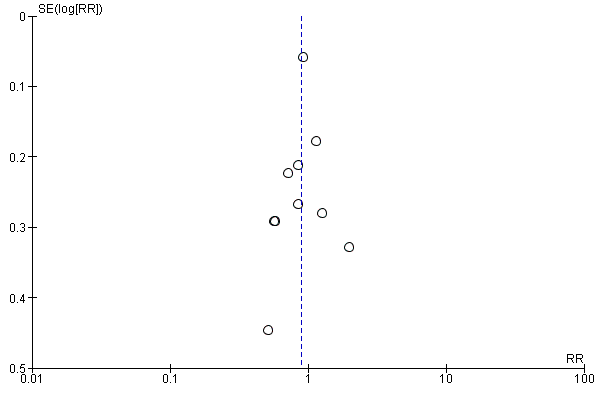
Funnel plot of comparison 2: Delayed pushing versus immediate pushing (all women with epidural), outcome: 2.10 Instrumental delivery.

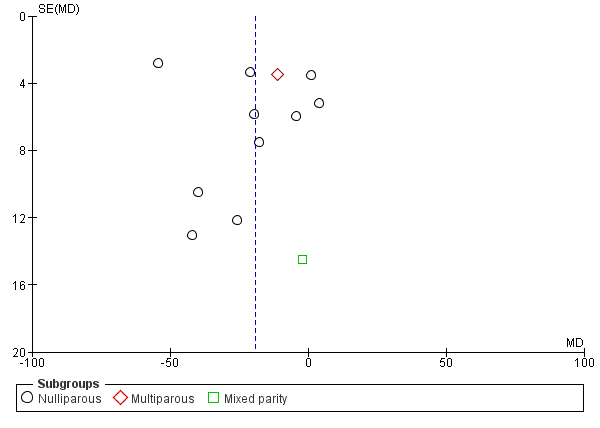
Funnel plot of comparison 2: Delayed pushing versus immediate pushing (all women with epidural), outcome: 2.1 Duration of second stage.
Funnel plot of comparison 2: Delayed pushing versus immediate pushing (all women with epidural), outcome: 2.7 Duration of Pushing.

Funnel plot of comparison 2: Delayed pushing versus immediate pushing (all women with epidural), outcome: 2.9 Spontaneous vaginal delivery.
Comparison 1 Analysis 1. Comparison 1: types of pushing: spontaneous pushing versus directed pushing, Outcome 1 Duration of second stage (minutes).
Comparison 1 Analysis 1. Comparison 1: types of pushing: spontaneous pushing versus directed pushing, Outcome 2 Perineal laceration (3rd or 4th degree).
Comparison 1 Analysis 1. Comparison 1: types of pushing: spontaneous pushing versus directed pushing, Outcome 3 Episiotomy.
Comparison 1 Analysis 1. Comparison 1: types of pushing: spontaneous pushing versus directed pushing, Outcome 4 Admission to neonatal intensive care.
Comparison 1 Analysis 1. Comparison 1: types of pushing: spontaneous pushing versus directed pushing, Outcome 5 Five‐minute Apgar score < seven.
Comparison 1 Analysis 1. Comparison 1: types of pushing: spontaneous pushing versus directed pushing, Outcome 6 Duration of pushing (minutes).
Comparison 1 Analysis 1. Comparison 1: types of pushing: spontaneous pushing versus directed pushing, Outcome 7 Oxytocin use in second stage after randomisation.
Comparison 1 Analysis 1. Comparison 1: types of pushing: spontaneous pushing versus directed pushing, Outcome 8 Spontaneous vaginal delivery.
Comparison 1 Analysis 1. Comparison 1: types of pushing: spontaneous pushing versus directed pushing, Outcome 9 Instrumental delivery.
Comparison 1 Analysis 1. Comparison 1: types of pushing: spontaneous pushing versus directed pushing, Outcome 10 Caesarean delivery.
Comparison 1 Analysis 1. Comparison 1: types of pushing: spontaneous pushing versus directed pushing, Outcome 11 Fatigue after delivery.
Comparison 1 Analysis 1. Comparison 1: types of pushing: spontaneous pushing versus directed pushing, Outcome 12 Maternal satisfaction.
Comparison 1 Analysis 1. Comparison 1: types of pushing: spontaneous pushing versus directed pushing, Outcome 13 Detrusor overactivity.
Comparison 1 Analysis 1. Comparison 1: types of pushing: spontaneous pushing versus directed pushing, Outcome 14 Urinary stress incontinence.
Comparison 1 Analysis 1. Comparison 1: types of pushing: spontaneous pushing versus directed pushing, Outcome 15 Low umbilical cord blood.
Comparison 1 Analysis 1. Comparison 1: types of pushing: spontaneous pushing versus directed pushing, Outcome 16 Delivery room resuscitation.
Comparison 1 Analysis 1. Comparison 1: types of pushing: spontaneous pushing versus directed pushing, Outcome 17 Sensitivity analysis (trial quality): Duration of second stage (minutes).
Comparison 1 Analysis 1. Comparison 1: types of pushing: spontaneous pushing versus directed pushing, Outcome 18 Sensitivity analysis (trial quality): Duration of pushing (minutes).
Comparison 2 Analysis 2. Comparison 2: timing of pushing: delayed pushing versus immediate pushing (all women with epidural), Outcome 1 Duration of second stage (minutes).
Comparison 2 Analysis 2. Comparison 2: timing of pushing: delayed pushing versus immediate pushing (all women with epidural), Outcome 2 Perineal Laceration (3rd or 4th degree).
Comparison 2 Analysis 2. Comparison 2: timing of pushing: delayed pushing versus immediate pushing (all women with epidural), Outcome 3 Episiotomy.
Comparison 2 Analysis 2. Comparison 2: timing of pushing: delayed pushing versus immediate pushing (all women with epidural), Outcome 4 Admission to neonatal intensive care.
Comparison 2 Analysis 2. Comparison 2: timing of pushing: delayed pushing versus immediate pushing (all women with epidural), Outcome 5 Five‐minute Apgar score < seven.
Comparison 2 Analysis 2. Comparison 2: timing of pushing: delayed pushing versus immediate pushing (all women with epidural), Outcome 6 Duration of pushing (minutes).
Comparison 2 Analysis 2. Comparison 2: timing of pushing: delayed pushing versus immediate pushing (all women with epidural), Outcome 7 Oxytocin use in second stage after randomisation.
Comparison 2 Analysis 2. Comparison 2: timing of pushing: delayed pushing versus immediate pushing (all women with epidural), Outcome 8 Spontaneous vaginal delivery.
Comparison 2 Analysis 2. Comparison 2: timing of pushing: delayed pushing versus immediate pushing (all women with epidural), Outcome 9 Instrumental delivery.
Comparison 2 Analysis 2. Comparison 2: timing of pushing: delayed pushing versus immediate pushing (all women with epidural), Outcome 10 Rotational or midpelvic or posterior forceps.
Comparison 2 Analysis 2. Comparison 2: timing of pushing: delayed pushing versus immediate pushing (all women with epidural), Outcome 11 Caesarean delivery.
Comparison 2 Analysis 2. Comparison 2: timing of pushing: delayed pushing versus immediate pushing (all women with epidural), Outcome 12 Postpartum haemorrhage.
Comparison 2 Analysis 2. Comparison 2: timing of pushing: delayed pushing versus immediate pushing (all women with epidural), Outcome 13 Fatigue after delivery.
Comparison 2 Analysis 2. Comparison 2: timing of pushing: delayed pushing versus immediate pushing (all women with epidural), Outcome 14 Maternal satisfaction.
Comparison 2 Analysis 2. Comparison 2: timing of pushing: delayed pushing versus immediate pushing (all women with epidural), Outcome 15 Dyspareunia.
Comparison 2 Analysis 2. Comparison 2: timing of pushing: delayed pushing versus immediate pushing (all women with epidural), Outcome 16 Fecal incontinence.
Comparison 2 Analysis 2. Comparison 2: timing of pushing: delayed pushing versus immediate pushing (all women with epidural), Outcome 17 Low umbilical cord pH.
Comparison 2 Analysis 2. Comparison 2: timing of pushing: delayed pushing versus immediate pushing (all women with epidural), Outcome 18 Total care costs (CND$).
Comparison 2 Analysis 2. Comparison 2: timing of pushing: delayed pushing versus immediate pushing (all women with epidural), Outcome 19 Sensitivity analysis (trial quality): Duration of second stage (minutes).
Comparison 2 Analysis 2. Comparison 2: timing of pushing: delayed pushing versus immediate pushing (all women with epidural), Outcome 20 Sensitivity analysis (trial quality): Duration of pushing (minutes).
Comparison 2 Analysis 2. Comparison 2: timing of pushing: delayed pushing versus immediate pushing (all women with epidural), Outcome 21 Sensitivity analysis (median and IQR): Duration of second stage (minutes).
Comparison 2 Analysis 2. Comparison 2: timing of pushing: delayed pushing versus immediate pushing (all women with epidural), Outcome 22 Sensitivity analysis (median and IQR): Duration of pushing (minutes).
| Spontaneous pushing compared to directed pushing for the second stage of labour (types of pushing) | ||||||
| Patient or population: women in the second stage of labour | ||||||
| Outcomes | Anticipated absolute effects* (95% CI) | Relative effect | № of participants | Quality of the evidence | Comments | |
| Risk with directed pushing | Risk with spontaneous pushing | |||||
| Duration of second stage (minutes) | The mean duration of second stage (minutes) was 0 | MD 10.26 higher | ‐ | 667 | ⊕⊝⊝⊝ | |
| Perineal laceration (3rd or 4th degree) | Study population | RR 0.87 | 320 | ⊕⊕⊝⊝ | ||
| 110 per 1000 | 96 per 1000 | |||||
| Admission to neonatal intensive care | Study population | RR 1.08 | 393 | ⊕⊝⊝⊝ | ||
| 20 per 1000 | 21 per 1000 | |||||
| Hypoxic ischaemic encephalopathy | Study population | ‐ | (0 study) | ‐ | Outcome not reported in the included studies under this comparison. | |
| see comment | see comment | |||||
| 5‐minute Apgar score < 7 | Study population | RR 0.35 | 320 | ⊕⊝⊝⊝ | ||
| 6 per 1000 | 2 per 1000 | |||||
| Duration of pushing (minutes) | The mean duration of pushing (minutes) was 0 | MD 9.76 lower | ‐ | 169 | ⊕⊝⊝⊝ | |
| Spontaneous vaginal delivery | Study population | RR 1.01 | 688 | ⊕⊕⊕⊝ | ||
| 922 per 1000 | 932 per 1000 | |||||
| *The risk in the intervention group (and its 95% confidence interval) is based on the assumed risk in the comparison group and the relative effect of the intervention (and its 95% CI). | ||||||
| GRADE Working Group grades of evidence | ||||||
| 1 Most studies contributing data had design limitations, with more than 40% of weight from studies with serious design limitations. (‐2) 2 Statistical Heterogeneity (I2>60%). Variation in size of effect. (‐1) 3 Wide confidence intervals crossing the line of no effect. (‐1) 4 One study with design limitations. (‐1) 5 Wide confidence intervals crossing the line of no effect and few events. (‐2) 6 One study contributing >40% of data had serious design limitations. One other study had design limitations. (‐2) 7 Wide confidence intervals just crossing the line of no effect and small sample size. (‐2) 8 Study contributing most data (46.9%) has design limitations, other studies have design limitations or serious design limitations. (‐1) 9 Although confidence intervals cross the line of no effect, the effect estimate is precise. (not downgraded) | ||||||
| Delayed pushing compared to immediate pushing (all women with epidural) for the second stage of labour (timing of pushing) | ||||||
| Patient or population: women in the second stage of labour with epidural in situ | ||||||
| Outcomes | Anticipated absolute effects* (95% CI) | Relative effect | № of participants | Quality of the evidence | Comments | |
| Risk with immediate pushing (all women with epidural) | Risk with delayed pushing | |||||
| Duration of second stage (minutes) | The mean duration of second stage (minutes) was 0 | MD 56.40 higher | ‐ | 3049 | ⊕⊝⊝⊝ | 1 trial contributing data for multiparous women, 1 trial included both nulliparous and multiparous women. |
| Perineal laceration (3rd or 4th degree) | Study population | RR 0.94 | 2775 | ⊕⊕⊕⊝ | 1 of the studies contributing data reported all lacerations (i.e. did not specify 3rd or 4th degree) | |
| 122 per 1000 | 115 per 1000 | |||||
| Admission to neonatal intensive care | Study population | RR 0.98 | 2197 | ⊕⊕⊝⊝ | ||
| 49 per 1000 | 48 per 1000 | |||||
| Hypoxic ischaemic encephalopathy | Study population | ‐ | (0 study) | ‐ | Outcome not reported in the included studies under this comparison. | |
| see comment | see comment | |||||
| 5‐minute Apgar score < 7 | Study population | RR 0.15 | 413 | ⊕⊝⊝⊝ | Only 1 trial contributing data. | |
| 10 per 1000 | 2 per 1000 | |||||
| Duration of pushing (minutes) | The mean duration of pushing (minutes) was 0 | MD 19.05 lower | ‐ | 2932 | ⊕⊝⊝⊝ | 1 trial contributing data for multiparous women, 1 trial included both nulliparous and multiparous women. |
| Spontaneous vaginal delivery | Study population | RR 1.07 | 3114 | ⊕⊕⊕⊝ | ||
| 713 per 1000 | 762 per 1000 | |||||
| *The risk in the intervention group (and its 95% confidence interval) is based on the assumed risk in the comparison group and the relative effect of the intervention (and its 95% CI). | ||||||
| GRADE Working Group grades of evidence | ||||||
| 1 All studies have design limitations, two studies contributing <40% have serious design limitations. (‐1) 2 Heterogeneity (I2>60%). Considerable variation in size of effect. (‐2) 3 Although confidence intervals cross the line of no effect, the effect estimate is precise. (not downgraded) 4 All studies have design limitations. (‐1) 5 Wide confidence intervals crossing the line of no effect. (‐1) 6 One study contributing data has design limitations. (‐1) 7 Wide confidence intervals crossing the line of no effect and very few events. (‐2) | ||||||
| Outcome or subgroup title | No. of studies | No. of participants | Statistical method | Effect size |
| 1 Duration of second stage (minutes) Show forest plot | 6 | Mean Difference (IV, Random, 95% CI) | Subtotals only | |
| 1.1 Nulliparous | 6 | 667 | Mean Difference (IV, Random, 95% CI) | 10.26 [‐1.12, 21.64] |
| 2 Perineal laceration (3rd or 4th degree) Show forest plot | 1 | 320 | Risk Ratio (M‐H, Fixed, 95% CI) | 0.87 [0.45, 1.66] |
| 3 Episiotomy Show forest plot | 2 | 420 | Risk Ratio (M‐H, Random, 95% CI) | 1.05 [0.60, 1.85] |
| 4 Admission to neonatal intensive care Show forest plot | 2 | 393 | Risk Ratio (M‐H, Fixed, 95% CI) | 1.08 [0.30, 3.79] |
| 5 Five‐minute Apgar score < seven Show forest plot | 1 | 320 | Risk Ratio (M‐H, Fixed, 95% CI) | 0.35 [0.01, 8.43] |
| 6 Duration of pushing (minutes) Show forest plot | 2 | 169 | Mean Difference (IV, Random, 95% CI) | ‐9.76 [‐19.54, 0.02] |
| 6.1 Mixed parity | 2 | 169 | Mean Difference (IV, Random, 95% CI) | ‐9.76 [‐19.54, 0.02] |
| 7 Oxytocin use in second stage after randomisation Show forest plot | 1 | 128 | Risk Ratio (M‐H, Fixed, 95% CI) | 2.20 [0.80, 6.07] |
| 8 Spontaneous vaginal delivery Show forest plot | 5 | 688 | Risk Ratio (M‐H, Fixed, 95% CI) | 1.01 [0.97, 1.05] |
| 9 Instrumental delivery Show forest plot | 2 | 393 | Risk Ratio (M‐H, Random, 95% CI) | 0.56 [0.06, 5.10] |
| 10 Caesarean delivery Show forest plot | 3 | 583 | Risk Ratio (M‐H, Random, 95% CI) | 0.79 [0.14, 4.39] |
| 11 Fatigue after delivery Show forest plot | 2 | 142 | Std. Mean Difference (IV, Random, 95% CI) | ‐1.14 [‐3.29, 1.02] |
| 12 Maternal satisfaction Show forest plot | 1 | 31 | Mean Difference (IV, Fixed, 95% CI) | 0.91 [‐1.30, 3.12] |
| 13 Detrusor overactivity Show forest plot | 1 | 128 | Risk Ratio (M‐H, Fixed, 95% CI) | 0.50 [0.18, 1.36] |
| 14 Urinary stress incontinence Show forest plot | 1 | 128 | Risk Ratio (M‐H, Fixed, 95% CI) | 0.70 [0.29, 1.69] |
| 15 Low umbilical cord blood Show forest plot | 1 | 320 | Risk Ratio (M‐H, Fixed, 95% CI) | 0.74 [0.24, 2.29] |
| 15.1 Arterial umbilical cord pH < 7.2 | 1 | 320 | Risk Ratio (M‐H, Fixed, 95% CI) | 0.74 [0.24, 2.29] |
| 15.2 Venous umbilical cord < 7.3 | 0 | 0 | Risk Ratio (M‐H, Fixed, 95% CI) | 0.0 [0.0, 0.0] |
| 16 Delivery room resuscitation Show forest plot | 2 | 352 | Risk Ratio (M‐H, Fixed, 95% CI) | 0.83 [0.40, 1.75] |
| 17 Sensitivity analysis (trial quality): Duration of second stage (minutes) Show forest plot | 4 | Mean Difference (IV, Random, 95% CI) | Subtotals only | |
| 17.1 All studies | 4 | 494 | Mean Difference (IV, Random, 95% CI) | 17.62 [5.28, 29.95] |
| 18 Sensitivity analysis (trial quality): Duration of pushing (minutes) Show forest plot | 1 | 69 | Mean Difference (IV, Random, 95% CI) | ‐15.22 [‐21.64, ‐8.80] |
| 18.1 Mixed parity | 1 | 69 | Mean Difference (IV, Random, 95% CI) | ‐15.22 [‐21.64, ‐8.80] |
| Outcome or subgroup title | No. of studies | No. of participants | Statistical method | Effect size |
| 1 Duration of second stage (minutes) Show forest plot | 11 | 3049 | Mean Difference (IV, Random, 95% CI) | 56.40 [42.05, 70.76] |
| 1.1 Nulliparous | 10 | 2885 | Mean Difference (IV, Random, 95% CI) | 56.12 [39.29, 72.96] |
| 1.2 Multiparous | 1 | 123 | Mean Difference (IV, Random, 95% CI) | 38.80 [29.16, 48.44] |
| 1.3 Mixed parity | 1 | 41 | Mean Difference (IV, Random, 95% CI) | 91.0 [50.37, 131.63] |
| 2 Perineal Laceration (3rd or 4th degree) Show forest plot | 7 | 2775 | Risk Ratio (M‐H, Fixed, 95% CI) | 0.94 [0.78, 1.14] |
| 3 Episiotomy Show forest plot | 5 | 2320 | Risk Ratio (M‐H, Fixed, 95% CI) | 0.95 [0.87, 1.04] |
| 4 Admission to neonatal intensive care Show forest plot | 3 | 2197 | Risk Ratio (M‐H, Fixed, 95% CI) | 0.98 [0.67, 1.41] |
| 5 Five‐minute Apgar score < seven Show forest plot | 3 | 413 | Risk Ratio (M‐H, Fixed, 95% CI) | 0.15 [0.01, 3.00] |
| 6 Duration of pushing (minutes) Show forest plot | 11 | 2932 | Mean Difference (IV, Random, 95% CI) | ‐19.05 [‐32.27, ‐5.83] |
| 6.1 Nulliparous | 10 | 2768 | Mean Difference (IV, Random, 95% CI) | ‐21.30 [‐36.87, ‐5.73] |
| 6.2 Multiparous | 1 | 123 | Mean Difference (IV, Random, 95% CI) | ‐11.35 [‐18.19, ‐4.51] |
| 6.3 Mixed parity | 1 | 41 | Mean Difference (IV, Random, 95% CI) | ‐2.0 [‐30.35, 26.35] |
| 7 Oxytocin use in second stage after randomisation Show forest plot | 2 | 177 | Risk Ratio (M‐H, Fixed, 95% CI) | 1.00 [0.79, 1.27] |
| 8 Spontaneous vaginal delivery Show forest plot | 12 | 3114 | Risk Ratio (M‐H, Fixed, 95% CI) | 1.07 [1.02, 1.11] |
| 8.1 Nulliparous | 11 | 2953 | Risk Ratio (M‐H, Fixed, 95% CI) | 1.07 [1.03, 1.12] |
| 8.2 Multiparous | 1 | 120 | Risk Ratio (M‐H, Fixed, 95% CI) | 1.11 [1.00, 1.24] |
| 8.3 Mixed parity | 1 | 41 | Risk Ratio (M‐H, Fixed, 95% CI) | 0.47 [0.22, 1.03] |
| 9 Instrumental delivery Show forest plot | 10 | 3007 | Risk Ratio (M‐H, Random, 95% CI) | 0.89 [0.74, 1.07] |
| 10 Rotational or midpelvic or posterior forceps Show forest plot | 5 | 2151 | Risk Ratio (M‐H, Fixed, 95% CI) | 0.82 [0.61, 1.10] |
| 11 Caesarean delivery Show forest plot | 9 | 2783 | Risk Ratio (M‐H, Fixed, 95% CI) | 0.83 [0.65, 1.05] |
| 12 Postpartum haemorrhage Show forest plot | 3 | 2199 | Risk Ratio (M‐H, Fixed, 95% CI) | 1.04 [0.86, 1.26] |
| 13 Fatigue after delivery Show forest plot | 1 | 73 | Mean Difference (IV, Fixed, 95% CI) | ‐6.40 [‐21.00, 8.20] |
| 14 Maternal satisfaction Show forest plot | 1 | 73 | Mean Difference (IV, Fixed, 95% CI) | 0.40 [‐7.34, 8.14] |
| 15 Dyspareunia Show forest plot | 1 | 162 | Risk Ratio (M‐H, Fixed, 95% CI) | 1.15 [0.63, 2.10] |
| 16 Fecal incontinence Show forest plot | 1 | 178 | Risk Ratio (M‐H, Fixed, 95% CI) | 1.47 [0.94, 2.29] |
| 17 Low umbilical cord pH Show forest plot | 4 | 2145 | Risk Ratio (M‐H, Fixed, 95% CI) | 2.24 [1.37, 3.68] |
| 17.1 Arterial umbilical cord pH < 7.2 | 2 | 244 | Risk Ratio (M‐H, Fixed, 95% CI) | 1.84 [0.55, 6.16] |
| 17.2 Venous umbilical cord pH < 7.3 | 1 | 41 | Risk Ratio (M‐H, Fixed, 95% CI) | 1.70 [0.44, 6.66] |
| 17.3 Arterial < 7.2 and/or venous < 7.3 umbilical cord pH | 1 | 1860 | Risk Ratio (M‐H, Fixed, 95% CI) | 2.45 [1.35, 4.43] |
| 18 Total care costs (CND$) Show forest plot | 1 | Mean Difference (IV, Fixed, 95% CI) | Subtotals only | |
| 18.1 Total hospital costs | 1 | 1862 | Mean Difference (IV, Fixed, 95% CI) | 81.35 [‐80.27, 242.97] |
| 18.2 Intrapartum care costs | 1 | 1862 | Mean Difference (IV, Fixed, 95% CI) | 68.22 [55.37, 81.07] |
| 18.3 Postnatal care costs | 1 | 1862 | Mean Difference (IV, Fixed, 95% CI) | 13.13 [‐145.27, 171.53] |
| 19 Sensitivity analysis (trial quality): Duration of second stage (minutes) Show forest plot | 10 | 2973 | Mean Difference (IV, Random, 95% CI) | 53.46 [38.82, 68.10] |
| 19.1 Nulliparous | 9 | 2809 | Mean Difference (IV, Random, 95% CI) | 52.54 [35.14, 69.93] |
| 19.2 Multiparous | 1 | 123 | Mean Difference (IV, Random, 95% CI) | 38.80 [29.16, 48.44] |
| 19.3 Mixed parity | 1 | 41 | Mean Difference (IV, Random, 95% CI) | 91.0 [50.37, 131.63] |
| 20 Sensitivity analysis (trial quality): Duration of pushing (minutes) Show forest plot | 10 | 2856 | Mean Difference (IV, Random, 95% CI) | ‐21.30 [‐34.97, ‐7.63] |
| 20.1 Nulliparous | 9 | 2692 | Mean Difference (IV, Random, 95% CI) | ‐24.25 [‐40.43, ‐8.07] |
| 20.2 Multiparous | 1 | 123 | Mean Difference (IV, Random, 95% CI) | ‐11.35 [‐18.19, ‐4.51] |
| 20.3 Mixed parity | 1 | 41 | Mean Difference (IV, Random, 95% CI) | ‐2.0 [‐30.35, 26.35] |
| 21 Sensitivity analysis (median and IQR): Duration of second stage (minutes) Show forest plot | 7 | 684 | Mean Difference (IV, Random, 95% CI) | 56.48 [34.24, 78.72] |
| 21.1 Nulliparous | 6 | 520 | Mean Difference (IV, Random, 95% CI) | 55.17 [25.33, 85.01] |
| 21.2 Multiparous | 1 | 123 | Mean Difference (IV, Random, 95% CI) | 38.80 [29.16, 48.44] |
| 21.3 Mixed parity | 1 | 41 | Mean Difference (IV, Random, 95% CI) | 91.0 [50.37, 131.63] |
| 22 Sensitivity analysis (median and IQR): Duration of pushing (minutes) Show forest plot | 6 | 531 | Mean Difference (IV, Random, 95% CI) | ‐17.22 [‐28.92, ‐5.52] |
| 22.1 Nulliparous | 5 | 367 | Mean Difference (IV, Random, 95% CI) | ‐22.51 [‐41.53, ‐3.50] |
| 22.2 Multiparous | 1 | 123 | Mean Difference (IV, Random, 95% CI) | ‐11.35 [‐18.19, ‐4.51] |
| 22.3 Mixed parity | 1 | 41 | Mean Difference (IV, Random, 95% CI) | ‐2.0 [‐30.35, 26.35] |