Metformina durante la inducción de la ovulación con gonadotrofinas seguida del coito programado o la inseminación intrauterina para la subfertilidad asociada con el síndrome de ovario poliquístico
References
References to studies included in this review
Jump to:
References to studies excluded from this review
Jump to:
Additional references
Jump to:
Characteristics of studies
Characteristics of included studies [ordered by study ID]
Jump to:
| Methods | Randomised, prospective, non‐blinded, single‐centre trial Method of randomisation: unclear Duration, timing and location of the trial: between December 2004 and August 2009 at 1 outpatient fertility centre in Dhaka Sample size calculation was not performed. 165 women were randomised, 110 women were randomised to FSH plus metformin or FSH solely, 55 women were randomised to CC and metformin. Up to six cycles per woman Ratio between metformin and placebo: 1:1 Intention‐to‐treat analysis was performed. | |
| Participants | 165 infertile women with CC‐resistant PCOS. Group A received CC + metformin, Group B FSH + metformin and Group C only FSH. All women had insulin resistance determined as a glucose‐to‐insulin ratio below 6.4, or a HOMA score above 47. Mean age (±SD) of women was 26.8 (5.1) for the metformin group and 27.2 (4.2) for the FSH only group. Body mass index (±SD) was 28.4 (4.5) and 29.0 (3.2), respectively. Duration of infertility (±SD) was 5.1 (3.0) and 4.7 (2.8) years, respectively. Infertility workup consisted of endocrinology, midcycle vaginal ultrasonography and progesterone measurement and semen analysis. Fasting glucose and insulin levels were measured, and a glucose tolerance test was performed. | |
| Interventions | Along with metformin, group A received CC, and group B received rFSH. Group C was treated with rFSH only. Metformin 500 mg 3 times daily (1500 mg) was administered for 4 weeks. After 4 weeks, the same dose was continued for another 6 months, along with scheduled rFSH (group B) 75 IU every alternate day, starting from day 3 of the cycle (then daily if necessary after first monitoring on day 12) until maturity of follicles or maximum of 15 doses of rFSH. Group C went without metformin and was scheduled for rFSH only 75 IU every alternate day. Dose and duration were adjusted by monitoring response on transvaginal sonography. Ovarian maturation was triggered by urinary hCG at a dosage of 10,000 IU. Metformin use continued until pregnancy test. Treatment was terminated when no response occurred with maximum dose of CC, with maximum dose of rFSH, after six ovulatory cycles with no pregnancy or after a positive pregnancy test. | |
| Outcomes | Pregnancy or live birth rate within six ovulatory cycles OHSS Ovulation rate Spontaneous abortion Ectopic pregnancy Multiple pregnancies Congenital anomalies Adverse perinatal or obstetrical complications | |
| Notes | PCOS was diagnosed according to revised Rotterdam criteria and included 2 of the following 3 findings: (1) oligo‐ or anovulation; (2) clinical and/or biochemical signs of hyperandrogenism; and (3) polycystic ovaries according to ultrasonography. Clomiphene resistance was a specific inclusion criterion. | |
| Risk of bias | ||
| Bias | Authors' judgement | Support for judgement |
| Random sequence generation (selection bias) | Unclear risk | Sequence allocation was not described. |
| Allocation concealment (selection bias) | High risk | Allocation was not described. |
| Blinding of participants and personnel (performance bias) | High risk | No blinding was performed. |
| Blinding of outcome assessment (detection bias) | High risk | No blinding was performed. |
| Incomplete outcome data (attrition bias) | Low risk | No indication of loss to follow‐up or drop‐out was reported. All randomised women were included in the analysis. |
| Selective reporting (reporting bias) | Low risk | All outcomes described in the Methods section were reported. |
| Other bias | Unclear risk | In view of insecurities around randomisation and allocation |
| Methods | Randomised, prospective, double‐blinded, multi‐centre trial Method of randomisation: computer‐generated randomisation list; further details unknown Duration, timing and location of the trial: unknown Sample size calculation was performed. 70 women were randomised. Three cycles per participant Ratio between metformin and placebo: 1:1 Intention‐to‐treat analysis was performed. | |
| Participants | 70 non‐obese insulin‐resistant primary infertile women with clomiphene‐resistant PCOS Mean age (±SD) was 26.2 (2.7) for the metformin group and 26.9 (2.8) for the placebo group. Body mass index (±SD) was 26.5 (2.7) and 26.4 (2.5), respectively. Duration of infertility (±SD) was 26.1 (4.7) and 24.8 (4.9) months, respectively. Infertility workup consisted of endocrinology, vaginal ultrasonography and semen analysis. Fasting glucose and insulin levels were measured, and a glucose tolerance test was performed. Each woman received 75 grams of glucose, and at 30, 60, 90 and 120 minutes, glucose and insulin concentrations were determined. | |
| Interventions | The women took metformin 850 mg 2 times daily or placebo for 3 months. After 3 months, ovulation induction was started. Metformin or placebo was continued during ovarian stimulation with FSH and was stopped when women conceived. All women underwent ovulation induction according to a low‐dose step‐up protocol, started with 75 IU hpFSH (fostimon) for 14 days. If no ovarian response was detected, this dose was increased by 37.5 IU hpFSH each week until follicular development was observed on ultrasonography. Maximum dose was 225 IU daily. Treatment was discontinued if no follicular response was detected after 35 days of treatment, or if more then 3 follicles > 14 mm were present. hCG was given when the diameter of the dominant follicle was > 17 mm. Women with PCOS who in previous ovulation induction failed to ovulate underwent timed intercourse, whereas those who were ovulating who did not conceive underwent intrauterine insemination. | |
| Outcomes | (Ongoing) pregnancy rate per woman OHSS Cycle cancellation Ovulation rate Number of oocytes produced per cycle Monofollicular development and multi‐follicular development. Miscarriage rate per woman Live birth rate Quantity of gonadotrophins used per woman per cycle (total dose in IU (international units)) | |
| Notes | PCOS: Diagnosis was based on National institutes of Health criteria (Zawadski and Dunaif, 1992). Insulin resistance was defined according to Legro et al (1998). Clomiphene‐resistant: failure to ovulate or conceive, ovulating during 6 previous cycles of clomiphene citrate with incremental doses of clomiphene citrate up to 150 mg/d for 5 days alone or in combination with metformin (1700 mg daily) | |
| Risk of bias | ||
| Bias | Authors' judgement | Support for judgement |
| Random sequence generation (selection bias) | Low risk | Randomisation was performed by computer‐generated randomisation list. |
| Allocation concealment (selection bias) | Unclear risk | No further information was provided. |
| Blinding of participants and personnel (performance bias) | Low risk | Women and operators were blinded for the whole treatment period. Drug and placebo were packaged in identical form in the pharmacy and were labelled according to participant number. |
| Blinding of outcome assessment (detection bias) | Low risk | Women and operators were blinded for the whole treatment period. Drug and placebo were packaged in identical form in the pharmacy and were labelled according to participant number. |
| Incomplete outcome data (attrition bias) | Low risk | No indication of loss to follow‐up or drop‐out was reported. All randomised women were included in the analysis. |
| Selective reporting (reporting bias) | Low risk | All outcomes described in the Methods section were reported. |
| Other bias | Unclear risk | Obese women were excluded. |
| Methods | Randomised, prospective, multi‐centre trial Method of randomisation: unknown Duration, timing and location of the trial: between September 2000 and December 2001 at 1 IVF centre in Turkey Sample size calculation was not performed. 32 women were randomised. No drop‐out. One cycle per participant Ratio between metformin and placebo: 1:1 Intention‐to‐treat analysis was performed. | |
| Participants | Clomiphene‐resistant women with PCOS . Women with type 1 or 2 diabetes were excluded. Mean age (±SD) was 31.8 (2.7) for the metformin group and 30.6 (3.2) for the placebo group. Body mass index (±SD) was 28.5 (3.5) and 29 (2.1), respectively. Duration of infertility (±SD) was 3.2 (0.9) and 3.8 (0.7) years, respectively. Infertility workup consisted of endocrinology, vaginal ultrasonography, hysterosalpingography or laparoscopy and semen analysis. | |
| Interventions | Women took metformin 850 mg 2 times daily or placebo for 8 weeks. Metformin was continued daily during ovarian stimulation with rFSH until the day of hCG administration. Ovulation was induced with rFSH (follitropin alpha, gonal F). Treatment was started on day 3 after a spontaneous or induced menses. Starting dose was 75 IU rFSH (SC)/d for 7 days. If no ovarian response was noted, dose was increased until ovarian response was observed on ultrasonography. Treatment was discontinued if more than 6 follicles > 17 mm were present. hCG was given when 1 follicle of 17 mm developed. Ovulation was assumed when progesterone level was > 5 ng/mL 6‐8 days after hCG. | |
| Outcomes | Ongoing pregnancy rate per woman Ovulation rate Number of oocytes produced per cycle Monofollicular development and multi‐follicular development. Miscarriage rate per woman Quantity of gonadotrophins used per woman per cycle (total dose in IU (international units)) | |
| Notes | PCOS: oligomenorrhoea and clinical or biochemical signs of hyperandrogenism Clomiphene‐resistant: failure to ovulate with incremental doses of clomiphene citrate up to 150 mg/d between 5th and 10th days of the cycle for 3 successive cycles Anovulation: progestogen levels < 5 ng/mL Oligomenorroe: fewer than 6 menstruations per year | |
| Risk of bias | ||
| Bias | Authors' judgement | Support for judgement |
| Random sequence generation (selection bias) | Unclear risk | Method of randomisation was unknown. |
| Allocation concealment (selection bias) | Unclear risk | Not stated |
| Blinding of participants and personnel (performance bias) | High risk | Blinding was not performed. |
| Blinding of outcome assessment (detection bias) | High risk | Blinding was not performed. |
| Incomplete outcome data (attrition bias) | Low risk | No indication of loss to follow‐up or drop‐out was reported. All randomised women were included in the analysis. |
| Selective reporting (reporting bias) | Unclear risk | Not sure owing to missing details |
| Other bias | Unclear risk | Not sure owing to missing details |
| Methods | Randomised, double‐blind, prospective, multi‐centre trial Method of randomisation: sealed, opaque and numbered envelopes Duration, timing and location of the trial: All women attending the outpatient clinic of the Erasmus Medical Centre (a tertiary hospital in the Netherlands) were approached between July 1999 and June 2001. Sample size calculation was performed. 20 women were randomised. One cycle per participant. One woman was pregnant with metformin alone, before ovulation induction. Two women presented with an ovarian cyst on the day on which ovulation induction should be started and were excluded from analysis. Ratio between metformin and placebo: 11:9 Intention‐to‐treat analysis was performed. | |
| Participants | Clomiphene‐resistant WHO group II anovulatory women. Women with diabetes were excluded. Median age (range) was 28 (22‐32) for the metformin group and 28 (24‐34) for the placebo group. Body mass index (range) was 38 (28‐51) and 34 (27‐44), respectively. Duration of infertility was unknown. Infertility workup consisted of endocrinology and vaginal ultrasonography. A glucose tolerance test was performed. | |
| Interventions | After initial workup and menses induced with Duphaston, women started with metformin or placebo. They took metformin 850 mg 2 times daily or placebo. Women were subsequently monitored every 1‐2 days. In cases of ovarian response, no FSH was administered. In cases of absent response 25 days after randomisation, ovulation induction with FSH (follitropin alpha, gonal F) was started. Starting dose was 50 IU rFSH (SC)/d for 7 days. If no ovarian response was noted after this period, the first dose was increased with 25 IU rFSH. A further dose increase of 37.5 IU rFSH was performed, with a maximum dosage of 225 IU rFSH daily. Metformin or placebo was continued daily during ovulation induction with rFSH until the day of hCG administration. Treatment was discontinued without follicular response after 225 IU rFSH daily, or if more than 3 follicles > 15 mm were present. hCG was given when 1 follicle of at least 18 mm developed. Ovulation was assumed with direct signs on ultrasonography. After ovulation, metformin or placebo was stopped. | |
| Outcomes | Ongoing pregnancy rate per woman Ovulation rate Number of oocytes produced per cycle Monofollicular development and multi‐follicular development Miscarriage rate per woman | |
| Notes | PCOS: peripubertal onset of oligo‐amenorrhoea, elevated serum testosterone levels and ultrasonographic evidence of polycystic ovaries Clomiphene‐resistant: failure to ovulate with incremental doses of clomiphene citrate up to 250 mg/d for 5 days Anovulation: progestogen levels < 5 ng/mL Oligomenorroe: fewer than 6 bleeding episodes per year | |
| Risk of bias | ||
| Bias | Authors' judgement | Support for judgement |
| Random sequence generation (selection bias) | Low risk | Computer‐generated list |
| Allocation concealment (selection bias) | Low risk | Randomisation was performed with sealed, opaque and numbered envelopes by the pharmacy of Erasmus University. |
| Blinding of participants and personnel (performance bias) | Low risk | Blinding was performed, but the method was unclear. |
| Blinding of outcome assessment (detection bias) | Low risk | Blinding was performed, but the method was unclear. |
| Incomplete outcome data (attrition bias) | Low risk | No indication of loss to follow‐up or drop‐out was reported. All randomised women were included in the analysis. |
| Selective reporting (reporting bias) | Low risk | All outcomes described in the Methods section were reported. |
| Other bias | Unclear risk | Very small study |
| Methods | Randomised, open‐label, prospective, multi‐centre trial Method of randomisation: computer‐generated numbers, preparation unknown Duration, timing and location of the trial: unknown Sample size calculation was not performed. 32 women were randomised. No drop‐out. One cycle per participant Ratio between metformin and placebo: 1:1 Intention‐to‐treat analysis was performed. | |
| Participants | Clomiphene‐resistant WHO group II anovulatory women. All women underwent a 75 gram oral glucose tolerance test and were shown to have normal glucose tolerance. Mean age (±SD) was 27.9.(5.6) for the metformin group and 28.4 (5.1) for the placebo group. Body mass index (±SD) was 28.6 (4.0) and 29.6 (4.8), respectively. Duration of infertility (±SD) was 57.8 (37.9) and 62.3 (41.9) months, respectively. Infertility workup consisted of endocrinology, vaginal ultrasonography, hysterosalpingography or laparoscopy. | |
| Interventions | Women took metformin 850 mg 2 times daily or placebo for 6 weeks. Metformin was continued daily during ovulation induction with rFSH until the day of hCG administration. Ovulation was induced with rFSH (follitropin alpha, gonal F). Treatment was started within 2‐5 days after spontaneous or induced menses. Starting dose was 75 IU rFSH (SC)/d for 14 days. If no ovarian response was noted after this period, a weekly increase of 37.5 IU to a maximum of 187.5 was provided. Treatment was discontinued without follicular response after 35 days of gonadotrophins, if more than 3 follicles > 15 mm were present. hCG was given when 1 follicle of 17 mm developed. Ovulation was assumed when progesterone level was > 5 ng/mL 6‐8 days after hCG. | |
| Outcomes | Ongoing pregnancy rate per woman Ovulation rate Number of oocytes produced per cycle Monofollicular development and multi‐follicular development Miscarriage rate per woman Quantity of gonadotrophins used per woman per cycle (total dose in IU (international units)) | |
| Notes | PCOS: peripubertal onset of oligo‐amenorrhoea, elevated serum testosterone levels and ultrasonographic evidence of polycystic ovaries Clomiphene‐resistant: failure to ovulate with incremental doses of clomiphene citrate up to 250 mg/d for 5 days Anovulation: progestogen levels < 5 ng/mL Oligomenorroe: fewer than 6 bleeding episodes per year | |
| Risk of bias | ||
| Bias | Authors' judgement | Support for judgement |
| Random sequence generation (selection bias) | Low risk | Randomisation was performed by computer‐generated numbers |
| Allocation concealment (selection bias) | Unclear risk | Not stated |
| Blinding of participants and personnel (performance bias) | High risk | Blinding was not performed. |
| Blinding of outcome assessment (detection bias) | High risk | Not stated |
| Incomplete outcome data (attrition bias) | Low risk | No indication of loss to follow‐up or drop‐out was reported. All randomised women were included in the analysis. |
| Selective reporting (reporting bias) | Low risk | All outcomes described in the Methods section were reported. |
| Other bias | Unclear risk | Very small study |
CC: clomiphene citrate.
FSH: follicle‐stimulating hormone.
hCG: human chorionic gonadotropin.
HOMA: Homeostasis Model Assessment.
hpFSH: human pituitary follicle‐stimulating hormone.
IVF: in vitro fertilisation.
OHSS: ovarian hyperstimulation syndrome.
PCOS: polycystic ovary syndrome.
rFSH: recombinant follicle‐stimulating hormone.
SD: standard deviation.
WHO: World Health Organization.
Characteristics of excluded studies [ordered by study ID]
Jump to:
| Study | Reason for exclusion |
| This randomised pilot study was performed to assess whether the effect of coadministration of metformin, CC and hMG was superior to that of CC plus hMG in women with CC‐resistant PCOS. Ovulation induction was provided with CC and hMG together. No woman was treated with hMG solely. | |
| Two cycles of FSH stimulation, then metformin for 1 month before a third treatment cycle vs treatment with 1500 mg of metformin/d for at least 1 month before a single cycle of FSH stimulation. All cycles of FSH were compared with 1 cycle of metformin in a relatively unfavourable group of women without pregnancy after 2 cycles of ovulation induction. | |
| Women were randomly treated with metformin 1500 mg/d orally or 4 grams myo‐inositol. No comparison was made vs placebo or no treatment. | |
| This is a retrospective, non‐randomised comparison between ovulation induction with gonadotrophin, with and without metformin. |
CC: clomiphene citrate.
FSH: follicle‐stimulating hormone.
hMG: human menopausal gonadotropin.
PCOS: polycystic ovary syndrome.
Data and analyses
| Outcome or subgroup title | No. of studies | No. of participants | Statistical method | Effect size |
| 1 Live birth rate (per woman) Show forest plot | 2 | 180 | Odds Ratio (M‐H, Random, 95% CI) | 2.31 [1.23, 4.34] |
| Analysis 1.1 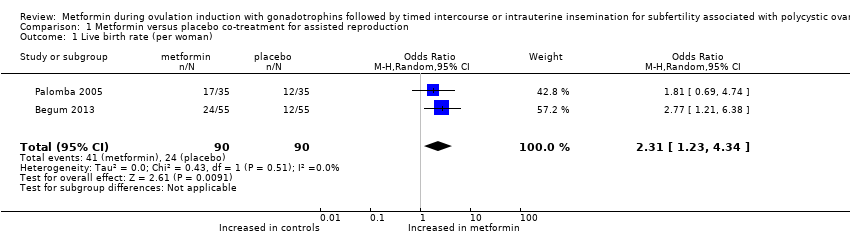 Comparison 1 Metformin versus placebo co‐treatment for assisted reproduction, Outcome 1 Live birth rate (per woman). | ||||
| 2 Multiple pregnancy rate (per woman) Show forest plot | 4 | 232 | Odds Ratio (M‐H, Fixed, 95% CI) | 0.55 [0.15, 1.95] |
| Analysis 1.2 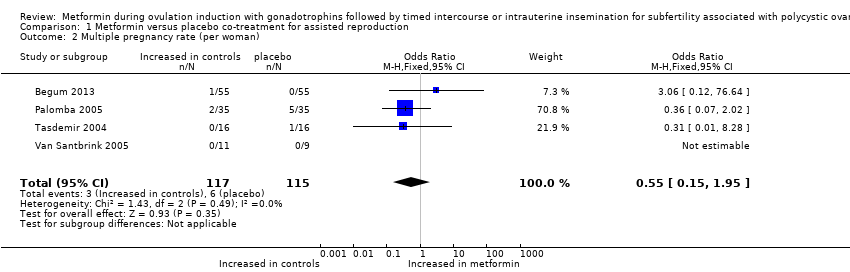 Comparison 1 Metformin versus placebo co‐treatment for assisted reproduction, Outcome 2 Multiple pregnancy rate (per woman). | ||||
| 3 Ongoing pregnancy rate (per woman) Show forest plot | 4 | 232 | Odds Ratio (M‐H, Fixed, 95% CI) | 2.46 [1.36, 4.46] |
| Analysis 1.3 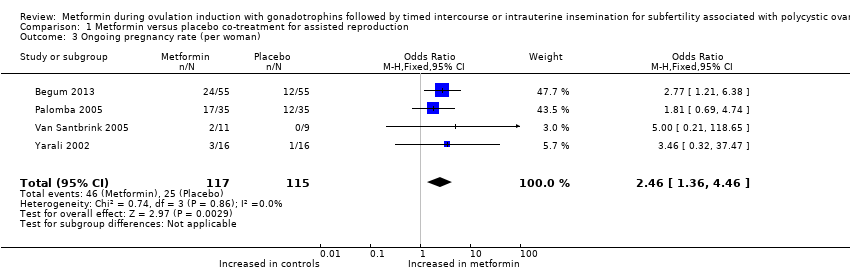 Comparison 1 Metformin versus placebo co‐treatment for assisted reproduction, Outcome 3 Ongoing pregnancy rate (per woman). | ||||
| 4 Clinical pregnancy rate Show forest plot | 5 | 264 | Odds Ratio (M‐H, Fixed, 95% CI) | 2.51 [1.46, 4.31] |
| Analysis 1.4  Comparison 1 Metformin versus placebo co‐treatment for assisted reproduction, Outcome 4 Clinical pregnancy rate. | ||||
| 5 Miscarriage rate (per clinical pregnancy) Show forest plot | 3 | 84 | Odds Ratio (M‐H, Fixed, 95% CI) | 0.62 [0.19, 2.01] |
| Analysis 1.5 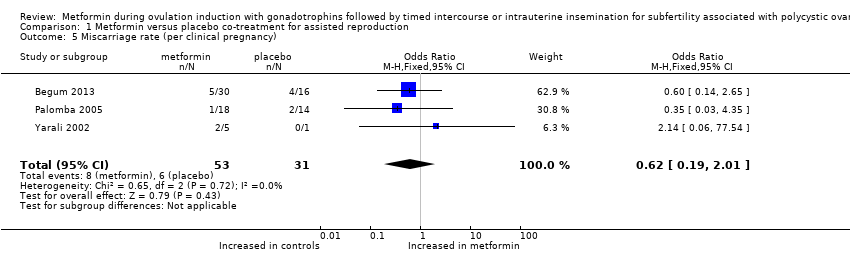 Comparison 1 Metformin versus placebo co‐treatment for assisted reproduction, Outcome 5 Miscarriage rate (per clinical pregnancy). | ||||
| 6 Ovulation rate (per started cycle) Show forest plot | 3 | Odds Ratio (M‐H, Fixed, 95% CI) | Totals not selected | |
| Analysis 1.6 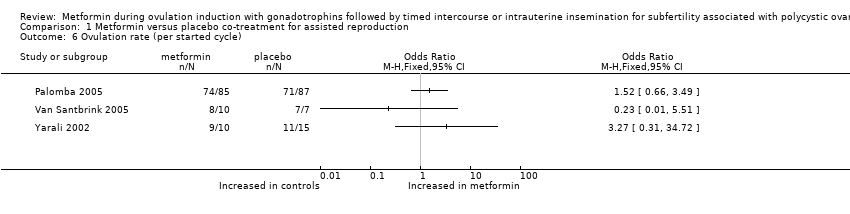 Comparison 1 Metformin versus placebo co‐treatment for assisted reproduction, Outcome 6 Ovulation rate (per started cycle). | ||||
| 7 OHSS rate (per woman) Show forest plot | 2 | 180 | Odds Ratio (M‐H, Fixed, 95% CI) | 0.32 [0.01, 8.23] |
| Analysis 1.7  Comparison 1 Metformin versus placebo co‐treatment for assisted reproduction, Outcome 7 OHSS rate (per woman). | ||||
| 8 Cycle cancellation rate (per started cycle) Show forest plot | 4 | Odds Ratio (M‐H, Fixed, 95% CI) | Totals not selected | |
| Analysis 1.8 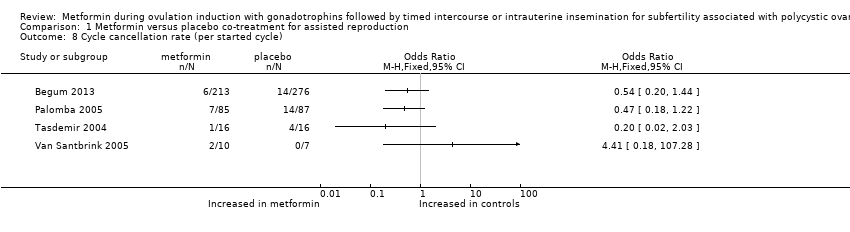 Comparison 1 Metformin versus placebo co‐treatment for assisted reproduction, Outcome 8 Cycle cancellation rate (per started cycle). | ||||
| 9 Adverse effects Show forest plot | 2 | 90 | Odds Ratio (M‐H, Fixed, 95% CI) | 1.78 [0.39, 8.09] |
| Analysis 1.9 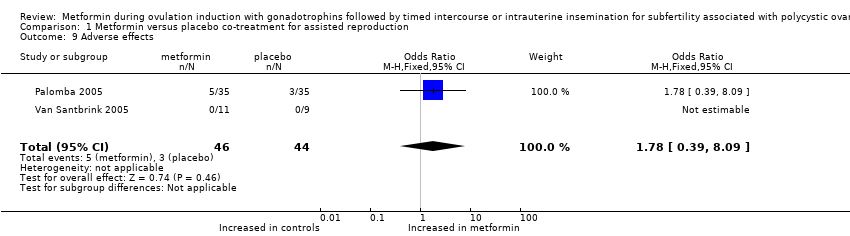 Comparison 1 Metformin versus placebo co‐treatment for assisted reproduction, Outcome 9 Adverse effects. | ||||
| 10 FSH dose per cycle Show forest plot | 4 | Mean Difference (IV, Random, 95% CI) | Totals not selected | |
| Analysis 1.10  Comparison 1 Metformin versus placebo co‐treatment for assisted reproduction, Outcome 10 FSH dose per cycle. | ||||
| 11 Duration of stimulation days per cycle Show forest plot | 5 | Mean Difference (IV, Random, 95% CI) | Totals not selected | |
| Analysis 1.11  Comparison 1 Metformin versus placebo co‐treatment for assisted reproduction, Outcome 11 Duration of stimulation days per cycle. | ||||
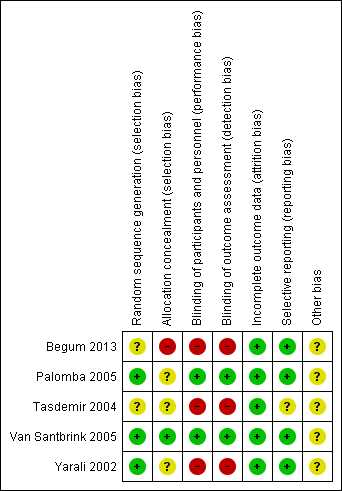
Risk of bias summary: review authors' judgements about each risk of bias item for each included study.
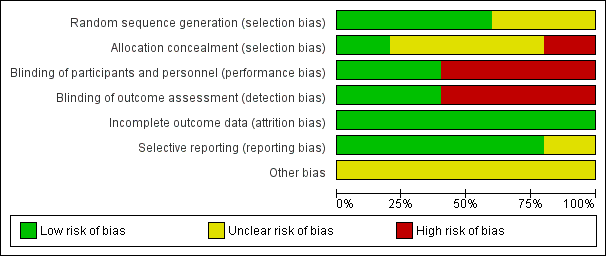
Risk of bias graph: review authors' judgements about each risk of bias item presented as percentages across all included studies.

Forest plot of comparison: 1 dichotomous outcome, outcome: 1.1 live birth rate (per woman).

Forest plot of comparison: 1 Metformin versus placebo co‐treatment for assisted reproduction, outcome: 1.2 Multiple pregnancy rate (per woman).

Forest plot of comparison: 1 Metformin versus placebo co‐treatment for assisted reproduction, outcome: 1.3 Ongoing pregnancy rate (per woman).
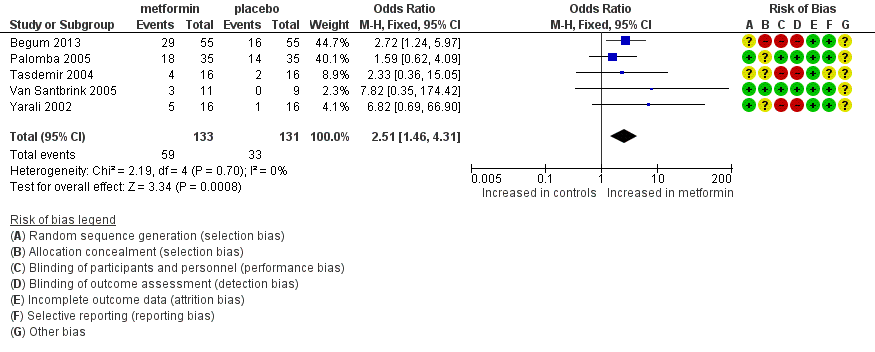
Forest plot of comparison: 1 Metformin versus placebo co‐treatment for assisted reproduction, outcome: 1.4 Clinical pregnancy rate.
Comparison 1 Metformin versus placebo co‐treatment for assisted reproduction, Outcome 1 Live birth rate (per woman).
Comparison 1 Metformin versus placebo co‐treatment for assisted reproduction, Outcome 2 Multiple pregnancy rate (per woman).
Comparison 1 Metformin versus placebo co‐treatment for assisted reproduction, Outcome 3 Ongoing pregnancy rate (per woman).
Comparison 1 Metformin versus placebo co‐treatment for assisted reproduction, Outcome 4 Clinical pregnancy rate.
Comparison 1 Metformin versus placebo co‐treatment for assisted reproduction, Outcome 5 Miscarriage rate (per clinical pregnancy).
Comparison 1 Metformin versus placebo co‐treatment for assisted reproduction, Outcome 6 Ovulation rate (per started cycle).
Comparison 1 Metformin versus placebo co‐treatment for assisted reproduction, Outcome 7 OHSS rate (per woman).
Comparison 1 Metformin versus placebo co‐treatment for assisted reproduction, Outcome 8 Cycle cancellation rate (per started cycle).
Comparison 1 Metformin versus placebo co‐treatment for assisted reproduction, Outcome 9 Adverse effects.
Comparison 1 Metformin versus placebo co‐treatment for assisted reproduction, Outcome 10 FSH dose per cycle.
Comparison 1 Metformin versus placebo co‐treatment for assisted reproduction, Outcome 11 Duration of stimulation days per cycle.
| Metformin versus placebo co‐treatment for assisted reproduction for subfertility associated with polycystic ovary syndrome | ||||||
| Patient or population: patients with subfertility associated with polycystic ovary syndrome | ||||||
| Outcomes | Illustrative comparative risks* (95% CI) | Relative effect | Number of participants | Quality of the evidence | Comments | |
| Assumed risk | Corresponding risk | |||||
| Placebo co‐treatment | Metformin co‐treatment | |||||
| Live birth rate (per woman) | 267 per 1000 | 457 per 1000 190 more per 1000 (42 to 345) | OR 2.31 | 180 | ⊕⊕⊝⊝ | |
| Multiple pregnancy rate (per woman) | 52 per 1000 | 26 per 1000 23 fewer per 1000 (44 fewer to 25 more) | OR 0.55 (0.15 to 1.95) | 232 | ⊕⊕⊝⊝ | |
| Ongoing pregnancy rate (per woman) | 217 per 1000 | 393 per 1000 189 more per 1000 (57 to 336) | OR 2.46 | 232 | ⊕⊕⊝⊝ | |
| Clinical pregnancy rate (per woman) | 252 per 1000 | 444 per 1000 206 more per 1000 (78 to 340) | OR 2.51 | 264 | ⊕⊕⊝⊝ | |
| *The basis for the assumed risk (e.g. median control group risk across studies) is provided in footnotes. The corresponding risk (and its 95% confidence interval) is based on assumed risk in the comparison group and the relative effect of the intervention (and its 95% CI). | ||||||
| GRADE Working Group grades of evidence. | ||||||
| aLimited sample size, limited precision, lack of blinding of participants and of outcome assessors. | ||||||
| Outcome or subgroup title | No. of studies | No. of participants | Statistical method | Effect size |
| 1 Live birth rate (per woman) Show forest plot | 2 | 180 | Odds Ratio (M‐H, Random, 95% CI) | 2.31 [1.23, 4.34] |
| 2 Multiple pregnancy rate (per woman) Show forest plot | 4 | 232 | Odds Ratio (M‐H, Fixed, 95% CI) | 0.55 [0.15, 1.95] |
| 3 Ongoing pregnancy rate (per woman) Show forest plot | 4 | 232 | Odds Ratio (M‐H, Fixed, 95% CI) | 2.46 [1.36, 4.46] |
| 4 Clinical pregnancy rate Show forest plot | 5 | 264 | Odds Ratio (M‐H, Fixed, 95% CI) | 2.51 [1.46, 4.31] |
| 5 Miscarriage rate (per clinical pregnancy) Show forest plot | 3 | 84 | Odds Ratio (M‐H, Fixed, 95% CI) | 0.62 [0.19, 2.01] |
| 6 Ovulation rate (per started cycle) Show forest plot | 3 | Odds Ratio (M‐H, Fixed, 95% CI) | Totals not selected | |
| 7 OHSS rate (per woman) Show forest plot | 2 | 180 | Odds Ratio (M‐H, Fixed, 95% CI) | 0.32 [0.01, 8.23] |
| 8 Cycle cancellation rate (per started cycle) Show forest plot | 4 | Odds Ratio (M‐H, Fixed, 95% CI) | Totals not selected | |
| 9 Adverse effects Show forest plot | 2 | 90 | Odds Ratio (M‐H, Fixed, 95% CI) | 1.78 [0.39, 8.09] |
| 10 FSH dose per cycle Show forest plot | 4 | Mean Difference (IV, Random, 95% CI) | Totals not selected | |
| 11 Duration of stimulation days per cycle Show forest plot | 5 | Mean Difference (IV, Random, 95% CI) | Totals not selected | |