Recuento plaquetario, longitud del bazo y cociente recuento plaquetario/longitud del bazo para el diagnóstico de las várices esofágicas en pacientes con hepatopatías crónicas o trombosis de la vena portal
Appendices
Appendix 1. Search strategies
| Database | Time span | Search strategy |
| Cochrane Hepato‐Biliary Group Controlled Trials Register | June 2016 | ((((platelet* or thrombocyt*) near (count or distribution or volume)) or PLT or PDW or MPV) OR (((splenic* or spleen*) near3 (enlarg* or hypertroph or length or palpable or size or diamet* or index or examin*)) or splenomegal*)) AND (*esophag* near3 (varic* or varix*)) |
| Cochrane Hepato‐Biliary Diagnostic Test of Accuracy Studies Register | June 2016 | ((((platelet* or thrombocyt*) near (count or distribution or volume)) or PLT or PDW or MPV) OR (((splenic* or spleen*) near3 (enlarg* or hypertroph or length or palpable or size or diamet* or index or examin*)) or splenomegal*)) AND (*esophag* near3 (varic* or varix*)) |
| The Cochrane Library | 2016, Issue 6 | #1 MeSH descriptor: [Platelet Count] explode all trees #2 ((platelet* or thrombocyt*) near (count or distribution or volume)) or PLT or PDW or MPV #3 #1 or #2 #4 MeSH descriptor: [Splenomegaly] explode all trees #5 ((splenic* or spleen*) near/3 (enlarg* or hypertroph or length or palpable or size or diamet* or index or examin*)) or splenomegal* #6 #4 or #5 #7 MeSH descriptor: [Esophageal and Gastric Varices] explode all trees #8 *esophag* near/3 (varic* or varix*) #9 #7 or #8 #10 (#3 or #6) and #9 |
| MEDLINE (OvidSP) | 1946 to June 2016. | 1. exp Platelet Count/ 2. (((platelet* or thrombocyt*) adj (count or distribution or volume)) or PLT or PDW or MPV).mp. [mp=title, abstract, original title, name of substance word, subject heading word, keyword heading word, protocol supplementary concept word, rare disease supplementary concept word, unique identifier] 3. 1 or 2 4. exp Splenomegaly/ 5. (((splenic* or spleen*) adj3 (enlarg* or hypertroph or length or palpable or size or diamet* or index or examin*)) or splenomegal*).mp. [mp=title, abstract, original title, name of substance word, subject heading word, keyword heading word, protocol supplementary concept word, rare disease supplementary concept word, unique identifier] 6. 4 or 5 7. (Esophageal and Gastric Varices).mp. [mp=title, abstract, original title, name of substance word, subject heading word, keyword heading word, protocol supplementary concept word, rare disease supplementary concept word, unique identifier] 8. ((esophag* or oesophag*) adj3 (varic* or varix*)).mp. [mp=title, abstract, original title, name of substance word, subject heading word, keyword heading word, protocol supplementary concept word, rare disease supplementary concept word, unique identifier] 9. 7 or 8 10. (3 or 6) and 9 |
| Embase (OvidSP) | 1974 to June 2016 | 1. exp thrombocyte count/ 2. (((platelet* or thrombocyt*) adj (count or distribution or volume)) or PLT or PDW or MPV).mp. [mp=title, abstract, heading word, drug trade name, original title, device manufacturer, drug manufacturer, device trade name, keyword] 3. 1 or 2 4. exp splenomegaly/ 5. (((splenic* or spleen*) adj3 (enlarg* or hypertroph or length or palpable or size or diamet* or index or examin*)) or splenomegal*).mp. [mp=title, abstract, heading word, drug trade name, original title, device manufacturer, drug manufacturer, device trade name, keyword] 6. 4 or 5 7. exp esophagus varices/ 8. ((esophag* or oesophag*) adj3 (varic* or varix*)).mp. [mp=title, abstract, heading word, drug trade name, original title, device manufacturer, drug manufacturer, device trade name, keyword] 9. 7 or 8 10. (3 or 6) and 9 |
| Science Citation Index ‐ Expanded | 1900 to June 2016 | #5 #4 AND #3 #4 TS=(*esophag* NEAR/3 (varic* or varix*)) #3 #2 OR #1 #2 TS=(((splenic* or spleen*) NEAR/3 (enlarg* or hypertroph or length or palpable or size or diamet* or index or examin*)) or splenomegal*) #1 TS=(((platelet* or thrombocyt*) NEAR (count or distribution or volume)) or PLT or PDW or MPV) |
Appendix 2. QUADAS‐2
| Domain | 1. Participant selection | 2. Index test | 3. Reference standard | 4. Flow and timing |
| Signalling questions and criteria | Q.1: "Was a consecutive or random sample of participants enrolled?" Yes ‐ If the study reports on a consecutive or a random selection of participants. No ‐ if the study reports on another form of selection of participants. Unclear ‐ if the study does not report on how the participants were enrolled. Q.2: "Was a case‐control design avoided?" Yes ‐ if the case‐control design was avoided. No ‐ if the study was a case‐control. Unclear ‐ if the study design was not clear. Q.3: "Did the study avoid inappropriate exclusions?" Yes ‐ if the study definitions of exclusion criteria are appropriate (i.e. previous bleeding or treatment for oesophageal varices) and all exclusions are reported. No ‐ if exclusion criteria are inappropriate and exclusions are not reported. Unclear ‐ if the study does not report causes of exclusions. | Q.1: "Were the index test results interpreted without knowledge of the results of the reference standard?" Yes ‐ if the study reports that results of the index test were interpreted without the knowledge of results of the reference standard. No ‐ if the study reports that results of the index test were interpreted with results of the reference standard. Unclear ‐ if the study does not report information about blinding of results of the index test and reference standard. Q.2: "If a threshold was used, was it prespecified?" Yes ‐ if the threshold used was reported in the methods section. No ‐ if the study reports that the threshold was chosen during the data analysis stage (e.g. maximum of Youden index). Unclear ‐ if the study does not report information about threshold selection. | Q.1: "Is the reference standard likely to correctly classify the target condition?" Yes ‐ if the reference standard correctly classifies oesophageal varices (according to common grading scores or systems detailed in "Reference Standard" section). No ‐ if there is some doubt whether the reference standard classifies oesophageal varices. Unclear ‐ if the study does not report on the reference standard used. Q.2: "Were the reference standard results interpreted without knowledge of results of the index test?" Yes ‐ if the study reports that results of the reference standard were interpreted without knowledge of results of the index test. No ‐ if the study reports that results of the reference standard were interpreted with results of the test index. Unclear ‐ if the study does not report information about blinding of results of the reference standard and the index test. | Q.1: "Was there an appropriate interval between the index test and the reference standard?" Yes ‐ if the interval between the index test and the reference standard was less than 3 months. No ‐ if the interval was longer than 3 months. Unclear ‐ if the study does not report the interval between the index test and the reference standard. Q.2: "Did all participants receive the same reference standard?" Yes ‐ if the study has only one reference standard for all participants (OGD with appropriate classification of oesophageal varices). No ‐ if the study has more than one reference standard. Unclear‐ if the study is not clear about the reference standard used. Q.3 "Were all participants included in the analysis?" Yes ‐ if all enrolled participants were included in the analysis (even in the case of uninterpretable index test result). No ‐ if any participant was excluded from the analysis for any reason. Unclear ‐ if it is not clear about exclusions of participants from the analysis. |
| Risk of bias | Could the selection of participants have introduced bias? Low risk: "Yes" for all signalling questions. High risk: "No" or "Unclear" for at least one signalling question. | Could the conduct or interpretation of the index test have introduced bias? Low risk: "Yes" for the signalling question. High risk: "No" or "Unclear" for the signalling question. | Could the reference standard, its conduct, or its interpretation have introduced bias? Low risk: "Yes" for all signalling questions. High risk: "No" or "Unclear" for at least one signalling question. | Could the participant flow have introduced bias? Low risk: "Yes" for all signalling questions. High risk: "No" or "Unclear" for at least one signalling question. |
| Concerns about applicability | Are there concerns that the included participants and setting do not match the review question? Low concern: Participants included in the review represent participants for whom the test is used in clinical practice. High concern: Participants included in the review differ from participants for whom the test is used in clinical practice. | Are there concerns that the index test, its conduct, or interpretation differ from the review question? High concern: The index test, its conduct, or interpretation of the index test differs from the way it is used in clinical practice. Low concern: The index test, its conduct, or interpretation of the index test does not differ from the way it is used in clinical practice. | Are there concerns that the target condition as defined by the reference standard does not match the question? | ‐ |


Methodological quality of the 71 included studies.
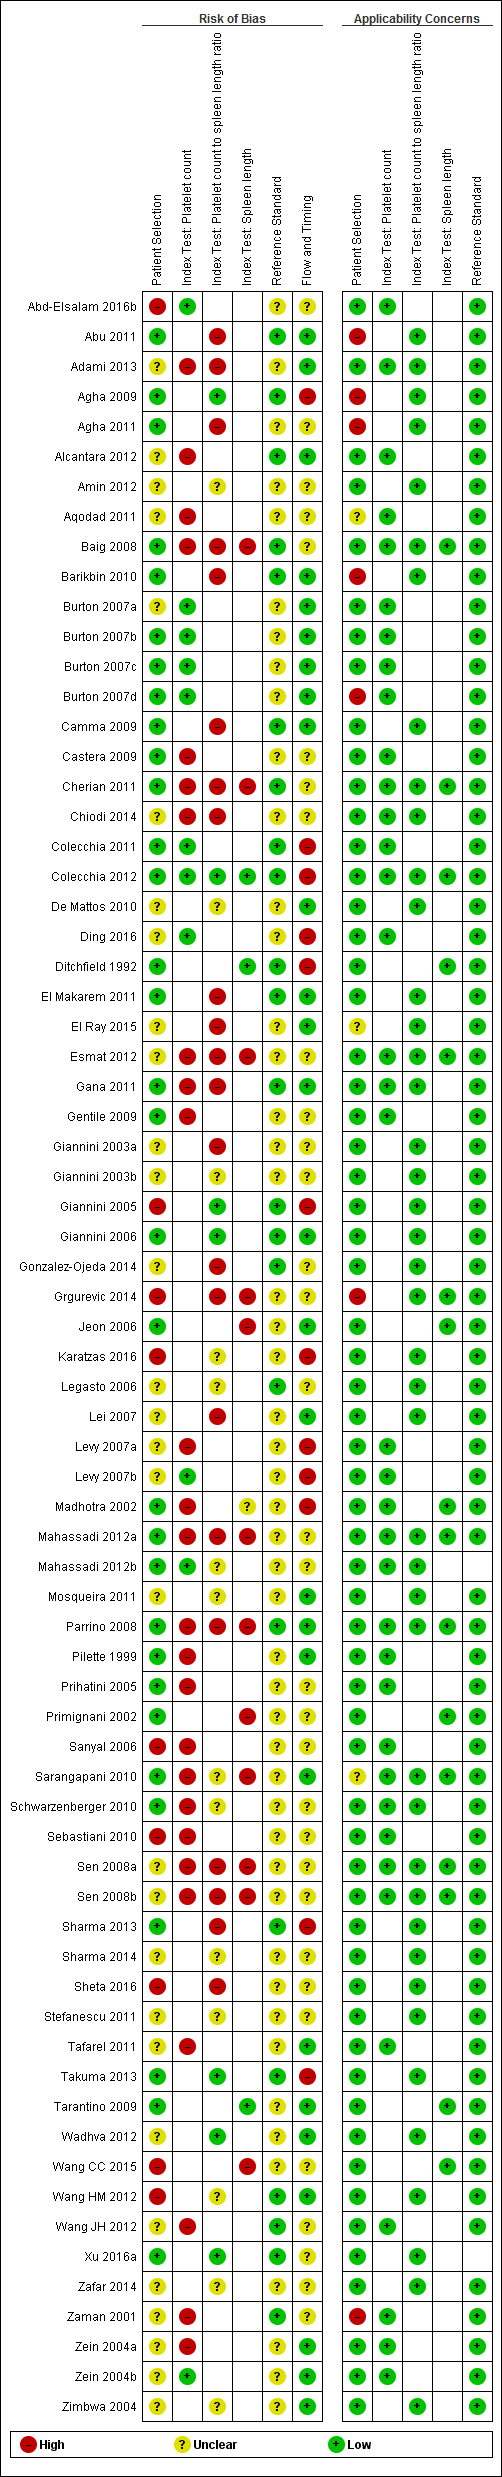
Quality assessment summary: review authors' judgements about each risk of bias item for each included study.
Not all of the included studies considered all three index tests. Cells are empty when an index test was not considered in a study.
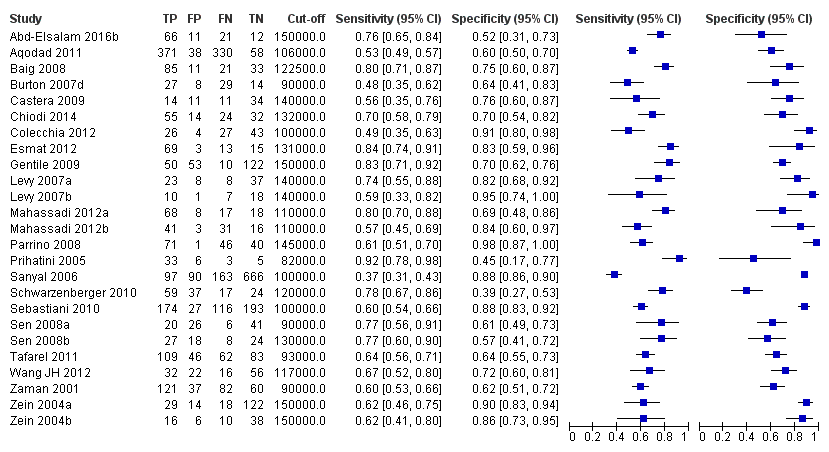
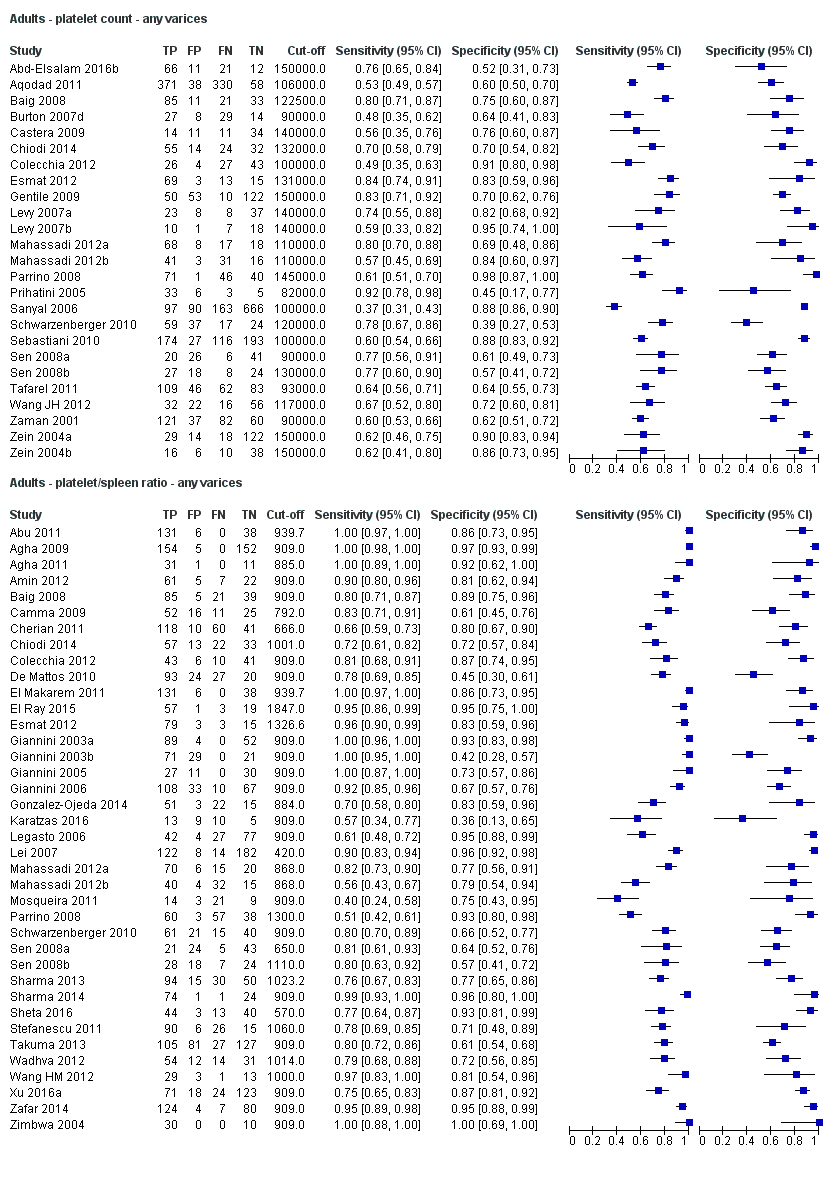
Forest plot. Adult participants ‐ platelet count ‐ any varices.
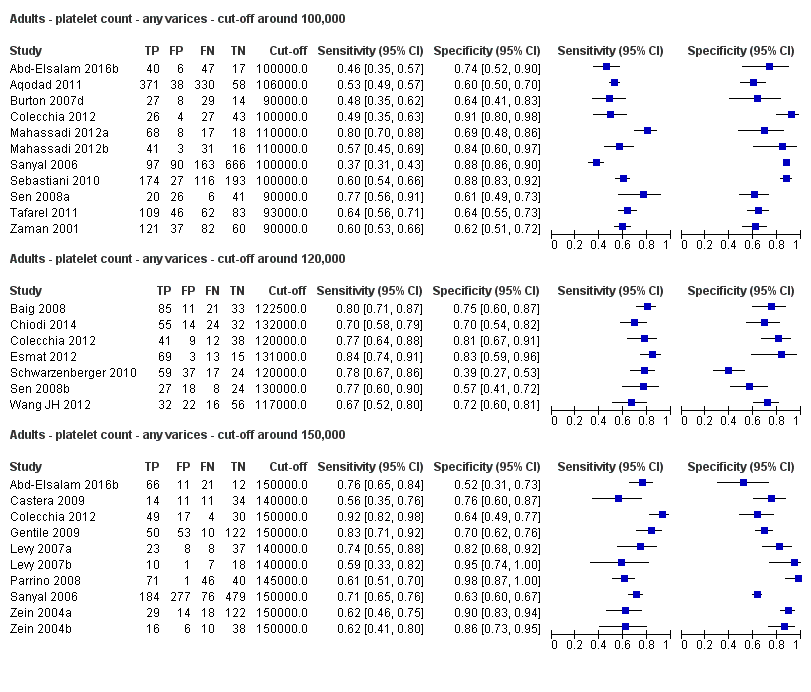
Forest plots. Adult participants ‐ platetelet count ‐ various cut‐off values ‐ any varices.

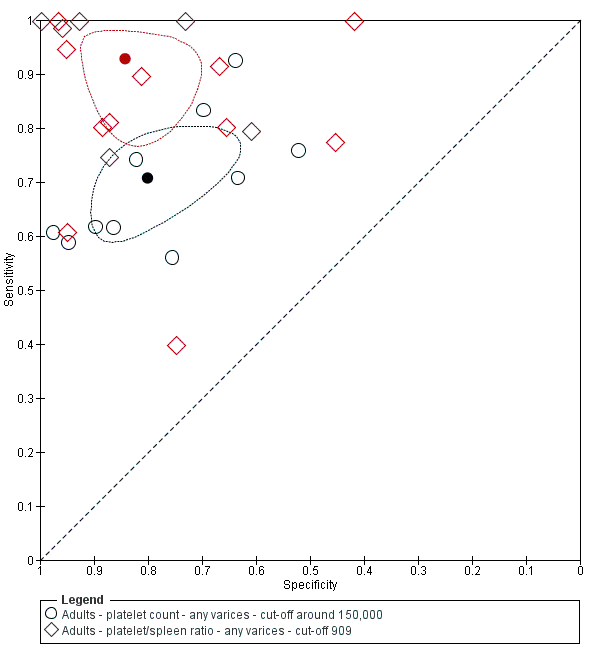
Studies in the ROC space. Adult participants ‐ platelet count ‐ various cut‐off values ‐ any varices.

Forest plot. Adult participants ‐ spleen length ‐ any varices.

Forest plots. Adult participants ‐ spleen length ‐ any varices: various cut‐off values.

Studies in the ROC space. Adult participants ‐ spleen length ‐ any varices: various cut‐off values.
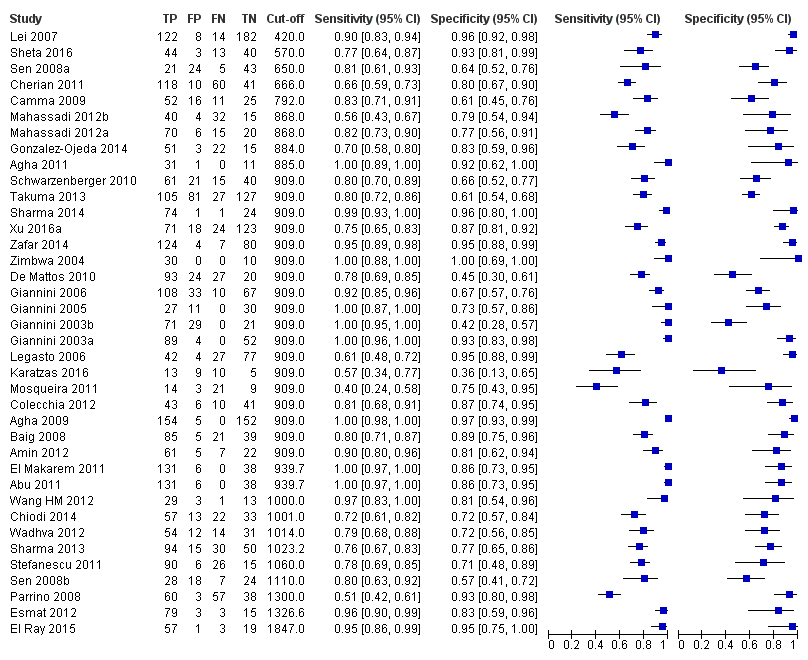
Forest plot. Adult participants ‐ platelet count‐to‐spleen length ratio ‐ any varices.
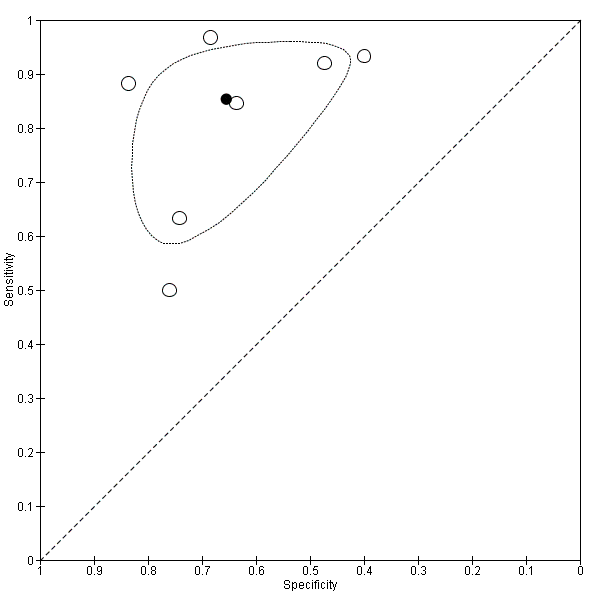
Studies in the ROC space. Adult participants ‐ platelet count‐to‐spleen length ratio. Only studies with a cut‐off value of 909 (n/mm3)/mm ‐ any varices.

Indirect comparison. Forest plot. Adult participants ‐ platelet count compared with spleen length ‐ any varices.
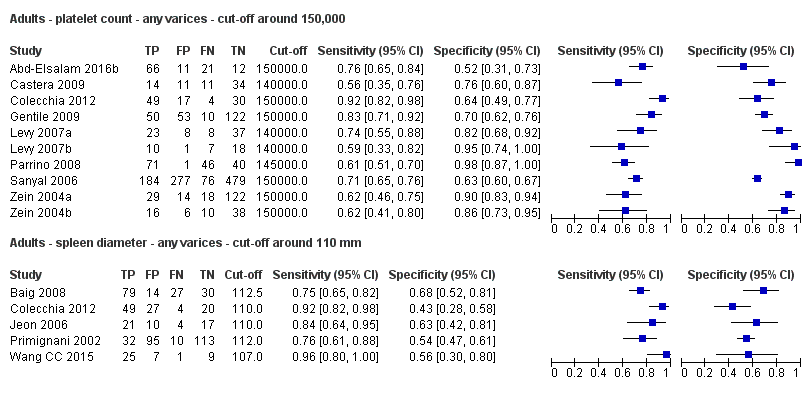
Forest plot. Indirect comparison. Adult participants ‐ platelet count (cut‐off around 150,000) compared with spleen length (cut‐off around 110 mm) ‐ any varices.
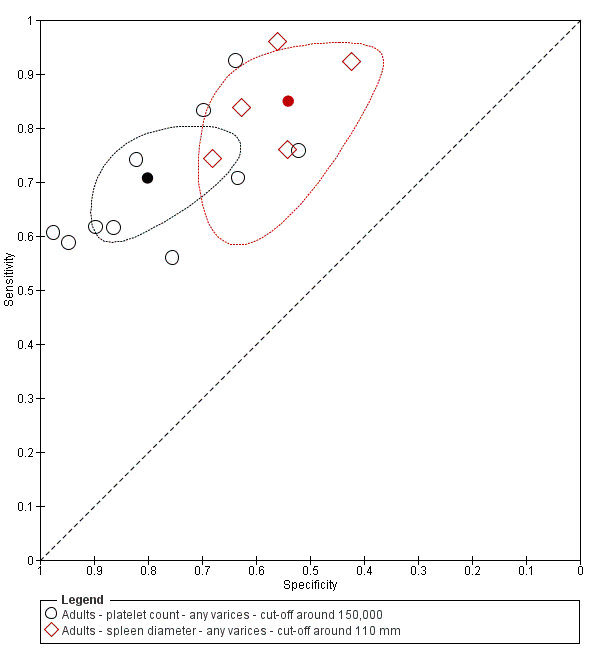
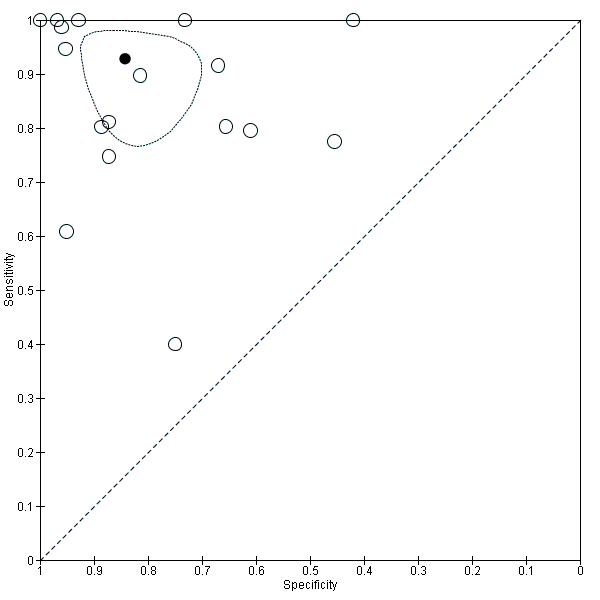
Indirect comparison. Studies in the ROC space. Adult participants ‐ platelet count (cut‐off around 150,000) compared with spleen length (cut‐off around 110 mm) ‐ any varices.
Indirect comparison. Forest plots. Adult participants ‐ platelet count compared with platelet count‐to‐spleen length ratio ‐ any varices.
Direct comparison. Forest plots. Adult participants ‐ platelet count compared with platelet count‐to‐spleen length ratio ‐ any varices.
Indirect comparison. Forest plots. Adult participants ‐ platelet count (cut‐off around 150.000/mm3) compared with platelet count‐to‐spleen length ratio (cut‐off 909 (n/mm3)/mm) ‐ any varices.
Indirect comparison. Studies in the ROC space. Adult participants ‐ platelet count (cut‐off around 150.000) compared with platelet count‐to‐spleen length ratio (cut‐off 909 (n/mm3)/mm) ‐ any varices.

Indirect comparison. Forest plots. Adult participants ‐ platelet count‐to‐spleen length ratio compared with spleen length ‐ any varices.
Indirect comparison. Forest plots. Adult participants ‐ platelet count‐to‐spleen length ratio (cut‐off 909 (n/mm3)/mm) compared with spleen length (cut‐off around 110) ‐ any varices.

Indirect comparison. Studies in the ROC space. Adult participants ‐ platelet count‐to‐spleen length ratio (cut‐off 909 (n/mm3)/mm) compared with spleen length (cut‐off around 110 mm) ‐ any varices.

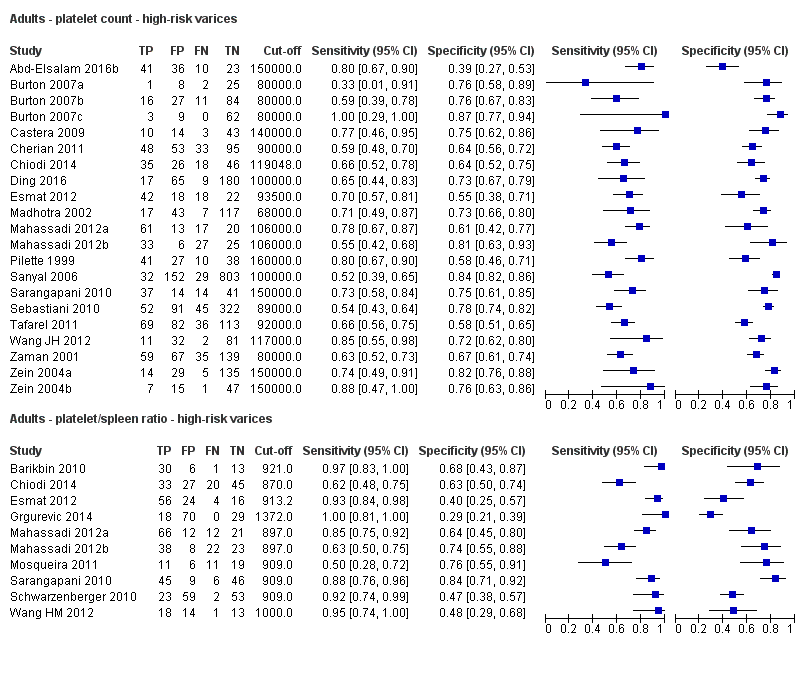
Forest plot. Adult participants ‐ platelet count ‐ high‐risk varices.

Forest plots. Adult participants ‐ platelet count ‐ various cut‐off values ‐ high‐risk varices.

Studies in the ROC space. Adult participants ‐ platelet count ‐ various cut‐off values ‐ high‐risk varices.
Forest plot. Adult participants ‐ spleen length ‐ high‐risk varices.

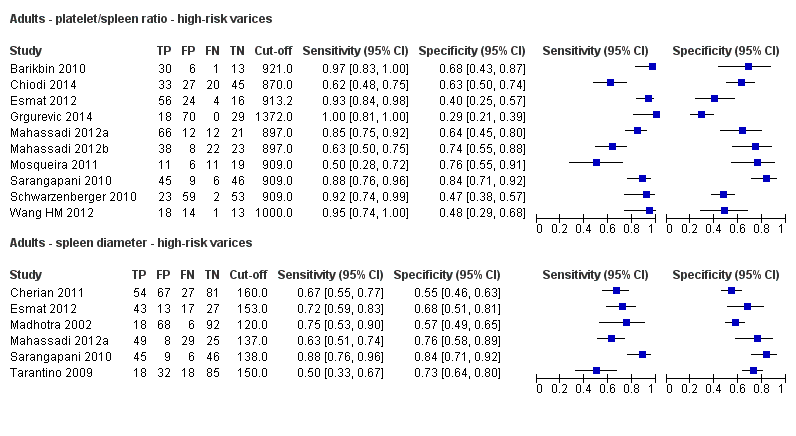
Forest plot. Adult participants ‐ platelet count‐to‐spleen length ratio ‐ high‐risk varices.

Forest plot. Adult participants ‐ platelet count‐to‐spleen length ratio ‐ cut‐off around 909 (n/mm3)/mm ‐ high‐risk varices.
Studies in the ROC space. Adult participants ‐ platelet count‐to‐spleen length ratio ‐ cut‐off around 909 (n/mm3)/mm ‐ high‐risk varices.

Indirect comparison. Forest plot. Adult participants ‐ platelet count compared with spleen length ‐ high‐risk varices.
Indirect comparison. Forest plots. Adult participants ‐ platelet count compared with platelet count‐to‐spleen length ratio ‐ high‐risk varices.

Direct comparison. Forest plots. Adult participants ‐ platelet count compared with platelet count‐to‐spleen length ratio ‐ high‐risk varices.

Indirect comparison. Forest plots. Adult participants ‐ platelet count (cut‐off around 150.000/mm3) compared with platelet count‐to‐spleen length ratio (cut‐off 909 (n/mm3)/mm) ‐ high‐risk varices.

Indirect comparison. Studies in the ROC space. Adult participants ‐ platelet count (cut‐off around 150,000/mm3) compared with platelet count‐to‐spleen length ratio (cut‐off 909 (n/mm3)/mm) ‐ high‐risk varices.
Indirect comparison. Forest plots. Adult participants ‐ platelet count‐to‐spleen length ratio compared with spleen length ‐ high‐risk varices.

Forest plot. Paediatric participants ‐ platelet count ‐ any varices.

Forest plot. Paediatric participants ‐ platelet count‐to‐spleen length z‐score ratio ‐ any varices.
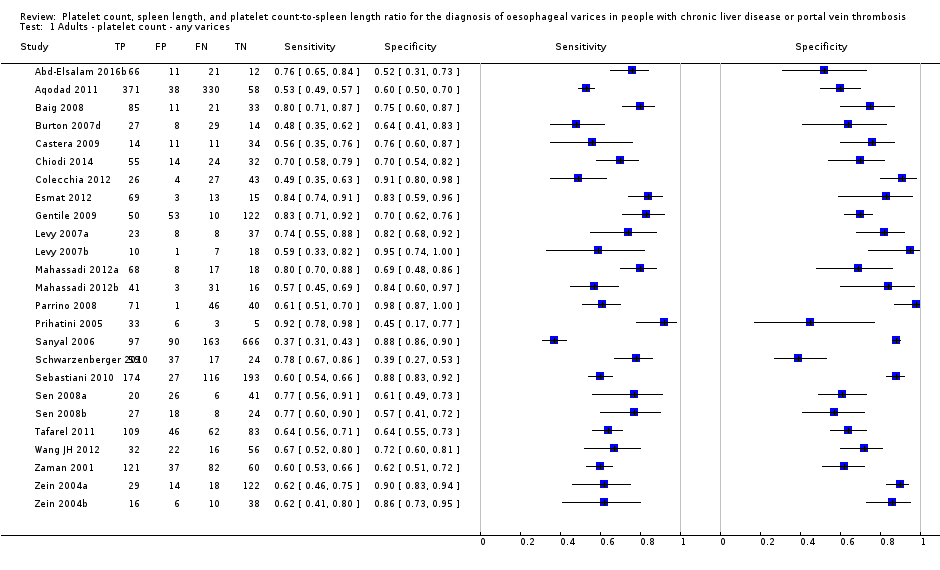
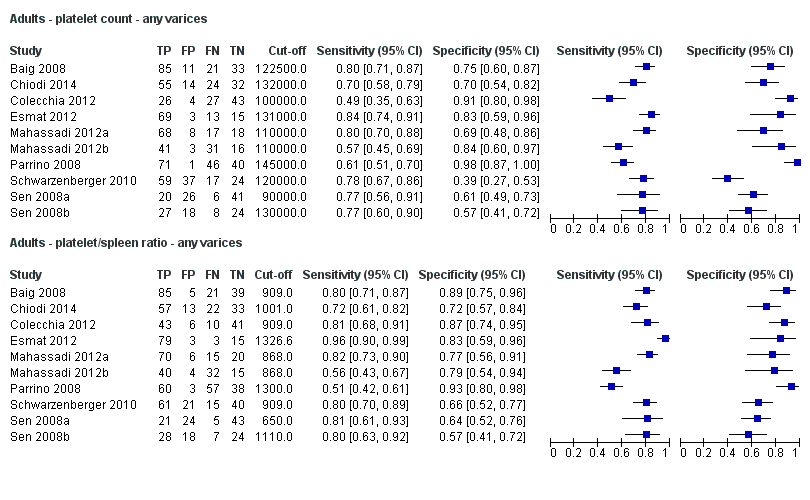
Adults ‐ platelet count ‐ any varices.

Adults ‐ platelet count ‐ any varices ‐ cut‐off around 100,000.

Adults ‐ platelet count ‐ any varices ‐ cut‐off around 120,000.
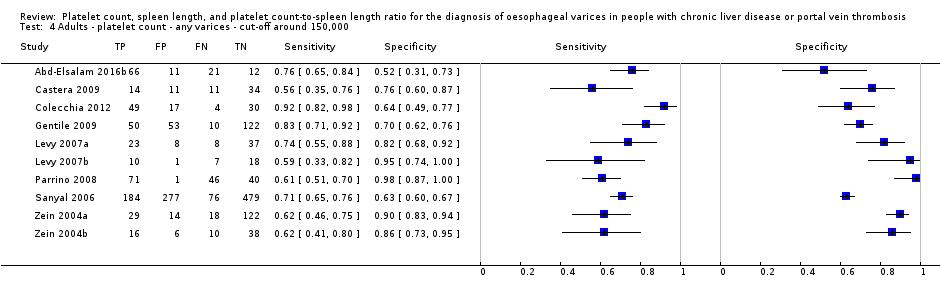
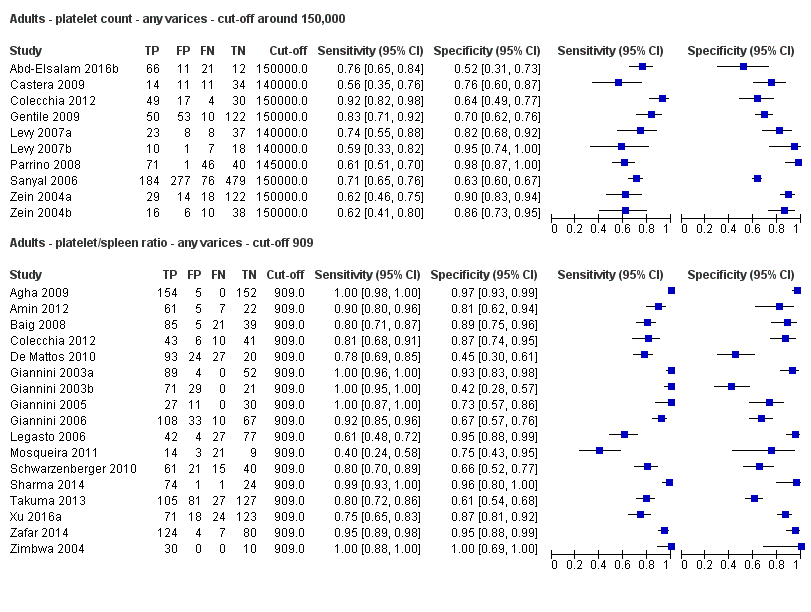
Adults ‐ platelet count ‐ any varices ‐ cut‐off around 150,000.
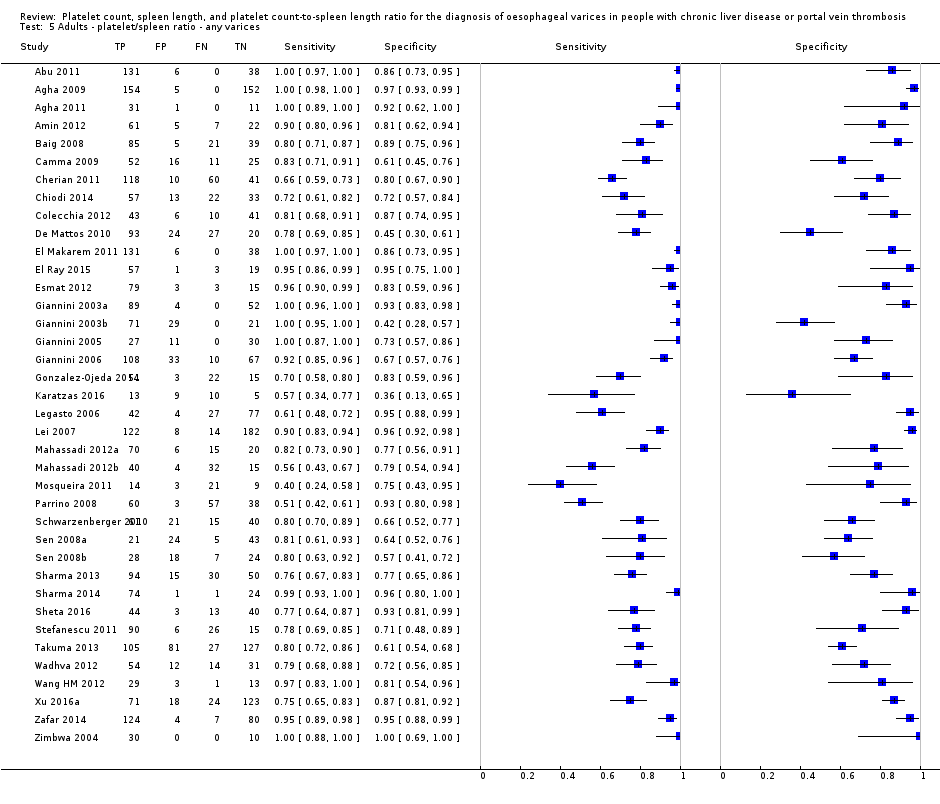
Adults ‐ platelet/spleen ratio ‐ any varices.

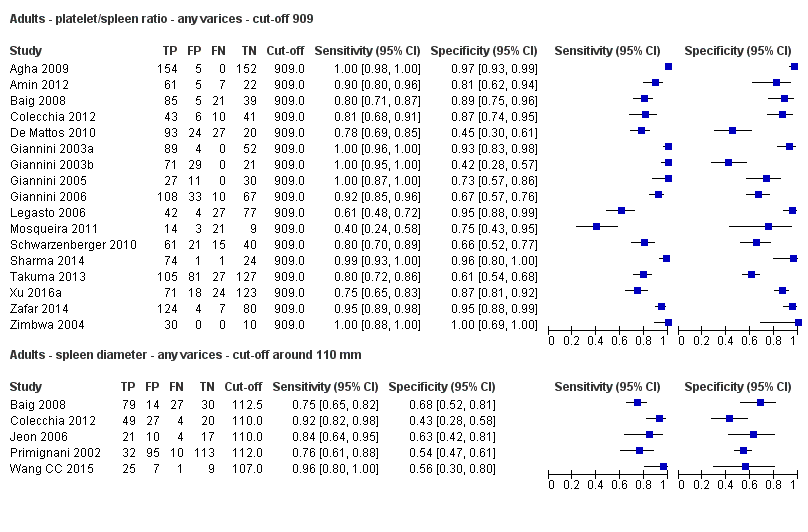
Adults ‐ platelet/spleen ratio ‐ any varices ‐ cut‐off 909.
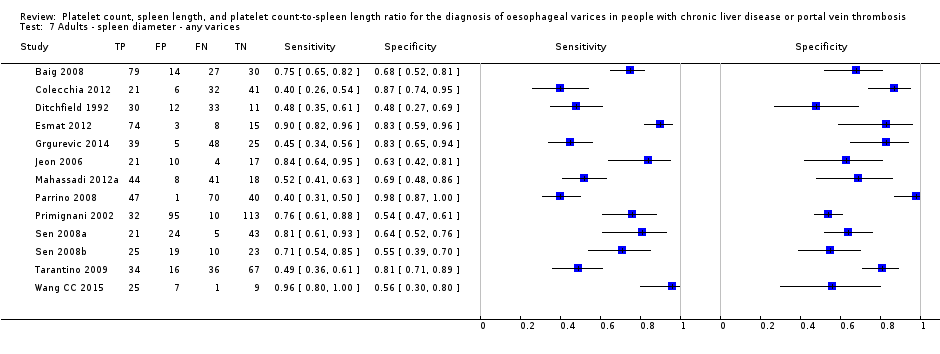
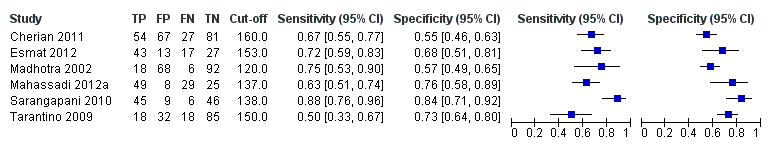
Adults ‐ spleen diameter ‐ any varices.

Adults ‐ spleen diameter ‐ any varices ‐ cut‐off around 110 mm.
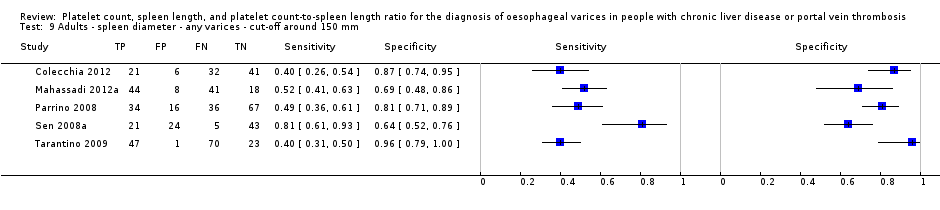
Adults ‐ spleen diameter ‐ any varices ‐ cut‐off around 150 mm.
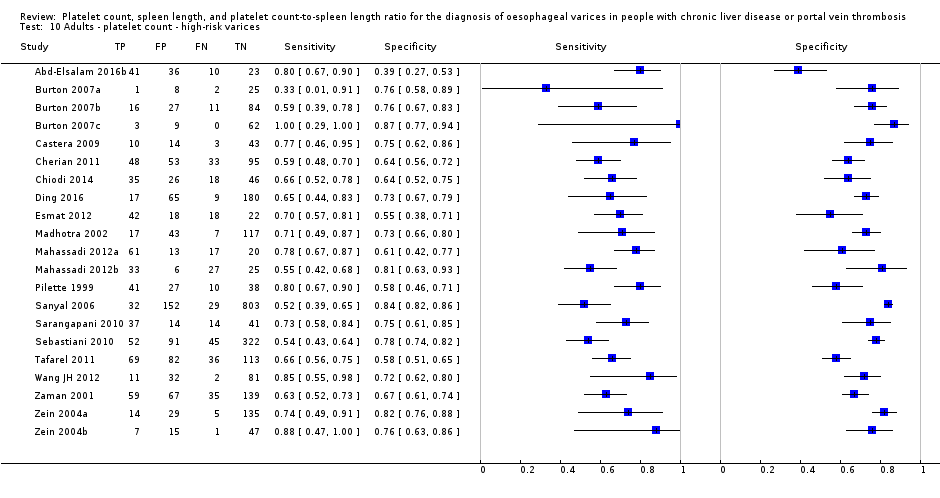
Adults ‐ platelet count ‐ high‐risk varices.

Adults ‐ platelet count ‐ high‐risk varices ‐ cut‐off around 90,000.

Adults ‐ platelet count ‐ high‐risk varices ‐ cut‐off around 150,000.

Adults ‐ platelet/spleen ratio ‐ high‐risk varices.

Adults ‐ platelet/spleen ratio ‐ high‐risk varices ‐ cut‐off around 909.
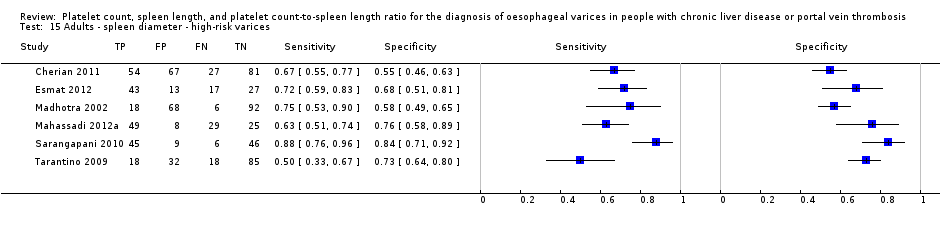
Adults ‐ spleen diameter ‐ high‐risk varices.
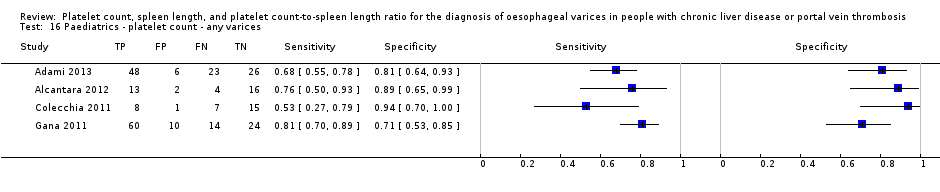
Paediatrics ‐ platelet count ‐ any varices.
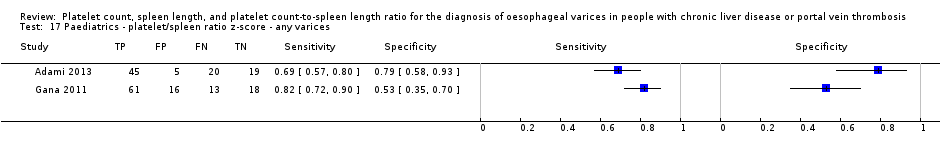
Paediatrics ‐ platelet/spleen ratio z‐score ‐ any varices.
| Review question | What is the diagnostic accuracy of platelet count for the diagnosis of oesophageal varices in adults with liver disease or portal vein thrombosis? | |||||
| Population | Adults with diagnosis of chronic liver disease or portal vein thrombosis. Age ≥ 18 years | |||||
| Settings | Outpatients and inpatients in secondary/tertiary care setting | |||||
| Study design | Prospective and retrospective cross‐sectional studies. No case‐control studies were found | |||||
| Index tests | Platelet count | |||||
| Reference standards | Upper endoscopy | |||||
| Target condition | Summary accuracy (95% CI) | No. of participants (studies) | Prevalence, Median (range ) | Implications in a hypothetical cohort of 1000 people | Post‐test probability | Quality and comments |
| Any varices Cut‐off value: around 150,000 /mm3 (range 140,000 to 150,000/mm3) | Sensitivity 0.71 (0.63 to 0.77) Specificity 0.80 (0.69 to 0.88) LR+ 3.6 LR‐ 0.37 | 2054 participants (10) | 38% | With a prevalence of 38%, 380 out of 1000 people will have varices of any size. Of these 380 people, 110 (29% of 380) people with varices will receive misdiagnosis and will not received appropriate prophylaxis or follow‐up The remaining 620 people will have no varices. 124 people (20% of 620) will receive false diagnosis of varices and will undergo an unnecessary endoscopy | Assuming a pretest probability of 38% Post‐test probabilities:
| Most studies are at high risk of bias No predefinition of cut‐off value of the index test for most studies Median prevalence of any varices is lower than that reported by most guidelines (around 50%) . |
| High risk varices Cut‐off value: around 150,000 /mm3 (range 140,000 to 160,000/mm3) | Sensitivity 0.80 (0.73 to 0.85) Specificity 0.68 (0.57 to 0.77) LR+ 2.5 LR‐ 0.30 | 1671 participants (7) | 20% | With a prevalence of 20%, 200 out of 1000 people will have varices at high risk of bleeding. Of these 200 people, 40 (20% of 200) people with high‐risk varices will receive misdiagnosis and will not receive effective prophylaxis The remaining 800 people will not have high‐risk varices. 256 people (32% of 800) will receive false diagnosis of high‐risk varices and will undergo an unnecessary endoscopy | Assuming a pretest probability of 20% Post‐test probabilities:
| Most or all studies at high risk of bias No predefinition of cut‐off value of the index test for most studies |
| Review question | What is the diagnostic accuracy of spleen length for the diagnosis of oesophageal varices in adult people with liver disease or portal vein thrombosis? | |||||
| Population | Adults with diagnosis of chronic liver disease or portal vein thrombosis. Age ≥ 18 years | |||||
| Settings | Outpatients and inpatients in secondary/tertiary care setting | |||||
| Study design | Prospective and retrospective cross‐sectional studies. No case‐control studies were found | |||||
| Index tests | Spleen length | |||||
| Reference standards | Upper endoscopy | |||||
| Target condition | Summary accuracy (95% CI) | No. of participants (studies) | Prevalence, Median (range ) | Implications in a hypothetical cohort of 1000 people | Post‐test probability | Quality and comments |
| Any varices Cut‐off value: around 110 mm (range 110 to 112.5 mm) | Sensitivity 0.85 (0.75 to 0.91) Specificity 0.54 (0.46 to 0.62) LR+ 1.8 (1.6 to 1.21) LR‐ 0.28 (0.17 to 0.44) | 594 participants (5) | 53% | With a prevalence of 53%, 530 out of 1000 people will have varices of any size. Of these 530 people, 80 (15% of 530) people with varices will receive misdiagnosis and will not receive appropriate prophylaxis or follow‐up The remaining 470 people will have no varices. 216 people (46% of 470) will receive false diagnosis of varices and will undergo an unnecessary endoscopy | Assuming a pretest probability of 53% Post‐test probabilities:
| Most or all studies at high risk of bias |
| High‐risk varices Cut‐off value: no common cut‐off value. Range 120 to 160 mm | Sensitivity ranged from 0.50 to 0.88 and specificity from 0.55 to 0.84 | 883 participants (6) | 42% | Inconsistency of results (no common cut‐off value) prevents any conclusions . | Most or all studies at high risk of bias | |
| What is the diagnostic accuracy of platelet count‐to‐spleen length ratio? | ||||||
| Review question | What is the diagnostic accuracy of platelet count‐to‐spleen length ratio for the diagnosis of oesophageal varices in adult people with liver disease or portal vein thrombosis? | |||||
| Population | Adults with diagnosis of chronic liver disease or portal vein thrombosis. Age ≥ 18 years | |||||
| Settings | Outpatients and inpatients in secondary/tertiary care setting | |||||
| Study design | Prospective and retrospective cross‐sectional studies. No case‐control studies were found | |||||
| Index tests | Platelet count‐to‐spleen length ratio | |||||
| Reference standards | Upper endoscopy | |||||
| Target condition | Summary accuracy | No. of participants (studies) | Prevalence, Median (range ) | Implications in a hypothetical cohort of 1000 people | Post‐test probability | Quality and comments |
| Any varices Cut‐off value: 909 (n/mm3)/mm | Sensitivity 0.93 (0.93 to 0.87) Specificity 0.84 (0.75 to 0.91) LR+ 5.9 LR‐ 0.09 | 2637 participants (17) | 58% | With a prevalence of 58%, 580 out of 1000 people will have varices of any size. Of these 580 people, 41 (7% of 580) people with varices will receive misdiagnosis and will not receive appropriate prophylaxis or follow‐up The remaining 420 people will have no varices. 67 people (16% of 420) will receive false diagnosis of varices and will undergo an unnecessary endoscopy | Assuming a pretest probability of 58% Post‐test probabilities:
| Most studies are at high risk of bias |
| High‐risk varices Cut‐off value: around 909 (n/mm3)/mm (range 897 to 921 (n/mm3)/mm) | Sensitivity 0.85 (0.72 to 0.93) Specificity 0.66 (0.52 to 0.77) LR+ 2.5 LR‐ 0.22 | 642 participants (7) | 60% | With a prevalence of 60%, 600 out of 1000 people will have varices at high risk of bleeding. Of these 2600 people, 90 (15% of 600) people with high‐risk varices will receive misdiagnosis and will not receive effective prophylaxis The remaining 400 people will not have high‐risk varices. 136 people (34% of 400) will receive false diagnosis of high‐risk varices and will undergo an unnecessary endoscopy | Assuming a pre‐test probability of 60% Post‐test probabilities:
| Most studies are at high risk of bias Median prevalence of any varices is higher than that reported by most guidelines (around 25%) |
| What is the diagnostic accuracy of platelet count? | ||||||
| Review question | What is the diagnostic accuracy of platelet count for the diagnosis of oesophageal varices in paediatric people with liver disease or portal vein thrombosis? | |||||
| Population | Children with diagnosis of chronic liver disease or portal vein thrombosis. Age < 18 years | |||||
| Settings | Outpatients and inpatients in secondary/tertiary care setting | |||||
| Study design | Prospective and retrospective cross‐sectional studies. No case‐control studies were found | |||||
| Index tests | Platelet count | |||||
| Reference standards | Upper endoscopy | |||||
| Target condition | Summary accuracy | No. of participants (studies) | Prevalence, Median (range ) | Implications in a hypothetical cohort of 1000 people | Post‐test probability | Quality and comments |
| Any varices Cut‐off value: around 120,000 /mm3 (range 115,000 to 119,000/mm3) | Sensitivity 0.71 (0.60 to 0.80) Specificity 0.83 (0.70 to 0.91) LR+ 4.2 LR‐ 0.35 | 277 participants (4) | 58% | With a prevalence of 58%, 580 out of 1000 children will have varices of any size. Of these 580 children, 168 (29% of 580) children with varices will receive misdiagnosis and will not receive appropriate. prophylaxis or follow‐up The remaining 420 children will have no varices. 71 children (17% of 420) will receive false diagnosis of varices and will undergo an unnecessary endoscopy | Assuming a pretest probability of 58% Post‐test probabilities:
| Studies were at high risk of bias |
| What is the diagnostic accuracy of platelet count‐to‐spleen length ratio? | ||||||
| Review question | What is the diagnostic accuracy of platelet count‐to‐spleen length ratio for the diagnosis of oesophageal varices in paediatric people with liver disease or portal vein thrombosis? | |||||
| Population | Children with diagnosis of chronic liver disease or portal vein thrombosis. Age < 18 years | |||||
| Settings | Outpatients and inpatients in secondary/tertiary care setting | |||||
| Study design | Prospective and retrospective cross‐sectional studies. No case‐control studies were found | |||||
| Index tests | Platelet count‐to‐spleen length ratio | |||||
| Reference standards | Upper endoscopy | |||||
| Target condition | Summary accuracy (95% CI) | No. of participants (studies) | Prevalences | Implications in a hypothetical cohort of 1000 people | Post‐test probability | Quality and comments |
| Any varices Cut‐off value: around 1000 (n/mm3)/mm | Sensitivity 0.74 (0.65 to 0.81) Specificity 0.64 (0.36 to 0.85) LR+ 2.0 (1.0 to 4.0) LR‐ 0.41 (0.27 to 0.61) | 197 participants | 72% and 73% | With a prevalence of 50%, 500 out of 1000 children will have varices of any size. Of these 500 children, 130 (26% of 500) children with varices will receive misdiagnosis and will not receive appropriate prophylaxis or follow‐up The remaining 500 children will have no varices. 180 children (36% of 500) will receive false diagnosis of varices and will undergo an unnecessary endoscopy | Assuming a pretest probability of 50% Post‐test probabilities:
| Limited evidence. Only 2 studies were found. These 2 studies were at high risk of bias |
| Any varices ‐ indirect comparisons | |||||
| Index test | No. of studies | Cut‐off value | Sensitivity (95% CI) | Specificity (95% CI) | P value* |
| Platelet count | 10 | Around 150,000/mm3 | 0.71 (0.63 to 0.77) | 0.80 (0.69 to 0.88) | 0.252 |
| Platelet count‐to‐spleen length ratio | 17 | 909 (n/mm3)/mm | 0.93 (0.83 to 0.97) | 0.84 (0.75 to 0.91) | |
| Platelet count | 9 | Around 150,000/mm3 | 0.71 (0.63 to 0.77) | 0.80 (0.69 to 0.88) | 0.021 |
| Spleen length | 5 | Around 110 mm | 0.85 (0.75 to 0.91) | 0.54 (0.46 to 0.62) | |
| Platelet count‐to‐spleen length ratio | 17 | 909 (n/mm3)/mm | 0.93 (0.83 to 0.97) | 0.84 (0.75 to 0.91) | <0.001 |
| Spleen length | 5 | Around 110 mm | 0.85 (0.75 to 0.91) | 0.54 (0.46 to 0.62) | |
| * Pair‐wise comparisons between index tests performed by adding the index test as covariate to the bivariate model. P values were obtained by comparing the ‐2 log likelihood of the model with the covariate with the ‐2 log likelihood of the model without the covariate. | |||||
| Pooled results | |||||
| Cut‐off | Sensitivity (95% CI) | Specificity (95% CI) | LR+ (95% CI) | LR‐ (95% CI) | |
| Any varices | |||||
| Platelet count | Around 100,000 | 0.57 (0.50 to 0.64) | 0.75 (0.67 to 0.82) | 2.3 (1.7 to 3.1) | 0.57 (0.49 to 0.67) |
| Around 120,000 | 0.77 (0.72 to 0.81) | 0.69 (0.57 to 0.78) | 2.4 (1.7 to 3.5) | 0.34 (0.26 to 0.44) | |
| Around 150,000 | 0.71 (0.63 to 0.77) | 0.80 (0.69 to 0.88) | 3.6 (2.4 to 5.4) | 0.37 (0.30 to 0.45) | |
| Spleen length | Around 110 mm | 0.85 (0.75 to 0.91) | 0.54 (0.46 to 0.62) | 1.8 (1.6 to 2.1) | 0.28 (0.17 to 0.44) |
| Around 150 mm | 0.57 (0.41 to 0.71) | 0.82 (0.72 to 0.89) | 3.2 (2.3 to 4.4) | 0.53 (0.39 to 0.72) | |
| Platelet count‐to‐spleen length ratio | 909 (n/mm3)/mm | 0.93 (0.83 to 0.97) | 0.84 (0.75 to 0.91) | 5.9 (3.5 to 9.9) | 0.09 (0.03 to 0.22) |
| High‐risk varices | |||||
| Platelet count | Around 90,000 | 0.59 (0.54 to 0.64) | 0.72 (0.66 to 0.78) | 2.1 (1.8 to 2.6) | 0.57 (0.52 to 0.63) |
| Around 150,000 | 0.80 (0.73 to 0.85) | 0.68 (0.57 to 0.77) | 2.5 (1.8 to 3.3) | 0.30 (0.23 to 0.39) | |
| Spleen length | ‐ | ‐ | ‐ | ‐ | ‐ |
| Platelet count‐to‐spleen length ratio | Around 909 (n/mm3)/mm | 0.85 (0.72 to 0.93) | 0.66 (0.52 to 0.77) | 2.5 (1.8 to 3.4) | 0.22 (0.12 to 0.42) |
| Test | No. of studies | No. of participants |
| 1 Adults ‐ platelet count ‐ any varices Show forest plot | 25 | 5096 |
| 2 Adults ‐ platelet count ‐ any varices ‐ cut‐off around 100,000 Show forest plot | 11 | 3506 |
| 3 Adults ‐ platelet count ‐ any varices ‐ cut‐off around 120,000 Show forest plot | 7 | 815 |
| 4 Adults ‐ platelet count ‐ any varices ‐ cut‐off around 150,000 Show forest plot | 10 | 2054 |
| 5 Adults ‐ platelet/spleen ratio ‐ any varices Show forest plot | 38 | 5235 |
| 6 Adults ‐ platelet/spleen ratio ‐ any varices ‐ cut‐off 909 Show forest plot | 17 | 2637 |
| 7 Adults ‐ spleen diameter ‐ any varices Show forest plot | 13 | 1489 |
| 8 Adults ‐ spleen diameter ‐ any varices ‐ cut‐off around 110 mm Show forest plot | 5 | 594 |
| 9 Adults ‐ spleen diameter ‐ any varices ‐ cut‐off around 150 mm Show forest plot | 5 | 598 |
| 10 Adults ‐ platelet count ‐ high‐risk varices Show forest plot | 21 | 4266 |
| 11 Adults ‐ platelet count ‐ high‐risk varices ‐ cut‐off around 90,000 Show forest plot | 11 | 3084 |
| 12 Adults ‐ platelet count ‐ high‐risk varices ‐ cut‐off around 150,000 Show forest plot | 7 | 1671 |
| 13 Adults ‐ platelet/spleen ratio ‐ high‐risk varices Show forest plot | 10 | 930 |
| 14 Adults ‐ platelet/spleen ratio ‐ high‐risk varices ‐ cut‐off around 909 Show forest plot | 7 | 642 |
| 15 Adults ‐ spleen diameter ‐ high‐risk varices Show forest plot | 6 | 883 |
| 16 Paediatrics ‐ platelet count ‐ any varices Show forest plot | 4 | 277 |
| 17 Paediatrics ‐ platelet/spleen ratio z‐score ‐ any varices Show forest plot | 2 | 197 |