Fluoropirimidinas por vía oral versus intravenosa para el cáncer colorrectal
Appendices
Appendix 1. Search strategy for CENTRAL, the Cochrane Library
Cochrane Library Issue 5, 20 May 2016 (292 hits in CENTRAL)
1. MeSH descriptor Colorectal Neoplasms explode all trees
2. ((cancer* or carcinoma* or neoplasm* or adenoma* or adenocarcinom* or tumour* or tumor* or polyp* or malignan*) near3 (colorectal* or colon* or rect*))
3. (#1 OR #2)
4. MeSH descriptor Fluorouracil explode all trees
5. MeSH descriptor Antimetabolites, Antineoplastic explode all trees
6. CapeIri or CapeOx or fluoropyrimidine* or $fluorouracil or 5 FU or 5‐FU or 5FU or $uracil or Capecitabine or Xeloda or Tegafur or S1 or S‐1 or Orzel or 776C85 or UFT or Xelox or Xeliri or Capox or Capiri
7. (#4 OR #5 OR #6)
8. (oral* and (intravenous* or infusion*))
9. (#3 AND #7 AND #8)
Appendix 2. Search strategy for MEDLINE (OVID)
MEDLINE (OVID) 1950 to 14 June 2016 (322 hits)
1. exp Colorectal Neoplasms/
2. ((cancer* or carcinoma* or neoplasm* or adenoma* or adenocarcinom* or tumour* or tumor* or polyp* or malignan*) adj3 (colorectal* or colon* or rect*)).mp.
3. 1 or 2
4. exp Fluorouracil/
5. exp Antimetabolites/
6. (CapeIri or CapeOx or fluoropyrimidine* or $fluorouracil or 5 FU or 5‐FU or 5FU or $uracil or Capecitabine or Xeloda or Tegafur or S1 or S‐1 or Orzel or 776C85 or UFT or Xelox or Xeliri or Capox or Capiri).mp.
7. 4 or 5 or 6
8. (oral* and (intravenous* or infusion*)).mp.
9. 3 and 7 and 8
10. randomized controlled trial.pt.
11. controlled clinical trial.pt.
12. randomized.ab.
13. placebo.ab.
14. clinical trials as topic.sh.
15. randomly.ab.
16. trial.ti.
17. 10 or 11 or 12 or 13 or 14 or 15 or 16
18. exp animals/ not humans.sh.
19. 17 not 18
20. 9 and 19
Appendix 3. Search strategy for Embase (OVID)
Embase (OVID) 1974 to 14 June 2016 (498 hits):
1. exp large intestine tumor/
2. ((cancer* or carcinoma* or neoplasm* or adenoma* or adenocarcinom* or tumour* or tumor* or polyp* or malignan*) adj3 (colorectal* or colon* or rect*)).mp.
3. 1 or 2
4. exp fluorouracil/
5. exp antimetabolite/
6. (CapeIri or CapeOx or fluoropyrimidine* or $fluorouracil or 5 FU or 5‐FU or 5FU or $uracil or Capecitabine or Xeloda or Tegafur or S1 or S‐1 or Orzel or 776C85 or UFT or Xelox or Xeliri or Capox or Capiri).mp.
7. 4 or 5 or 6
8. (oral* and (intravenous* or infusion*)).mp.
9. 3 and 7 and 8
10. CROSSOVER PROCEDURE.sh.
11. DOUBLE‐BLIND PROCEDURE.sh.
12. SINGLE‐BLIND PROCEDURE.sh.
13. (crossover* or cross over*).ti,ab.
14. placebo*.ti,ab.
15. (doubl* adj blind*).ti,ab.
16. allocat*.ti,ab.
17. trial.ti.
18. RANDOMIZED CONTROLLED TRIAL.sh.
19. random*.ti,ab.
20. 10 or 11 or 12 or 13 or 14 or 15 or 16 or 17 or 18 or 19
21. (exp animal/ or exp invertebrate/ or animal.hw. or nonhuman/) not (exp human/ or human cell/ or (human or humans or man or men or wom?n).ti.)
22. 20 not 21
23. 9 and 22
Appendix 4. Search strategy for Web of Science (Web of Knowledge)
This search was performed on 16 June 2016, with the search dates including 1900 to 2016 (9.6.2016).
| Set | Results | Search Terms |
| # 20 | 904 | #17 AND #9 |
| # 19 | 165,735 | #18 AND #17 |
| # 18 | 3,118,135 | TOPIC: (human) ORTOPIC: (humans) |
| # 17 | 1,641,761 | #16 OR #15 OR #14 OR #13 OR #12 OR #11 OR #10 |
| # 16 | 1,223,762 | TOPIC: (trial) |
| # 15 | 278,002 | TOPIC: (randomly) |
| # 14 | 495,021 | TOPIC: (clinical trial) |
| # 13 | 204,807 | TOPIC: (placebo) |
| # 12 | 650,738 | TOPIC: (randomized) |
| # 11 | 209,393 | TOPIC: (controlled clinical trial) |
| # 10 | 317,506 | TOPIC: (randomized controlled trial) ORTOPIC: (randomised controlled trial) |
| # 9 | 1,131 | #8 AND #7 AND #6 |
| # 8 | 318,494 | #2 OR #1 |
| # 7 | 38,132 | TOPIC: (oral*) ANDTOPIC: (intravenous* or infusion*) |
| # 6 | 286,602 | #5 OR #4 OR #3 |
| # 5 | 286,550 | TOPIC: (fluoropyrimidine* or fluorouracil or 5 FU or 5‐FU or 5FU or uracil or capecitabine or xeloda or tegafur or S1 or S‐1 or orzel or 776C85 or UFT or Xelox or Xeliri or Capox or Capiri or Capeox or Capeiri) |
| # 4 | 40,442 | TOPIC: (fluorouracil) |
| # 3 | 76 | TOPIC: (antimetabolites, antineoplastic) |
| # 2 | 318,494 | TOPIC: (cancer* or carcinoma* or neoplasm* or adenoma* or adenocarcinom* or tumour* or tumor* or polyp* or malignan*) ANDTOPIC: (colorectal* or colon* or rectal or rectum) |
| # 1 | 8,638 | TOPIC: (colorectal neoplasms) |
Appendix 5. Efficacy outcomes in studies not suitable for inclusion in meta‐analysis ‐ Patients treated with curative intent for colorectal cancer
| Study | Chemotherapy arm | 3‐year DFS rate, %; P value | 3‐year OS (curative intent studies) rate, %; P value | HR for OS (curative intent studies) (95% CI) |
| UFT/LV + RT | 65.6 | 74 | 1.39 (0.66‐2.93) | |
| FU/LV + RT | 64.7; P = 0.67 | 87; P = 0.37 | ||
| UFT: tegafur/uracil LV: leucovorin RT: radiotherapy | ||||
Appendix 6. Other information for studies that reported similar adverse event outcomes to "Neutropenia/Granulocytopenia" and "Hand foot syndrome"
| Setting | Study | Outcome in our review | Adverse event reported | Chemotherapy arm | Grade ≥ 3 AE (%) |
| Patients treated with curative intent for CRC with neoadjuvant and/or adjuvant chemotherapy | Neutropenia/ Granulocytopenia | Lowered leukocytes | Capecitabine | 1.5 | |
| Fluorouracil | 8.2 | ||||
| Neutropenia/ Granulocytopenia | Leukopenia | Doxifluridine + RT | 0 | ||
| 5‐FU + RT | 6.8 | ||||
| Patients treated with palliative intent for inoperable advanced or metastatic CRC with chemotherapy | Neutropenia/ Granulocytopenia | Leukopenia | Oral 5‐dFUR | 1.5 | |
| IV 5‐dFUR | 15 | ||||
| Neutropenia/ Granulocytopenia | Leuko/neutropenia | XELIRI | 17.2 | ||
| FOLFIRI | 16.1 | ||||
| Neutropenia/ Granulocytopenia | White blood cells | CAPIRI‐Celecoxib/Placebo | 14 | ||
| FOLFIRI‐Celecoxib/Placebo | 15.4 | ||||
| HFS | Skin/appendages (including HFS) | UFT/LV | 1 | ||
| 5‐FU/LV | 1 | ||||
| HFS | HFS | CAPOX | Only Grade 2/3 HFS included | ||
| FUFOX | |||||
| AE: adverse event CRC: colorectal cancer RT: radiotherapy 5‐FU: 5‐fluorouracil 5‐dFUR: doxifluridine IV: intravenous HFS: hand foot syndrome UFT: tegafur/uracil LV: leucovorin | |||||
Appendix 7. Efficacy outcomes in studies not suitable for inclusion in meta‐analysis ‐ Patients treated with palliative intent for inoperable advanced or metastatic colorectal cancer
| Outcome | Study | Line | Chemotherapy arm | Median (95% CI) for PFS, OS, TTP; % for ORR |
| PFS | First | CapeOx | 5.9 m (5.1 to 7.4) | |
| mFOLFOX6 | 8.7 m (6.5 to 9.8) | |||
| bFOL | 6.9 m (4.2 to 8.0) | |||
| First | CapeOx + BEV | 10.3 m (8.6 to 12.5) | ||
| mFOLFOX6 + BEV | 9.9 m (7.9 to 11.7) | |||
| bFOL + BEV | 8.3 m (6.6 to 9.9) | |||
| OS | First | Ftorafur | 209 d | |
| 5‐FU | 211 d | |||
| First, Second | Capecitabine + Irinotecan | 17.9 m | ||
| 5‐FU + Irinotecan | 14.2 m | |||
| TTP | First | XELIRI | 8.7 m | |
| FOLFIRI | 6.5 m | |||
| First, Second | Capecitabine + Irinotecan | 12.5 m | ||
| 5‐FU + Irinotecan | 8.4 m | |||
| ORR | First | SOX | 51.4 | |
| FOLFOX4 | 45.7 | |||
| First | Capecitabine | 14 | ||
| OxCap | 32 | |||
| FU | 11 | |||
| OxFU | 38 | |||
| First | XELIRI | 48.4 | ||
| FOLFIRI | 32.2 | |||
| aOutcome reported as TTP, but treated as PFS in this review based on the definition provided. CI: confidence interval PFS: progression‐free survival OS: overall survival TTP: time to tumour progression ORR: objective response rate BEV: bevacizumab 5‐FU / FU: 5‐fluorouracil | ||||
Appendix 8. Adverse event outcomes in studies not suitable for inclusion in meta‐analysis ‐ Patients treated with palliative intent for inoperable advanced or metastatic colorectal cancer
| Study | Line of chemotherapy | Grade ≥3 AE | Chemotherapy arm | Measure of grade ≥ 3 AE |
| First | Diarrhoea | XELIRI | 12.50% | |
| FOLFIRI | 3.20% | |||
| HFS | XELIRI | Grade 3: n = 1 | ||
| FOLFIRI | ||||
| Leuko/neutropenia | XELIRI | 17.2% | ||
| FOLFIRI | 16.1% | |||
| First, Second | Diarrhoea | Capecitabine + Irinotecan | 7.40% | |
| 5‐FU + Irinotecan | 18.80% | |||
| HFS | Capecitabine + Irinotecan | 0% | ||
| 5‐FU + Irinotecan | 0% | |||
| Neutropenia | Capecitabine + Irinotecan | 0% | ||
| 5‐FU + Irinotecan | 0% | |||
| Nausea/Vomiting | Capecitabine + Irinotecan | 0% | ||
| 5‐FU + Irinotecan | 6.25% | |||
| Stomatitis | Capecitabine + Irinotecan | 0% | ||
| 5‐FU + Irinotecan | 0% | |||
| AE: adverse event HFS: hand foot syndrome 5‐FU: 5‐fluorouracil | ||||
Appendix 9. Summary of subgroup analyses for efficacy outcomes ‐ Patients treated with curative intent for colorectal cancer
| Efficacy outcome | Hazard ratio (fixed, 95% CI) (No. studies/n) for subgroups, test for subgroup differences | ||||||
| Treatment type | Infusional vs bolus IV fluoropyrimidines | Oral fluoropyrimidine backbone | |||||
| Chemotherapy | Chemo‐radiotherapy | Infusional | Bolus | Capecitabine | UFT/Ftorafur | Doxifluridine | |
| DFS | 0.94 (0.87 to 1.02) | 0.91 (0.78 to 1.05) | 0.96 (0.85 to 1.08) | 0.94 (0.86 to 1.04) | 0.91 (0.83 to 0.99) | 1.01 (0.88 to 1.15) | - |
| 5/6944 | 2/1959 | 3/3881 | 3/4630 | 5/6260 | 2/2643 | ||
| Chi² = 0.21, P = 0.64; I2 = 0% | Chi² = 0.06, P = 0.81; I2 = 0% | Chi² = 1.70, P = 0.19; I2 = 41.1% | |||||
| OS | 0.93 (0.84 to 1.03) | 0.86 (0.70 to 1.06) | 0.94 (0.80 to 1.09) | 0.93 (0.83 to 1.05) | 0.88 (0.79 to 0.98) | 1.03 (0.86 to 1.22) | - |
| 5/6943 | 2/1959 | 3/3880 | 3/4630 | 5/6259 | 2/2643 | ||
| Chi² = 0.43, P = 0.51; I2 = 0% | Chi² = 0.00, P = 0.96; I2 = 0% | Chi² = 2.20, P = 0.14; I2 = 54.5% | |||||
| CI: confidence interval IV: intravenous UFT: tegafur/uracil DFS: disease‐free survival OS: overall survival | |||||||
Appendix 10. Summary of subgroup analyses for grade ≥ 3 adverse event outcomes ‐ Patients treated with curative intent for colorectal cancer
| Grade ≥3 AE | Odds ratio (fixed, 95% CI) (No. studies/n) for subgroups, test for subgroup differences | ||||||
| Treatment type | Infusional vs bolus IV fluoropyrimidine | Oral fluoropyrimidine backbone | |||||
| Chemotherapy | Chemo‐radiotherapy | Infusional | Bolus | Capecitabine | UFT/Ftorafur | Doxifluridine | |
| Diarrhoea | 1.08 (0.95 to 1.23) | 1.28 (0.98 to 1.66) | 1.27 (1.06 to 1.53) | 0.98 (0.84 to 1.14) | 1.15 (0.99 to 1.33) | 1.00 (0.83 to 1.21) | 32.14 (1.89 to 545.41) |
| 5/7274 | 4/2277 | 3/4255 | 5/4904 | 5/6616 | 3/2769 | 1/166 | |
| Chi² = 1.24, P = 0.27; I2 = 19.3% | Chi² = 4.52, P = 0.03; I2 = 77.9% | Chi² = 6.73, P = 0.03. I2 = 70.3% | |||||
| Vomiting | 1.03 (0.80 to 1.32) | 1.42 (0.54 to 3.75) | 1.56 (1.07 to 2.26) | 0.78 (0.57 to 1.08) | 1.34 (0.99 to 1.81) | 0.67 (0.44 to 1.01) | - |
| 5/7274 | 3/2111 | 3/4255 | 4/4738 | 5/6616 | 3/2769 | ||
| Chi² = 0.39, P = 0.53; I2 = 0% | Chi² = 7.48, P = 0.006; I2 = 86.6% | Chi² = 7.25, P = 0.007; I2 = 86.2% | |||||
| Nausea | 1.13 (0.90 to 1.42) | 3.19 (1.22 to 8.36) | 1.59 (1.10 to 2.31) | 1.00 (0.76 to 1.33) | 1.40 (1.04 to 1.88) | 1.00 (0.71 to 1.40) | - |
| 5/7274 | 2/1959 | 3/4255 | 3/4586 | 5/6616 | 2/2617 | ||
| Chi² = 4.24, P = 0.04; I2 = 76.4% | Chi² = 3.79, P = 0.05; I2 = 73.6% | Chi² = 2.10, P = 0.15; I2 = 52.3% | |||||
| AE: adverse event CI: confidence interval IV: intravenous UFT: tegafur/uracil | |||||||
Appendix 11. Summary of subgroup analyses for efficacy outcomes ‐ Patients treated with palliative intent for inoperable advanced or metastatic colorectal cancer
| Efficacy outcome | Hazard ratio (fixed, 95% CI) (No. studies/n) for subgroups, test for subgroup differences | ||||||||||
| Single agent vs combination therapy | Infusional vs bolus IV fluoropyrimidine | Oral fluoropyrimidine backbone | Oxaliplatin‐based vs irinotecan‐based | ||||||||
| Single agent | Combination therapy | Infusional | Bolus | Capecitabine | UFT/Ftorafur | Eniluracil + oral 5‐FU | Doxifluridine | S‐1 | Oxaliplatin‐based | Irinotecan‐based | |
| PFS | 1.12 (1.04 to 1.21) | 1.05 (1.00 to 1.10) | 1.05 (1.00 to 1.10) | 1.10 (1.03 to 1.19) | 1.03 (0.98 to 1.08) | 1.36 (1.07 to 1.73) | 1.22 (1.10 to 1.36) | 1.18 (0.79 to 1.74) | 1.02 (0.89 to 1.16) | 1.06 (0.99 to 1.13) | 1.04 (0.97 to 1.11) |
| 6/2955 | 16/6513 | 17/6560 | 7/3367 | 13/6703 | 2/374 | 3/1618 | 1/130 | 4/1102 | 8/4677 | 8/1836 | |
| Chi² = 2.16, P = 0.14; I2 = 53.8% | Chi² = 1.33, P = 0.25; I2 = 24.7% | Chi² = 13.46, P = 0.009; I2 = 70.3% | Chi² = 0.13, P = 0.72; I2 = 0% | ||||||||
| OS | 1.02 (0.99 to 1.07) | 1.00 (0.95 to 1.06) | 1.01 (0.96 to 1.06) | 1.02 (0.98 to 1.06) | 0.99 (0.95 to 1.04) | 1.02 (0.97 to 1.06) | 1.20 (1.07 to 1.36) | 0.99 (0.65 to 1.50) | 0.95 (0.81 to 1.11) | 1.00 (0.94 to 1.07) | 1.01 (0.92 to 1.10) |
| 10/4465 | 18/7155 | 19/7022 | 13/5057 | 16/7405 | 5/1807 | 3/1618 | 2/207 | 3/1042 | 11/5379 | 7/1776 | |
| Chi² = 0.40, P = 0.53; I2 = 0% | Chi² = 0.10, P = 0.75;I2 = 0% | Chi² = 9.30, P = 0.05; I2 = 57.0% | Chi² = 0.01, P = 0.90; I2 = 0% | ||||||||
| TTP | 1.08 (1.01 to 1.14) | 1.05 (0.84 to 1.32) | 1.05 (0.84 to 1.32) | 1.08 (1.01 to 1.14) | 1.05 (0.84 to 1.32) | 1.08 (1.02 to 1.15) | - | 0.88 (0.56 to 1.36) | - | - | |
| 4/1510 | 2/460 | 2/460 | 4/1510 | 2/460 | 3/1433 | 1/77 | |||||
| Chi² = 0.03, P = 0.86; I2 = 0% | Chi² = 0.03, P = 0.86; I2 = 0% | Chi² = 0.89, P = 0.64; I2 = 0% | |||||||||
| ORR | 1.11 (0.94 to 1.31) | 0.93 (0.85 to 1.03) | 0.92 (0.83 to 1.02) | 1.12 (0.96 to 1.29) | 1.01 (0.91 to 1.12) | 0.92 (0.72 to 1.18) | 0.84 (0.62 to 1.13) | 0.52 (0.28 to 0.99) | 1.08 (0.81 to 1.45) | 0.92 (0.83 to 1.03) | 0.97 (0.79 to 1.19) |
| 11/4208 | 21/6907 | 21/6342 | 14/4773 | 17/6690 | 6/1772 | 3/1522 | 2/190 | 4/941 | 12/5201 | 9/1706 | |
| Chi² = 3.14, P = 0.08: I2 = 68.2% | Chi² = 4.69, P = 0.03; I2 = 78.7% | Chi² = 5.81, P = 0.21; I2 = 31.2% | Chi² = 0.15, P = 0.70; I2 = 0% | ||||||||
| CI: confidence interval IV: intravenous UFT: tegafur/uracil 5‐FU: 5‐fluorouracil PFS: progression‐free survival OS: overall survival TTP: time to tumour progression ORR: objective response rate | |||||||||||
Appendix 12. Summary of subgroup analyses for grade ≥ 3 adverse event outcomes ‐ Patients treated with palliative intent for inoperable advanced or metastatic colorectal cancer
| Grade ≥3 AE | Odds ratio (fixed, 95% CI), (No. studies/n) for subgroups, Test for subgroup differences | ||||||||||
| Single‐agent vs combination therapy | Infusional vs bolus IV fluoropyrimidine | Oral fluoropyrimidine backbone | Oxaliplatin‐based vs irinotecan‐based | ||||||||
| Single agent | Combination therapy | Infusional | Bolus | Capecitabine | UFT/Ftorafur | Eniluracil + oral 5‐FU | Doxifluridine | S‐1 | Oxaliplatin‐based | Irinotecan‐based | |
| Diarrhoea | 1.22 (1.04 to 1.44) | 2.03 (1.77 to 2.32) | 2.00 (1.74 to 2.30) | 1.31 (1.12 to 1.53) | 1.76 (1.54 to 2.00) | 1.60 (1.24 to 2.06) | 1.04 (0.79 to 1.38) | 1.51 (0.64 to 3.56) | 3.55 (2.19 to 5.76) | 1.73 (1.48 to 2.02) | 3.05 (2.33 to 3.99) |
| 10/4566 | 21/7431 | 21/7065 | 12/4932 | 17/7382 | 5/1784 | 3/1617 | 1/127 | 4/1087 | 12/5420 | 8/1792 | |
| Chi² = 21.70, P < 0.00001; I2 = 95.4% | Chi² = 15.57, P < 0.0001; I2 = 93.6% | Chi² = 21.15, P = 0.0003; I2 = 81.1% | Chi² = 12.72, P = 0.0004; I2 = 92.1% | ||||||||
| Hand foot syndrome | 1.11 (0.48 to 2.56) | 4.76(3.32 to 6.82) | 3.53 (2.53 to 4.94) | 18.68 (4.15 to 84.10) | 5.86 (4.01 to 8.58) | 0.49 (0.04 to 5.50) | 0.04 (0.00 to 0.75) | - | 0.66 (0.11 to 4.00) | 4.52 (3.03 to 6.75) | 5.93 (2.52 to 13.97) |
| 2/343 | 17/6138 | 18/6094 | 3/387 | 13/5418 | 2/372 | 1/122 | 2/569 | 10/4608 | 6/1311 | ||
| Chi² =9.86 , P = 0.002, I2 = 89.9% | Chi² = 4.48, P = 0.03, I2 = 77.7 % | Chi² = 19.58, P = 0.0002 , I2 = 84.7% | Chi² = 0.32, P = 0.57, I2 = 0% | ||||||||
| Neutropenia/ granulocytopenia | 0.05 (0.04 to 0.07) | 0.24 (0.21 to 0.28) | 0.23 (0.20 to 0.26) | 0.09 (0.07 to 0.11) | 0.21 (0.18 to 0.24) | 0.03 (0.02 to 0.05) | 0.06 (0.04 to 0.09) | - | 0.38 (0.29 to 0.50) | 0.15 (0.13 to 0.18) | 0.59 (0.47 to 0.73) |
| 9/4447 | 21/7347 | 21/6981 | 11/4813 | 16/7228 | 5/1784 | 3/1625 | 5/1157 | 13/5418 | 7/1710 | ||
| Chi² = 102.73, P < 0.00001; I2 = 99.0% | Chi² = 56.29, P < 0.00001; I2 = 98.2% | Chi² = 112.47, P < 0.00001; I2 = 97.3% | Chi² = 91.66, P < 0.00001; I2 = 98.9% | ||||||||
| Febrile neutropenia | 0.05 (0.02 to 0.11) | 0.49 (0.36 to 0.66) | 0.50 (0.35 to 0.71) | 0.13 (0.08 to 0.21) | 0.42 (0.30 to 0.58) | 0.03 (0.01 to 0.11) | 0.08 (0.03 to 0.21) | - | 1.82 (0.67 to 4.92) | 0.26 (0.16 to 0.40) | 1.20 (0.75 to 1.93) |
| 5/3254 | 14/6153 | 13/5624 | 7/3783 | 11/5419 | 3/1476 | 2/1485 | 3/1027 | 8/4492 | 6/1661 | ||
| Chi² = 27.62, P < 0.00001; I2 = 96.4% | Chi² = 20.33, P < 0.00001; I2 = 95.1% | Chi² = 33.08, P < 0.00001; I2 = 90.9% | Chi² = 21.90, P < 0.00001; I2 = 95.4% | ||||||||
| Vomiting | 1.11 (0.83 to 1.47) | 1.22 (1.00 to 1.50) | 1.21 (0.97 to 1.49) | 1.15 (0.89 to 1.49) | 1.25 (1.02 to 1.52) | 1.35 (0.97 to 1.87) | 0.68 (0.36 to 1.31) | - | 0.32 (0.10 to 1.07) | 1.12 (0.90 to 1.40) | 1.85 (1.13 to 3.01) |
| 7/3312 | 17/6216 | 18/6172 | 8/3356 | 13/6029 | 5/1784 | 2/1086 | 3/629 | 10/4959 | 6/1038 | ||
| Chi² = 0.32, P = 0.57; I2 = 0 | Chi² = 0.07, P = 0.79; I2 = 0% | Chi² = 8.08, P = 0.04; I2 = 62.9% | Chi² = 3.35, P = 0.07; I2 = 70.2% | ||||||||
| Nausea | 1.08 (0.81 to 1.44) | 1.20 (0.99 to 1.45) | 1.18 (0.96 to 1.45) | 1.13 (0.87 to 1.46) | 1.31 (1.07 to 1.61) | 1.35 (0.96 to 1.89) | 0.51 (0.28 to 0.91) | - | 0.56 (0.28 to 1.10) | 1.16 (0.93 to 1.44) | 1.29 (0.85 to 1.94) |
| 6/2719 | 20/7077 | 21/7033 | 7/2763 | 13/5769 | 5/1784 | 2/1086 | 5/1157 | 11/5066 | 8/1792 | ||
| Chi² = 0.35, P = 0.55; I2 = 0% | Chi² = 0.08, P = 0.78; I2 = 0% | Chi² = 14.23, P = 0.003; I2 = 78.9% | Chi² = 0.20, P = 0.65; I2 = 0% | ||||||||
| Stomatitis | 0.13 (0.09 to 0.19) | 0.73 (0.49 to 1.07) | 0.65 (0.44 to 0.96) | 0.14 (0.09 to 0.20) | 0.26 (0.18 to 0.37) | 0.15 (0.09 to 0.25) | 0.09 (0.00 to 1.65) | 0.09 (0.01 to 0.70) | 4.45 (1.38 to 14.31) | 0.59 (0.38 to 0.92) | 2.56 (0.80 to 8.24) |
| 8/3071 | 14/5647 | 14/5668 | 7/3050 | 10/5598 | 5/1784 | 1/122 | 1/127 | 4/1087 | 9/4731 | 4/697 | |
| Chi² = 39.19, P < 0.00001; I2 = 97.4% | Chi² = 32.07, P < 0.00001; I2 = 96.9% | Chi² = 28.83, P < 0.00001; I2 = 86.1% | Chi² = 5.27, P = 0.02; I2 =81.0% | ||||||||
| Mucositis | 0.08 (0.05 to 0.13) | 1.17 (0.62 to 2.21) | 1.17 (0.62 to 2.21) | 0.08 (0.05 to 0.13) | 0.63 (0.24 to 1.64) | 0.10 (0.05 to 0.18) | 0.10 (0.05 to 0.19) | - | 7.16 (1.29 to 39.88) | 0.75 (0.32 to 1.77) | 2.12 (0.77 to 5.89) |
| 4/2670 | 8/2292 | 8/2292 | 4/2670 | 3/940 | 4/1547 | 2/1495 | 3/980 | 3/1142 | 5/1150 | ||
| Chi² = 43.07, P < 0.00001; I2 = 97.7% | Chi² = 43.07, P < 0.00001; I2 = 97.7% | Chi² = 31.60, P < 0.00001; I2 = 90.5% | Chi² = 2.33, P = 0.13; I2 = 57.1% | ||||||||
| Hyperbilirubinemia | 1.83 (0.96 to 3.48) | 1.34 (0.62 to 2.90) | 1.34 (0.62 to 2.90) | 1.83 (0.96 to 3.48) | 1.51 (0.87 to 2.61) | 0.99 (0.20 to 5.00) | Not estimable | - | 4.42 (0.74 to 26.40) | 1.26 (0.57 to 2.81) | 3.10 (0.12 to 79.23) |
| 3/1311 | 6/1388 | 7/1510 | 2/1189 | 4/1646 | 2/372 | 1/122 | 2/559 | 4/1257 | 2/131 | ||
| Chi² = 0.37, P = 0.54, I2 = 0% | Chi² = 0.37, P = 0.54, I2 = 0% | Chi² = 1.62, P = 0.45, I2 = 0% | Chi² = 0.28, P = 0.60, I2 = | ||||||||
| Any | 1.09 (0.84 to 1.42) | 0.78 (0.68 to 0.89) | 0.77 (0.68 to 0.88) | 1.24 (0.93 to 1.65) | 0.85 (0.75 to 0.96) | 0.69 (0.44 to 1.10) | 0.54 (0.26 to 1.11) | - | 1.26 (0.58 to 2.74) | 0.65 (0.55 to 0.75) | 1.16 (0.88 to 1.51) |
| 3/936 | 12/4500 | 13/4663 | 3/773 | 10/4835 | 2/372 | 1/122 | 1/107 | 6/3385 | 5/896 | ||
| Chi² = 8.71, P = 0.003; I2 = 88.5% | Chi² = 13.55, P = 0.0002; I2 = 92.6% | Chi² = 3.14, P = 0.37; I2 = 4.4% | Chi² = 13.55, P = 0.0002; I2 = 92.6% | ||||||||
| AE: adverse event CI: confidence interval IV: intravenous UFT: tegafur/uracil 5‐FU: 5‐fluorouracil | |||||||||||
Appendix 13. DFS: Other information for studies where the outcome was suitable for meta‐analysis
| Treatment setting | Study
| Chemotherapy arm
|
Survival rate, % (95% CI)
| |
| 3‐year | 5‐year | |||
| Neoadjuvant | Rectal | |||
| Capecitabine ± oxaliplatin | 66.7 | |||
| 5‐FU ± oxaliplatin | 66.4 | |||
| Neoadjuvant/Adjuvant | Rectal | |||
|
| All (Adjuvant/Neoadjuvant) | |||
| Capecitabine | 75 (68 to 81), P = 0.07 | 68 (60 to 74) | ||
| Fluorouracil | 67 (59 to 73) | 54 (45 to 62) | ||
| Adjuvant | ||||
| Capecitabine | 78 (69 to 85) | |||
| Fluorouracil | 69 (59 to 77) | |||
| Neoadjuvant | ||||
| Capecitabine | 71 (60 to 80) | |||
| Fluorouracil | 63 (51 to 73) |
| ||
| Adjuvant | Colon | |||
| (Stage III) | BEV‐XELOX | 75 (72 to 78) | ||
| BEV‐FOLFOX4 | 73 (71 to 76) | |||
|
| UFT/LV | 74.5 | 67.0 | |
| FU/LV | 74.5 | 68.2 | ||
|
| UFT/LV | 77.8 | 73.6 | |
| 5‐FU/LV | 79.3 | 74.3 | ||
|
| Capecitabine | 64.2 | 60.8 | |
| 5‐FU/FA | 60.6, P = 0.12 | 56.7 | ||
| Colorectal | ||||
| CAPOX | 79.5 (75.9 to 83.1) | |||
| mFOLFOX6 | 79.8 (76.5 to 83.4), P = 0.784 | |||
| DFS: disease‐free survival CI: confidence interval 5‐FU / FU: 5‐fluorouracil BEV: bevacizumab UFT: tegafur/uracil LV: leucovorin FA: folinic acid | ||||
Appendix 14. OS (curative intent studies): Other information for studies for which the outcome was suitable for meta‐analysis
| Treatment setting | Study | Chemotherapy arm | Survival rate, % (95% CI) |
| Neoadjuvant | Rectal | ||
| Capecitabine ± oxaliplatin | 5 years: 80.8 | ||
| 5‐FU ± oxaliplatin | 5 years: 79.9 | ||
| Neoadjuvant/Adjuvant | Rectal | ||
| All (Adjuvant/Neoadjuvant) | |||
| Capecitabine | 3 years: 87 (81 to 91) | ||
| Fluorouracil | 3 years: 83 (77 to 88) | ||
| Capecitabine | 5 years: 76 (67 to 82) | ||
| Fluorouracil | 5 years: 67 (58 to 74) | ||
| Capecitabine | 7 years: 71 (60 to 79) | ||
| Fluorouracil | 7 years: 58 (47 to 67) | ||
| Adjuvant | Colon | ||
| (Stage III) | BEV‐XELOX | 5 years: 82 (80 to 85) | |
| BEV‐FOLFOX4 | 5 years: 81 (78 to 83) | ||
|
| UFT/LV | 5 years: 88.4 | |
| FU/LV | 5 years: 87.0 | ||
| UFT/LV | 5 years: 69.6 | ||
| FU/LV | 5 years: 71.5 | ||
| UFT/LV | 5 years: 78.5 | ||
| FU/LV | 5 years: 78.7 | ||
| UFT + LV | 3 years: 93.9 | ||
| 5‐FU + l‐LV | 3 years: 94.5 | ||
| UFT + LV | 5 years: 87.5 | ||
| 5‐FU + l‐LV | 5 years: 88.4 | ||
| Capecitabine | 3 years: 81.3 | ||
| 5‐FU/FA | 3 years: 77.6, P = 0.05 | ||
| Capecitabine | 5 years: 71.4 | ||
| 5‐FU/FA | 5 years: 68.4 | ||
| Colorectal | |||
| CAPOX | 3 years: 86.9 (83.4 to 89.9) | ||
| mFOLFOX6 | 3 years: 87.2 (84.1 to 91.1), P = 0.844 | ||
| OS: overall survival CI: confidence interval 5‐FU/ FU: 5‐fluorouracil BEV: bevacizumab UFT: tegafur/uracil LV: leucovorin FA: folinic acid | |||
Appendix 15. PFS: Other information for studies for which the outcome was suitable for meta‐analysis
| Study | Line of chemotherapy | Chemotherapy Arm | Median (95% CI) | Survival rate, % (95% CI) |
|
| First
| Oral 5‐dFUR | 4 m (1 to 23) | |
| IV 5‐dFUR | 7 m (1 to 24) |
| ||
| First
| XELOX/XELOX‐placebo/XELOX‐BEV (ITT) | 8.0 m | ||
| FOLFOX‐4/FOLFOX‐4‐placebo/FOLFOX‐4‐BEV (ITT) | 8.5 m | |||
| XELOX/XELOX‐placebo/XELOX‐BEV(EPP) | 7.9 m | |||
| FOLFOX‐4/FOLFOX‐4‐placebo/FOLFOX‐4‐BEV (EPP) | 8.5 m |
| ||
| XELOX‐BEV (ITT) | 9.3 m | |||
| FOLFOX‐4‐BEV (ITT) | 9.4 m | |||
| XELOX (ITT) | 7.3 m | |||
| FOLFOX‐4 (ITT) | 7.7 m | |||
|
| First
| OXXEL | 6.6 m (6.0 to 7.0) | |
| OXAFAFU | 6.5 m (5.4 to 7.6) |
| ||
|
| First
| UFOX + Cetuximab | 6.6 m (5.6 to 7.2) | |
| FOLFOX4 + Cetuximab | 8.2 m (7.5 to 9.2), P (log rank) = 0.0048 |
| ||
| First | XELOX (ITT) | 8.8 m | ||
| FOLFOX‐6 (ITT) | 9.3 m | |||
| XELOX (per protocol) | 8.9 m | |||
| FOLFOX‐6 (per protocol) | 9.3 m | |||
|
| First
| XELIRI + BEV | 9 m (8 to 10) | 6 m: 82 (71 to 90) |
| FOLFIRI + BEV | 9 m (8 to 10) | 6 m: 85 (75 to 92) | ||
| XELIRI+ BEV | 12 m: 25 (16 to 36) | |||
| FOLFIRI + BEV | 12 m: 18 (11 to 28) | |||
|
| First
| Eniluracil/5‐FU | 0.4 y (0.2 to 0.5) | |
| 5‐FU | 0.6 y (0.4 to 0.6), P = 0.021, stratified log‐rank |
| ||
|
| First
| CapeIRI + Celecoxib/Placebo | 5.8 m | |
| mIFL + Celecoxib/Placebo | 5.9 m, P = 0.46 (comparison of CapeIRI + Celecoxib/Placebo to mIFL + Celecoxib/Placebo) | |||
| FOLFIRI + Celecoxib/Placebo | 7.6 m, P = 0.015 (comparison of CapeIRI + Celecoxib/Placebo to FOLFIRI + Celecoxib/Placebo) |
| ||
|
| First
| Capecitabine | 4.3 m (4.1 to 5.1) | |
| 5‐FU/LV | 4.7 m (4.3 to 5.5) |
| ||
| First or second | Sequential IRIS‐BEV | 345 d (312 to 594) | ||
| mFOLFIRI‐BEV | 324 d (247 to 475), P = 0.71 | |||
|
| First
| CAPIRI‐Celecoxib/Placebo | 5.9 m (4.4 to 8.9) | 1 y: 22.6 (11.4 to 36.2) |
| FOLFIRI‐Celecoxib/Placebo | 9.6 m (6.9 to 10.9) | 1 y: 29.3 (16.4 to 43.4) | ||
|
| First
| XELIRI + BEV | 10.2 m (9.0 to 11.5) | |
| FOLFIRI + BEV | 10.8 m (9.7 to 11.8), P = 0.74 |
| ||
|
| First
| CAPOX | 7.1 m | |
| FUFOX | 8.0 m |
| ||
|
| Second
| XELOX (ITT) | 4.7 m | |
| FOLFOX‐4 (ITT) | 4.8 m | |||
| XELOX (per protocol) | 5.1 m | |||
| FOLFOX‐4 (per protocol) | 5.5 m |
| ||
|
| First
| EU/5‐FU | 20 wks (19.1 to 20.9) | |
| 5‐FU/LV | 22.7 wks (18.3 to 24.6), P = 0.0106, log‐rank |
| ||
|
| First
| Capecitabine | 5.2 m (2.8 to 6.7) | |
| OxCap | 5.8 m (3.3 to 7.4) | |||
| FU | 3.5 m (2.8 to 6.2) | |||
| OxFU | 5.8 m (3.2 to 7.6) |
| ||
| First | TEGAFIRI +/‐ BEV | 9.9 m (6.5 to 14.7) | ||
| FOLFIRI +/‐ BEV | 10.6 (7.7 to 16.5) | |||
|
| First
| CAPIRI + BEV | 8.9 m (7.3 to 10.2) | |
| FOLFIRI + BEV | 10.0 m (8.9 to 11.1) |
| ||
|
| First
| Capecitabine | 5.2 m | |
| 5‐FU/LV | 4.7 m |
| ||
| First | SOX + BEV | 10.2 m (9.4 to 11.1) | ||
| mFOLFOX + BEV | 10.2 m (9.5 to 11.3) | |||
| First | SOL | 9.6 m | ||
| mFOLFOX6 | 6.9 m | |||
| Second | IRIS | 5.8 m | ||
| FOLFIRI | 5.1 m | |||
| PFS: progression‐free survival CI: confidence interval 5‐dFUR: doxifluridine IV: intravenous BEV: bevacizumab ITT: intention‐to‐treat EPP: Expanded Participation Project 5‐FU: 5‐fluorouracil LV: leucovorin | ||||
Appendix 16. TTP: Other information for studies where the outcome was suitable for meta‐analysis
| Study | Line of chemotherapy | Chemotherapy arm | Median (95% CI) | P value |
|
| First
| 5‐dFUR + LV | 5.4 m (1 to 18.4) | |
| 5‐FU/LV | 4.7 m (1 to 25.4) |
| ||
|
| First
| UFT/LV | 3.4 m (2.6 to 3.8) | |
| 5‐FU/LV | 3.3 m (2.5 to 3.7) | P = 0.591, stratified log‐rank | ||
|
| First
| XELOX | 8.9 m (7.8 to 9.9) | |
| FUOX | 9.5 m (8.1 to 10.8) |
| ||
|
| First
| UFT/LV | 3.5 m (3.0 to 4.4) | |
| 5‐FU/LV | 3.8 m(3.6 to 5.0) |
| ||
|
| First
| XELOX | 9 m (8 to 10) | |
| pviFOX | 7 m (5 to 9) |
| ||
|
| First
| FT/LV | 5.9 m (5.3 to 6.5) | |
| 5‐FU/LV | 6.2 m (5.4 to 6.9) |
| ||
| TTP: time to progression CI: confidence interval 5‐dFUR: doxifluridine LV: leucovorin 5‐FU: 5‐fluorouracil UFT: tegafur/uracil | ||||
Appendix 17. OS (palliative intent studies): Other information for studies where the outcome was suitable for meta‐analysis
| Study | Line of chemotherapy | Chemotherapy arm | Median (95% CI) | P value | Survival rate, % (95% CI) |
|
| First
| 5‐dFUR + LV | 14.9 m (1 to 26.8) | ||
| 5‐FU/LV | 19.5 m (1.9 to 25.4) |
|
| ||
|
| First
| Oral 5‐dFUR | 10.6 m | ||
| IV 5‐dFUR | 11 m |
|
| ||
|
| First
| UFT/LV | 12.2 m | ||
| 5‐FU/LV | 10.3 m | P = 0.226, stratified log‐rank |
| ||
|
| First
| XELOX/XELOX‐placebo/XELOX‐BEV | 19.8 m | ||
| FOLFOX‐4/FOLFOX‐4‐placebo/FOLFOX‐4‐BEV | 19.5 m | ||||
| XELOX/XELOX‐placebo | 19.0 m | ||||
| FOLFOX‐4/FOLFOX‐4‐placebo | 18.9 m | ||||
| XELOX‐BEV | 21.6 m | ||||
| FOLFOX‐4‐BEV | 21.0 m | ||||
| XELOX | 18.8 m | ||||
| FOLFOX‐4 | 17.7 m |
|
| ||
|
| First
| OXXEL | 16.0 m (11.2 to 20.2) | ||
| OXAFAFU | 17.1 m (13.8 to 20.4) |
|
| ||
|
| First
| XELOX | 18.1 m (15.5 to 20.4) | ||
| FUOX | 20.8 m (16.6 to 25.0) |
|
| ||
|
| First
| UFT/LV | 12.4 m (11.2 to 13.6) | ||
| 5‐FU/LV | 13.4 m (11.6 to 15.4) | P = 0.630, stratified log‐rank | |||
| First | UFOX + Cetuximab | 16.8 m (13.9 to 18.5) | |||
| FOLFOX4 + Cetuximab | 18.4 m (15.3 to 20.9) | ||||
| First | XELOX (ITT) | 19.9 m | |||
| FOLFOX‐6 (ITT) | 20.5 m | ||||
| XELOX (per protocol) | 20.1 m | ||||
| FOLFOX‐6 (per protocol) | 18.9 m | ||||
|
| First
| XELIRI + BEV | 23 m (21 to 27) | 1 y: 87 (78 to 93) | |
| FOLFIRI + BEV | 23 m (21 to 32) |
| 1 y: 85 (75 to 91) | ||
| XELIRI + BEV | 2 y: 49 (37 to 60) | ||||
| FOLFIRI + BEV | 2 y: 48 (37 to 59) | ||||
|
| First
| Eniluracil/5‐FU | 1.0 yr (0.6 to 1.3) | ||
| 5‐FU | 1.5 y (0.9 to 1.8) | P = 0.17, stratified log‐rank |
| ||
|
| First
| CapeIRI + Celecoxib/Placebo | 18.9 m | ||
| mIFL + Celecoxib/Placebo | 17.6 m | ||||
| FOLFIRI + Celecoxib/Placebo | 23.1 m |
|
| ||
| First
| UFOX + Cetuximab | 16.8 m (13.9 to 18.5) | P = 0.86, log‐rank | ||
| FOLFOX4 + Cetuximab | 18.4 m (15.3 to 20.9) |
|
| ||
|
| First
| CapeOx | 17.2 m (12.5 to 22.3) | ||
| bFOL | 17.9 m (11.5 to 24.6) | ||||
| mFOLFOX6 | 19.2 m (14.2 to 24.9) |
|
| ||
|
| First
| CapeOx + BEV | 24.6 m (21.3 to 31.6) | ||
| bFOL + BEV | 20.4 m (18.4 to 25.3) | ||||
| mFOLFOX6 + BEV | 26.1 m (18.0 to NE) |
|
| ||
|
| First
| Capecitabine | 12.5 m (10.5 to 14.2) | ||
| 5‐FU/LV | 13.3 m (12.0‐14.6) |
|
| ||
|
| First
| FOLFIRI‐Celecoxib/Placebo | 19.9 m (18.9, NR) | 1 y: 84.9 (69.4 to 92.9) | |
| CAPIRI‐Celecoxib/Placebo | 14.75 m (10.7 to 18.3) |
| 1 y: 53.5 (36.0 to 68.2) | ||
|
| First
| FT/LV | 12.4 m (10.3 to 14.5) | ||
| 5‐FU/LV | 12.2 m (8.9 to 15.7) |
|
| ||
|
| First
| XELIRI + BEV | 20.0 m (15.4 to 24.6) | P = 0.099 | |
| FOLFIRI + BEV | 25.3 m (22.1 to 28.6) |
|
| ||
|
| First
| CAPOX | 16.8 m | ||
| FUFOX | 18.8 m |
|
| ||
|
| Second
| XELOX (ITT) | 11.9 m | ||
| FOLFOX‐4 (ITT) | 12.5 m | ||||
| XELOX (EPP) | 12.9 m | ||||
| FOLFOX‐4 (EPP) | 13.2 m |
|
| ||
|
| First
| EU/5‐FU | 13.3 m (12.0 to 15.1) | ||
| 5‐FU/LV | 14.5 m (12.8 to 16.2) | P = 0.3135, log rank |
| ||
|
| First
| Capecitabine | 11.0 m (5.4 to 18.0) | ||
| OxCap | 12.4 m (5.8 to 18.0) | ||||
| FU | 10.1 m (5.1 to 17.3) | ||||
| OxFU | 10.7 m (5.7 to 17.2) |
|
| ||
| First | TEGAFIRI +/‐ BEV | 26.7 m (20.4 to 31.0) | |||
| FOLFIRI +/‐ BEV | 27.7 m (20.0 to 35.0) | ||||
|
| First
| CAPIRI + BEV | 27.5 m (22.6 to 32.3) | ||
| FOLFIRI + BEV | 25.7 m (23.0 to 28.4) |
|
| ||
|
| First
| Eniluracil/5‐FU | 47.4 wks | ||
| 5‐FU/LV | 63.7 wks |
|
| ||
|
| First
| Capecitabine | 13.2 m | P = 0.33, log‐rank | |
| 5‐FU/LV | 12.1 m |
|
| ||
| First | SOX + BEV | 29.6 m (25.8 to NE) | |||
| mFOLFOX + BEV | 30.9 m (28.6 to 33.1) | ||||
| First | SOL | 29.9 m | |||
| mFOLFOX6 | 25.9 m | ||||
| Second | IRIS | 17.8 m | |||
| FOLFIRI | 17.4 m | ||||
| OS: overall survival CI: confidence interval 5‐dFUR: doxifluridine 5‐FU: 5‐fluorouracil LV: leucovorin IV: intravenous UFT: tegafur/uracil BEV: bevacizumab ITT: intention‐to‐treat NE: not estimable NR: not reached EPP: Expanded Participation Project EU: eniluracil | |||||
Appendix 18. Key historical studies used to estimate the activity of the active control for disease‐free survival
NCCTG, ECOG‐NCCTG/INT, SWOG‐INT0035, Siena, NCIC‐CTG, FFCD, and GIVIO studies in Gill 2004

Risk of bias graph: review authors' judgements about each risk of bias item presented as percentages across all included studies.1
1 In this graph, the risk of bias for each domain was calculated using the worst assessment documented for that domain in the contributing studies.
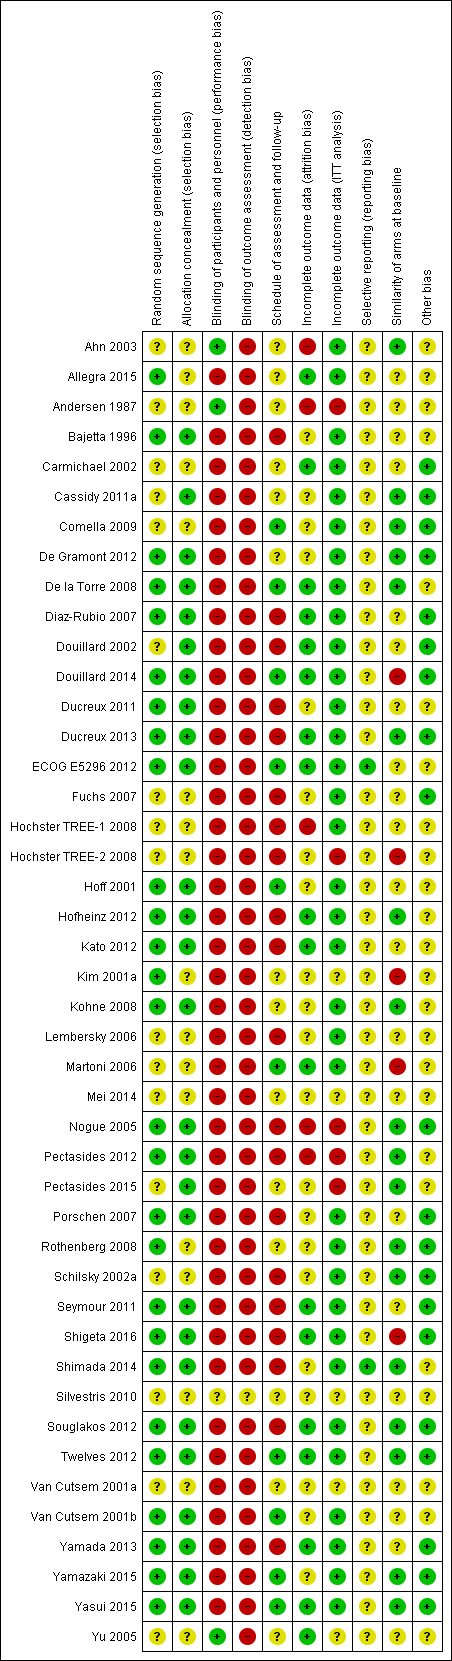
Risk of bias summary: review authors' judgements about each risk of bias item for each included study.1
1 In this summary, the risk of bias for each domain was scored using the worst assessment documented for that domain in the study.
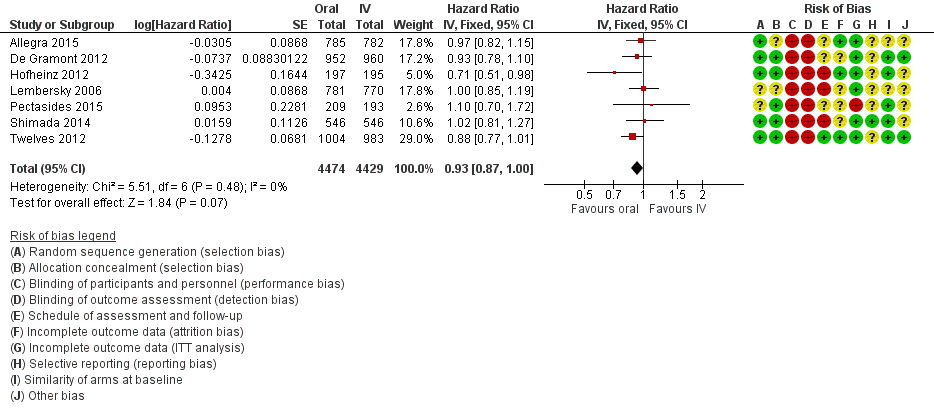
Forest plot of disease‐free survival.

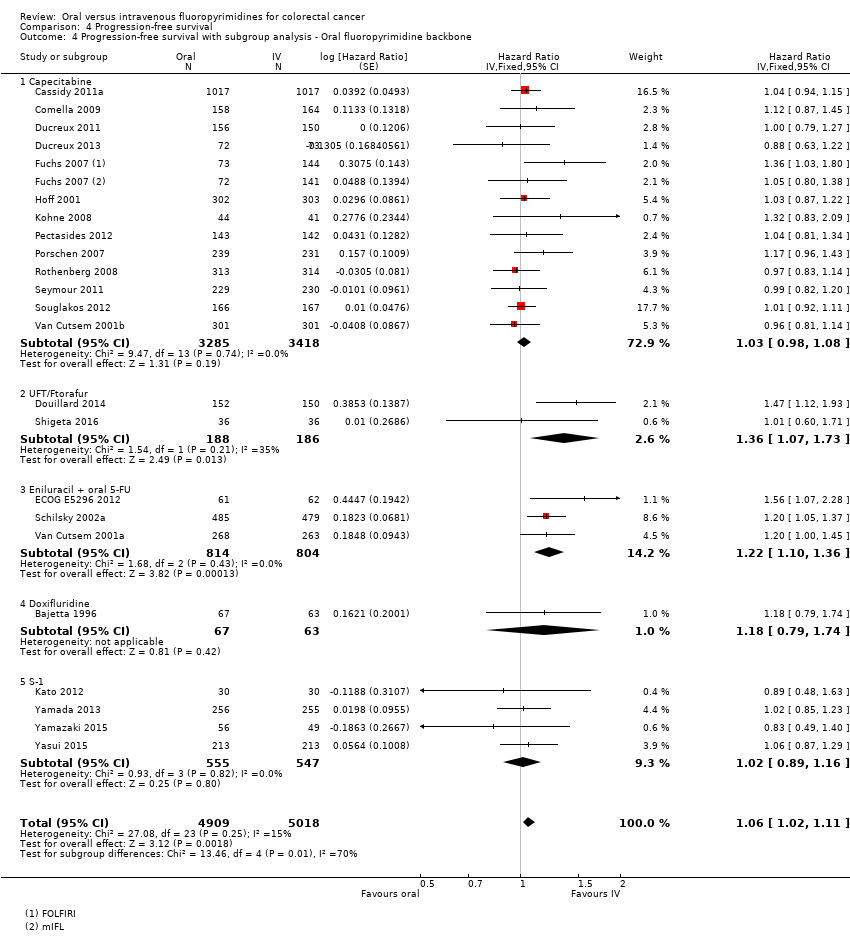
Forest plot of comparison: 4 Progression‐free survival with, outcome: 4.4 Progression‐free survival with subgroup analysis ‐ oral fluoropyrimidine backbone.
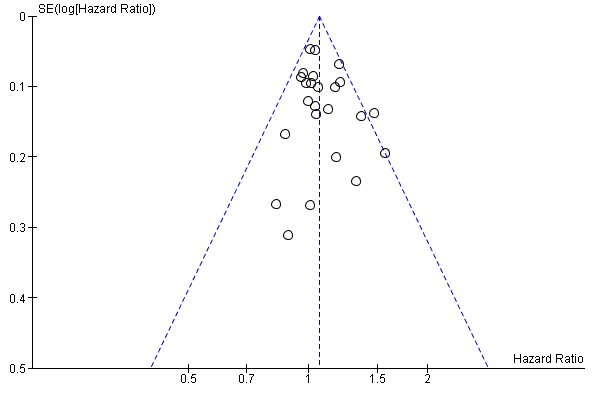
Funnel plot of progression‐free survival.
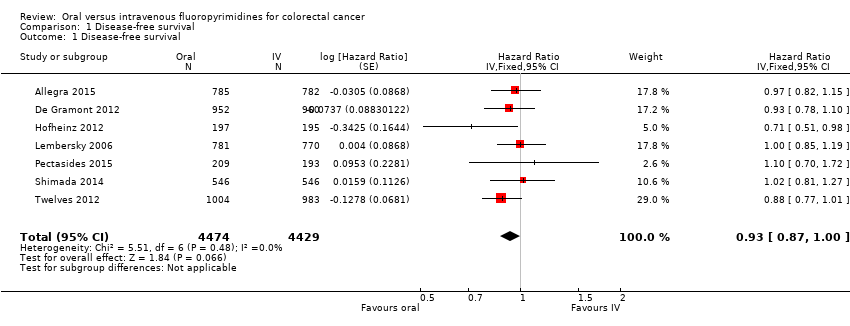
Comparison 1 Disease‐free survival, Outcome 1 Disease‐free survival.

Comparison 1 Disease‐free survival, Outcome 2 Disease‐free survival with subgroup analysis ‐ Chemotherapy vs chemo‐radiotherapy.

Comparison 1 Disease‐free survival, Outcome 3 Disease‐free survival with subgroup analysis ‐ Infusional vs bolus intravenous fluoropyrimidine.

Comparison 1 Disease‐free survival, Outcome 4 Disease‐free survival with subgroup analysis ‐ Oral fluoropyrimidine backbone.
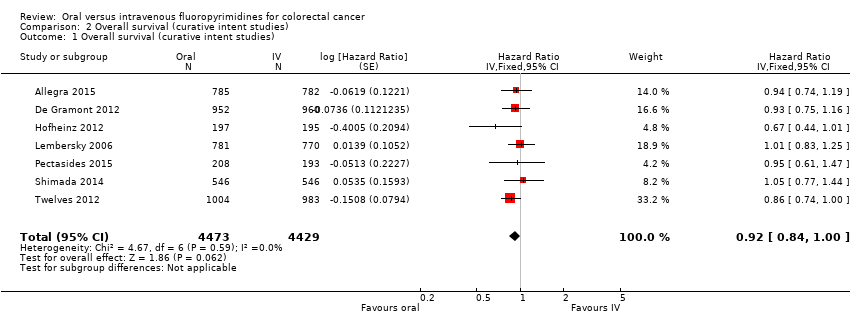
Comparison 2 Overall survival (curative intent studies), Outcome 1 Overall survival (curative intent studies).
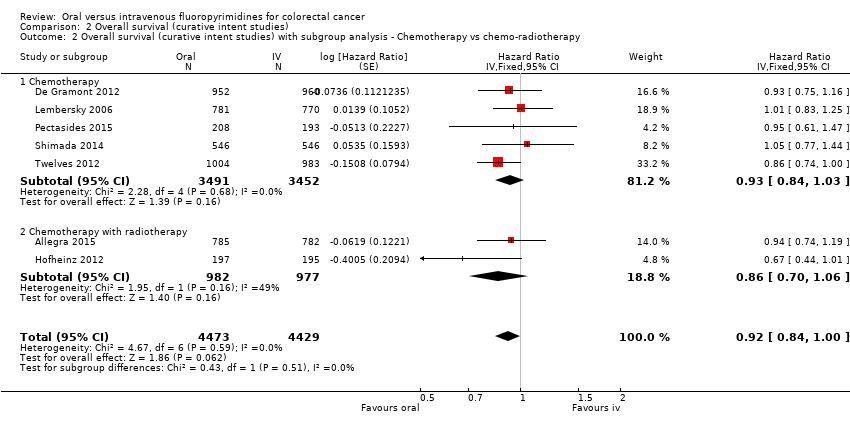
Comparison 2 Overall survival (curative intent studies), Outcome 2 Overall survival (curative intent studies) with subgroup analysis ‐ Chemotherapy vs chemo‐radiotherapy.

Comparison 2 Overall survival (curative intent studies), Outcome 3 Overall survival (curative intent studies) with subgroup analysis ‐ Infusional vs bolus intravenous fluoropyrimidine.

Comparison 2 Overall survival (curative intent studies), Outcome 4 Overall survival (curative intent studies) with subgroup analysis ‐ Oral fluoropyrimidine backbone.

Comparison 3 Grade ≥ 3 adverse events (curative intent studies), Outcome 1 Grade ≥ 3 diarrhoea (curative intent studies).
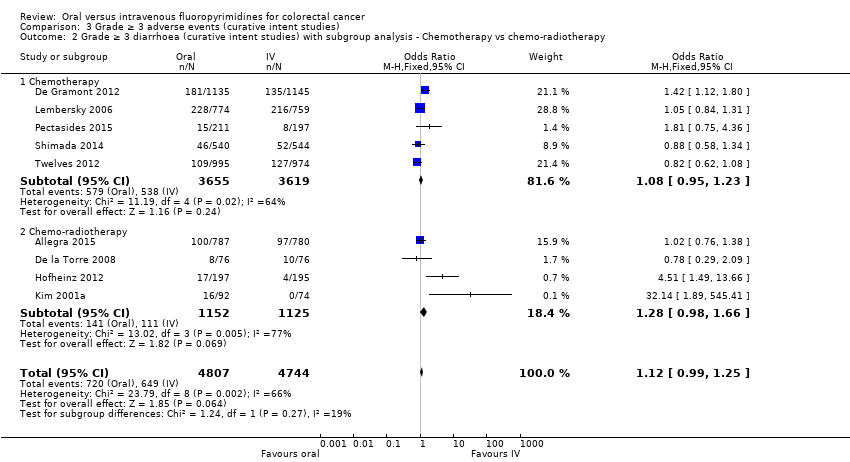
Comparison 3 Grade ≥ 3 adverse events (curative intent studies), Outcome 2 Grade ≥ 3 diarrhoea (curative intent studies) with subgroup analysis ‐ Chemotherapy vs chemo‐radiotherapy.
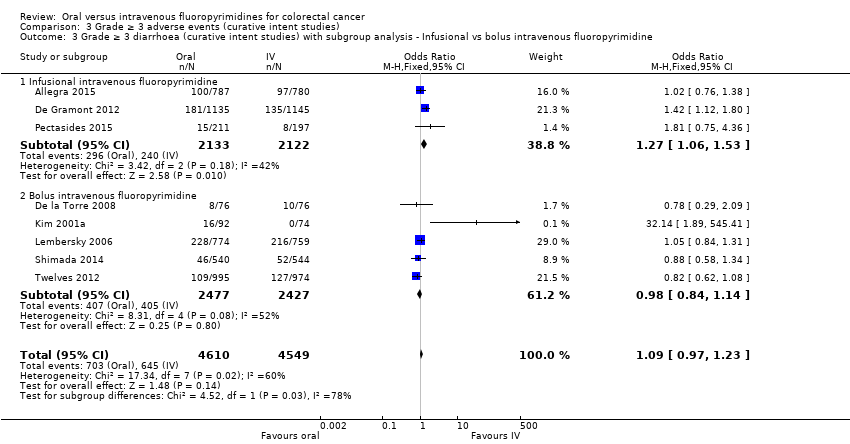
Comparison 3 Grade ≥ 3 adverse events (curative intent studies), Outcome 3 Grade ≥ 3 diarrhoea (curative intent studies) with subgroup analysis ‐ Infusional vs bolus intravenous fluoropyrimidine.

Comparison 3 Grade ≥ 3 adverse events (curative intent studies), Outcome 4 Grade ≥ 3 diarrhoea (curative intent studies) with subgroup analysis ‐ Oral fluoropyrimidine backbone.
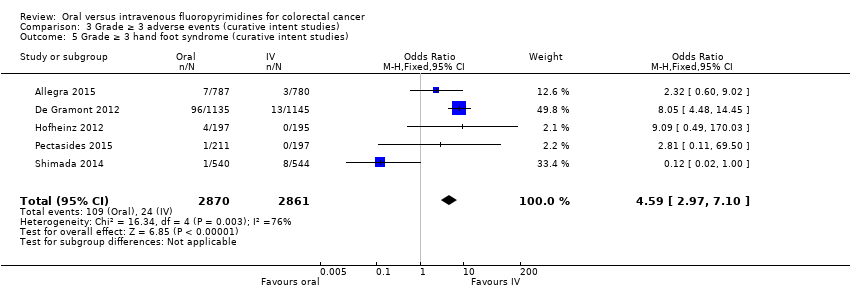
Comparison 3 Grade ≥ 3 adverse events (curative intent studies), Outcome 5 Grade ≥ 3 hand foot syndrome (curative intent studies).

Comparison 3 Grade ≥ 3 adverse events (curative intent studies), Outcome 6 Grade ≥ 3 neutropenia/granulocytopenia (curative intent studies).
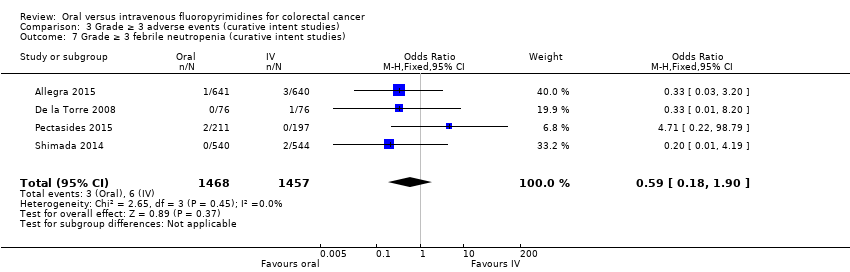
Comparison 3 Grade ≥ 3 adverse events (curative intent studies), Outcome 7 Grade ≥ 3 febrile neutropenia (curative intent studies).

Comparison 3 Grade ≥ 3 adverse events (curative intent studies), Outcome 8 Grade ≥ 3 vomiting (curative intent studies).

Comparison 3 Grade ≥ 3 adverse events (curative intent studies), Outcome 9 Grade ≥ 3 nausea (curative intent studies).
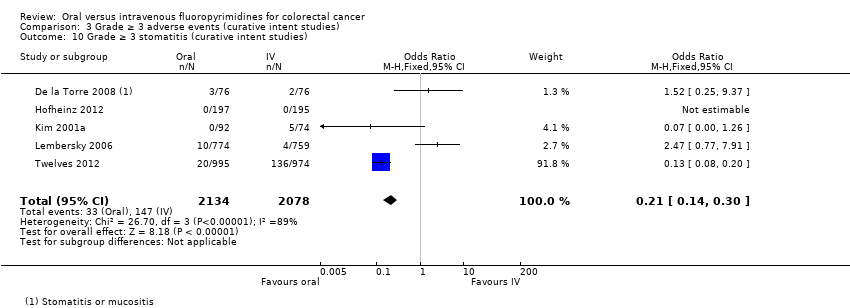
Comparison 3 Grade ≥ 3 adverse events (curative intent studies), Outcome 10 Grade ≥ 3 stomatitis (curative intent studies).

Comparison 3 Grade ≥ 3 adverse events (curative intent studies), Outcome 11 Grade ≥ 3 mucositis (curative intent studies).
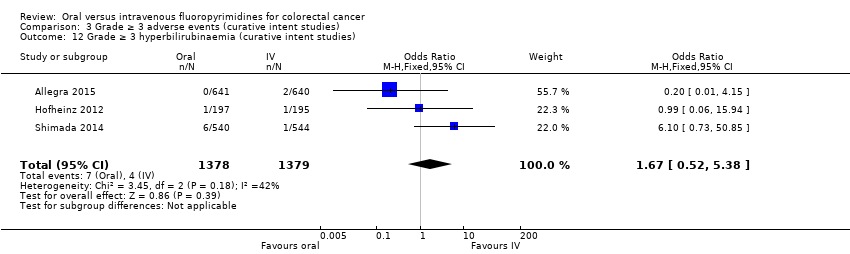
Comparison 3 Grade ≥ 3 adverse events (curative intent studies), Outcome 12 Grade ≥ 3 hyperbilirubinaemia (curative intent studies).
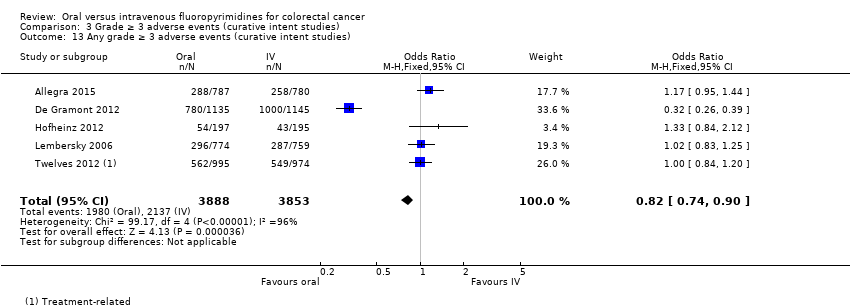
Comparison 3 Grade ≥ 3 adverse events (curative intent studies), Outcome 13 Any grade ≥ 3 adverse events (curative intent studies).
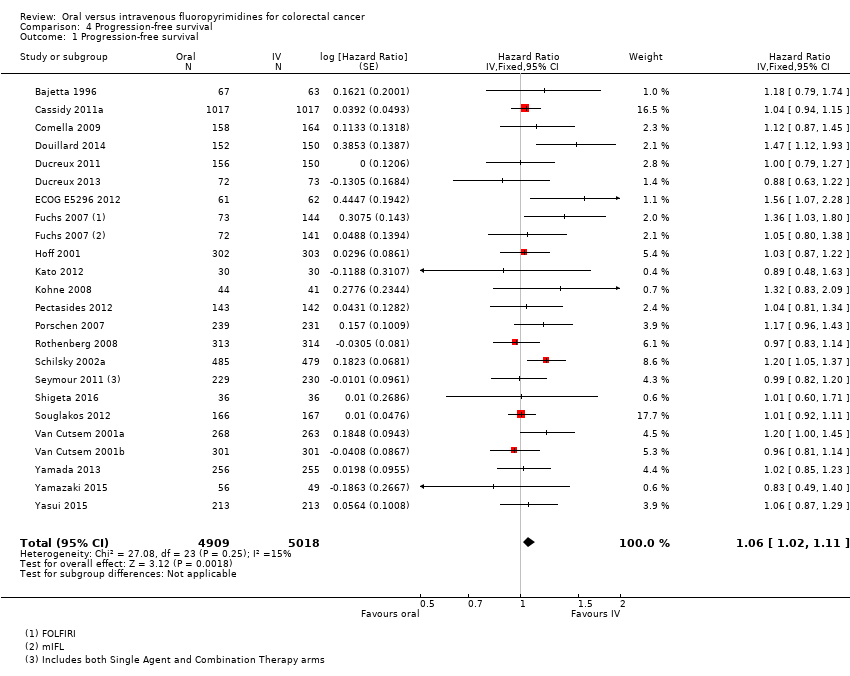
Comparison 4 Progression‐free survival, Outcome 1 Progression‐free survival.
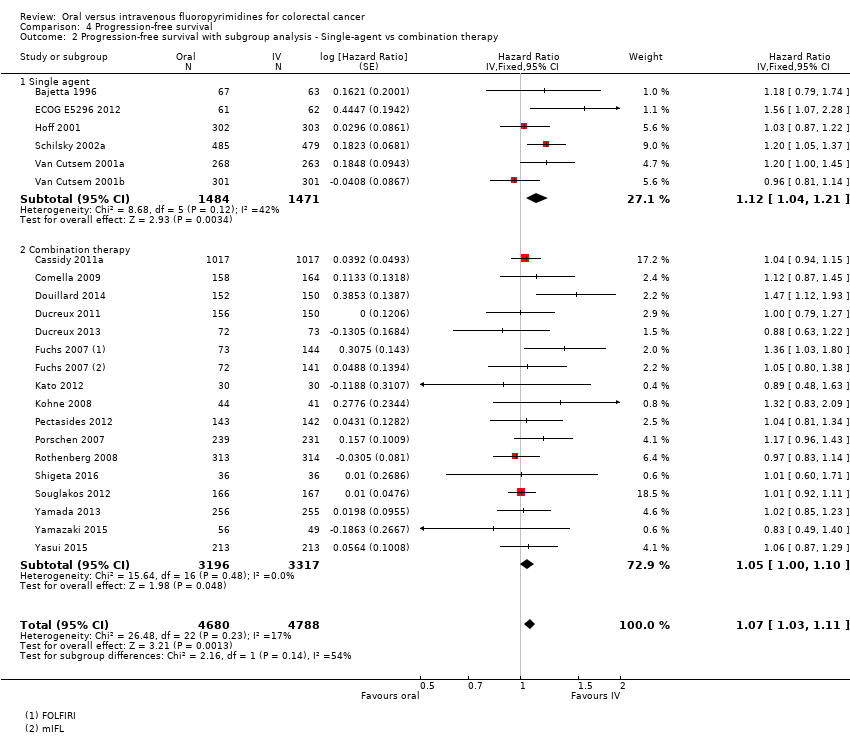
Comparison 4 Progression‐free survival, Outcome 2 Progression‐free survival with subgroup analysis ‐ Single‐agent vs combination therapy.
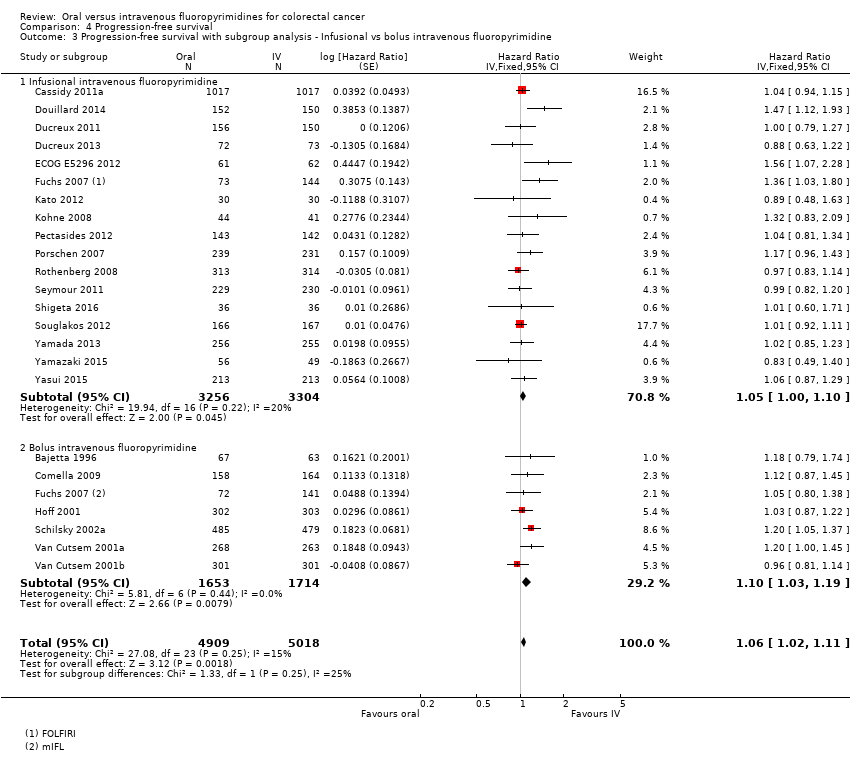
Comparison 4 Progression‐free survival, Outcome 3 Progression‐free survival with subgroup analysis ‐ Infusional vs bolus intravenous fluoropyrimidine.
Comparison 4 Progression‐free survival, Outcome 4 Progression‐free survival with subgroup analysis ‐ Oral fluoropyrimidine backbone.
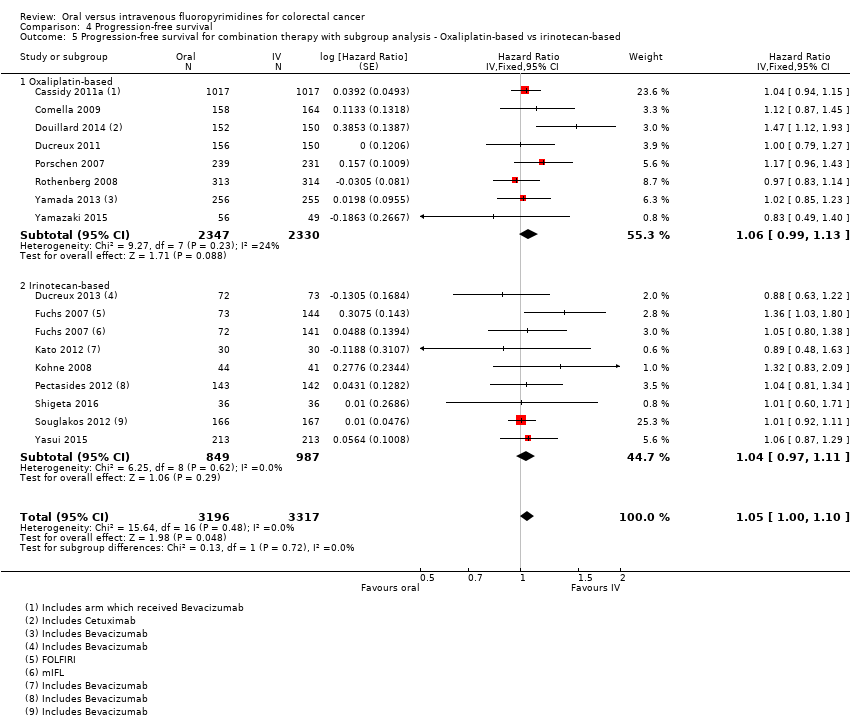
Comparison 4 Progression‐free survival, Outcome 5 Progression‐free survival for combination therapy with subgroup analysis ‐ Oxaliplatin‐based vs irinotecan‐based.

Comparison 4 Progression‐free survival, Outcome 6 Progression‐free survival for combination therapy with subgroup analysis ‐ with Bev vs no Bev.

Comparison 5 Overall survival (palliative intent studies), Outcome 1 Overall survival (palliative intent studies).
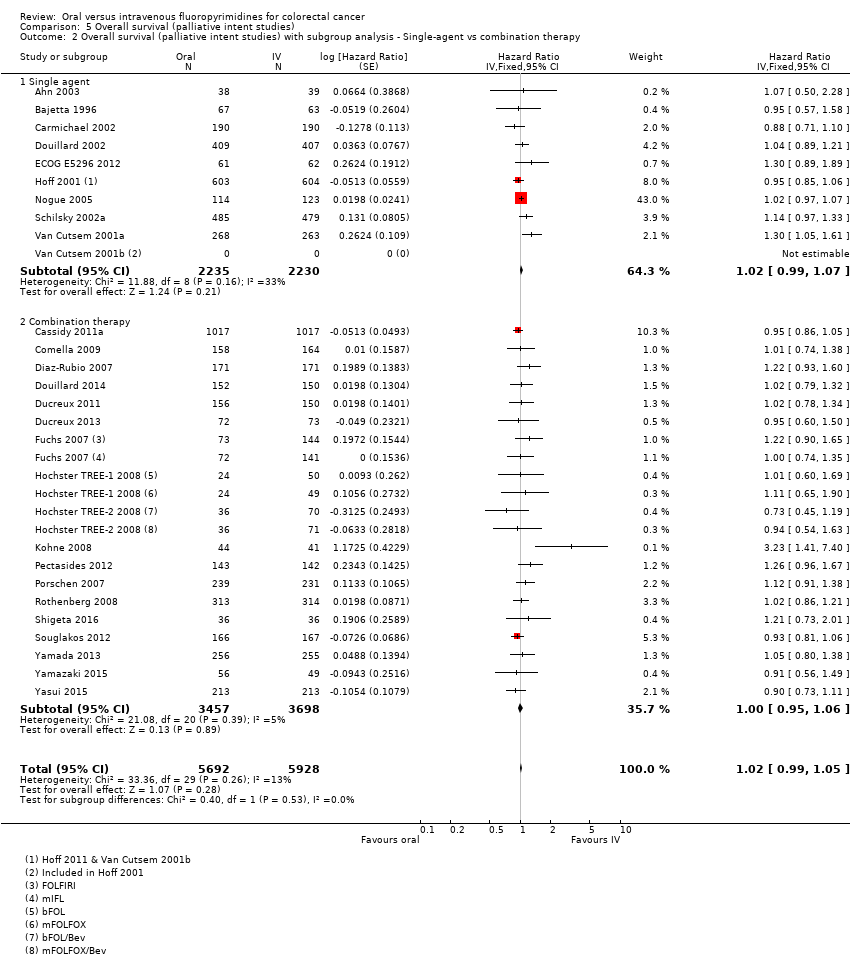
Comparison 5 Overall survival (palliative intent studies), Outcome 2 Overall survival (palliative intent studies) with subgroup analysis ‐ Single‐agent vs combination therapy.
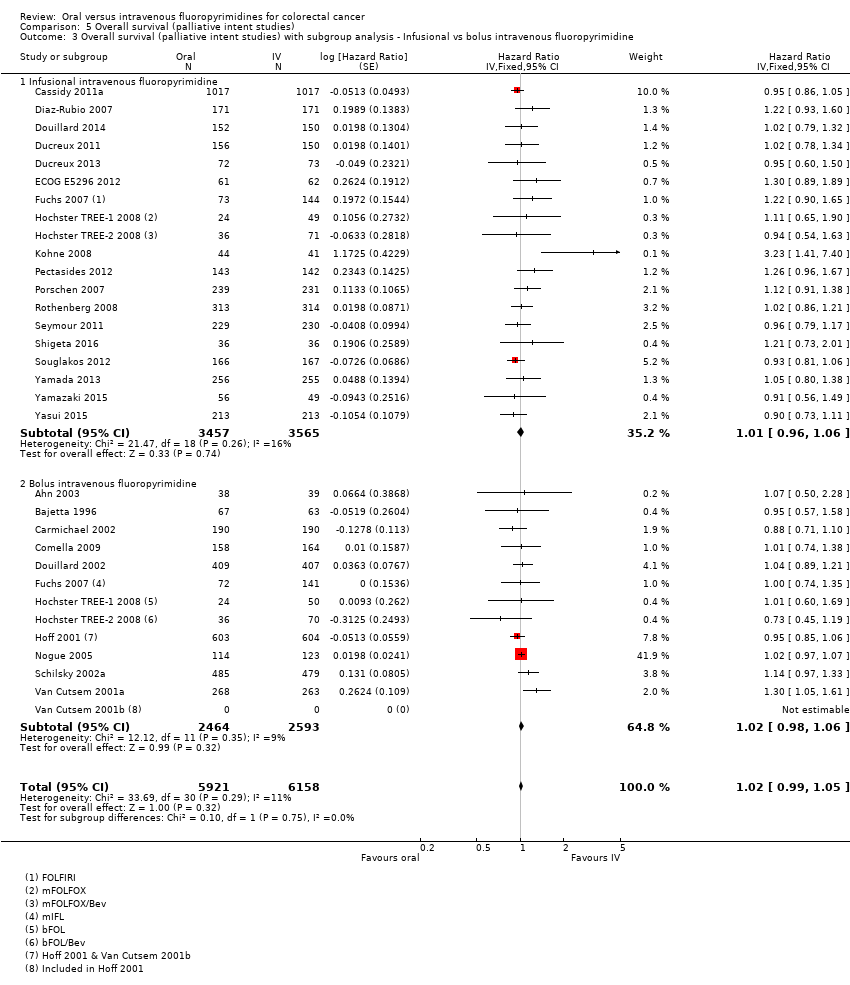
Comparison 5 Overall survival (palliative intent studies), Outcome 3 Overall survival (palliative intent studies) with subgroup analysis ‐ Infusional vs bolus intravenous fluoropyrimidine.
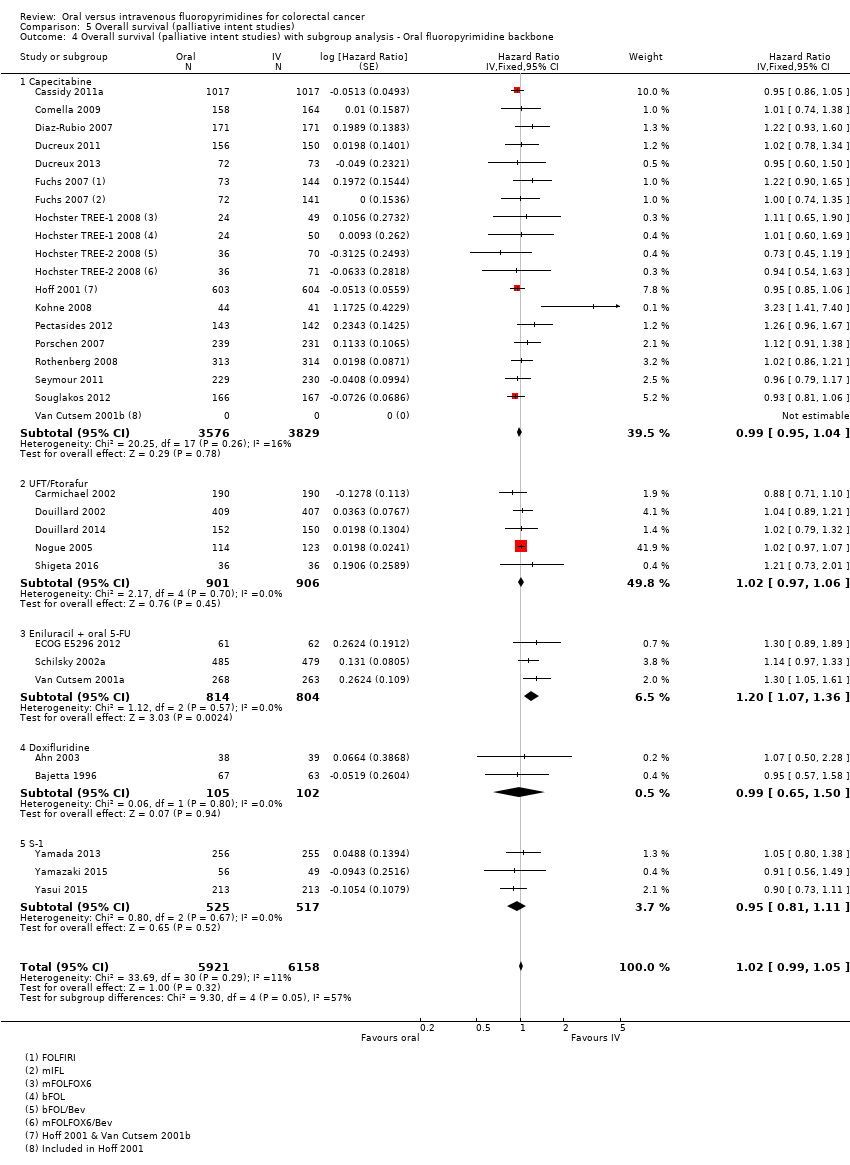
Comparison 5 Overall survival (palliative intent studies), Outcome 4 Overall survival (palliative intent studies) with subgroup analysis ‐ Oral fluoropyrimidine backbone.

Comparison 5 Overall survival (palliative intent studies), Outcome 5 Overall survival (palliative intent studies) for combination therapy with subgroup analysis ‐ Oxaliplatin‐based vs irinotecan‐based.

Comparison 6 Time to progression, Outcome 1 Time to progression.

Comparison 7 Objective response rate, Outcome 1 ORR.

Comparison 8 Grade ≥ 3 adverse events (palliative intent studies), Outcome 1 Grade ≥ 3 diarrhoea (palliative intent studies).

Comparison 8 Grade ≥ 3 adverse events (palliative intent studies), Outcome 2 Grade ≥ 3 diarrhoea (palliative intent studies) with subgroup analysis ‐ Single‐agent vs combination therapy.

Comparison 8 Grade ≥ 3 adverse events (palliative intent studies), Outcome 3 Grade ≥ 3 diarrhea (palliative intent studies) with subgroup analysis ‐ Infusional vs bolus intravenous fluoropyrimidine.

Comparison 8 Grade ≥ 3 adverse events (palliative intent studies), Outcome 4 Grade ≥ 3 diarrhoea (palliative intent studies) with subgroup analysis ‐ Oral fluoropyrimidine backbone.
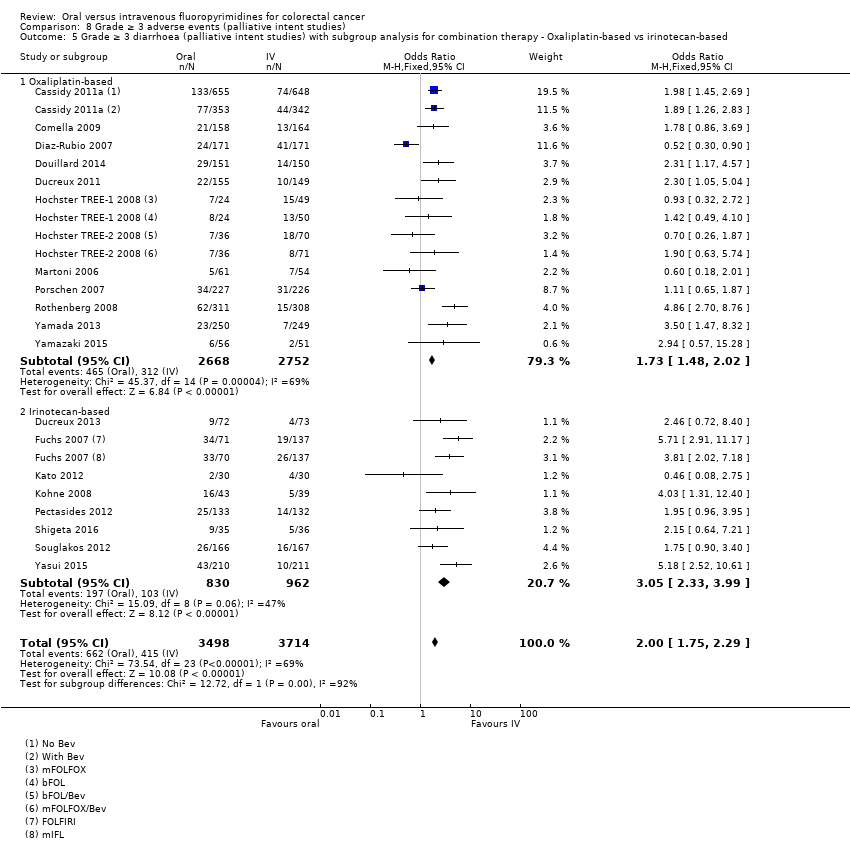
Comparison 8 Grade ≥ 3 adverse events (palliative intent studies), Outcome 5 Grade ≥ 3 diarrhoea (palliative intent studies) with subgroup analysis for combination therapy ‐ Oxaliplatin‐based vs irinotecan‐based.
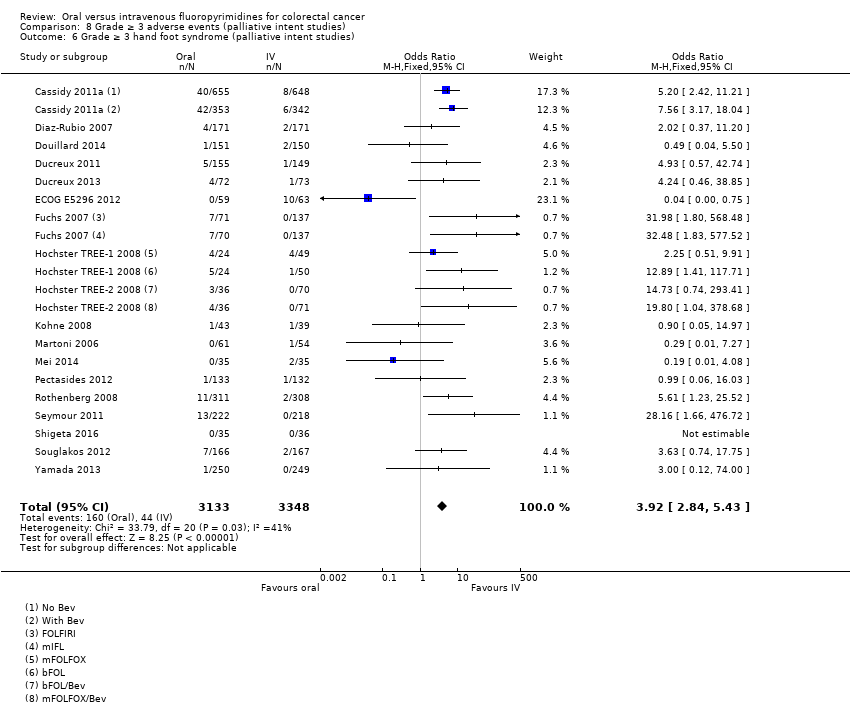
Comparison 8 Grade ≥ 3 adverse events (palliative intent studies), Outcome 6 Grade ≥ 3 hand foot syndrome (palliative intent studies).

Comparison 8 Grade ≥ 3 adverse events (palliative intent studies), Outcome 7 Grade ≥ 3 hand foot syndrome (palliative intent studies) with subgroup analysis ‐ Single‐agent vs combination therapy.
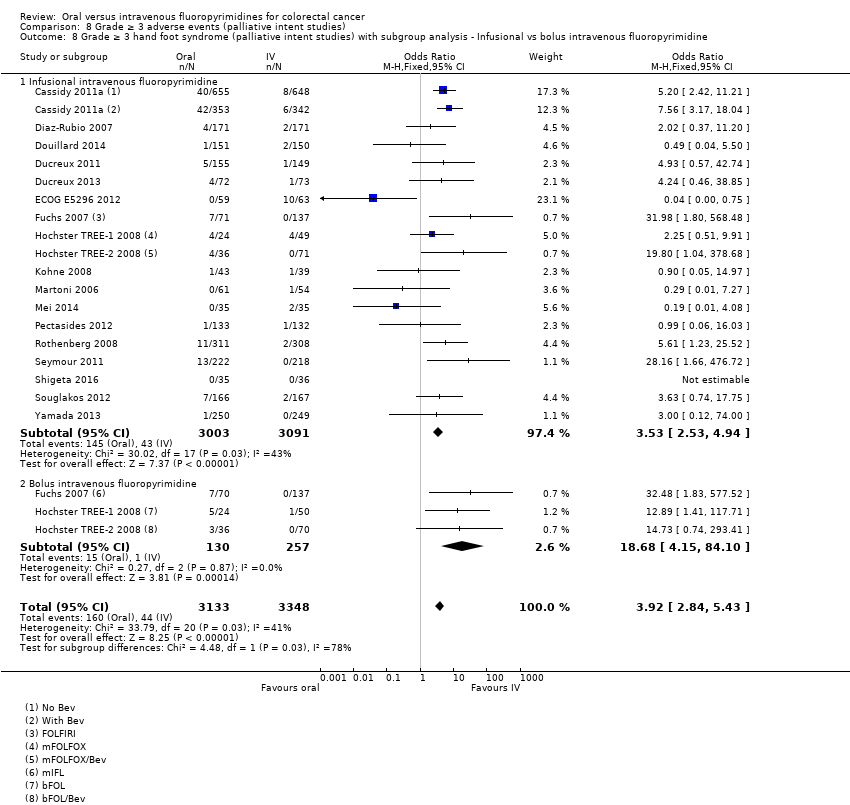
Comparison 8 Grade ≥ 3 adverse events (palliative intent studies), Outcome 8 Grade ≥ 3 hand foot syndrome (palliative intent studies) with subgroup analysis ‐ Infusional vs bolus intravenous fluoropyrimidine.
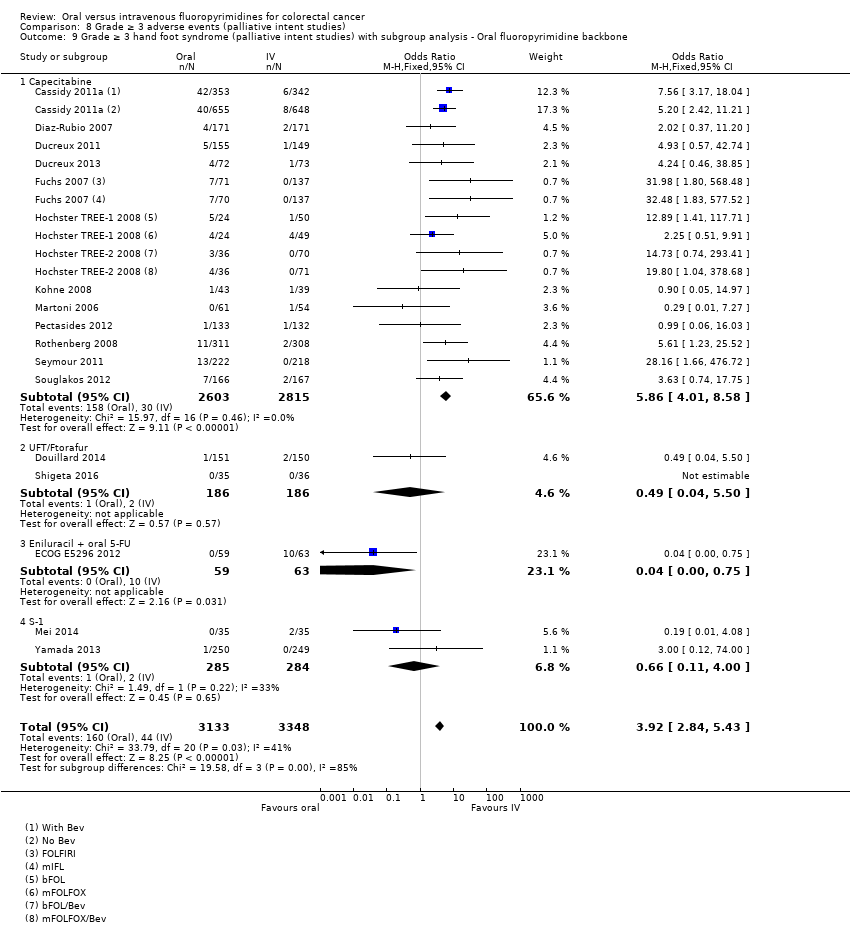
Comparison 8 Grade ≥ 3 adverse events (palliative intent studies), Outcome 9 Grade ≥ 3 hand foot syndrome (palliative intent studies) with subgroup analysis ‐ Oral fluoropyrimidine backbone.

Comparison 8 Grade ≥ 3 adverse events (palliative intent studies), Outcome 10 Grade ≥ 3 hand foot syndrome (palliative intent studies) with subgroup analysis for combination therapy ‐ Oxaliplatin‐based vs irinotecan‐based.

Comparison 8 Grade ≥ 3 adverse events (palliative intent studies), Outcome 11 Grade ≥ 3 neutropenia/granulocytopenia (palliative intent studies).
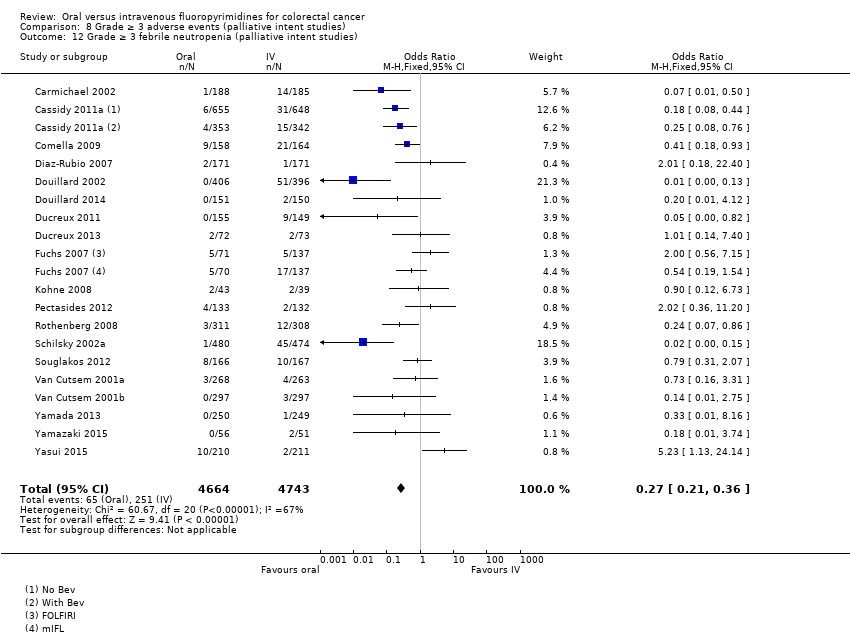
Comparison 8 Grade ≥ 3 adverse events (palliative intent studies), Outcome 12 Grade ≥ 3 febrile neutropenia (palliative intent studies).

Comparison 8 Grade ≥ 3 adverse events (palliative intent studies), Outcome 13 Grade ≥ 3 vomiting (palliative intent studies).
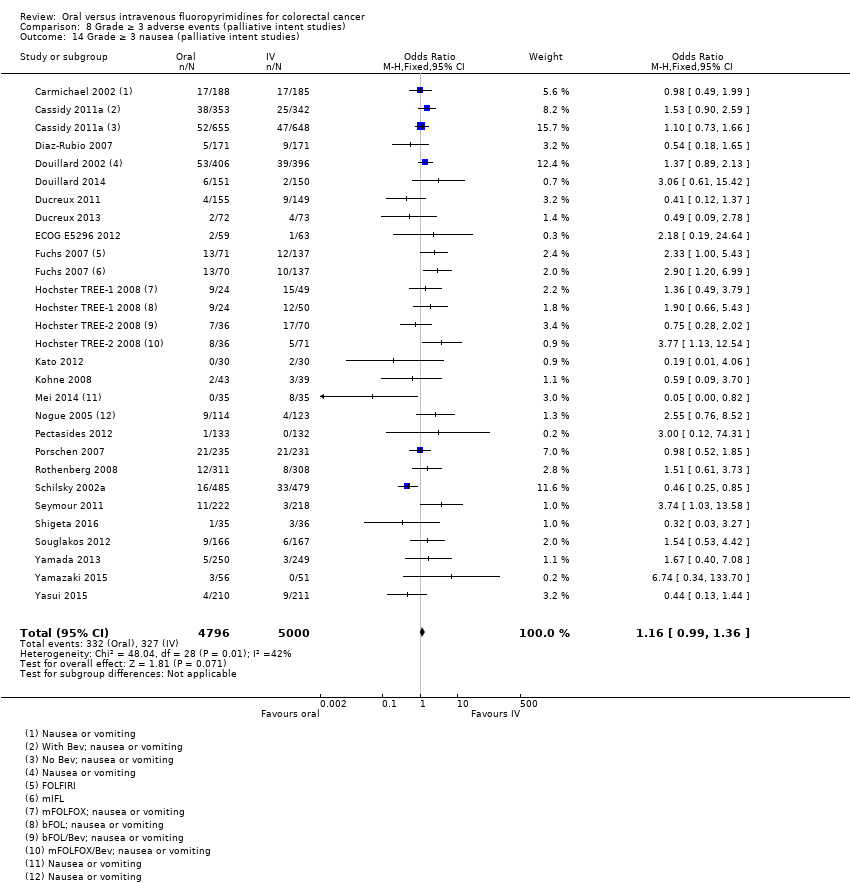
Comparison 8 Grade ≥ 3 adverse events (palliative intent studies), Outcome 14 Grade ≥ 3 nausea (palliative intent studies).
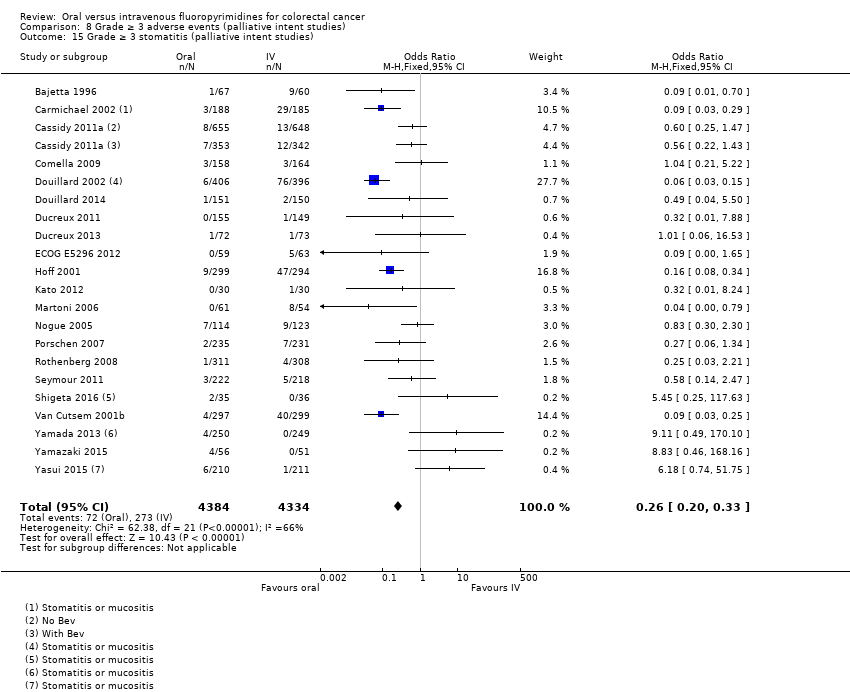
Comparison 8 Grade ≥ 3 adverse events (palliative intent studies), Outcome 15 Grade ≥ 3 stomatitis (palliative intent studies).

Comparison 8 Grade ≥ 3 adverse events (palliative intent studies), Outcome 16 Grade ≥ 3 mucositis (palliative intent studies).

Comparison 8 Grade ≥ 3 adverse events (palliative intent studies), Outcome 17 Grade ≥ 3 hyperbilirubinaemia (palliative intent studies).

Comparison 8 Grade ≥ 3 adverse events (palliative intent studies), Outcome 18 Any grade ≥ 3 adverse events (palliative intent studies).
| Oral compared with intravenous fluoropyrimidines for colorectal cancer ‐ Patients treated with curative intent | |||||
| Patient or population: Patients treated with curative intent for colorectal cancer with neoadjuvant and/or adjuvant chemotherapy Setting: Hospital Intervention: Oral fluoropyrimidines Comparison: Intravenous fluoropyrimidines | |||||
| Outcomes | Illustrative comparative risks (95% CI) | Relative effect | No. of participants | Quality of the evidence | |
| Assumed risk* | Corresponding risk** | ||||
| Intravenous fluoropyrimidines | Oral fluoropyrimidines | ||||
| Disease‐free survival | 313 per 1000a | 291 per 1000 (272 to 313) | HR 0.93 | 8903 | ⊕⊕⊕⊝ |
| Overall survival | 222 per 1000c | 204 per 1000 (186 to 222) | HR 0.92 (0.84 to 1.00) | 8902 (7 RCTs) | ⊕⊕⊕⊕ |
| Grade ≥ 3 diarrhoea | 137 per 1000d | 153 per 1000 (135 to 171) | OR 1.12 | 9551 | ⊕⊝⊝⊝ |
| Grade ≥ 3 hand foot syndrome | 8 per 1000d | 37 per 1000 (24 to 57) | OR 4.59g | 5731 | ⊕⊕⊝⊝ |
| Grade ≥ 3 neutropenia/granulocytopenia | 181 per 1000d | 25 per 1000 (20 to 29) | OR 0.14 (0.11 to 0.16) | 8087 (7 RCTs) | ⊕⊕⊕⊝ |
| *The basis for the assumed risk is provided in footnotes. **The corresponding risk (and its 95% CI) is based on the assumed risk in the comparison group and the relative effect of the intervention (and its 95% CI). Pooled estimates from fixed‐effects meta‐analysis are reported in the table | |||||
| GRADE Working Group grades of evidence | |||||
| aThe assumed risk for disease‐free survival was based on the 3‐year disease‐free survival rate in the control group from studies in the meta‐analysis (68.7%) bDowngraded by one level owing to a high risk of bias in included studies. cThe assumed risk for overall survival was based on the 5‐year overall survival rate in the control group from studies in the meta‐analysis (77.8%) dThe assumed risk for each grade ≥ 3 AE was the mean risk in the control group from studies in the meta‐analysis eDowngraded by one level owing to inconsistency of results that was supported by non‐overlapping CIs, high I2 values, and statistically significant heterogeneity of effect estimates fDowngraded by one level owing to imprecision gRandom‐effects estimate, OR 2.36 (95% CI 0.52 to 10.74). Pooled effect estimate was sensitive to the meta‐analysis model used | |||||
| Oral compared with intravenous fluoropyrimidines for colorectal cancer ‐ Patients treated with palliative intent | |||||
| Patient or population: Patients treated with palliative intent for inoperable advanced or metastatic colorectal cancer with chemotherapy Setting: Hospital Intervention: Oral fluoropyrimidines Comparison: Intravenous fluoropyrimidines | |||||
| Outcomes | Illustrative comparative risks (95% CI) | Relative effect | No. of participants | Quality of the evidence | |
| Assumed risk* | Corresponding risk** | ||||
| Intravenous fluoropyrimidines | Oral fluoropyrimidines | ||||
| Progression‐free survival | 398 per 1000a | 422 per 1000 (406 to 442) | HR 1.06 | 9927 | ⊕⊕⊕⊝ |
| Overall survival | 336 per 1000c | 343 per 1000 (333 to 353) | HR 1.02 (0.99 to 1.05) | 12,079 (29 RCTs) | ⊕⊕⊕⊕ |
| Grade ≥ 3 diarrhoea | 120 per 1000d | 199 per 1000 (180 to 221) | OR 1.66 | 11,997 | ⊕⊕⊝⊝ |
| Grade ≥ 3 hand foot syndrome | 13 per 1000d | 51 per 1000 (37 to 71) | OR 3.92 | 6481 | ⊕⊕⊕⊝ |
| Grade ≥ 3 neutropenia/granulocytopenia | 331 per 1000d | 56 per 1000 (50 to 60) | OR 0.17 (0.15 to 0.18) | 11,794 (29 RCTs) | ⊕⊕⊝⊝ |
| *The basis for the assumed risk is provided in footnotes. **The corresponding risk (and its 95% CI) is based on the assumed risk in the comparison group and the relative effect of the intervention (and its 95% CI). Pooled estimates from fixed‐effects meta‐analysis are reported in the table | |||||
| GRADE Working Group grades of evidence | |||||
| aThe assumed risk for progression‐free survival was based on the 6‐month progression‐free survival rate in the control group from studies in the meta‐analysis (60.2%) bDowngraded by one level owing to a high risk of bias in included studies cThe assumed risk for overall survival was based on the 12‐month overall survival rate in the control group from studies in the meta‐analysis (66.4%) dThe assumed risk for each grade ≥ 3 AE was the mean risk in the control group from the studies in the meta‐analysis eDowngraded by one level owing to inconsistency of results that was supported by non‐overlapping CIs, high I2 values, and statistically significant heterogeneity of effect estimates | |||||
| Treatment setting | Study ID | Phase | Treatment type | Treatment arm/s (oral), n randomised | Treatment arm/s (IV), n randomised | IV arm: bolus vs Infusional |
| Neoadjuvant | Rectal | |||||
| III | Fluoropyrimidine combined with RT | Capecitabine (Grp 2), n = 146 Capecitabine (Grp 5), n = 326 Capecitabine + oxaliplatin (Grp 6), n = 330 | 5‐FU (Grp 1), n = 147 5‐FU (Grp 3), n = 330 5‐FU + oxaliplatin (Grp 4), n = 329 | Infusional | ||
| III | Fluoropyrimidine combined with RT | UFT (Tegafur/Uracil) + LV with RT, n = 78 | 5‐FU + LV with RT, n = 77 | Bolus | ||
| Neoadjuvant/ Adjuvant | Rectal | |||||
| III | Fluoropyrimidine combined with RT | Capecitabine with RT, n = 197 ∙ Adjuvant cohort: n = 116 ∙ Neoadjuvant cohort: n = 81 | 5‐FU with RT, n = 195 ∙ Adjuvant cohort: n = 115 ∙ Neoadjuvant cohort: n = 80 | Bolus and infusional | ||
| Adjuvant | Rectal | |||||
| ND | Fluoropyrimidine combined with RT (after completion of 2C of fluoropyrimidine alone) | 5‐dFUR + LV, n = 92 | 5‐FU + LV, n = 74 | Bolus | ||
| Colon | ||||||
| III | Combination chemotherapy ‐ Oxaliplatin + Bevacizumab (BEV) | BEV‐XELOX, n = 952 | BEV‐FOLFOX4, n = 960 | Infusional | ||
| III | Fluoropyrimidine alone | UFT + LV, n = 805 | 5‐FU + LV, n = 803 | Bolus | ||
| III | Fluoropyrimidine alone | UFT + LV, n = 551 | 5‐FU + LV, n = 550 | Bolus | ||
| III | Fluoropyrimidine alone | Capecitabine, n = 1004 | 5‐FU + LV, n = 983 | Bolus | ||
| Colorectal | ||||||
| III | Combination chemotherapy ‐ fluoropyrimidine + oxaliplatin | CAPOX (capecitabine + oxaliplatin), n = 197 | mFOLFOX6, n = 211 | Infusional | ||
| IV: intravenous RT: radiotherapy 5‐FU: 5‐fluorouracil UFT: tegafur/uracil LV: leucovorin ND: no data available 5‐dFUR: doxifluridine BEV: bevacizumab | ||||||
| Oral fluoropyrimidine backbone | Study ID | Phase | Treatment line | Treatment arm/s (Oral), n randomised | Treatment arm/s (IV), n randomised | IV arm: Bolus vs Infusional |
| Capecitabine | III | First | Capecitabine, n = 302 | 5‐FU + LV, n = 303 | Bolus | |
| III | First | Capecitabine, n = 301 | 5‐FU + LV, n = 301 | Bolus | ||
| Doxifluridine (5‐dFUR) | II | First | 5‐dFUR + LV, n = 38 | 5‐FU + LV, n = 39 | Bolus | |
| II | First | 5‐dFUR + LV, n = 67 | 5‐dFUR + LV, n = 63 | Bolus | ||
| Eniluracil + oral 5‐FU | III | First | Eniluracil/Oral 5‐FU, n = 61 | 5‐FU, n = 64 | Infusional | |
| III | First | Eniluracil/Oral 5‐FU, n = 488 | 5‐FU + LV, n = 493 | Bolus | ||
| III | First | Eniluracil/Oral 5‐FU, n = 268 | 5‐FU + LV, n = 263 | Bolus | ||
| Ftorafur/tegafur (FT) | ND | First | Ftorafur, n = 30 | 5‐FU, n = 30 | Bolus | |
| Unclear; described as Phase IV in abstracts | First | FT + LV, n = 114 | 5‐FU + LV, n = 123 | Bolus | ||
| Ftorafur + uracil (UFT) | III | First | UFT + LV, n = 190 | 5FU + LV, n = 190 | Bolus | |
| III | First | UFT + LV, n = 409 | 5‐FU + LV, n = 407 | Bolus | ||
| IV: intravenous 5‐FU: 5‐fluorouracil LV: leucovorin 5‐dFUR: doxifluridine ND: no data available FT: tegafur UFT: tegafur + uracil | ||||||
| Chemotherapy | Study ID | Phase | Study design ‐ other details | Treatment line | Treatment arm/s (Oral), n randomised | Treatment arm/s (IV), n randomised | IV arm: Bolus vs Infusional |
| Oxaliplatin | Combination with capecitabine | ||||||
| III | 2 × 2 factorial ‐ following protocol amendment | First | XELOX alone, n = 317 | FOLFOX‐4 alone, n = 317 | Infusional | ||
| XELOX + Placebo, n = 350 | FOLFOX‐4 + Placebo, n = 351 | Infusional | |||||
| XELOX + BEV, n = 350 | FOLFOX‐4 + BEV, n = 350 | Infusional | |||||
| III | First | OXXEL (Capecitabine + oxaliplatin), n = 158 | OXAFAFU (5‐FU/LV + Oxaliplatin), n = 164 | Bolus | |||
| III | First | XELOX, n = 174 | FUOX (5‐FU + Oxaliplatin), n = 174 | Infusional | |||
| III | First | XELOX, n = 156 | FOLFOX‐6, n = 150 | Infusional | |||
| ND | First | CapeOx, n = 50 | mFOLFOX6, n = 50 | Infusional | |||
| bFOL, n = 50 | Bolus | ||||||
| ND | First | CapeOx + BEV, n = 74 | mFOLFOX6 + BEV, n = 75 | Infusional | |||
| bFOL + BEV, n = 74 | Bolus | ||||||
| II | First | XELOX, n = 62 | pviFOX, n = 56 | Infusional | |||
| III | First | CAPOX, n = 242 | FUFOX, n = 234 | Infusional | |||
| III | Second | XELOX, n = 313 | FOLFOX‐4, n = 314 | Infusional | |||
| ND | 2 × 2 factorial, cross‐over (only from no oxaliplatin to oxaliplatin) | First | Capecitabine or OxCap, n = 229 ∙ Capecitabine, n = 115 ∙ OxCap, n = 114 | 5‐FU or OxFU, n = 230 ∙ 5‐FU, n = 115 ∙ OxFU, n = 115 | Infusional | ||
| Combination with Ftorafur/uracil (UFT) | |||||||
| II | First | UFOX + Cetuximab, n = 152 | FOLFOX4 + Cetuximab, n = 150 | Infusional | |||
| Combination with S‐1 | |||||||
| ND | First | SOX, n = 35 | FOLFOX4, n = 35 | Infusional | |||
| III | First | SOX‐BEV, n = 256 | mFOLFOX6‐BEV, n = 256 | Infusional | |||
| II | First | SOL (S‐1 + oxaliplatin + oral LV), n = 56 | mFOLFOX6, n = 51 | Infusional | |||
| Irinotecan | Combination with capecitabine | ||||||
| II | First | XELIRI + BEV, n = 72 | FOLFIRI + BEV, n = 73 | Infusional | |||
| III | 3 × 2 factorial (Period 1) | First | CapeIRI + Celecoxib/Placebo, n = 145 | FOLFIRI + Celecoxib/Placebo, n = 144 | Infusional | ||
| mIFL + Celecoxib/Placebo, n = 141 | Bolus | ||||||
| III | 2 × 2 factorial | First | CAPIRI + Celecoxib/Placebo, n = 44 | FOLFIRI + Celecoxib/Placebo, n = 41 | Infusional | ||
| III | First | XELIRI + BEV, n = 143 | FOLFIRI + BEV, n = 142 | Infusional | |||
| II | First | XELIRI, n = ND | FOLFIRI, n = ND | Infusional | |||
| II | First | CAPIRI + BEV, n = 168 | FOLFIRI + BEV, n = 168 | Infusional | |||
| ND | First and second | Capecitabine + Irinotecan, n = 27 | 5‐FU + Irinotecan, n = 16 | Infusional | |||
| Combination with Ftorafur/uracil (UFT) | |||||||
| II | First | TEGAFIRI (UFT, leucovorin, irinotecan) ± BEV, n = 35 | FOLFIRI ± BEV, n = 36 | Infusional | |||
| Combination with S‐1 | |||||||
| II | First and second | Sequential IRIS‐BEV, n = 30 | mFOLFIRI‐BEV, n = 30 | Infusional | |||
| II/III | Second | IRIS (Irinotecan + S‐1), n = 213 | FOLFIRI, n = 213 | Infusional | |||
| IV: intravenous BEV: bevacizumab ND: no data available UFT: tegafur/uracil | |||||||
| Setting | Related | Related and unrelated | Not specified |
| Patients treated with curative intent for CRC with neoadjuvant and/or adjuvant chemotherapy | |||
| Patients treated with palliative intent for inoperable advanced or metastatic CRC with chemotherapy
|
| ||
| CRC: colorectal cancer | |||
| Study ID | Outcome | |||||||||||
| Efficacy | Grade ≥ 3 AE | |||||||||||
| DFS | OS | Diarrhoea | HFS | Neutropenia/ granulocytopenia | Febrile neutropenia | Vomiting | Nausea | Stomatitis | Mucositis | Hyperbilirubinemia | Any | |
| X | X | X | X | X | X | X | X | X | X | X | ||
| X | X | X | X | X | X | X | X | |||||
| Oa | Oa | X | Ob | X | X | X | Xc | Xc | ||||
| X | X | X | X | X | X | X | X | X | X | |||
| X | X | |||||||||||
| X | X | X | X | X | X | X | X | |||||
| X | X | X | X | X | X | X | X | X | ||||
| X | X | X | X | X | X | X | X | X | ||||
| X | X | X | Ob | X | Xd | Xd | X | Oe | X | |||
| X: Study contributed to the pooled effect estimate for the outcome O: Study reported the outcome but did not contribute to the pooled effect estimate for the outcome aInsufficient follow‐up time ‐ median 22 months in each arm (< 3 years) bAssessed grade ≥ 3 HFS using criteria not considered to be sufficiently similar to National Cancer Institute Common Terminology Criteria for Adverse Events (NCI CTCAE) (versions 2.0 to 4.0) cReported combined data for grade ≥ 3 stomatitis and mucositis dReported combined data for grade ≥ 3 vomiting and nausea eAssessed grade 3 ≥ hyperbilirubinaemia using criteria not considered to be sufficiently similar to NCI CTCAE (versions 2.0 to 4.0 and 1981) and World Health Organisation (WHO) (1981 version) AE: adverse event DFS: disease‐free survival OS: overall survival HFS: hand foot syndrome | ||||||||||||
| Study ID | Outcome | |||||||||||||
| Efficacy | Grade ≥ 3 AE | |||||||||||||
| PFS | TTP | OS | ORR | Diarrhoea | HFS | Neutropenia/ granulocytopenia | Febrile neutropenia | Vomiting | Nausea | Stomatitis | Mucositis | Hyperbilirubinemia | Any | |
| X | X | X | Oa | Oa | Oa | Oa | ||||||||
| Ob | X | |||||||||||||
| X | X | X | X | X | ||||||||||
| X | X | X | X | X | X | Xc | Xc | Xd | Xd | Oe | ||||
| X | X | X | X | X | X | X | Xc | Xc | X | X | ||||
| X | X | X | X | X | X | X | ||||||||
| X | X | X | X | X | X | X | X | X | X | X | ||||
| X | X | X | X | Of | X | X | Xc | Xc | Xd | Xd | Oe | |||
| X | X | X | X | X | X | X | X | X | X | X | X | X | ||
| X | X | X | X | X | X | X | X | X | X | |||||
| X | X | X | X | X | X | X | X | X | X | X | ||||
| X | X | X | X | X | X | X | X | X | X | X | ||||
| X | X | X | X | X | X | X | X | X | ||||||
| Ob | X | X | X | X | X | Xc | Xc | X | ||||||
| Ob | X | X | X | X | X | Xc | Xc | X | ||||||
| X | X | X | X | Og | X | X | X | X | X | |||||
| X | X | X | X | X | X | X | X | X | ||||||
| X | X | X | X | X | X | X | X | X | ||||||
| X | X | X | X | X | X | X | ||||||||
| Oh | X | X | Xc | Xc | ||||||||||
| X | X | X | X | X | Xc | Xc | X | |||||||
| X | X | X | X | X | X | X | X | X | X | X | ||||
| X | X | X | X | X | X | X | X | |||||||
| X | X | X | X | X | X | X | X | X | X | Oi | X | |||
| X | X | X | X | Og | X | X | X | X | X | |||||
| X | X | Oj | X | X | X | X | X | X | X | |||||
| X | X | X | X | X | X | X | X | Xd | Xd | X | X | |||
| Ob | Oa | Oa | Oa | |||||||||||
| X | X | X | X | X | X | X | X | X | X | |||||
| X | X | X | X | X | X | X | ||||||||
| X | X | X | X | Og | X | X | X | X | ||||||
| X | X | X | X | X | X | X | X | X | Xd | Xd | X | |||
| X | X | X | X | X | X | X | X | X | ||||||
| X | X | X | X | X | X | X | Xd | Xd | ||||||
| Ob | Ob | X | Oa | Oa | Oa | Oa | Oa | |||||||
| X: Study contributed to the pooled effect estimate for the outcome O: Study reported the outcome but did not contribute to the pooled effect estimate for the outcome aUnclear number of participants assessed for outcomes in both arms bHazard ratios could not be estimated either directly or indirectly from the provided information cReported combined data for grade ≥3 vomiting and nausea dReported combined data for grade ≥3 stomatitis and mucositis eAssessed grade ≥ 3 hyperbilirubinaemia using Common Toxicity Criteria (CTC), version not specified fAssessed grade ≥ 3 HFS using CTC, version not specified gAssessed grade ≥ 3 HFS using criteria not considered to be sufficiently similar to National Cancer Institute Common Terminology Criteria for Adverse Events (NCI CTCAE) (versions 2.0 to 4.0) hORR reported after 2 cycles of chemotherapy iAssessed grade ≥3 hyperbilirubinaemia using criteria not considered to be sufficiently similar to NCI CTCAE (versions 2.0 to 4.0 and 1981) and World Health Organisation (WHO) (1981 version) jORR reported 12 to 14 weeks after start of treatment AE: adverse event PFS: progression‐free survival TTP: time to progression OS: overall survival ORR: objective response rate HFS: hand foot syndrome | ||||||||||||||
| Risk of bias assessment | ||
| Low | Unclear | High |
| No studies | No studies | |
| Risk of bias assessment | ||
| Low | Unclear | High |
| Sensitivity analyses for PFS outcome | Original analysis: (effect estimatea, fixed | Sensitivity analysis: (effect estimatea, fixed |
| Excluding studies with 'High' risk of bias | 1.06 (1.02 to 1.11) | 1.01 (95% CI 0.96 to 1.07) |
| Excluding Seymour 2011 study (frail and elderly study population) | 1.06 (1.02 to 1.11) | 1.07 (1.03 to 1.11) |
| Excluding second‐line studies in patients treated with palliative intent for inoperable or metastatic colorectal cancerb | 1.06 (1.02 to 1.11) | 1.07 (1.03 to 1.12) |
| aEffect estimates presented as inverse‐variance hazard ratios for time‐to‐event outcomes, and Mantel‐Haenszel odds ratios for adverse events bAnalysis excluding Kato 2012, Rothenberg 2008, Yasui 2015, and Yu 2005. Kato 2012 and Yu 2005 included patients receiving first‐ or second‐line treatment PFS: progression‐free survival CI: confidence interval | ||
| Outcome or subgroup title | No. of studies | No. of participants | Statistical method | Effect size |
| 1 Disease‐free survival Show forest plot | 7 | 8903 | Hazard Ratio (Fixed, 95% CI) | 0.93 [0.87, 1.00] |
| 2 Disease‐free survival with subgroup analysis ‐ Chemotherapy vs chemo‐radiotherapy Show forest plot | 7 | 8903 | Hazard Ratio (Fixed, 95% CI) | 0.93 [0.87, 1.00] |
| 2.1 Chemotherapy | 5 | 6944 | Hazard Ratio (Fixed, 95% CI) | 0.94 [0.87, 1.02] |
| 2.2 Chemo‐radiotherapy | 2 | 1959 | Hazard Ratio (Fixed, 95% CI) | 0.91 [0.78, 1.05] |
| 3 Disease‐free survival with subgroup analysis ‐ Infusional vs bolus intravenous fluoropyrimidine Show forest plot | 6 | 8511 | Hazard Ratio (Fixed, 95% CI) | 0.95 [0.88, 1.02] |
| 3.1 Infusional intravenous fluoropyrimidine | 3 | 3881 | Hazard Ratio (Fixed, 95% CI) | 0.96 [0.85, 1.08] |
| 3.2 Bolus intravenous fluoropyrimidine | 3 | 4630 | Hazard Ratio (Fixed, 95% CI) | 0.94 [0.86, 1.04] |
| 4 Disease‐free survival with subgroup analysis ‐ Oral fluoropyrimidine backbone Show forest plot | 7 | 8903 | Hazard Ratio (Fixed, 95% CI) | 0.93 [0.87, 1.00] |
| 4.1 Capecitabine | 5 | 6260 | Hazard Ratio (Fixed, 95% CI) | 0.91 [0.83, 0.99] |
| 4.2 UFT/Ftorafur | 2 | 2643 | Hazard Ratio (Fixed, 95% CI) | 1.01 [0.88, 1.15] |
| Outcome or subgroup title | No. of studies | No. of participants | Statistical method | Effect size |
| 1 Overall survival (curative intent studies) Show forest plot | 7 | 8902 | Hazard Ratio (Fixed, 95% CI) | 0.92 [0.84, 1.00] |
| 2 Overall survival (curative intent studies) with subgroup analysis ‐ Chemotherapy vs chemo‐radiotherapy Show forest plot | 7 | 8902 | Hazard Ratio (Fixed, 95% CI) | 0.92 [0.84, 1.00] |
| 2.1 Chemotherapy | 5 | 6943 | Hazard Ratio (Fixed, 95% CI) | 0.93 [0.84, 1.03] |
| 2.2 Chemotherapy with radiotherapy | 2 | 1959 | Hazard Ratio (Fixed, 95% CI) | 0.86 [0.70, 1.06] |
| 3 Overall survival (curative intent studies) with subgroup analysis ‐ Infusional vs bolus intravenous fluoropyrimidine Show forest plot | 6 | 8510 | Hazard Ratio (Fixed, 95% CI) | 0.93 [0.85, 1.02] |
| 3.1 Infusional intravenous fluoropyrimidine | 3 | 3880 | Hazard Ratio (Fixed, 95% CI) | 0.94 [0.80, 1.09] |
| 3.2 Bolus intravenous fluoropyrimidine | 3 | 4630 | Hazard Ratio (Fixed, 95% CI) | 0.93 [0.83, 1.05] |
| 4 Overall survival (curative intent studies) with subgroup analysis ‐ Oral fluoropyrimidine backbone Show forest plot | 7 | 8902 | Hazard Ratio (Fixed, 95% CI) | 0.92 [0.84, 1.00] |
| 4.1 Capecitabine | 5 | 6259 | Hazard Ratio (Fixed, 95% CI) | 0.88 [0.79, 0.98] |
| 4.2 UFT/Ftorafur | 2 | 2643 | Hazard Ratio (Fixed, 95% CI) | 1.03 [0.86, 1.22] |
| Outcome or subgroup title | No. of studies | No. of participants | Statistical method | Effect size |
| 1 Grade ≥ 3 diarrhoea (curative intent studies) Show forest plot | 9 | 9551 | Odds Ratio (M‐H, Fixed, 95% CI) | 1.12 [0.99, 1.25] |
| 2 Grade ≥ 3 diarrhoea (curative intent studies) with subgroup analysis ‐ Chemotherapy vs chemo‐radiotherapy Show forest plot | 9 | 9551 | Odds Ratio (M‐H, Fixed, 95% CI) | 1.12 [0.99, 1.25] |
| 2.1 Chemotherapy | 5 | 7274 | Odds Ratio (M‐H, Fixed, 95% CI) | 1.08 [0.95, 1.23] |
| 2.2 Chemo‐radiotherapy | 4 | 2277 | Odds Ratio (M‐H, Fixed, 95% CI) | 1.28 [0.98, 1.66] |
| 3 Grade ≥ 3 diarrhoea (curative intent studies) with subgroup analysis ‐ Infusional vs bolus intravenous fluoropyrimidine Show forest plot | 8 | 9159 | Odds Ratio (M‐H, Fixed, 95% CI) | 1.09 [0.97, 1.23] |
| 3.1 Infusional intravenous fluoropyrimidine | 3 | 4255 | Odds Ratio (M‐H, Fixed, 95% CI) | 1.27 [1.06, 1.53] |
| 3.2 Bolus intravenous fluoropyrimidine | 5 | 4904 | Odds Ratio (M‐H, Fixed, 95% CI) | 0.98 [0.84, 1.14] |
| 4 Grade ≥ 3 diarrhoea (curative intent studies) with subgroup analysis ‐ Oral fluoropyrimidine backbone Show forest plot | 9 | 9551 | Odds Ratio (M‐H, Fixed, 95% CI) | 1.12 [0.99, 1.25] |
| 4.1 Capecitabine | 5 | 6616 | Odds Ratio (M‐H, Fixed, 95% CI) | 1.15 [0.99, 1.33] |
| 4.2 UFT/Ftorafur | 3 | 2769 | Odds Ratio (M‐H, Fixed, 95% CI) | 1.00 [0.83, 1.21] |
| 4.3 Doxifluridine | 1 | 166 | Odds Ratio (M‐H, Fixed, 95% CI) | 32.14 [1.89, 545.41] |
| 5 Grade ≥ 3 hand foot syndrome (curative intent studies) Show forest plot | 5 | 5731 | Odds Ratio (M‐H, Fixed, 95% CI) | 4.59 [2.97, 7.10] |
| 6 Grade ≥ 3 neutropenia/granulocytopenia (curative intent studies) Show forest plot | 7 | 8707 | Odds Ratio (M‐H, Fixed, 95% CI) | 0.14 [0.11, 0.16] |
| 7 Grade ≥ 3 febrile neutropenia (curative intent studies) Show forest plot | 4 | 2925 | Odds Ratio (M‐H, Fixed, 95% CI) | 0.59 [0.18, 1.90] |
| 8 Grade ≥ 3 vomiting (curative intent studies) Show forest plot | 8 | 9385 | Odds Ratio (M‐H, Fixed, 95% CI) | 1.05 [0.83, 1.34] |
| 9 Grade ≥ 3 nausea (curative intent studies) Show forest plot | 7 | 9233 | Odds Ratio (M‐H, Fixed, 95% CI) | 1.21 [0.97, 1.51] |
| 10 Grade ≥ 3 stomatitis (curative intent studies) Show forest plot | 5 | 4212 | Odds Ratio (M‐H, Fixed, 95% CI) | 0.21 [0.14, 0.30] |
| 11 Grade ≥ 3 mucositis (curative intent studies) Show forest plot | 4 | 2233 | Odds Ratio (M‐H, Fixed, 95% CI) | 0.64 [0.25, 1.62] |
| 12 Grade ≥ 3 hyperbilirubinaemia (curative intent studies) Show forest plot | 3 | 2757 | Odds Ratio (M‐H, Fixed, 95% CI) | 1.67 [0.52, 5.38] |
| 13 Any grade ≥ 3 adverse events (curative intent studies) Show forest plot | 5 | 7741 | Odds Ratio (M‐H, Fixed, 95% CI) | 0.82 [0.74, 0.90] |
| Outcome or subgroup title | No. of studies | No. of participants | Statistical method | Effect size |
| 1 Progression‐free survival Show forest plot | 23 | 9927 | Hazard Ratio (Fixed, 95% CI) | 1.06 [1.02, 1.11] |
| 2 Progression‐free survival with subgroup analysis ‐ Single‐agent vs combination therapy Show forest plot | 22 | 9468 | Hazard Ratio (Fixed, 95% CI) | 1.07 [1.03, 1.11] |
| 2.1 Single agent | 6 | 2955 | Hazard Ratio (Fixed, 95% CI) | 1.12 [1.04, 1.21] |
| 2.2 Combination therapy | 16 | 6513 | Hazard Ratio (Fixed, 95% CI) | 1.05 [1.00, 1.10] |
| 3 Progression‐free survival with subgroup analysis ‐ Infusional vs bolus intravenous fluoropyrimidine Show forest plot | 23 | 9927 | Hazard Ratio (Fixed, 95% CI) | 1.06 [1.02, 1.11] |
| 3.1 Infusional intravenous fluoropyrimidine | 17 | 6560 | Hazard Ratio (Fixed, 95% CI) | 1.05 [1.00, 1.10] |
| 3.2 Bolus intravenous fluoropyrimidine | 7 | 3367 | Hazard Ratio (Fixed, 95% CI) | 1.10 [1.03, 1.19] |
| 4 Progression‐free survival with subgroup analysis ‐ Oral fluoropyrimidine backbone Show forest plot | 23 | 9927 | Hazard Ratio (Fixed, 95% CI) | 1.06 [1.02, 1.11] |
| 4.1 Capecitabine | 13 | 6703 | Hazard Ratio (Fixed, 95% CI) | 1.03 [0.98, 1.08] |
| 4.2 UFT/Ftorafur | 2 | 374 | Hazard Ratio (Fixed, 95% CI) | 1.36 [1.07, 1.73] |
| 4.3 Eniluracil + oral 5‐FU | 3 | 1618 | Hazard Ratio (Fixed, 95% CI) | 1.22 [1.10, 1.36] |
| 4.4 Doxifluridine | 1 | 130 | Hazard Ratio (Fixed, 95% CI) | 1.18 [0.79, 1.74] |
| 4.5 S‐1 | 4 | 1102 | Hazard Ratio (Fixed, 95% CI) | 1.02 [0.89, 1.16] |
| 5 Progression‐free survival for combination therapy with subgroup analysis ‐ Oxaliplatin‐based vs irinotecan‐based Show forest plot | 16 | 6513 | Hazard Ratio (Fixed, 95% CI) | 1.05 [1.00, 1.10] |
| 5.1 Oxaliplatin‐based | 8 | 4677 | Hazard Ratio (Fixed, 95% CI) | 1.06 [0.99, 1.13] |
| 5.2 Irinotecan‐based | 8 | 1836 | Hazard Ratio (Fixed, 95% CI) | 1.04 [0.97, 1.11] |
| 6 Progression‐free survival for combination therapy with subgroup analysis ‐ with Bev vs no Bev Show forest plot | 14 | 6139 | Hazard Ratio (Fixed, 95% CI) | 1.03 [0.98, 1.08] |
| 6.1 With Bevacizumab | 6 | 2033 | Hazard Ratio (Fixed, 95% CI) | 1.00 [0.94, 1.07] |
| 6.2 No Bevacizumab | 9 | 4106 | Hazard Ratio (Fixed, 95% CI) | 1.06 [0.99, 1.13] |
| Outcome or subgroup title | No. of studies | No. of participants | Statistical method | Effect size |
| 1 Overall survival (palliative intent studies) Show forest plot | 29 | 12079 | Hazard Ratio (Fixed, 95% CI) | 1.02 [0.99, 1.05] |
| 2 Overall survival (palliative intent studies) with subgroup analysis ‐ Single‐agent vs combination therapy Show forest plot | 28 | 11620 | Hazard Ratio (Fixed, 95% CI) | 1.02 [0.99, 1.05] |
| 2.1 Single agent | 10 | 4465 | Hazard Ratio (Fixed, 95% CI) | 1.02 [0.99, 1.07] |
| 2.2 Combination therapy | 18 | 7155 | Hazard Ratio (Fixed, 95% CI) | 1.00 [0.95, 1.06] |
| 3 Overall survival (palliative intent studies) with subgroup analysis ‐ Infusional vs bolus intravenous fluoropyrimidine Show forest plot | 29 | 12079 | Hazard Ratio (Fixed, 95% CI) | 1.02 [0.99, 1.05] |
| 3.1 Infusional intravenous fluoropyrimidine | 19 | 7022 | Hazard Ratio (Fixed, 95% CI) | 1.01 [0.96, 1.06] |
| 3.2 Bolus intravenous fluoropyrimidine | 13 | 5057 | Hazard Ratio (Fixed, 95% CI) | 1.02 [0.98, 1.06] |
| 4 Overall survival (palliative intent studies) with subgroup analysis ‐ Oral fluoropyrimidine backbone Show forest plot | 29 | 12079 | Hazard Ratio (Fixed, 95% CI) | 1.02 [0.99, 1.05] |
| 4.1 Capecitabine | 16 | 7405 | Hazard Ratio (Fixed, 95% CI) | 0.99 [0.95, 1.04] |
| 4.2 UFT/Ftorafur | 5 | 1807 | Hazard Ratio (Fixed, 95% CI) | 1.02 [0.97, 1.06] |
| 4.3 Eniluracil + oral 5‐FU | 3 | 1618 | Hazard Ratio (Fixed, 95% CI) | 1.20 [1.07, 1.36] |
| 4.4 Doxifluridine | 2 | 207 | Hazard Ratio (Fixed, 95% CI) | 0.99 [0.65, 1.50] |
| 4.5 S‐1 | 3 | 1042 | Hazard Ratio (Fixed, 95% CI) | 0.95 [0.81, 1.11] |
| 5 Overall survival (palliative intent studies) for combination therapy with subgroup analysis ‐ Oxaliplatin‐based vs irinotecan‐based Show forest plot | 18 | 7155 | Hazard Ratio (Fixed, 95% CI) | 1.00 [0.95, 1.06] |
| 5.1 Oxaliplatin‐based | 11 | 5379 | Hazard Ratio (Fixed, 95% CI) | 1.00 [0.94, 1.07] |
| 5.2 Irinotecan‐based | 7 | 1776 | Hazard Ratio (Fixed, 95% CI) | 1.01 [0.92, 1.10] |
| Outcome or subgroup title | No. of studies | No. of participants | Statistical method | Effect size |
| 1 Time to progression Show forest plot | 6 | 1970 | Hazard Ratio (Fixed, 95% CI) | 1.07 [1.01, 1.14] |
| Outcome or subgroup title | No. of studies | No. of participants | Statistical method | Effect size |
| 1 ORR Show forest plot | 32 | 11115 | Odds Ratio (M‐H, Fixed, 95% CI) | 0.98 [0.90, 1.06] |
| Outcome or subgroup title | No. of studies | No. of participants | Statistical method | Effect size |
| 1 Grade ≥ 3 diarrhoea (palliative intent studies) Show forest plot | 30 | 11997 | Odds Ratio (M‐H, Fixed, 95% CI) | 1.66 [1.50, 1.84] |
| 2 Grade ≥ 3 diarrhoea (palliative intent studies) with subgroup analysis ‐ Single‐agent vs combination therapy Show forest plot | 30 | 11997 | Odds Ratio (M‐H, Fixed, 95% CI) | 1.66 [1.50, 1.84] |
| 2.1 Single agent | 10 | 4566 | Odds Ratio (M‐H, Fixed, 95% CI) | 1.22 [1.04, 1.44] |
| 2.2 Combination therapy | 21 | 7431 | Odds Ratio (M‐H, Fixed, 95% CI) | 2.03 [1.77, 2.32] |
| 3 Grade ≥ 3 diarrhea (palliative intent studies) with subgroup analysis ‐ Infusional vs bolus intravenous fluoropyrimidine Show forest plot | 30 | 11997 | Odds Ratio (M‐H, Fixed, 95% CI) | 1.66 [1.50, 1.84] |
| 3.1 Infusional intravenous fluoropyrimidine | 21 | 7065 | Odds Ratio (M‐H, Fixed, 95% CI) | 2.00 [1.74, 2.30] |
| 3.2 Bolus intravenous fluoropyrimidine | 12 | 4932 | Odds Ratio (M‐H, Fixed, 95% CI) | 1.31 [1.12, 1.53] |
| 4 Grade ≥ 3 diarrhoea (palliative intent studies) with subgroup analysis ‐ Oral fluoropyrimidine backbone Show forest plot | 30 | 11997 | Odds Ratio (M‐H, Fixed, 95% CI) | 1.66 [1.50, 1.84] |
| 4.1 Capecitabine | 17 | 7382 | Odds Ratio (M‐H, Fixed, 95% CI) | 1.76 [1.54, 2.00] |
| 4.2 UFT/Ftorafur | 5 | 1784 | Odds Ratio (M‐H, Fixed, 95% CI) | 1.60 [1.24, 2.06] |
| 4.3 Eniluracil + oral 5‐FU | 3 | 1617 | Odds Ratio (M‐H, Fixed, 95% CI) | 1.04 [0.79, 1.38] |
| 4.4 Doxifluridine | 1 | 127 | Odds Ratio (M‐H, Fixed, 95% CI) | 1.51 [0.64, 3.56] |
| 4.5 S‐1 | 4 | 1087 | Odds Ratio (M‐H, Fixed, 95% CI) | 3.55 [2.19, 5.76] |
| 5 Grade ≥ 3 diarrhoea (palliative intent studies) with subgroup analysis for combination therapy ‐ Oxaliplatin‐based vs irinotecan‐based Show forest plot | 20 | 7212 | Odds Ratio (M‐H, Fixed, 95% CI) | 2.00 [1.75, 2.29] |
| 5.1 Oxaliplatin‐based | 12 | 5420 | Odds Ratio (M‐H, Fixed, 95% CI) | 1.73 [1.48, 2.02] |
| 5.2 Irinotecan‐based | 8 | 1792 | Odds Ratio (M‐H, Fixed, 95% CI) | 3.05 [2.33, 3.99] |
| 6 Grade ≥ 3 hand foot syndrome (palliative intent studies) Show forest plot | 18 | 6481 | Odds Ratio (M‐H, Fixed, 95% CI) | 3.92 [2.84, 5.43] |
| 7 Grade ≥ 3 hand foot syndrome (palliative intent studies) with subgroup analysis ‐ Single‐agent vs combination therapy Show forest plot | 18 | 6481 | Odds Ratio (M‐H, Fixed, 95% CI) | 3.89 [2.82, 5.37] |
| 7.1 Single agent | 2 | 343 | Odds Ratio (M‐H, Fixed, 95% CI) | 1.11 [0.48, 2.56] |
| 7.2 Combination therapy | 17 | 6138 | Odds Ratio (M‐H, Fixed, 95% CI) | 4.76 [3.32, 6.82] |
| 8 Grade ≥ 3 hand foot syndrome (palliative intent studies) with subgroup analysis ‐ Infusional vs bolus intravenous fluoropyrimidine Show forest plot | 18 | 6481 | Odds Ratio (M‐H, Fixed, 95% CI) | 3.92 [2.84, 5.43] |
| 8.1 Infusional intravenous fluoropyrimidine | 18 | 6094 | Odds Ratio (M‐H, Fixed, 95% CI) | 3.53 [2.53, 4.94] |
| 8.2 Bolus intravenous fluoropyrimidine | 3 | 387 | Odds Ratio (M‐H, Fixed, 95% CI) | 18.68 [4.15, 84.10] |
| 9 Grade ≥ 3 hand foot syndrome (palliative intent studies) with subgroup analysis ‐ Oral fluoropyrimidine backbone Show forest plot | 18 | 6481 | Odds Ratio (M‐H, Fixed, 95% CI) | 3.92 [2.84, 5.43] |
| 9.1 Capecitabine | 13 | 5418 | Odds Ratio (M‐H, Fixed, 95% CI) | 5.86 [4.01, 8.58] |
| 9.2 UFT/Ftorafur | 2 | 372 | Odds Ratio (M‐H, Fixed, 95% CI) | 0.49 [0.04, 5.50] |
| 9.3 Eniluracil + oral 5‐FU | 1 | 122 | Odds Ratio (M‐H, Fixed, 95% CI) | 0.04 [0.00, 0.75] |
| 9.4 S‐1 | 2 | 569 | Odds Ratio (M‐H, Fixed, 95% CI) | 0.66 [0.11, 4.00] |
| 10 Grade ≥ 3 hand foot syndrome (palliative intent studies) with subgroup analysis for combination therapy ‐ Oxaliplatin‐based vs irinotecan‐based Show forest plot | 16 | 5919 | Odds Ratio (M‐H, Fixed, 95% CI) | 4.76 [3.31, 6.83] |
| 10.1 Oxaliplatin‐based | 10 | 4608 | Odds Ratio (M‐H, Fixed, 95% CI) | 4.52 [3.03, 6.75] |
| 10.2 Irinotecan‐based | 6 | 1311 | Odds Ratio (M‐H, Fixed, 95% CI) | 5.93 [2.52, 13.97] |
| 11 Grade ≥ 3 neutropenia/granulocytopenia (palliative intent studies) Show forest plot | 29 | 11794 | Odds Ratio (M‐H, Fixed, 95% CI) | 0.17 [0.15, 0.18] |
| 12 Grade ≥ 3 febrile neutropenia (palliative intent studies) Show forest plot | 19 | 9407 | Odds Ratio (M‐H, Fixed, 95% CI) | 0.27 [0.21, 0.36] |
| 13 Grade ≥ 3 vomiting (palliative intent studies) Show forest plot | 23 | 9528 | Odds Ratio (M‐H, Fixed, 95% CI) | 1.18 [1.00, 1.40] |
| 14 Grade ≥ 3 nausea (palliative intent studies) Show forest plot | 25 | 9796 | Odds Ratio (M‐H, Fixed, 95% CI) | 1.16 [0.99, 1.36] |
| 15 Grade ≥ 3 stomatitis (palliative intent studies) Show forest plot | 21 | 8718 | Odds Ratio (M‐H, Fixed, 95% CI) | 0.26 [0.20, 0.33] |
| 16 Grade ≥ 3 mucositis (palliative intent studies) Show forest plot | 12 | 4962 | Odds Ratio (M‐H, Fixed, 95% CI) | 0.17 [0.12, 0.24] |
| 17 Grade ≥ 3 hyperbilirubinaemia (palliative intent studies) Show forest plot | 9 | 2699 | Odds Ratio (M‐H, Fixed, 95% CI) | 1.62 [0.99, 2.64] |
| 18 Any grade ≥ 3 adverse events (palliative intent studies) Show forest plot | 14 | 5436 | Odds Ratio (M‐H, Fixed, 95% CI) | 0.83 [0.74, 0.94] |