First‐line drugs inhibiting the renin angiotensin system versus other first‐line antihypertensive drug classes for hypertension
Information
- DOI:
- https://doi.org/10.1002/14651858.CD008170.pub3Copy DOI

- Database:
-
- Cochrane Database of Systematic Reviews
- Version published:
-
- 14 November 2018see what's new
- Type:
-
- Intervention
- Stage:
-
- Review
- Cochrane Editorial Group:
-
Cochrane Hypertension Group
- Copyright:
-
- Copyright © 2018 The Cochrane Collaboration. Published by John Wiley & Sons, Ltd.
Article metrics
Altmetric:
Cited by:
Authors
Contributions of authors
James Wright formulated the idea for the review, developed the basis for the protocol and contributed to the interpretation of the finding and writing of the review.
Wen Lu Tang took the lead role in searching, identifying and assessing studies, in data extraction and analysis, and in writing up the review.
Yu Jie Chen took the executive role in identifying and assessing studies, in data extraction and analysis, and in writing up the updated review.
Hao Xue took the executive role in identifying and assessing studies, in data extraction and analysis, and in writing up the review (in the earlier version).
Liang Jin Li, Jia Yang Song, Ru Qiu, Qian Li and Hao Xue took part in identifying studies, and also checked data, and modified the draft In this updated review.
Zhuang Lu, Lu Wei Pang and Gan Mi Wang took part in identifying studies with the aid of Gavin Wong, and also checked data, and contributed to writing the review (in the earlier version); Zhuang Lu in particular spent a lot of time and energy on the above work.
Sources of support
Internal sources
-
University of British Columbia, Department of Anesthesiology, Pharmacology & Therapeutics, Canada.
External sources
-
Shanghai Municipal Commission of Health and Family Planning, 2016, China.
Declarations of interest
Yu Jie Chen: nothing to declare
Liang Jin Li: nothing to declare
Wen Lu Tang: nothing to declare
Jia Yang Song: nothing to declare
Ru Qiu: nothing to declare
Qian Li: nothing to declare
Hao Xue: nothing to declare
James M Wright: nothing to declare
Acknowledgements
The authors would like to acknowledge the help provided by the Cochrane Hypertension Group.
Version history
| Published | Title | Stage | Authors | Version |
| 2018 Nov 14 | First‐line drugs inhibiting the renin angiotensin system versus other first‐line antihypertensive drug classes for hypertension | Review | Yu Jie Chen, Liang Jin Li, Wen Lu Tang, Jia Yang Song, Ru Qiu, Qian Li, Hao Xue, James M Wright | |
| 2015 Jan 11 | First‐line drugs inhibiting the renin angiotensin system versus other first‐line antihypertensive drug classes for hypertension | Review | Hao Xue, Zhuang Lu, Wen Lu Tang, Lu Wei Pang, Gan Mi Wang, Gavin WK Wong, James M Wright | |
| 2009 Oct 07 | First‐line drugs inhibiting the renin angiotensin system versus other first‐line antihypertensive drug classes for hypertension | Protocol | Wenlu Tang, Gavin WK Wong, Marco I Perez, James M Wright | |
Differences between protocol and review
In the protocol, we identified non‐fatal serious adverse events (SAEs) as a primary outcome. However, when we extracted the data from included studies, none of them reported total SAEs in a manner that we could use in the review.
In the process of data extraction, we found that quite a few trials reported heart failure (HF) as a primary outcome, which was not specified in the protocol. Since HF is an important clinical endpoint, we added it to the primary outcomes in the review.
In this review, we replaced cardiovascular (CV) mortality with total CV events, to best reflect the overall effect, and because the cause of death was often not easy to identify due to few autopsies being performed.
We changed the author list to reflect the actual contributions of each author to this updated review.
Keywords
MeSH
Medical Subject Headings (MeSH) Keywords
- Angiotensin-Converting Enzyme Inhibitors [adverse effects, *therapeutic use];
- Antihypertensive Agents [adverse effects, *therapeutic use];
- Calcium Channel Blockers [adverse effects, therapeutic use];
- Cause of Death;
- Heart Failure [chemically induced, mortality, prevention & control];
- Hypertension [*drug therapy, mortality];
- Kidney Failure, Chronic [epidemiology];
- Myocardial Infarction [epidemiology];
- Randomized Controlled Trials as Topic;
- Renin-Angiotensin System [*drug effects];
- Sodium Chloride Symporter Inhibitors [adverse effects, therapeutic use];
- Stroke [chemically induced, prevention & control];
Medical Subject Headings Check Words
Aged; Humans;
PICOs

Risk of bias summary: review authors' judgements about each risk of bias item for each included citations
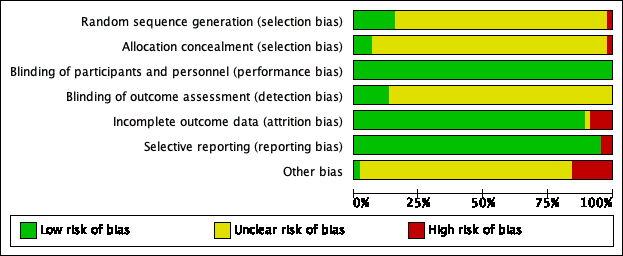
Risk of bias graph: review authors' judgements about each risk of bias item presented as percentages across all included citations

Comparison 1 RAS inhibitors vs CCBs, Outcome 1 All‐cause death.

Comparison 1 RAS inhibitors vs CCBs, Outcome 2 Total CV events.

Comparison 1 RAS inhibitors vs CCBs, Outcome 3 Total HF.

Comparison 1 RAS inhibitors vs CCBs, Outcome 4 Total MI.

Comparison 1 RAS inhibitors vs CCBs, Outcome 5 Total stroke.

Comparison 1 RAS inhibitors vs CCBs, Outcome 6 ESRF.

Comparison 1 RAS inhibitors vs CCBs, Outcome 7 SBP.

Comparison 1 RAS inhibitors vs CCBs, Outcome 8 DBP.

Comparison 1 RAS inhibitors vs CCBs, Outcome 9 HR.

Comparison 2 RAS inhibitors vs thiazides, Outcome 1 All‐cause death.

Comparison 2 RAS inhibitors vs thiazides, Outcome 2 Total CV events.

Comparison 2 RAS inhibitors vs thiazides, Outcome 3 Total HF.

Comparison 2 RAS inhibitors vs thiazides, Outcome 4 Total MI.

Comparison 2 RAS inhibitors vs thiazides, Outcome 5 Total stroke.

Comparison 2 RAS inhibitors vs thiazides, Outcome 6 ESRF.

Comparison 2 RAS inhibitors vs thiazides, Outcome 7 SBP.

Comparison 2 RAS inhibitors vs thiazides, Outcome 8 DBP.

Comparison 2 RAS inhibitors vs thiazides, Outcome 9 HR.

Comparison 3 RAS inhibitors vs beta‐blockers (β‐blockers), Outcome 1 All‐cause death.

Comparison 3 RAS inhibitors vs beta‐blockers (β‐blockers), Outcome 2 Total CV events.

Comparison 3 RAS inhibitors vs beta‐blockers (β‐blockers), Outcome 3 Total HF.

Comparison 3 RAS inhibitors vs beta‐blockers (β‐blockers), Outcome 4 Total MI.

Comparison 3 RAS inhibitors vs beta‐blockers (β‐blockers), Outcome 5 Total stroke.

Comparison 3 RAS inhibitors vs beta‐blockers (β‐blockers), Outcome 6 ESRF.

Comparison 3 RAS inhibitors vs beta‐blockers (β‐blockers), Outcome 7 SBP.

Comparison 3 RAS inhibitors vs beta‐blockers (β‐blockers), Outcome 8 DBP.

Comparison 3 RAS inhibitors vs beta‐blockers (β‐blockers), Outcome 9 HR.

Comparison 4 RAS inhibitors vs alpha‐blockers (α‐blockers), Outcome 1 SBP.

Comparison 4 RAS inhibitors vs alpha‐blockers (α‐blockers), Outcome 2 DBP.

Comparison 4 RAS inhibitors vs alpha‐blockers (α‐blockers), Outcome 3 HR.

Comparison 5 RAS inhibitors vs CNS active drug, Outcome 1 SBP.

Comparison 5 RAS inhibitors vs CNS active drug, Outcome 2 DBP.

Comparison 5 RAS inhibitors vs CNS active drug, Outcome 3 HR.
| First‐line RAS inhibitors compared to first‐line CCBs for hypertension | |||||||
| Patient or population: people with hypertension | |||||||
| Outcomes | Illustrative comparative risks* (95% CI) | Relative effect | No of participants | Certainty of the evidence (GRADE) | Comments | ||
| Assumed risk | Corresponding risk | ||||||
| CCBs | RAS inhibitors | ||||||
| All‐cause death | 124 per 1000 | 127 per 1000 | RR 1.03 | 35,226 | ⊕⊕⊕⊝ | ||
| Total cardiovascular events | 178 per 1000 | 174 per 1000 | RR 0.98 | 35,223 | ⊕⊕⊕⊝ | ||
| Death or hospitalization for heart failure | 72 per 1000 | 60 per 1000 | RR 0.83 | 35,143 | ⊕⊕⊕⊝ | ARR = 1.2% NNTB = 83 | |
| Total myocardial infarction | 68 per 1000 | 69 per 1000 | RR 1.01 | 35,043 | ⊕⊕⊕⊝ | ||
| Total stroke | 39 per 1000 | 46 per 1000 | RR 1.19 | 34,673 | ⊕⊕⊕⊝ | ARI = 0.7% NNTH = 143 | |
| End stage renal failure | 25 per 1000 | 22 per 1000 | RR 0.88 | 19,551 | ⊕⊕⊝⊝ | ||
| *The basis for the assumed risk (e.g. the median control group risk across studies) is provided in footnotes. The corresponding risk (and its 95% confidence interval) is based on the assumed risk in the comparison group and the relative effect of the intervention (and its 95% CI). | |||||||
| GRADE Working Group grades of evidence | |||||||
| 1Downgraded because we judged some of the included trials to be at high risk of bias. | |||||||
| First‐line RAS inhibitors compared to first‐line thiazides for hypertension | ||||||
| Patient or population: people with hypertension Comparison: First‐line thiazides | ||||||
| Outcomes | Illustrative comparative risks* (95% CI) | Relative effect | No of participants | Certainty of the evidence (GRADE) | Comments | |
| Assumed risk | Corresponding risk | |||||
| Thiazides | RAS inhibitors | |||||
| All‐cause death | 144 per 1000 | 144 per 1000 (135 to 154) | RR 1.00 (0.94 to 1.07) | 24,309 (1) | ⊕⊕⊕⊝ | |
| Total cardiovascular events | 194 per 1000 | 204 per 1000 | RR 1.05 | 24,379 | ⊕⊕⊕⊝ | |
| Death or hospitalization for heart failure | 57 per 1000 | 68 per 1000 (61 to 75) | RR 1.19 (1.07 to 1.31) | 24,309 (1) | ⊕⊕⊕⊝ | ARI = 1.1% NNTH = 91 |
| Total myocardial infarction | 93 per 1000 | 86 per 1000 | RR 0.93 | 24,379 | ⊕⊕⊕⊝ | |
| Total stroke | 44 per 1000 | 50 per 1000 (45 to 56) | RR 1.14 (1.02 to 1.28) | 24,309 (1) | ⊕⊕⊕⊝ | ARI = 0.6% NNTH = 167 |
| End stage renal failure Follow‐up: mean 4.9 years | 13 per 1000 | 14 per 1000 (11 to 18) | RR 1.10 (0.88 to 1.37) | 24,309 (1) | ⊕⊕⊝⊝ | |
| *The basis for the assumed risk (e.g. the median control group risk across studies) is provided in footnotes. The corresponding risk (and its 95% confidence interval) is based on the assumed risk in the comparison group and the relative effect of the intervention (and its 95% CI). | ||||||
| GRADE Working Group grades of evidence | ||||||
| 1Based on one large trial (ALLHAT 2002). | ||||||
| First‐line RAS inhibitors compared to first‐line beta‐blockers for hypertension | ||||||
| Patient or population: people with hypertension | ||||||
| Outcomes | Illustrative comparative risks* (95% CI) | Relative effect | No of participants | Certainty of the evidence | Comments | |
| Assumed risk | Corresponding risk | |||||
| Β‐blockers | RAS inhibitors | |||||
| All‐cause death | 94 per 1000 | 84 per 1000 | RR 0.89 (0.78 to 1.01) | 9193 (1) | ⊕⊕⊝⊝ | |
| Total cardiovascular events | 143 per 1000 | 126 per 1000 | RR 0.88 | 9239 | ⊕⊕⊝⊝ | ARR = 1.7% NNTB = 59 |
| Total heart failure | 35 per 1000 | 33 per 1000 (27 to 41) | RR 0.95 (0.76 to 1.18) | 9193 (1) | ⊕⊕⊝⊝ | |
| Total myocardial infarction | 41 per 1000 | 43 per 1000 | RR 1.05 | 9239 | ⊕⊕⊝⊝ | |
| Total stroke | 67 per 1000 | 50 per 1000 (42 to 59) | RR 0.75 (0.63 to 0.88) | 9193 (1) | ⊕⊕⊝⊝ | ARR = 1.7% NNTB = 59 |
| *The basis for the assumed risk (e.g. the median control group risk across studies) is provided in footnotes. The corresponding risk (and its 95% confidence interval) is based on the assumed risk in the comparison group and the relative effect of the intervention (and its 95% CI). | ||||||
| GRADE Working Group grades of evidence | ||||||
| 1Based primarily on one moderate‐sized trial (LIFE 2002). | ||||||
| Outcome or subgroup title | No. of studies | No. of participants | Statistical method | Effect size |
| 1 All‐cause death Show forest plot | 5 | 35226 | Risk Ratio (M‐H, Fixed, 95% CI) | 1.03 [0.98, 1.09] |
| 2 Total CV events Show forest plot | 6 | 35223 | Risk Ratio (M‐H, Fixed, 95% CI) | 0.98 [0.93, 1.02] |
| 3 Total HF Show forest plot | 5 | 35143 | Risk Ratio (M‐H, Fixed, 95% CI) | 0.83 [0.77, 0.90] |
| 4 Total MI Show forest plot | 5 | 35043 | Risk Ratio (M‐H, Fixed, 95% CI) | 1.01 [0.93, 1.09] |
| 5 Total stroke Show forest plot | 4 | 34673 | Risk Ratio (M‐H, Fixed, 95% CI) | 1.19 [1.08, 1.32] |
| 6 ESRF Show forest plot | 4 | 19551 | Risk Ratio (M‐H, Fixed, 95% CI) | 0.88 [0.74, 1.05] |
| 7 SBP Show forest plot | 20 | 36437 | Mean Difference (IV, Fixed, 95% CI) | 1.23 [0.90, 1.56] |
| 8 DBP Show forest plot | 20 | 36437 | Mean Difference (IV, Fixed, 95% CI) | 0.98 [0.79, 1.18] |
| 9 HR Show forest plot | 5 | 540 | Mean Difference (IV, Fixed, 95% CI) | 0.30 [‐1.63, 2.22] |
| Outcome or subgroup title | No. of studies | No. of participants | Statistical method | Effect size |
| 1 All‐cause death Show forest plot | 1 | 24309 | Risk Ratio (M‐H, Fixed, 95% CI) | 1.00 [0.94, 1.07] |
| 2 Total CV events Show forest plot | 2 | 24379 | Risk Ratio (M‐H, Fixed, 95% CI) | 1.05 [1.00, 1.11] |
| 3 Total HF Show forest plot | 1 | 24309 | Risk Ratio (M‐H, Fixed, 95% CI) | 1.19 [1.07, 1.31] |
| 4 Total MI Show forest plot | 2 | 24379 | Risk Ratio (M‐H, Fixed, 95% CI) | 0.93 [0.86, 1.01] |
| 5 Total stroke Show forest plot | 1 | 24309 | Risk Ratio (M‐H, Fixed, 95% CI) | 1.14 [1.02, 1.28] |
| 6 ESRF Show forest plot | 1 | 24309 | Risk Ratio (M‐H, Fixed, 95% CI) | 1.10 [0.88, 1.37] |
| 7 SBP Show forest plot | 10 | 26382 | Mean Difference (IV, Fixed, 95% CI) | 1.60 [1.20, 1.99] |
| 8 DBP Show forest plot | 9 | 26335 | Mean Difference (IV, Fixed, 95% CI) | ‐0.12 [‐0.36, 0.13] |
| 9 HR Show forest plot | 2 | 84 | Mean Difference (IV, Fixed, 95% CI) | 0.66 [‐2.87, 4.19] |
| Outcome or subgroup title | No. of studies | No. of participants | Statistical method | Effect size |
| 1 All‐cause death Show forest plot | 1 | 9193 | Risk Ratio (M‐H, Fixed, 95% CI) | 0.89 [0.78, 1.01] |
| 2 Total CV events Show forest plot | 2 | 9239 | Risk Ratio (M‐H, Fixed, 95% CI) | 0.88 [0.80, 0.98] |
| 3 Total HF Show forest plot | 1 | 9193 | Risk Ratio (M‐H, Fixed, 95% CI) | 0.95 [0.76, 1.18] |
| 4 Total MI Show forest plot | 2 | 9239 | Risk Ratio (M‐H, Fixed, 95% CI) | 1.05 [0.86, 1.27] |
| 5 Total stroke Show forest plot | 1 | 9193 | Risk Ratio (M‐H, Fixed, 95% CI) | 0.75 [0.63, 0.88] |
| 6 ESRF Show forest plot | 1 | 46 | Risk Ratio (M‐H, Fixed, 95% CI) | 0.33 [0.01, 7.78] |
| 7 SBP Show forest plot | 16 | 10905 | Mean Difference (IV, Fixed, 95% CI) | ‐0.55 [‐1.22, 0.11] |
| 8 DBP Show forest plot | 16 | 10905 | Mean Difference (IV, Fixed, 95% CI) | 0.48 [0.14, 0.83] |
| 9 HR Show forest plot | 10 | 9979 | Mean Difference (IV, Fixed, 95% CI) | 6.05 [5.59, 6.50] |
| Outcome or subgroup title | No. of studies | No. of participants | Statistical method | Effect size |
| 1 SBP Show forest plot | 3 | 380 | Mean Difference (IV, Fixed, 95% CI) | ‐2.38 [‐3.98, ‐0.78] |
| 2 DBP Show forest plot | 3 | 380 | Mean Difference (IV, Fixed, 95% CI) | ‐0.12 [‐1.09, 0.85] |
| 3 HR Show forest plot | 1 | 44 | Mean Difference (IV, Fixed, 95% CI) | 3.1 [‐2.41, 8.61] |
| Outcome or subgroup title | No. of studies | No. of participants | Statistical method | Effect size |
| 1 SBP Show forest plot | 1 | 56 | Mean Difference (IV, Fixed, 95% CI) | 1.30 [‐6.01, 8.61] |
| 2 DBP Show forest plot | 1 | 56 | Mean Difference (IV, Fixed, 95% CI) | ‐0.30 [‐1.85, 1.25] |
| 3 HR Show forest plot | 1 | 56 | Mean Difference (IV, Fixed, 95% CI) | 1.5 [‐4.13, 7.13] |