Symphysial fundal height (SFH) measurement in pregnancy for detecting abnormal fetal growth
Information
- DOI:
- https://doi.org/10.1002/14651858.CD008136.pub3Copy DOI

- Database:
-
- Cochrane Database of Systematic Reviews
- Version published:
-
- 08 September 2015see what's new
- Type:
-
- Intervention
- Stage:
-
- Review
- Cochrane Editorial Group:
-
Cochrane Pregnancy and Childbirth Group
- Copyright:
-
- Copyright © 2015 The Cochrane Collaboration. Published by John Wiley & Sons, Ltd.
Article metrics
Altmetric:
Cited by:
Authors
Contributions of authors
The updated review was prepared by Jacqueline J Ho and J Robert Peter with input from V Jayabalan and help from S Sivasangari.
Sources of support
Internal sources
-
Hospital Raja Permaisuri Bainun Ipoh, Malaysia.
-
Penang Medical College, Penang, Malaysia.
External sources
-
South East Asia‐Optimising Reproductive and Child Health In Developing Countries (SEA ORCHID Project), Malaysia.
-
UNDP/UNFPA/UNICEF/WHO/World Bank Special Programme of Research, Development and Research Training in Human Reproduction (HRP), Department of Reproductive Health and Research (RHR), World Health Organization, Switzerland.
Declarations of interest
None known.
Acknowledgements
SEA‐ORCHID project.
We thank Nasreen Aflaifel for her help in the production of the 'Summary of findings' table. Nasreen Aflaifel's work was financially supported by the UNDP/UNFPA/UNICEF/WHO/World Bank Special Programme of Research, Development and Research Training in Human Reproduction (HRP), Department of Reproductive Health and Research (RHR), World Health Organization. The named authors alone are responsible for the views expressed in this publication.
This project was supported by the National Institute for Health Research, via Cochrane Infrastructure funding to Cochrane Pregnancy and Childbirth. The views and opinions expressed therein are those of the authors and do not necessarily reflect those of the Systematic Reviews Programme, NIHR, NHS or the Department of Health.
Version history
| Published | Title | Stage | Authors | Version |
| 2015 Sep 08 | Symphysial fundal height (SFH) measurement in pregnancy for detecting abnormal fetal growth | Review | Japaraj Robert Peter, Jacqueline J Ho, Jayabalan Valliapan, Subramaniam Sivasangari | |
| 2012 Jul 11 | Symphysial fundal height (SFH) measurement in pregnancy for detecting abnormal fetal growth | Review | Japaraj Robert Peter, Jacqueline J Ho, Jayabalan Valliapan, Subramaniam Sivasangari | |
| 2009 Oct 07 | Symphysial fundal height measurement (SFH) in pregnancy for detecting abnormal fetal growth | Protocol | Japaraj Robert Peter, Jacqueline J Ho, Jayabalan Valliapan, Subramaniam Sivasangari | |
Differences between protocol and review
The methods have been updated in accordance with the latest version of the Cochrane Handbook for Systematic Reviews of Interventions (Higgins 2011) and Pregnancy and Childbirth standard methods text. We added the words 'or clinical palpation' to the objectives to broaden it so that it matched the description given in the section on the types of interventions. A 'Summary of findings' table has been incorporated for the 2015 update.
Keywords
MeSH
Medical Subject Headings (MeSH) Keywords
Medical Subject Headings Check Words
Female; Humans; Pregnancy;
PICOs
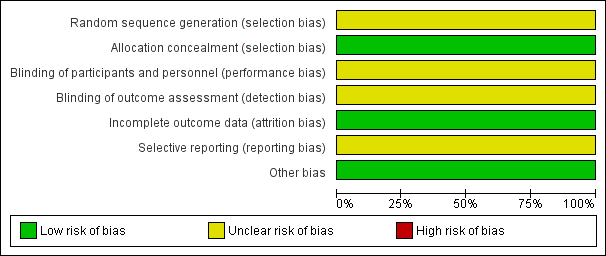
'Risk of bias' graph: review authors' judgements about each risk of bias item presented as percentages across all included studies.
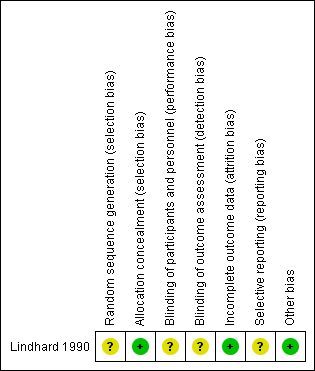
'Risk of bias' summary: review authors' judgements about each risk of bias item for each included study.

Comparison 1 Tape measurement versus clinical palpation, Outcome 1 Neonatal detection of small‐for‐dates.

Comparison 1 Tape measurement versus clinical palpation, Outcome 2 Perinatal death.

Comparison 1 Tape measurement versus clinical palpation, Outcome 3 Neonatal hypoglycaemia.

Comparison 1 Tape measurement versus clinical palpation, Outcome 4 Admission to neonatal nursery.

Comparison 1 Tape measurement versus clinical palpation, Outcome 5 Admission to neonatal nursery because of intrauterine growth restriction.

Comparison 1 Tape measurement versus clinical palpation, Outcome 6 Induction of labour.

Comparison 1 Tape measurement versus clinical palpation, Outcome 7 Caesarean section.
| Tape measurement compared with clinical palpation for pregnancy for detecting abnormal fetal growth | ||||||
| Patient or population: Pregnant women with singleton fetuses who were of 20 weeks' gestation and above. | ||||||
| Outcomes | Illustrative comparative risks* (95% CI) | Relative effect | No of Participants | Quality of the evidence | Comments | |
| Assumed risk | Corresponding risk | |||||
| clinical palpation | Tape measurement | |||||
| Neonatal detection of small‐for‐dates | Study population | RR 1.32 | 1639 | ⊕⊕⊝⊝ | ||
| 57 per 1000 | 76 per 1000 | |||||
| Moderate | ||||||
| 58 per 1000 | 76 per 1000 | |||||
| Neonatal detection of large‐for‐gestational age | The study did not have data on this outcome. | |||||
| Perinatal mortality | Study population | RR 1.25 | 1639 | ⊕⊕⊝⊝ | ||
| 6 per 1000 | 7 per 1000 | |||||
| Moderate | ||||||
| 6 per 1000 | 8 per 1000 | |||||
| Intrauterine death | The study did not have data on this outcome. | |||||
| Caesarean section | Study population | RR 0.72 | 1639 | ⊕⊝⊝⊝ | ||
| 16 per 1000 | 11 per 1000 | |||||
| Moderate | ||||||
| 16 per 1000 | 11 per 1000 | |||||
| Neurodevelopmental outcome in childhood | The study did not have address this outcome. | |||||
| Admission to neonatal nursery | Study population | RR 1.06 | 1639 | ⊕⊕⊝⊝ | ||
| 50 per 1000 | 53 per 1000 | |||||
| Moderate | ||||||
| 50 per 1000 | 53 per 1000 | |||||
| *The basis for the assumed risk (e.g. the median control group risk across studies) is provided in footnotes. The corresponding risk (and its 95% confidence interval) is based on the assumed risk in the comparison group and the relative effect of the intervention (and its 95% CI). | ||||||
| GRADE Working Group grades of evidence | ||||||
| 1One study with unclear risk of bias 2Wide CI crossing the line of no effect 3One small study with few events and wide CI crossing the line of no effect 4 Only one small study | ||||||
| Outcome or subgroup title | No. of studies | No. of participants | Statistical method | Effect size |
| 1 Neonatal detection of small‐for‐dates Show forest plot | 1 | 1639 | Risk Ratio (M‐H, Fixed, 95% CI) | 1.32 [0.92, 1.90] |
| 2 Perinatal death Show forest plot | 1 | 1639 | Risk Ratio (M‐H, Fixed, 95% CI) | 1.25 [0.38, 4.07] |
| 3 Neonatal hypoglycaemia Show forest plot | 1 | 85 | Risk Ratio (M‐H, Fixed, 95% CI) | 1.10 [0.47, 2.58] |
| 4 Admission to neonatal nursery Show forest plot | 1 | 1639 | Risk Ratio (M‐H, Fixed, 95% CI) | 1.06 [0.70, 1.61] |
| 5 Admission to neonatal nursery because of intrauterine growth restriction Show forest plot | 1 | 1639 | Risk Ratio (M‐H, Fixed, 95% CI) | 0.95 [0.42, 2.15] |
| 6 Induction of labour Show forest plot | 1 | 1639 | Risk Ratio (M‐H, Fixed, 95% CI) | 0.84 [0.45, 1.58] |
| 7 Caesarean section Show forest plot | 1 | 1639 | Risk Ratio (M‐H, Fixed, 95% CI) | 0.72 [0.31, 1.67] |