| 1 intervention failure (subgrouped by baseline disease) Show forest plot | 7 | 314 | Risk Ratio (M‐H, Random, 95% CI) | 0.24 [0.08, 0.76] |
|
| 1.1 AVC/neurological baseline diseases | 4 | 109 | Risk Ratio (M‐H, Random, 95% CI) | 0.08 [0.02, 0.33] |
| 1.2 mixed baseline diseases | 3 | 205 | Risk Ratio (M‐H, Random, 95% CI) | 0.62 [0.23, 1.72] |
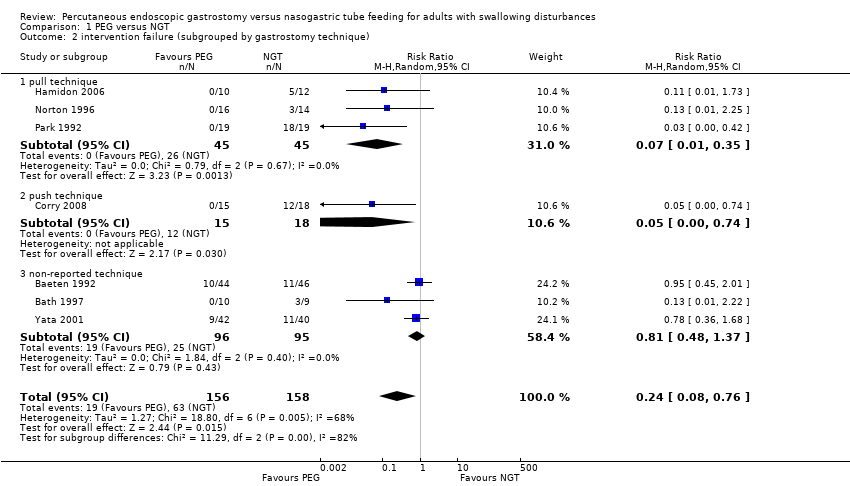
| 2 intervention failure (subgrouped by gastrostomy technique) Show forest plot | 7 | 314 | Risk Ratio (M‐H, Random, 95% CI) | 0.24 [0.08, 0.76] |
|
| 2.1 pull technique | 3 | 90 | Risk Ratio (M‐H, Random, 95% CI) | 0.07 [0.01, 0.35] |
| 2.2 push technique | 1 | 33 | Risk Ratio (M‐H, Random, 95% CI) | 0.05 [0.00, 0.74] |
| 2.3 non‐reported technique | 3 | 191 | Risk Ratio (M‐H, Random, 95% CI) | 0.81 [0.48, 1.37] |
| 3 mortality irrespective of follow‐up time Show forest plot | 8 | 584 | Risk Ratio (M‐H, Random, 95% CI) | 0.96 [0.64, 1.44] |
|
| 4 pneumonia irrespective of follow‐up time Show forest plot | 6 | 585 | Risk Ratio (M‐H, Random, 95% CI) | 0.84 [0.61, 1.14] |
|
| 5 complications irrespective of follow‐up time Show forest plot | 5 | 503 | Risk Ratio (M‐H, Random, 95% CI) | 1.00 [0.91, 1.11] |
|
| 6 mean survival (months) Show forest plot | 1 | 82 | Mean Difference (IV, Random, 95% CI) | 4.30 [3.28, 5.32] |
|
| 7 weight (endpoint) Show forest plot | 1 | 21 | Mean Difference (IV, Random, 95% CI) | 3.20 [‐5.95, 12.35] |
|
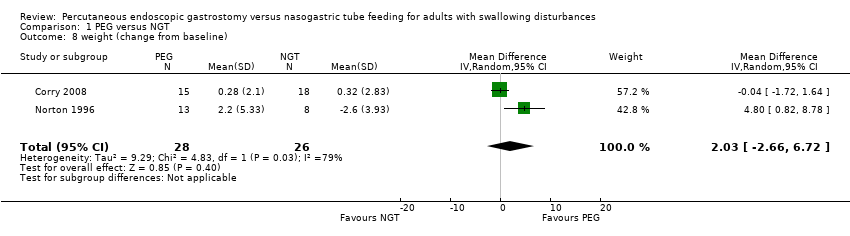
| 8 weight (change from baseline) Show forest plot | 2 | 54 | Mean Difference (IV, Random, 95% CI) | 2.03 [‐2.66, 6.72] |
|
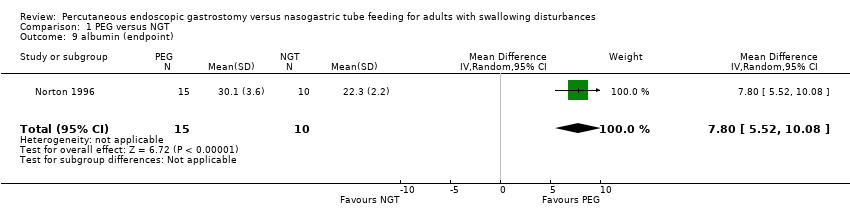
| 9 albumin (endpoint) Show forest plot | 1 | 25 | Mean Difference (IV, Random, 95% CI) | 7.80 [5.52, 10.08] |
|
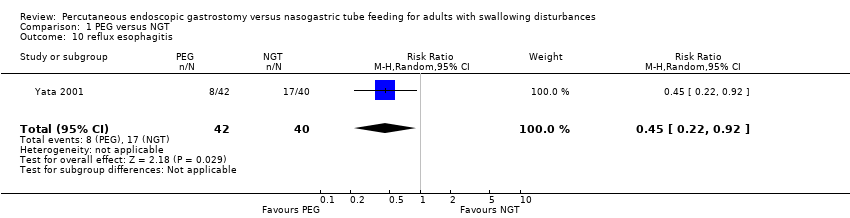
| 10 reflux esophagitis Show forest plot | 1 | 82 | Risk Ratio (M‐H, Random, 95% CI) | 0.45 [0.22, 0.92] |
|
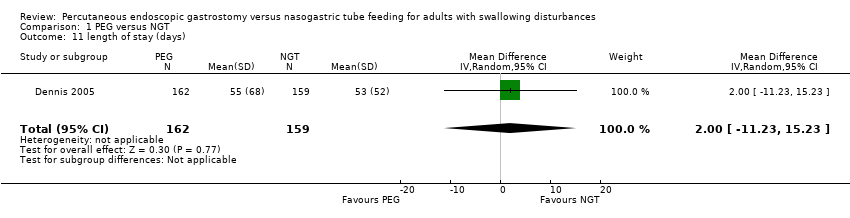
| 11 length of stay (days) Show forest plot | 1 | 321 | Mean Difference (IV, Random, 95% CI) | 2.0 [‐11.23, 15.23] |
|
| 12 time of enteral nutrition (days) Show forest plot | 2 | 119 | Mean Difference (IV, Random, 95% CI) | 14.48 [‐2.74, 31.71] |
|
| 13 score of patients satisfaction Show forest plot | 1 | 43 | Mean Difference (IV, Random, 95% CI) | ‐0.56 [‐1.32, 0.20] |
|
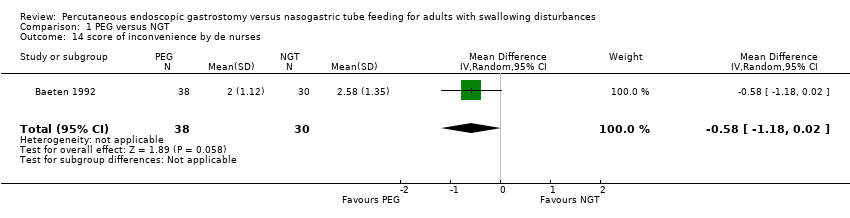
| 14 score of inconvenience by de nurses Show forest plot | 1 | 68 | Mean Difference (IV, Random, 95% CI) | ‐0.58 [‐1.18, 0.02] |
|
| 15 mid‐arm circumference in cm (endpoint) Show forest plot | 1 | 21 | Mean Difference (IV, Random, 95% CI) | 2.5 [‐0.64, 5.64] |
|
| 16 Functional ability (MRS) Show forest plot | 1 | | Risk Ratio (M‐H, Random, 95% CI) | Subtotals only |
|
| 16.1 MRS scale from 0‐3 | 1 | 321 | Risk Ratio (M‐H, Random, 95% CI) | 0.59 [0.34, 1.01] |
| 16.2 MRS scale from 4‐5 | 1 | 321 | Risk Ratio (M‐H, Random, 95% CI) | 1.20 [0.90, 1.61] |
| 16.3 MRS scale from 4‐5 or death | 1 | 321 | Risk Ratio (M‐H, Random, 95% CI) | 1.10 [1.00, 1.20] |