Percutaneous endoscopic gastrostomy versus nasogastric tube feeding for adults with swallowing disturbances
References
References to studies included in this review
References to studies excluded from this review
Additional references
References to other published versions of this review
Characteristics of studies
Characteristics of included studies [ordered by study ID]
Jump to:
| Methods | Single‐centre parallel randomised controlled trial Setting: 1 hospital in the Netherlands Sample size: not reported | |
| Participants | Ninety patients with neurologic problems, ear, nose and throat tumours and surgical problems. 56 male, 34 female; mean age 72 (62 to 82) Inclusion criteria: indication for enteral nutrition Exclusion criteria:contra‐indication for either method | |
| Interventions | PEG (n = 44) ‐ Freka set (Fresenius) NGT (n = 46) ‐silicone tube 14 ch inserted by nurse | |
| Outcomes |
| |
| Notes | Follow‐up: mean nutrition time 17.9 ± 19.9 days | |
| Risk of bias | ||
| Bias | Authors' judgement | Support for judgement |
| Random sequence generation (selection bias) | Unclear risk | Not reported |
| Allocation concealment (selection bias) | Low risk | Sealed envelopes |
| Blinding (performance bias and detection bias) | Unclear risk | Not explicitly referred by the authors |
| Blinding of participants and personnel (performance bias) | Unclear risk | Not explicitly referred by the authors |
| Blinding of outcome assessment (detection bias) | High risk | Explicitly not blinded as referred by the authors |
| Incomplete outcome data (attrition bias) | Low risk | There were no withdrawals reported by the authors |
| Selective reporting (reporting bias) | Low risk | Relevant outcomes analysed |
| Other bias | High risk | Follow‐up was not previously established |
| Methods | Single‐centre parallel randomised controlled trial Setting: 1 hospital in UK Sample size: not reported | |
| Participants | Nineteen patients (8 male, 11 female); mean age: 77 years (11) Baseline disease: 13 Ischaemic stroke, six haemorrhagic stroke Inclusion criteria: stroke within two weeks of stroke onset Exclusion criteria: orogastrointestinal disease concurrent severe illness, coagulopathy, pre‐morbid dependency, severe dementia, psychiatric illness | |
| Interventions | PEG: details not available NGT: details not available | |
| Outcomes | Primary outcomes
Secondary outcomes
| |
| Notes | Follow‐up: three months Risks of bias was judged from a systematic review previously published by the author (Bath 2009) and by email contact with the author | |
| Risk of bias | ||
| Bias | Authors' judgement | Support for judgement |
| Random sequence generation (selection bias) | Low risk | Computer‐generated by minimisation |
| Allocation concealment (selection bias) | Unclear risk | Not reported |
| Blinding (performance bias and detection bias) | Unclear risk | Not explicitly referred by the authors |
| Blinding of participants and personnel (performance bias) | Unclear risk | Not explicitly referred by the authors |
| Blinding of outcome assessment (detection bias) | Unclear risk | Not explicitly referred by the authors |
| Incomplete outcome data (attrition bias) | Low risk | Intention‐to‐treat analysis |
| Selective reporting (reporting bias) | Low risk | Relevant outcomes were analysed |
| Other bias | High risk | Unpublished study |
| Methods | Parallel randomised controlled trial Setting: hospitals in Australia; enteral feeding on an outpatient basis Sample size: the study planned to recruit 150 patients over two years, allowing a difference of at least 1.4 kg in mean weight loss to be detected between the two feeding tubes with 80% power using a two‐sided test with significance level of 5% | |
| Participants | 42 patients; 24 male, 9 female; median age 60 (46 to 80) Inclusion criteria: patients with squamous cell carcinoma of the head and neck planned for curative radiotherapy or chemoradiation who were anticipated to require enteral feeding Exclusion criteria: refusal to be randomised and refusal to receive any tube for nutrition | |
| Interventions | PEG (n = 22); push technique by Tucker (Kimberley‐Clark MIC e Wilson‐Cook) NGT (n = 20); fine bore tube inserted by nurse and confirmed the correct placement by a chest X‐ray and aspiration of stomach contents All patients received enteral feeding at home | |
| Outcomes |
All patients were assessed 6 months post‐treatment | |
| Notes | Nine patients did not receive the intervention to which they were allocated Outcome four was not considered for analysis because the instrument of evaluation is not formally validated Outcome one was not suitable for analysis because it was not explicitly informed if they were reported as means or medians | |
| Risk of bias | ||
| Bias | Authors' judgement | Support for judgement |
| Random sequence generation (selection bias) | Low risk | Adaptive biased coin technique |
| Allocation concealment (selection bias) | Unclear risk | Not reported |
| Blinding (performance bias and detection bias) | Unclear risk | Not explicitly referred by the authors |
| Blinding of participants and personnel (performance bias) | Unclear risk | Not explicitly referred by the authors |
| Blinding of outcome assessment (detection bias) | High risk | Explicitly referred by the authors as not blinded |
| Incomplete outcome data (attrition bias) | Low risk | Flow of patients was clearly reported |
| Selective reporting (reporting bias) | Low risk | Relevant outcomes were analysed |
| Other bias | Low risk | None suspected |
| Methods | Multicentric parallel randomised controlled trial Setting: multicentric study involving many countries, mainly UK Sample size: 1000 patients based on 85% power to detected and absolute risk difference for death or poor outcome of 9%. Type one error: 0.05 | |
| Participants | 321 patients: 144 male, 177 female; mean age 76 (10); dysphagic stroke patients Inclusion criteria: recent stroke (within 7 days before admission), first‐ever or recurrent, if the responsible clinician was uncertain of the best feeding (PEG or NGT) Exclusion criteria: patients with subarachnoid haemorrhage· | |
| Interventions | PEG (n = 162) NGT (n = 159) | |
| Outcomes |
| |
| Notes | Follow‐up: six months Outcomes 3, 10 and 13 were not suitable for analysis | |
| Risk of bias | ||
| Bias | Authors' judgement | Support for judgement |
| Random sequence generation (selection bias) | Low risk | Computer‐generated, stratified by country, age, gender, and predicted probability of poor outcome (by minimisation) |
| Allocation concealment (selection bias) | Low risk | The randomisation systems were housed on a secure server with access permitted, via a password. Participating centres were issued with codes in order for them to access the randomisation services (three separate numerical codes) ‐ it was impossible to guess the allocation given the use of minimisation to balance treatments between groups |
| Blinding (performance bias and detection bias) | High risk | Explicitly not blinded as referred by the authors |
| Blinding of participants and personnel (performance bias) | High risk | Explicitly not blinded as referred by the authors |
| Blinding of outcome assessment (detection bias) | High risk | Explicitly not blinded as referred by the authors |
| Incomplete outcome data (attrition bias) | Low risk | Flow of patients was clearly reported |
| Selective reporting (reporting bias) | Low risk | Relevant outcomes were analysed |
| Other bias | Low risk | None suspected |
| Methods | Single‐centre parallel randomised controlled trial Setting: 1 hospital (intensive care unit) in Greece Sample size: not reported; pilot study was made | |
| Participants | 39 patients; 22 male, 14 female; median age: PEG 53 (20 to 82), NGT 58 (25 to 85). Inclusion criteria: 1. patients on mechanical ventilation with NGT in place for more than 10 days, suffering from persistent or recurrent ventilator associated pneumonia and reflux rate above 6%. Exclusion criteria: unstable haemodynamic state, administration of morphine, atropine, theophylline, barbiturates, and cisapride, and a past history of GER or hiatal hernia. | |
| Interventions | PEG (n = 19): pull technique NGT (n = 20): fine bore 14 | |
| Outcomes |
| |
| Notes | Follow‐up: 20 days Three patients randomly allocated to receive PEG were excluded because of hiatal hernia (2) and intestinal bloating | |
| Risk of bias | ||
| Bias | Authors' judgement | Support for judgement |
| Random sequence generation (selection bias) | Unclear risk | Not reported |
| Allocation concealment (selection bias) | Unclear risk | Not reported |
| Blinding (performance bias and detection bias) | Unclear risk | Not explicitly referred by the authors |
| Blinding of participants and personnel (performance bias) | Unclear risk | Not explicitly referred by the authors |
| Blinding of outcome assessment (detection bias) | Unclear risk | Not explicitly referred by the authors |
| Incomplete outcome data (attrition bias) | Low risk | Flow of patients was clearly reported |
| Selective reporting (reporting bias) | Low risk | Relevant outcomes were analysed |
| Other bias | Low risk | None suspected |
| Methods | Single‐centre parallel randomised controlled trial Setting :1 hospital in Malaysia; patients were discharged in one or two days after the intervention Sample size: not reported | |
| Participants | 23 patients; 11 male, 11 female; median age: PEG 65 (48 to 79), NGT 72 (54 to 77) Inclusion criteria: patients with acute Ischaemic stroke and persistent dysphagia for seven or more days Exclusion criteria: not related | |
| Interventions | PEG (n = 10): pull technique, Wilson CooK silicone tube 24 FR, inserted by a doctor NGT (n = 12): Steril Cathline polyurethane tube, size 14 inserted by a nurse and checked by aspirating asteric contents | |
| Outcomes |
| |
| Notes | There was one drop‐out because it was impossible to contact the patient after four weeks | |
| Risk of bias | ||
| Bias | Authors' judgement | Support for judgement |
| Random sequence generation (selection bias) | Low risk | Computer generated random table |
| Allocation concealment (selection bias) | Unclear risk | Not reported |
| Blinding (performance bias and detection bias) | High risk | Systematically, surgeons were responsible for the PEG and nurses by the NGT |
| Blinding of participants and personnel (performance bias) | Unclear risk | not explicitly referred by the authors |
| Blinding of outcome assessment (detection bias) | Low risk | Information given by the patients by telephone |
| Incomplete outcome data (attrition bias) | Low risk | Flow of patients was clearly reported (1 dropout due to failure to turn‐up) |
| Selective reporting (reporting bias) | Low risk | Relevant outcomes were analysed |
| Other bias | Low risk | None suspected |
| Methods | Parallel randomised controlled trial Setting: 1 university hospital and one district general hospital in UK Sample size: not reported | |
| Participants | 30 patients: 11 male, 19 female; mean age 77 Inclusion criteria: acute cerebrovascular accident with persisting dysphagia for eight or more days Exclusion criteria: patients with a previous history of gastrointestinal disease which would preclude siting a gastrostomy tube or who were unfit for upper gastrointestinal endoscopy and IV sedation | |
| Interventions | PEG (n = 16): pull technique, Wilson Cook tube 24 FR or 12 FR Fresenius NGT (n = 14): fine bore tube Flocare 500, inserted by a senior nurse | |
| Outcomes |
| |
| Notes | Follow‐up: six weeks for main outcomes For continuous data, results were not available for all patients | |
| Risk of bias | ||
| Bias | Authors' judgement | Support for judgement |
| Random sequence generation (selection bias) | Unclear risk | Not reported |
| Allocation concealment (selection bias) | Low risk | Sealed envelopes |
| Blinding (performance bias and detection bias) | Unclear risk | Not explicitly referred by the authors |
| Blinding of participants and personnel (performance bias) | Unclear risk | Not explicitly referred by the authors |
| Blinding of outcome assessment (detection bias) | Unclear risk | Not explicitly referred by the authors |
| Incomplete outcome data (attrition bias) | Low risk | Flow of patients was clearly reported |
| Selective reporting (reporting bias) | Low risk | Relevant outcomes were analysed |
| Other bias | Low risk | None suspected |
| Methods | Parallel randomised controlled trial Setting: three teaching hospitals in Glasgow Sample size: 40 patients was selected to detect a two‐sided difference between the success of gastrostomy feeding at 90% and NGT feeding at 40% with a power of 0.9 and significance of 0.05 | |
| Participants | 40 patients with neurological dysphagia, 22 male, 18 female; mean age: PEG 56, NGT 65 Inclusion criteria: longstanding (4 weeks or more) dysphagia due to neurological disease; stable medical condition with likely survival of at least one month; ability to communicate verbally or in writing; and presence of a normal gastrointestinal tract Exclusion criteria: dementia; mechanical lesions causing obstruction of the oesophagus or stomach; active intra‐abdominal inflammation including inflammatory bowel disease or pancreatitis; history of partial gastrectomy, reflux oesophagitis, or intestinal obstruction; and presence of ascites, notable hepatomegaly, severe obesity, coagulopathy, untreated aspiration pneumonia, and major systemic disease including malignancy and respiratory, liver, or renal failure | |
| Interventions | PEG (n = 20) Bard 20Fr silicone tube, technique by Ponsky ‐ Gauderer NGT (n = 20) fine bore Abbott Flexitube, polyurethane, 850 mm length,1.5 mm internal diameter | |
| Outcomes |
| |
| Notes | Outcome six was not considered for analysis because only one patient completed the follow‐up Outcome seven was not considered clinically relevant by itself, unless it causes failure or affects nutritional status (anthropometric parameters) Follow‐up: 28 days | |
| Risk of bias | ||
| Bias | Authors' judgement | Support for judgement |
| Random sequence generation (selection bias) | Low risk | Computer generated random numbers (Epistat Statistical Package) |
| Allocation concealment (selection bias) | Low risk | Sealed envelopes |
| Blinding (performance bias and detection bias) | Unclear risk | Not explicitly referred by the authors |
| Blinding of participants and personnel (performance bias) | Unclear risk | Not explicitly referred by the authors |
| Blinding of outcome assessment (detection bias) | Unclear risk | Not explicitly referred by the authors |
| Incomplete outcome data (attrition bias) | Low risk | Flow of patients was clearly reported |
| Selective reporting (reporting bias) | Low risk | Relevant outcomes were analysed |
| Other bias | High risk | There was 95% (19/20) of dropouts in the NGT group due to failures in the treatment and death |
| Methods | Single‐centre parallel randomised controlled trial. Sample size: not reported Setting:1 hospital in Inagawa Town (Japan) | |
| Participants | 82 patients: 22 male,60 female; mean age: PEG 75.1 (50 to 96), NGT 76.5 (38 to 93) Inclusion criteria:dysphagic patients Exclusion criteria:not reported | |
| Interventions | PEG n = 42 NGT n = 40 | |
| Outcomes |
| |
| Notes | Study available as a meeting abstract Outcome seven was reported only for NGT group Outcomes eight and nine were reported only for the PEG group | |
| Risk of bias | ||
| Bias | Authors' judgement | Support for judgement |
| Random sequence generation (selection bias) | Unclear risk | Not reported |
| Allocation concealment (selection bias) | Unclear risk | Not reported |
| Blinding (performance bias and detection bias) | Unclear risk | Not explicitly referred by the authors |
| Blinding of participants and personnel (performance bias) | Unclear risk | Not explicitly referred by the authors |
| Blinding of outcome assessment (detection bias) | Unclear risk | Not explicitly referred by the authors |
| Incomplete outcome data (attrition bias) | Unclear risk | Flow of patients was not clearly reported |
| Selective reporting (reporting bias) | Low risk | Relevant outcomes were analysed |
| Other bias | High risk | Unpublished study |
GER: gastroesophogeal reflux
NGT: nasogastric tube
PEG: percutaneous endoscopic gastrostomy
Characteristics of excluded studies [ordered by study ID]
Jump to:
| Study | Reason for exclusion |
| Retrospective study | |
| Randomised controlled trial with intervention out of interest for this review (patients randomised to stop the enteral nutrition according to different residual gastric volume) | |
| Retrospective study |
Data and analyses
| Outcome or subgroup title | No. of studies | No. of participants | Statistical method | Effect size |
| 1 intervention failure (subgrouped by baseline disease) Show forest plot | 7 | 314 | Risk Ratio (M‐H, Random, 95% CI) | 0.24 [0.08, 0.76] |
| Analysis 1.1  Comparison 1 PEG versus NGT, Outcome 1 intervention failure (subgrouped by baseline disease). | ||||
| 1.1 AVC/neurological baseline diseases | 4 | 109 | Risk Ratio (M‐H, Random, 95% CI) | 0.08 [0.02, 0.33] |
| 1.2 mixed baseline diseases | 3 | 205 | Risk Ratio (M‐H, Random, 95% CI) | 0.62 [0.23, 1.72] |
| 2 intervention failure (subgrouped by gastrostomy technique) Show forest plot | 7 | 314 | Risk Ratio (M‐H, Random, 95% CI) | 0.24 [0.08, 0.76] |
| Analysis 1.2 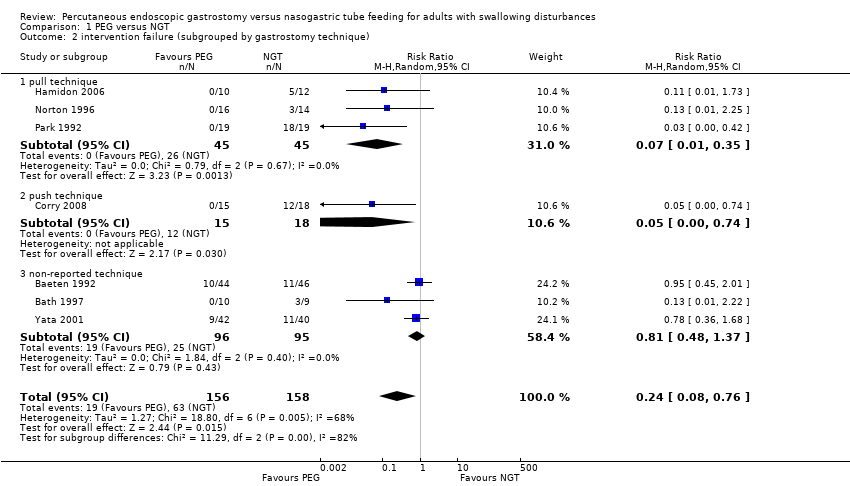 Comparison 1 PEG versus NGT, Outcome 2 intervention failure (subgrouped by gastrostomy technique). | ||||
| 2.1 pull technique | 3 | 90 | Risk Ratio (M‐H, Random, 95% CI) | 0.07 [0.01, 0.35] |
| 2.2 push technique | 1 | 33 | Risk Ratio (M‐H, Random, 95% CI) | 0.05 [0.00, 0.74] |
| 2.3 non‐reported technique | 3 | 191 | Risk Ratio (M‐H, Random, 95% CI) | 0.81 [0.48, 1.37] |
| 3 mortality irrespective of follow‐up time Show forest plot | 8 | 584 | Risk Ratio (M‐H, Random, 95% CI) | 0.96 [0.64, 1.44] |
| Analysis 1.3  Comparison 1 PEG versus NGT, Outcome 3 mortality irrespective of follow‐up time. | ||||
| 4 pneumonia irrespective of follow‐up time Show forest plot | 6 | 585 | Risk Ratio (M‐H, Random, 95% CI) | 0.84 [0.61, 1.14] |
| Analysis 1.4  Comparison 1 PEG versus NGT, Outcome 4 pneumonia irrespective of follow‐up time. | ||||
| 5 complications irrespective of follow‐up time Show forest plot | 5 | 503 | Risk Ratio (M‐H, Random, 95% CI) | 1.00 [0.91, 1.11] |
| Analysis 1.5  Comparison 1 PEG versus NGT, Outcome 5 complications irrespective of follow‐up time. | ||||
| 6 mean survival (months) Show forest plot | 1 | 82 | Mean Difference (IV, Random, 95% CI) | 4.30 [3.28, 5.32] |
| Analysis 1.6  Comparison 1 PEG versus NGT, Outcome 6 mean survival (months). | ||||
| 7 weight (endpoint) Show forest plot | 1 | 21 | Mean Difference (IV, Random, 95% CI) | 3.20 [‐5.95, 12.35] |
| Analysis 1.7  Comparison 1 PEG versus NGT, Outcome 7 weight (endpoint). | ||||
| 8 weight (change from baseline) Show forest plot | 2 | 54 | Mean Difference (IV, Random, 95% CI) | 2.03 [‐2.66, 6.72] |
| Analysis 1.8 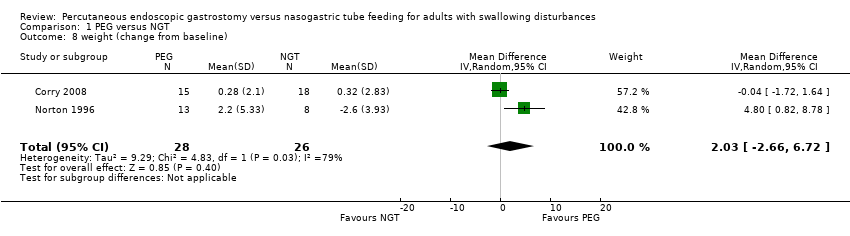 Comparison 1 PEG versus NGT, Outcome 8 weight (change from baseline). | ||||
| 9 albumin (endpoint) Show forest plot | 1 | 25 | Mean Difference (IV, Random, 95% CI) | 7.80 [5.52, 10.08] |
| Analysis 1.9 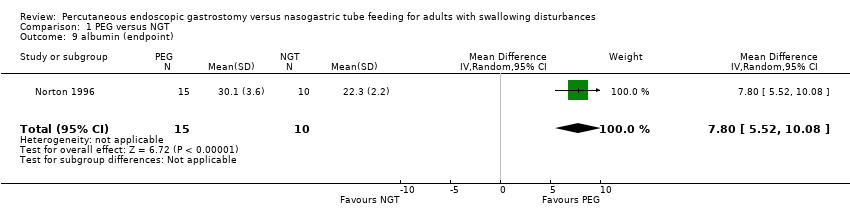 Comparison 1 PEG versus NGT, Outcome 9 albumin (endpoint). | ||||
| 10 reflux esophagitis Show forest plot | 1 | 82 | Risk Ratio (M‐H, Random, 95% CI) | 0.45 [0.22, 0.92] |
| Analysis 1.10 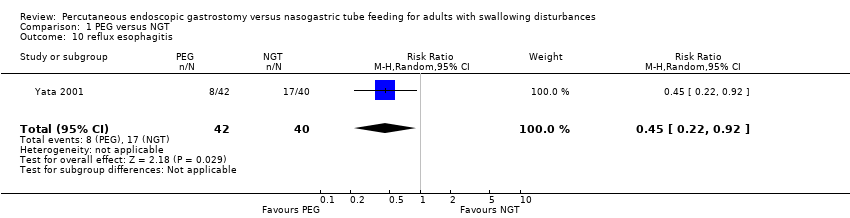 Comparison 1 PEG versus NGT, Outcome 10 reflux esophagitis. | ||||
| 11 length of stay (days) Show forest plot | 1 | 321 | Mean Difference (IV, Random, 95% CI) | 2.0 [‐11.23, 15.23] |
| Analysis 1.11 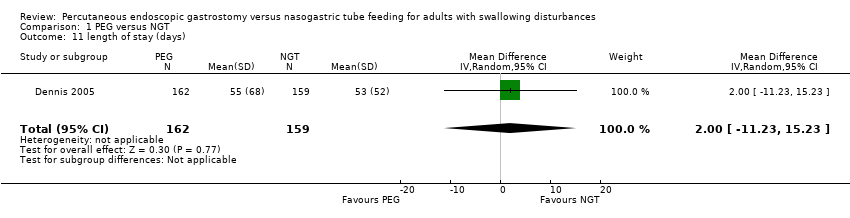 Comparison 1 PEG versus NGT, Outcome 11 length of stay (days). | ||||
| 12 time of enteral nutrition (days) Show forest plot | 2 | 119 | Mean Difference (IV, Random, 95% CI) | 14.48 [‐2.74, 31.71] |
| Analysis 1.12  Comparison 1 PEG versus NGT, Outcome 12 time of enteral nutrition (days). | ||||
| 13 score of patients satisfaction Show forest plot | 1 | 43 | Mean Difference (IV, Random, 95% CI) | ‐0.56 [‐1.32, 0.20] |
| Analysis 1.13  Comparison 1 PEG versus NGT, Outcome 13 score of patients satisfaction. | ||||
| 14 score of inconvenience by de nurses Show forest plot | 1 | 68 | Mean Difference (IV, Random, 95% CI) | ‐0.58 [‐1.18, 0.02] |
| Analysis 1.14 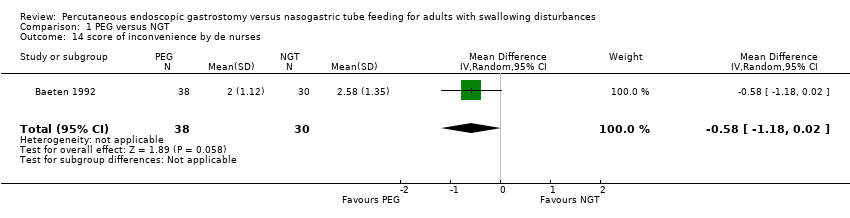 Comparison 1 PEG versus NGT, Outcome 14 score of inconvenience by de nurses. | ||||
| 15 mid‐arm circumference in cm (endpoint) Show forest plot | 1 | 21 | Mean Difference (IV, Random, 95% CI) | 2.5 [‐0.64, 5.64] |
| Analysis 1.15  Comparison 1 PEG versus NGT, Outcome 15 mid‐arm circumference in cm (endpoint). | ||||
| 16 Functional ability (MRS) Show forest plot | 1 | Risk Ratio (M‐H, Random, 95% CI) | Subtotals only | |
| Analysis 1.16  Comparison 1 PEG versus NGT, Outcome 16 Functional ability (MRS). | ||||
| 16.1 MRS scale from 0‐3 | 1 | 321 | Risk Ratio (M‐H, Random, 95% CI) | 0.59 [0.34, 1.01] |
| 16.2 MRS scale from 4‐5 | 1 | 321 | Risk Ratio (M‐H, Random, 95% CI) | 1.20 [0.90, 1.61] |
| 16.3 MRS scale from 4‐5 or death | 1 | 321 | Risk Ratio (M‐H, Random, 95% CI) | 1.10 [1.00, 1.20] |

Methodological quality summary: review authors' judgements about each methodological quality item for each included study.

Risk of bias graph: review authors' judgements about each risk of bias item presented as percentages across all included studies.
Comparison 1 PEG versus NGT, Outcome 1 intervention failure (subgrouped by baseline disease).
Comparison 1 PEG versus NGT, Outcome 2 intervention failure (subgrouped by gastrostomy technique).
Comparison 1 PEG versus NGT, Outcome 3 mortality irrespective of follow‐up time.
Comparison 1 PEG versus NGT, Outcome 4 pneumonia irrespective of follow‐up time.
Comparison 1 PEG versus NGT, Outcome 5 complications irrespective of follow‐up time.
Comparison 1 PEG versus NGT, Outcome 6 mean survival (months).
Comparison 1 PEG versus NGT, Outcome 7 weight (endpoint).
Comparison 1 PEG versus NGT, Outcome 8 weight (change from baseline).
Comparison 1 PEG versus NGT, Outcome 9 albumin (endpoint).
Comparison 1 PEG versus NGT, Outcome 10 reflux esophagitis.
Comparison 1 PEG versus NGT, Outcome 11 length of stay (days).
Comparison 1 PEG versus NGT, Outcome 12 time of enteral nutrition (days).
Comparison 1 PEG versus NGT, Outcome 13 score of patients satisfaction.
Comparison 1 PEG versus NGT, Outcome 14 score of inconvenience by de nurses.
Comparison 1 PEG versus NGT, Outcome 15 mid‐arm circumference in cm (endpoint).
Comparison 1 PEG versus NGT, Outcome 16 Functional ability (MRS).
| Percutaneous endoscopic gastrostomy compared with nasogastric tube feeding for adults with swallowing disturbances | ||||||
| Patient or population: adult patients with swallowing disturbances | ||||||
| Outcomes | Illustrative comparative risks* (95% CI) | Relative effect | No of Participants | Quality of the evidence | Comments | |
| Assumed risk | Corresponding risk | |||||
| Nasogastric tube feeding | Percutaneous endoscopic gastrostomy | |||||
| Treatment failure | Study population | RR 0.24 | 314 | ⊕⊕⊝⊝ | The subgroup of stroke/neurological diseases was associated with a lower risk of intervention failure compared with the subgroup composed of mixed diseases. | |
| 40 per 100 | 10 per 100 | |||||
| Low | ||||||
| 20 per 100 | 5 per 100 | |||||
| High | ||||||
| 95 per 100 | 23 per 100 | |||||
| Mortality irrespective of follow‐up time | 36 per 100 | 34 per 100 | RR 0.96 | 584 | ⊕⊝⊝⊝ | |
| Pneumonia irrespective of follow‐up time | 39 per 100 | 33 per 100 | RR 0.84 | 585 | ⊕⊕⊝⊝ | |
| Complications irrespective of follow‐up time | 43 per 100 | 43 per 100 | RR 1 | 503 | ⊕⊕⊕⊝ | |
| *The basis for the assumed risk (e.g. the median control group risk across studies) is provided in footnotes. The corresponding risk (and its 95% confidence interval) is based on the assumed risk in the comparison group and the relative effect of the intervention (and its 95% CI). | ||||||
| GRADE Working Group grades of evidence | ||||||
| 1 Unclear sequence generation and concealment and loss to follow‐up. | ||||||
| 1 median albumin (endpoint) | |||
| PEG (n = 8) | NGT (n = 10) | P value | |
| 39.5 (R 36 to 44) | 36.0 (R 31 to 45) | 0.045 | |
| 2 mean albumin (endpoint) | |||
| PEG (n = 42) | NGT (n = 40) | P value | |
| 36 | 32 | 0.01 | |
| 3 median length of stay (days) | |||
| PEG (n = 162) | NGT (n = 159) | P value | |
| 34.0 (IQR 17 to 66) | 37.0 (IQR 17 to 76) | not reported | |
| 4 utility mean difference between comparison groups (endpoint) | |||
| mean difference | 95%CI | P value | |
| 0.035 | ‐ 0.024 to 0.093 | 0.12 | |
| 5 median patient overall quality of life at first week | |||
| PEG (n = 15) | NGT (n = 18) | P value | |
| 4.0 (R 2.0 to 7.0) | 4.0 (R 2.0 to 7.0) | 0.89 | |
| 6 anthropometric parameters | |||
| PEG (n = 8) | NGT (n = 10) | P value | |
| median TSFT (mm) | 20.1 (R 9.6 to 34) | 12.7 (R 9.8 to 32) | 0.076 |
| median BSFT (mm) | 10.3 (R 4.8 to 13) | 7.4 (R 4.4 to 15) | 0.533 |
| median MAC (cm) | 31.4 (R 22 to 36) | 27.8 (R 21 to 37) | 0.182 |
| median serum albumin (g/l) | 39.5 (R 36 to 44) | 36.0 (R 31 to 45) | 0.045 |
| 7 median change in GER (%) on day 7 | |||
| PEG | NGT | P value | |
| 2.7 (R 0 to 10.4) | 10.8 (R 6.3 to 36.6) | P<0.01 | |
| Outcome 1 ‐ Median albumin (endpoint) as reported in Hamidon 2006. Outcome 2 ‐ Mean albumin (endpoint) as reported in Yata 2001 (abstract). Outcome 3 ‐ Median length (days) of stay as reported in Dennis 2005. Outcome 4 ‐ Utility mean difference derived from Euroqol between comparison groups (endpoint) favouring NGT group, but without statistical significance (Dennis 2005) Outcome 5 ‐ Median patient overall quality of life at first week (endpoint) reported by Corry 2008. Outcome 6 ‐ Anthropometric medians (endpoint) as reported in Hamidon 2006. Outcome 7 ‐ Median Gastroesophageal reflux (%, endpoint) as reported in Douzinas 2006. IQR: interquartile range R: range CI: confidence interval TSFT: triceps skin‐fold thickness BSTF: biceps skin‐fold thickness MAC: mid‐arm circumference | |||
| Outcome or subgroup title | No. of studies | No. of participants | Statistical method | Effect size |
| 1 intervention failure (subgrouped by baseline disease) Show forest plot | 7 | 314 | Risk Ratio (M‐H, Random, 95% CI) | 0.24 [0.08, 0.76] |
| 1.1 AVC/neurological baseline diseases | 4 | 109 | Risk Ratio (M‐H, Random, 95% CI) | 0.08 [0.02, 0.33] |
| 1.2 mixed baseline diseases | 3 | 205 | Risk Ratio (M‐H, Random, 95% CI) | 0.62 [0.23, 1.72] |
| 2 intervention failure (subgrouped by gastrostomy technique) Show forest plot | 7 | 314 | Risk Ratio (M‐H, Random, 95% CI) | 0.24 [0.08, 0.76] |
| 2.1 pull technique | 3 | 90 | Risk Ratio (M‐H, Random, 95% CI) | 0.07 [0.01, 0.35] |
| 2.2 push technique | 1 | 33 | Risk Ratio (M‐H, Random, 95% CI) | 0.05 [0.00, 0.74] |
| 2.3 non‐reported technique | 3 | 191 | Risk Ratio (M‐H, Random, 95% CI) | 0.81 [0.48, 1.37] |
| 3 mortality irrespective of follow‐up time Show forest plot | 8 | 584 | Risk Ratio (M‐H, Random, 95% CI) | 0.96 [0.64, 1.44] |
| 4 pneumonia irrespective of follow‐up time Show forest plot | 6 | 585 | Risk Ratio (M‐H, Random, 95% CI) | 0.84 [0.61, 1.14] |
| 5 complications irrespective of follow‐up time Show forest plot | 5 | 503 | Risk Ratio (M‐H, Random, 95% CI) | 1.00 [0.91, 1.11] |
| 6 mean survival (months) Show forest plot | 1 | 82 | Mean Difference (IV, Random, 95% CI) | 4.30 [3.28, 5.32] |
| 7 weight (endpoint) Show forest plot | 1 | 21 | Mean Difference (IV, Random, 95% CI) | 3.20 [‐5.95, 12.35] |
| 8 weight (change from baseline) Show forest plot | 2 | 54 | Mean Difference (IV, Random, 95% CI) | 2.03 [‐2.66, 6.72] |
| 9 albumin (endpoint) Show forest plot | 1 | 25 | Mean Difference (IV, Random, 95% CI) | 7.80 [5.52, 10.08] |
| 10 reflux esophagitis Show forest plot | 1 | 82 | Risk Ratio (M‐H, Random, 95% CI) | 0.45 [0.22, 0.92] |
| 11 length of stay (days) Show forest plot | 1 | 321 | Mean Difference (IV, Random, 95% CI) | 2.0 [‐11.23, 15.23] |
| 12 time of enteral nutrition (days) Show forest plot | 2 | 119 | Mean Difference (IV, Random, 95% CI) | 14.48 [‐2.74, 31.71] |
| 13 score of patients satisfaction Show forest plot | 1 | 43 | Mean Difference (IV, Random, 95% CI) | ‐0.56 [‐1.32, 0.20] |
| 14 score of inconvenience by de nurses Show forest plot | 1 | 68 | Mean Difference (IV, Random, 95% CI) | ‐0.58 [‐1.18, 0.02] |
| 15 mid‐arm circumference in cm (endpoint) Show forest plot | 1 | 21 | Mean Difference (IV, Random, 95% CI) | 2.5 [‐0.64, 5.64] |
| 16 Functional ability (MRS) Show forest plot | 1 | Risk Ratio (M‐H, Random, 95% CI) | Subtotals only | |
| 16.1 MRS scale from 0‐3 | 1 | 321 | Risk Ratio (M‐H, Random, 95% CI) | 0.59 [0.34, 1.01] |
| 16.2 MRS scale from 4‐5 | 1 | 321 | Risk Ratio (M‐H, Random, 95% CI) | 1.20 [0.90, 1.61] |
| 16.3 MRS scale from 4‐5 or death | 1 | 321 | Risk Ratio (M‐H, Random, 95% CI) | 1.10 [1.00, 1.20] |