| 1 Relapse: up to 3 months Show forest plot | 34 | 3942 | Risk Ratio (M‐H, Random, 95% CI) | 0.30 [0.24, 0.38] |
|
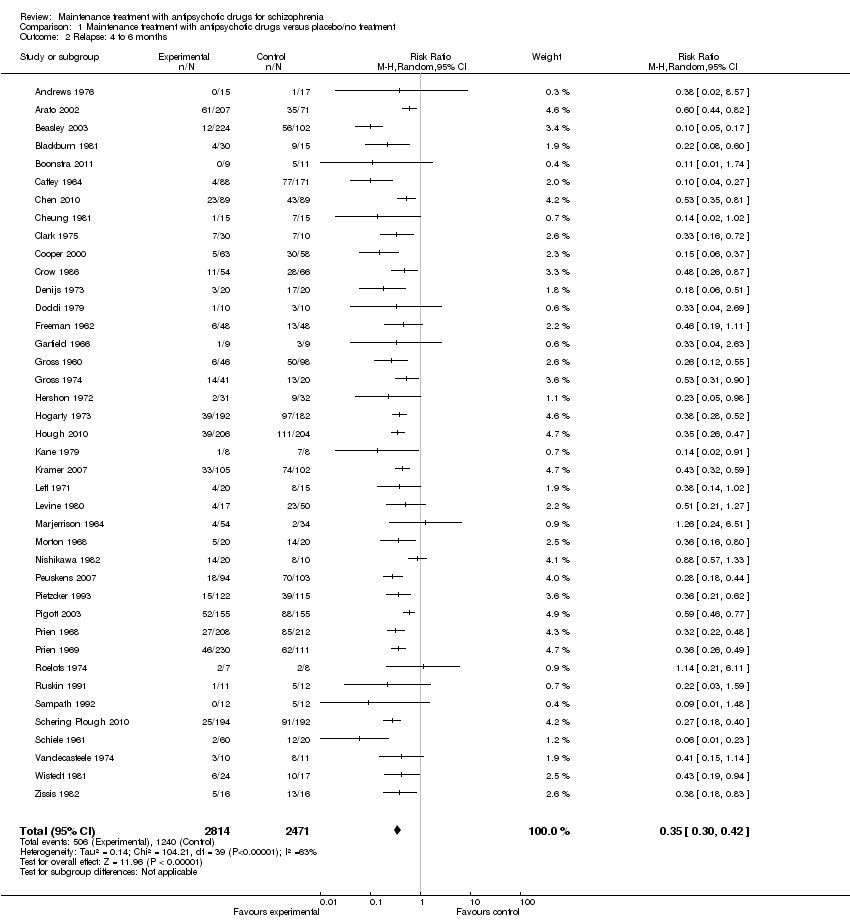
| 2 Relapse: 4 to 6 months Show forest plot | 40 | 5285 | Risk Ratio (M‐H, Random, 95% CI) | 0.35 [0.30, 0.42] |
|
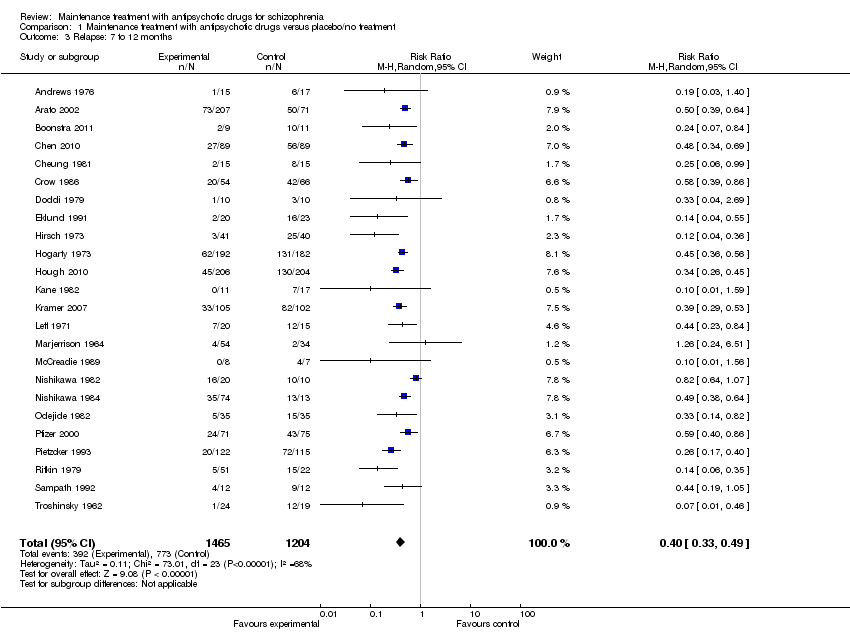
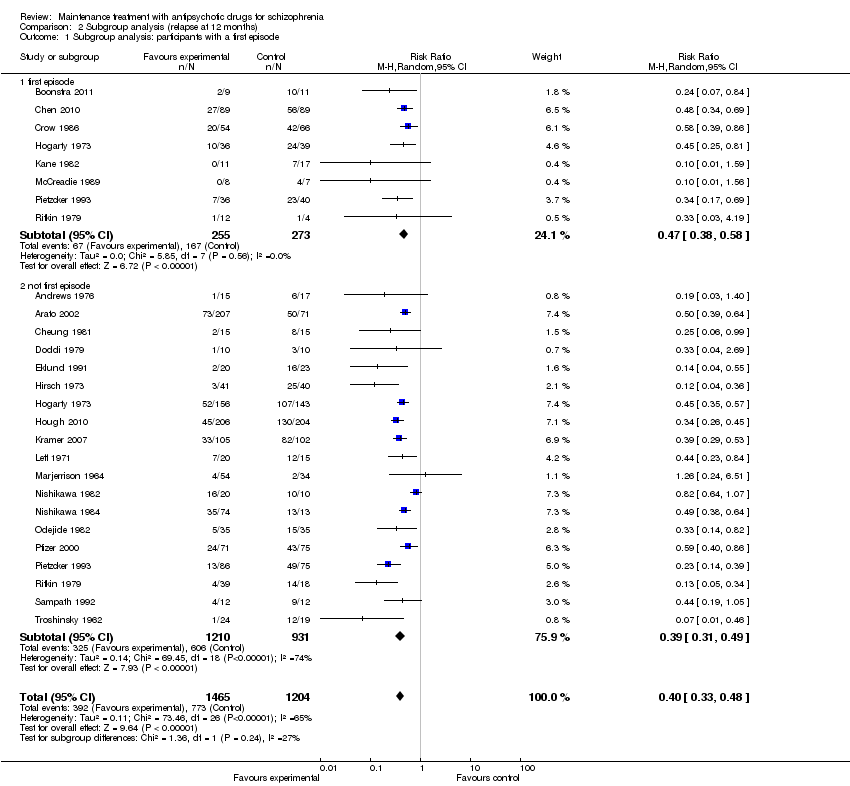
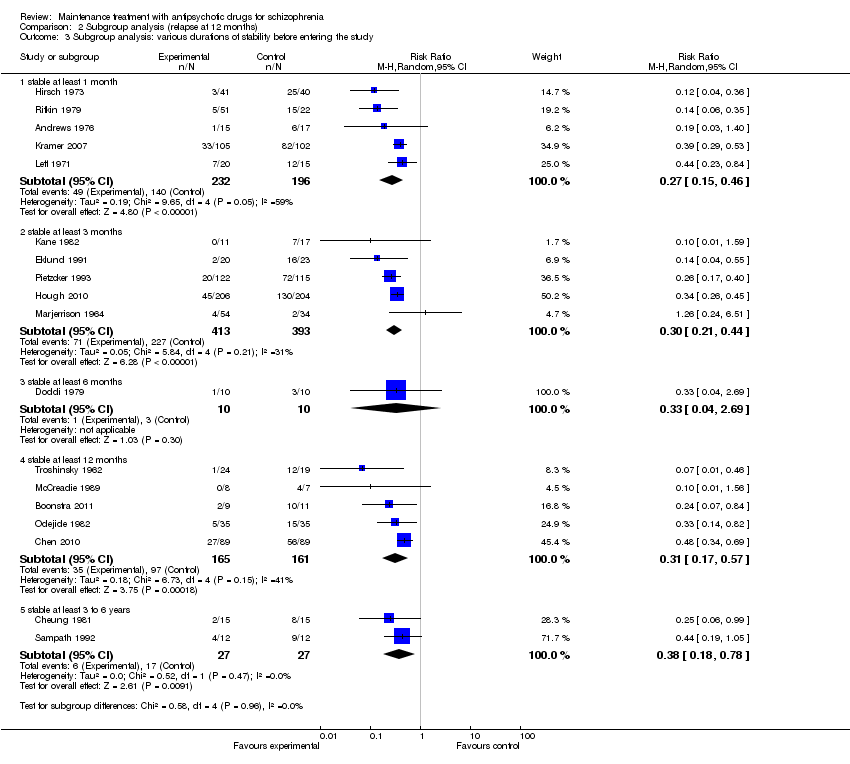
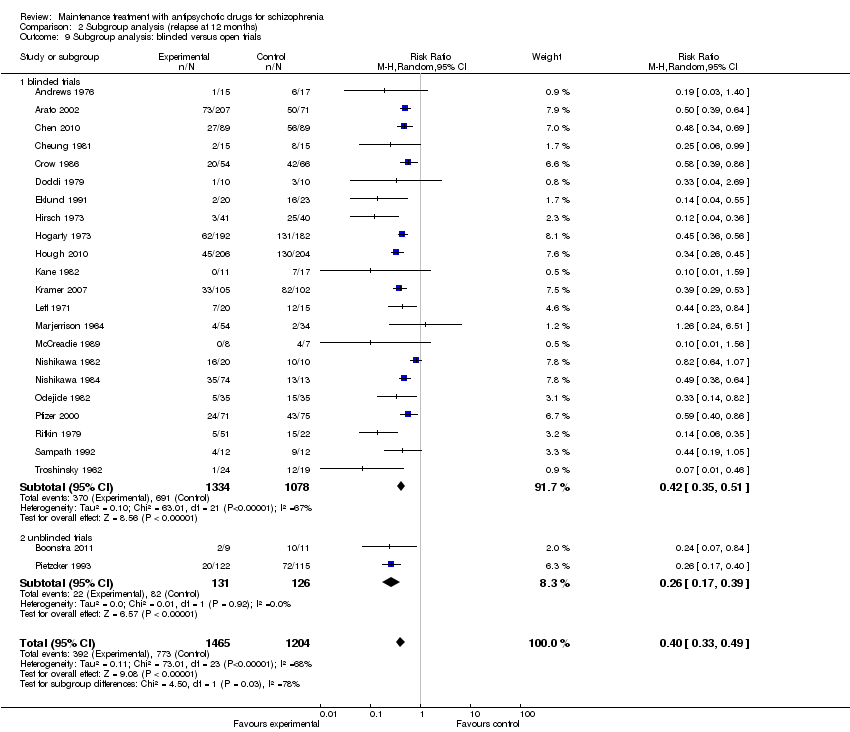
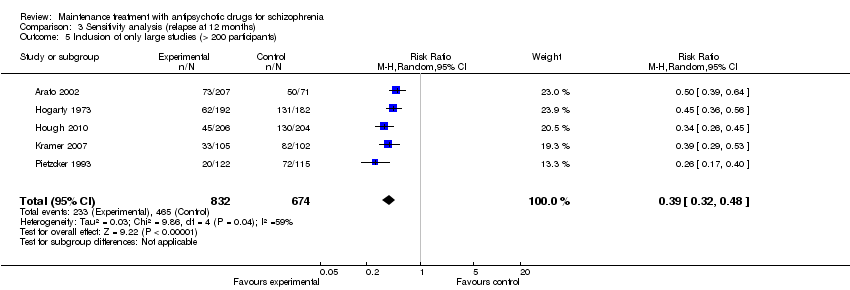
| 3 Relapse: 7 to 12 months Show forest plot | 24 | 2669 | Risk Ratio (M‐H, Random, 95% CI) | 0.40 [0.33, 0.49] |
|
| 4 Relapse: > 12 months Show forest plot | 6 | 811 | Risk Ratio (M‐H, Random, 95% CI) | 0.59 [0.42, 0.82] |
|
| 5 Relapse: independent of duration Show forest plot | 62 | 6392 | Risk Ratio (M‐H, Random, 95% CI) | 0.35 [0.29, 0.41] |
|
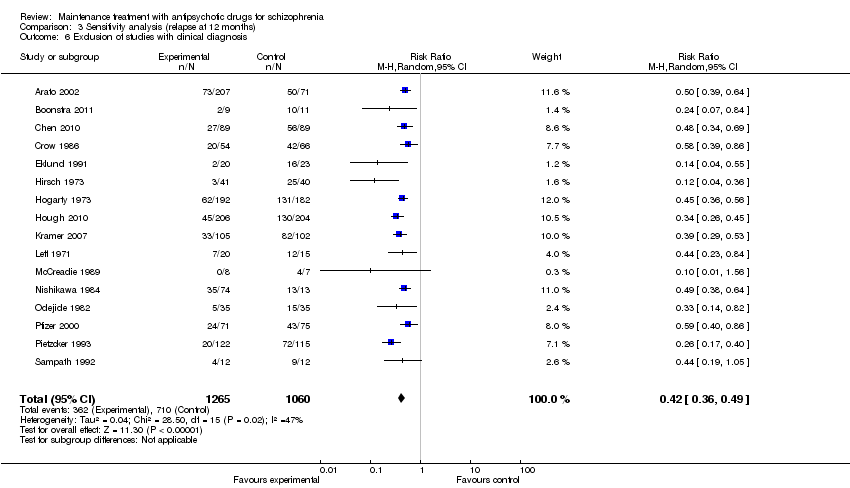
| 6 Leaving the study early: due to any reason Show forest plot | 47 | 4718 | Risk Ratio (M‐H, Random, 95% CI) | 0.53 [0.46, 0.61] |
|
| 6.1 up to 3 months | 8 | 245 | Risk Ratio (M‐H, Random, 95% CI) | 0.23 [0.07, 0.72] |
| 6.2 4 to 6 months | 17 | 1646 | Risk Ratio (M‐H, Random, 95% CI) | 0.48 [0.35, 0.66] |
| 6.3 7 to 12 months | 18 | 2420 | Risk Ratio (M‐H, Random, 95% CI) | 0.55 [0.46, 0.66] |
| 6.4 > 12 months | 4 | 407 | Risk Ratio (M‐H, Random, 95% CI) | 0.68 [0.36, 1.26] |
| 7 Leaving the study early: due to adverse events Show forest plot | 43 | 4333 | Risk Ratio (M‐H, Random, 95% CI) | 1.16 [0.70, 1.91] |
|
| 7.1 up to 3 months | 8 | 245 | Risk Ratio (M‐H, Random, 95% CI) | 2.84 [0.12, 65.34] |
| 7.2 4 to 6 months | 14 | 1549 | Risk Ratio (M‐H, Random, 95% CI) | 0.99 [0.57, 1.74] |
| 7.3 7 to 12 months | 17 | 2339 | Risk Ratio (M‐H, Random, 95% CI) | 1.24 [0.59, 2.60] |
| 7.4 > 12 months | 4 | 200 | Risk Ratio (M‐H, Random, 95% CI) | 0.0 [0.0, 0.0] |
| 8 Leaving the study early: due to inefficacy Show forest plot | 46 | 4546 | Risk Ratio (M‐H, Random, 95% CI) | 0.37 [0.31, 0.44] |
|
| 8.1 up to 3 months | 9 | 295 | Risk Ratio (M‐H, Random, 95% CI) | 0.23 [0.07, 0.79] |
| 8.2 4 to 6 months | 16 | 1661 | Risk Ratio (M‐H, Random, 95% CI) | 0.41 [0.31, 0.54] |
| 8.3 7 to 12 months | 18 | 2420 | Risk Ratio (M‐H, Random, 95% CI) | 0.36 [0.28, 0.45] |
| 8.4 > 12 months | 3 | 170 | Risk Ratio (M‐H, Random, 95% CI) | 0.27 [0.08, 0.95] |
| 9 Global state: number of participants improved Show forest plot | 14 | 1524 | Risk Ratio (M‐H, Random, 95% CI) | 2.34 [1.68, 3.26] |
|
| 9.1 up to 3 months | 1 | 49 | Risk Ratio (M‐H, Random, 95% CI) | 4.61 [1.22, 17.40] |
| 9.2 4 to 6 months | 8 | 1037 | Risk Ratio (M‐H, Random, 95% CI) | 2.33 [1.69, 3.21] |
| 9.3 7 to 12 months | 5 | 438 | Risk Ratio (M‐H, Random, 95% CI) | 1.95 [0.91, 4.18] |
| 10 Service use: number of participants hospitalised Show forest plot | 16 | 2090 | Risk Ratio (M‐H, Random, 95% CI) | 0.38 [0.27, 0.55] |
|
| 10.1 up to 3 months | 2 | 55 | Risk Ratio (M‐H, Random, 95% CI) | 0.42 [0.04, 4.06] |
| 10.2 4 to 6 months | 3 | 109 | Risk Ratio (M‐H, Random, 95% CI) | 0.08 [0.01, 0.42] |
| 10.3 7 to 12 months | 8 | 1295 | Risk Ratio (M‐H, Random, 95% CI) | 0.32 [0.18, 0.57] |
| 10.4 > 12 months | 3 | 631 | Risk Ratio (M‐H, Random, 95% CI) | 0.56 [0.44, 0.70] |
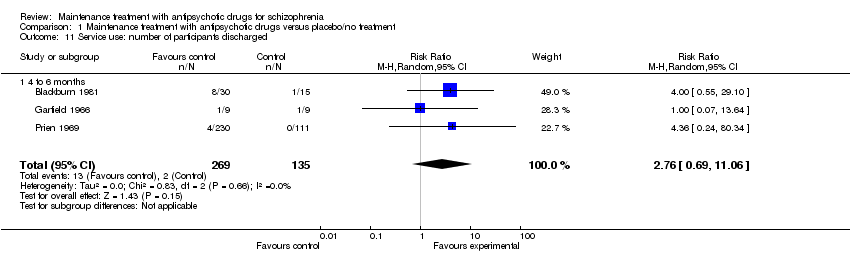
| 11 Service use: number of participants discharged Show forest plot | 3 | 404 | Risk Ratio (M‐H, Random, 95% CI) | 2.76 [0.69, 11.06] |
|
| 11.1 4 to 6 months | 3 | 404 | Risk Ratio (M‐H, Random, 95% CI) | 2.76 [0.69, 11.06] |
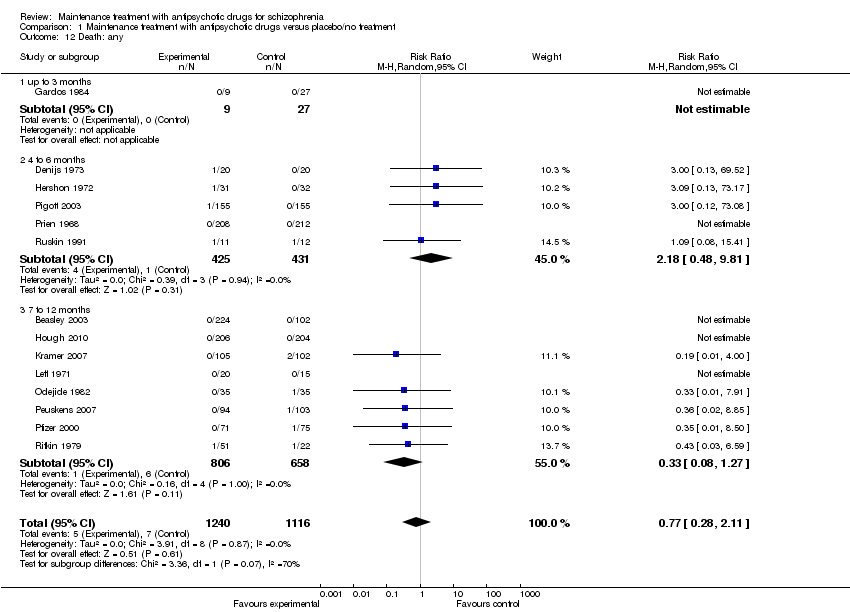
| 12 Death: any Show forest plot | 14 | 2356 | Risk Ratio (M‐H, Random, 95% CI) | 0.77 [0.28, 2.11] |
|
| 12.1 up to 3 months | 1 | 36 | Risk Ratio (M‐H, Random, 95% CI) | 0.0 [0.0, 0.0] |
| 12.2 4 to 6 months | 5 | 856 | Risk Ratio (M‐H, Random, 95% CI) | 2.18 [0.48, 9.81] |
| 12.3 7 to 12 months | 8 | 1464 | Risk Ratio (M‐H, Random, 95% CI) | 0.33 [0.08, 1.27] |
| 13 Death: due to natural causes Show forest plot | 14 | 2401 | Risk Ratio (M‐H, Random, 95% CI) | 1.24 [0.39, 3.97] |
|
| 13.1 4 to 6 months | 5 | 856 | Risk Ratio (M‐H, Random, 95% CI) | 2.18 [0.48, 9.81] |
| 13.2 7 to 12 months | 9 | 1545 | Risk Ratio (M‐H, Random, 95% CI) | 0.54 [0.09, 3.36] |
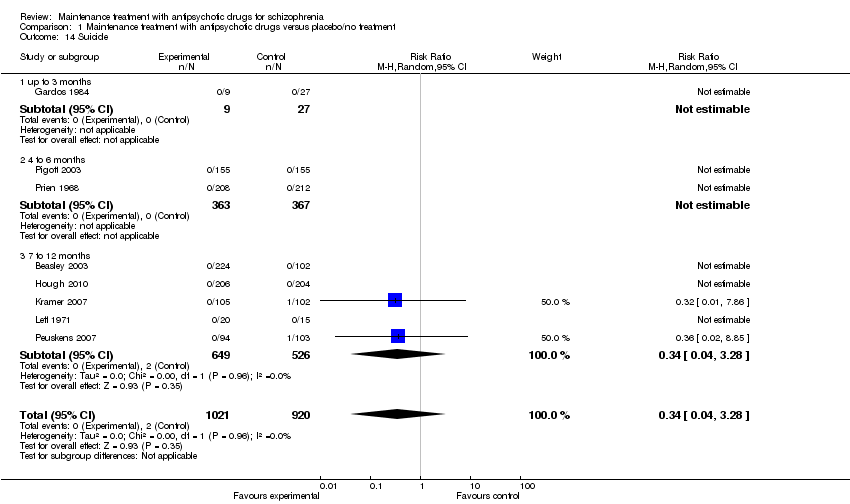
| 14 Suicide Show forest plot | 8 | 1941 | Risk Ratio (M‐H, Random, 95% CI) | 0.34 [0.04, 3.28] |
|
| 14.1 up to 3 months | 1 | 36 | Risk Ratio (M‐H, Random, 95% CI) | 0.0 [0.0, 0.0] |
| 14.2 4 to 6 months | 2 | 730 | Risk Ratio (M‐H, Random, 95% CI) | 0.0 [0.0, 0.0] |
| 14.3 7 to 12 months | 5 | 1175 | Risk Ratio (M‐H, Random, 95% CI) | 0.34 [0.04, 3.28] |
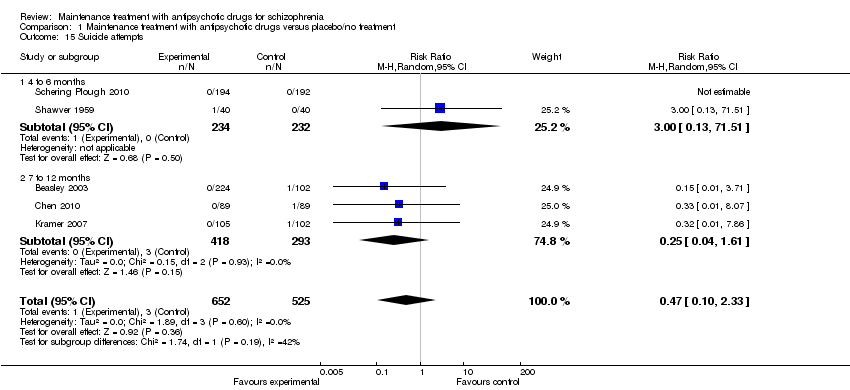
| 15 Suicide attempts Show forest plot | 5 | 1177 | Risk Ratio (M‐H, Random, 95% CI) | 0.47 [0.10, 2.33] |
|
| 15.1 4 to 6 months | 2 | 466 | Risk Ratio (M‐H, Random, 95% CI) | 3.0 [0.13, 71.51] |
| 15.2 7 to 12 months | 3 | 711 | Risk Ratio (M‐H, Random, 95% CI) | 0.25 [0.04, 1.61] |
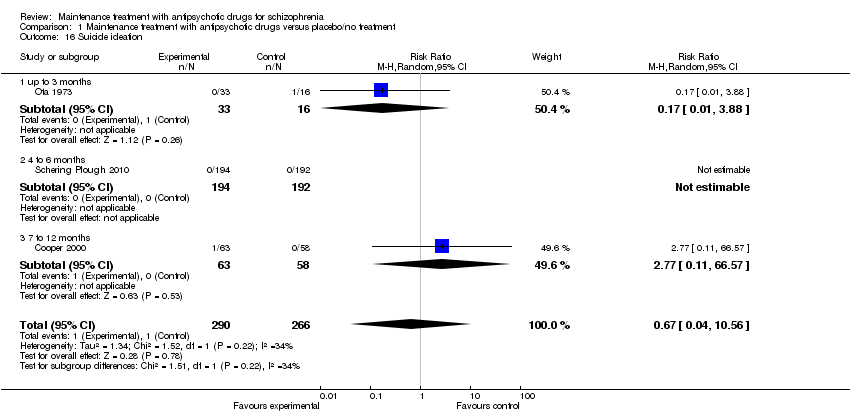
| 16 Suicide ideation Show forest plot | 3 | 556 | Risk Ratio (M‐H, Random, 95% CI) | 0.67 [0.04, 10.56] |
|
| 16.1 up to 3 months | 1 | 49 | Risk Ratio (M‐H, Random, 95% CI) | 0.17 [0.01, 3.88] |
| 16.2 4 to 6 months | 1 | 386 | Risk Ratio (M‐H, Random, 95% CI) | 0.0 [0.0, 0.0] |
| 16.3 7 to 12 months | 1 | 121 | Risk Ratio (M‐H, Random, 95% CI) | 2.77 [0.11, 66.57] |
| 17 Violent/aggressive behaviour Show forest plot | 5 | 680 | Risk Ratio (M‐H, Random, 95% CI) | 0.27 [0.15, 0.52] |
|
| 17.1 up to 3 months | 1 | 26 | Risk Ratio (M‐H, Random, 95% CI) | 0.33 [0.01, 7.50] |
| 17.2 4 to 6 months | 1 | 40 | Risk Ratio (M‐H, Random, 95% CI) | 0.2 [0.01, 3.92] |
| 17.3 7 to 12 months | 3 | 614 | Risk Ratio (M‐H, Random, 95% CI) | 0.28 [0.14, 0.53] |
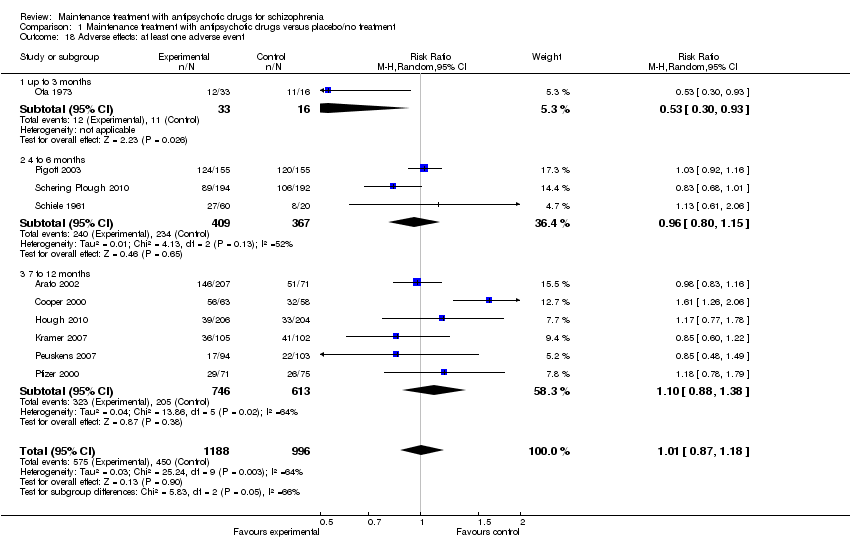
| 18 Adverse effects: at least one adverse event Show forest plot | 10 | 2184 | Risk Ratio (M‐H, Random, 95% CI) | 1.01 [0.87, 1.18] |
|
| 18.1 up to 3 months | 1 | 49 | Risk Ratio (M‐H, Random, 95% CI) | 0.53 [0.30, 0.93] |
| 18.2 4 to 6 months | 3 | 776 | Risk Ratio (M‐H, Random, 95% CI) | 0.96 [0.80, 1.15] |
| 18.3 7 to 12 months | 6 | 1359 | Risk Ratio (M‐H, Random, 95% CI) | 1.10 [0.88, 1.38] |
| 19 Adverse effects: movement disorders: at least one movement disorder Show forest plot | 22 | 3411 | Risk Ratio (M‐H, Random, 95% CI) | 1.55 [1.25, 1.93] |
|
| 19.1 up to 3 months | 4 | 158 | Risk Ratio (M‐H, Random, 95% CI) | 2.42 [0.70, 8.33] |
| 19.2 4 to 6 months | 8 | 1658 | Risk Ratio (M‐H, Random, 95% CI) | 1.45 [1.06, 1.99] |
| 19.3 7 to 12 months | 10 | 1595 | Risk Ratio (M‐H, Random, 95% CI) | 1.52 [1.11, 2.07] |
| 20 Adverse effects: movement disorders: akathisia Show forest plot | 12 | 2026 | Risk Ratio (M‐H, Random, 95% CI) | 1.75 [0.87, 3.51] |
|
| 20.1 up to 3 months | 1 | 49 | Risk Ratio (M‐H, Random, 95% CI) | 1.94 [0.24, 15.97] |
| 20.2 4 to 6 months | 6 | 1009 | Risk Ratio (M‐H, Random, 95% CI) | 1.67 [0.41, 6.80] |
| 20.3 7 to 12 months | 5 | 968 | Risk Ratio (M‐H, Random, 95% CI) | 1.74 [0.88, 3.45] |
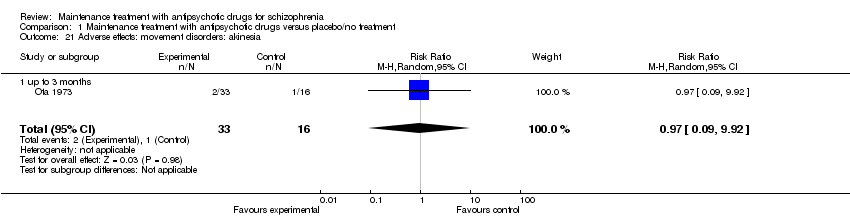
| 21 Adverse effects: movement disorders: akinesia Show forest plot | 1 | 49 | Risk Ratio (M‐H, Random, 95% CI) | 0.97 [0.09, 9.92] |
|
| 21.1 up to 3 months | 1 | 49 | Risk Ratio (M‐H, Random, 95% CI) | 0.97 [0.09, 9.92] |
| 22 Adverse effects: movement disorders: dyskinesia Show forest plot | 13 | 1820 | Risk Ratio (M‐H, Random, 95% CI) | 0.52 [0.28, 0.97] |
|
| 22.1 up to 3 months | 1 | 49 | Risk Ratio (M‐H, Random, 95% CI) | 1.5 [0.06, 34.91] |
| 22.2 4 to 6 months | 3 | 418 | Risk Ratio (M‐H, Random, 95% CI) | 0.31 [0.11, 0.84] |
| 22.3 7 to 12 months | 9 | 1353 | Risk Ratio (M‐H, Random, 95% CI) | 0.68 [0.30, 1.58] |
| 23 Adverse effects: movement disorders: dystonia Show forest plot | 6 | 824 | Risk Ratio (M‐H, Random, 95% CI) | 1.89 [1.05, 3.41] |
|
| 23.1 up to 3 months | 1 | 49 | Risk Ratio (M‐H, Random, 95% CI) | 2.5 [0.13, 49.22] |
| 23.2 4 to 6 months | 2 | 382 | Risk Ratio (M‐H, Random, 95% CI) | 1.75 [0.94, 3.29] |
| 23.3 7 to 12 months | 3 | 393 | Risk Ratio (M‐H, Random, 95% CI) | 3.97 [0.44, 35.54] |
| 24 Adverse effects: movement disorders: rigor Show forest plot | 5 | 249 | Risk Ratio (M‐H, Random, 95% CI) | 1.25 [0.54, 2.88] |
|
| 24.1 up to 3 months | 1 | 49 | Risk Ratio (M‐H, Random, 95% CI) | 0.73 [0.24, 2.22] |
| 24.2 4 to 6 months | 3 | 160 | Risk Ratio (M‐H, Random, 95% CI) | 1.98 [0.67, 5.85] |
| 24.3 7 to 12 months | 1 | 40 | Risk Ratio (M‐H, Random, 95% CI) | 0.0 [0.0, 0.0] |
| 25 Adverse effects: movement disorders: tremor Show forest plot | 10 | 1468 | Risk Ratio (M‐H, Random, 95% CI) | 1.25 [0.81, 1.93] |
|
| 25.1 up to 3 months | 1 | 49 | Risk Ratio (M‐H, Random, 95% CI) | 1.09 [0.40, 3.01] |
| 25.2 4 to 6 months | 3 | 160 | Risk Ratio (M‐H, Random, 95% CI) | 0.92 [0.33, 2.61] |
| 25.3 7 to 12 months | 6 | 1259 | Risk Ratio (M‐H, Random, 95% CI) | 1.41 [0.82, 2.43] |
| 26 Adverse effects: movement disorders: use of antiparkinson medication Show forest plot | 7 | 1317 | Risk Ratio (M‐H, Random, 95% CI) | 1.40 [1.03, 1.89] |
|
| 26.1 4 to 6 months | 3 | 841 | Risk Ratio (M‐H, Random, 95% CI) | 1.53 [0.90, 2.61] |
| 26.2 7 to 12 months | 4 | 476 | Risk Ratio (M‐H, Random, 95% CI) | 1.33 [0.86, 2.05] |
| 27 Adverse effects: sedation Show forest plot | 10 | 2146 | Risk Ratio (M‐H, Random, 95% CI) | 1.50 [1.22, 1.84] |
|
| 27.1 4 to 6 months | 6 | 1577 | Risk Ratio (M‐H, Random, 95% CI) | 1.33 [0.86, 2.07] |
| 27.2 7 to 12 months | 4 | 569 | Risk Ratio (M‐H, Random, 95% CI) | 1.72 [0.90, 3.31] |
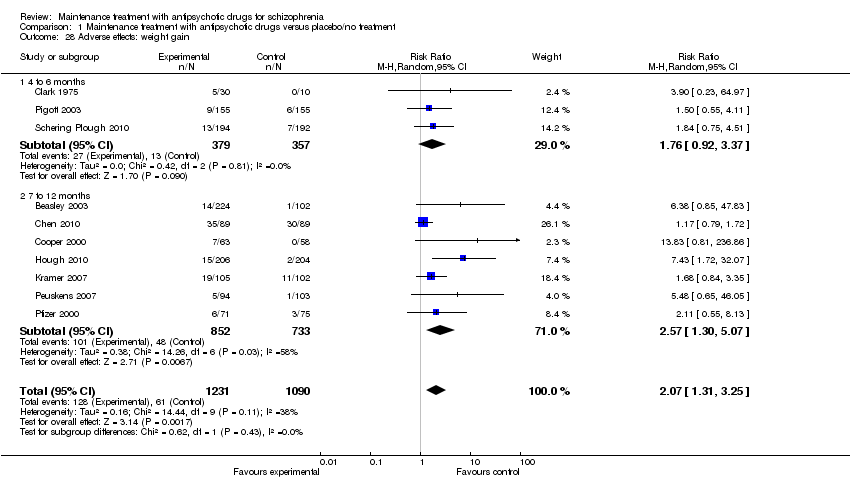
| 28 Adverse effects: weight gain Show forest plot | 10 | 2321 | Risk Ratio (M‐H, Random, 95% CI) | 2.07 [1.31, 3.25] |
|
| 28.1 4 to 6 months | 3 | 736 | Risk Ratio (M‐H, Random, 95% CI) | 1.76 [0.92, 3.37] |
| 28.2 7 to 12 months | 7 | 1585 | Risk Ratio (M‐H, Random, 95% CI) | 2.57 [1.30, 5.07] |
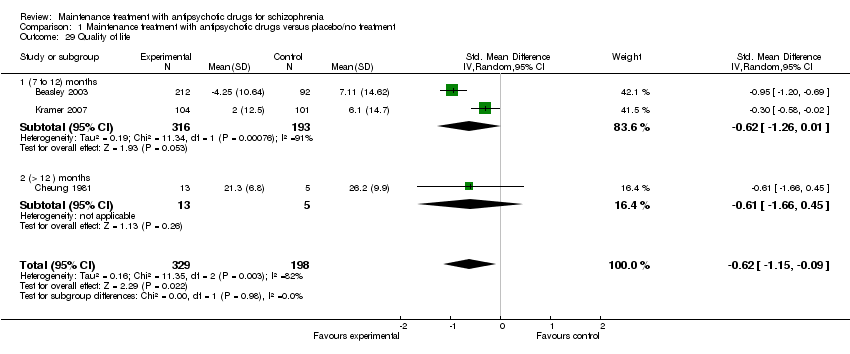
| 29 Quality of life Show forest plot | 3 | 527 | Std. Mean Difference (IV, Random, 95% CI) | ‐0.62 [‐1.15, ‐0.09] |
|
| 29.1 (7 to 12) months | 2 | 509 | Std. Mean Difference (IV, Random, 95% CI) | ‐0.62 [‐1.26, 0.01] |
| 29.2 (> 12 ) months | 1 | 18 | Std. Mean Difference (IV, Random, 95% CI) | ‐0.61 [‐1.66, 0.45] |
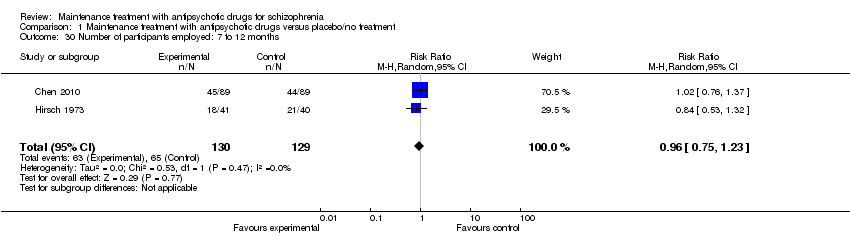
| 30 Number of participants employed: 7 to 12 months Show forest plot | 2 | 259 | Risk Ratio (M‐H, Random, 95% CI) | 0.96 [0.75, 1.23] |
|