Excimer laser refractive surgery versus phakic intraocular lenses for the correction of moderate to high myopia
Information
- DOI:
- https://doi.org/10.1002/14651858.CD007679.pub4Copy DOI

- Database:
-
- Cochrane Database of Systematic Reviews
- Version published:
-
- 17 June 2014see what's new
- Type:
-
- Intervention
- Stage:
-
- Review
- Cochrane Editorial Group:
-
Cochrane Eyes and Vision Group
- Copyright:
-
- Copyright © 2014 The Cochrane Collaboration. Published by John Wiley & Sons, Ltd.
Article metrics
Altmetric:
Cited by:
Authors
Contributions of authors
AB conceived the review question and co‐ordinated the review, designed other search strategies, undertook manual searches, organised retrieval of full‐text copies, provided additional data about papers and entered data in to RevMan.
BA provided general advice on review.
AB and BA screened search results, screened retrieved papers against inclusion criteria, appraised quality of papers, extracted data from papers, wrote to authors for additional information, obtained and screened data on unpublished studies, performed analysis of data, provided methodological, clinical, policy and consumer perspective, wrote drafts of the review and responded to peer review comments and comments from the editorial base.
Update of review Issue 1, 2011 and Issue 6, 2014
AB and Cochrane Eyes and Vision Group (CEVG) Trials Search Co‐ordinator (TSC) screened search results.
AB, CEVG Managing Editor and TSC updated the review (minor edits).
Declarations of interest
None
Acknowledgements
The Cochrane Eyes and Vision Group created and executed the electronic search strategies. We would like to thank Anupa Shah, Richard Wormald, Alex Shortt, Catey Bunce and Vincenzo Maurino for their help and comments on this review.
Richard Wormald (Co‐ordinating Editor for CEVG) and Bruce Allan (Co‐Author) acknowledge financial support for research sessions from the Department of Health through the award made by the National Institute for Health Research to Moorfields Eye Hospital NHS Foundation Trust and UCL Institute of Ophthalmology for a Specialist Biomedical Research Centre for Ophthalmology. The views expressed in this publication are those of the authors and not necessarily those of the Department of Health.
Version history
| Published | Title | Stage | Authors | Version |
| 2014 Jun 17 | Excimer laser refractive surgery versus phakic intraocular lenses for the correction of moderate to high myopia | Review | Allon Barsam, Bruce DS Allan | |
| 2012 Jan 18 | Excimer laser refractive surgery versus phakic intraocular lenses for the correction of moderate to high myopia | Review | Allon Barsam, Bruce DS Allan | |
| 2010 May 12 | Excimer laser refractive surgery versus phakic intraocular lenses for the correction of moderate to high myopia | Review | Allon Barsam, Bruce DS Allan | |
| 2009 Apr 15 | Excimer laser refractive surgery versus phakic intraocular lenses for the correction of moderate to high myopia | Protocol | Allon Barsam, Bruce DS Allan | |
Differences between protocol and review
We have added the percentage of eyes within ±1.00 D of target refraction at six and at 12 months post‐treatment as this provides further important information on the accuracy of the procedure. We have also added the percentage of eyes that lost 1 or more lines of BSCVA at six and at 12 months post‐treatment in order to provide more information on potential safety measures for the two procedures. The 12 month time point for both of these additions is reported by all three RCTs and therefore allows us to adequately address the diversity of outcomes reported in the individual trials.
Keywords
MeSH
Medical Subject Headings (MeSH) Keywords
Medical Subject Headings Check Words
Humans;
PICOs

Results from searching for studies for inclusion in the review.

Risk of bias graph: review authors' judgements about each risk of bias item presented as percentages across all included studies.
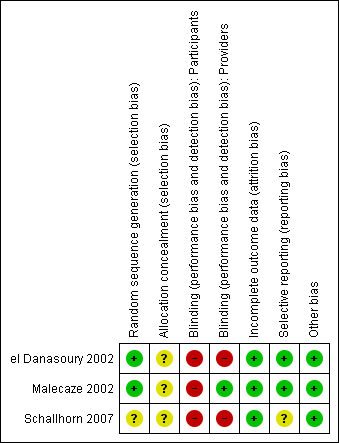
Risk of bias summary: review authors' judgements about each risk of bias item for each included study.

Comparison 1 Excimer laser versus phakic IOL, Outcome 1 Uncorrected visual acuity of 20/20 or better at 12 months post‐treatment.

Comparison 1 Excimer laser versus phakic IOL, Outcome 2 UCVA of 20/20 or better at 6 months post‐treatment.
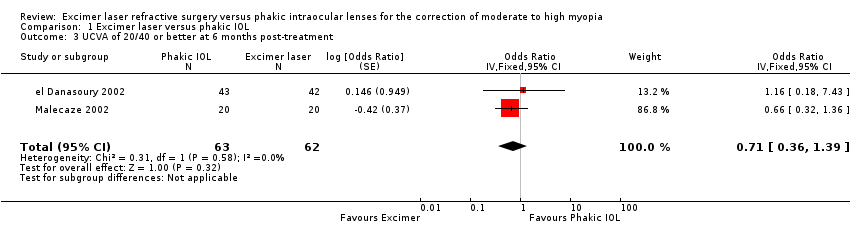
Comparison 1 Excimer laser versus phakic IOL, Outcome 3 UCVA of 20/40 or better at 6 months post‐treatment.

Comparison 1 Excimer laser versus phakic IOL, Outcome 4 UCVA of 20/40 or better at 12 months post‐treatment.

Comparison 1 Excimer laser versus phakic IOL, Outcome 5 Percentage of eyes within ±0.50 D of target refraction at six months post‐treatment.

Comparison 1 Excimer laser versus phakic IOL, Outcome 6 Percentage of eyes within ±0.50 D of target refraction at 12 months post‐treatment.

Comparison 1 Excimer laser versus phakic IOL, Outcome 7 Percentage of eyes within ±1.00 D of target refraction at six months post‐treatment.
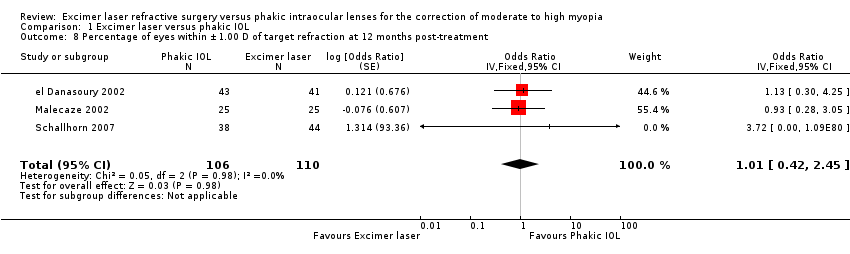
Comparison 1 Excimer laser versus phakic IOL, Outcome 8 Percentage of eyes within ±1.00 D of target refraction at 12 months post‐treatment.
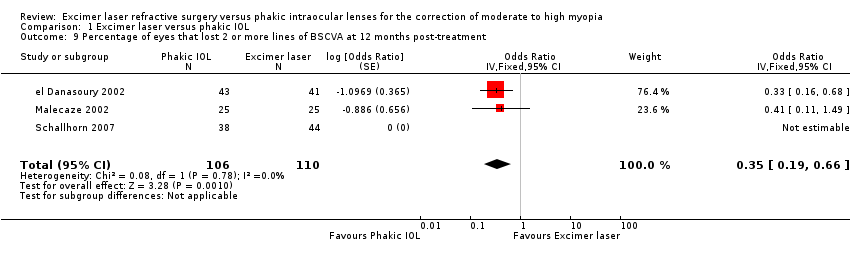
Comparison 1 Excimer laser versus phakic IOL, Outcome 9 Percentage of eyes that lost 2 or more lines of BSCVA at 12 months post‐treatment.

Comparison 1 Excimer laser versus phakic IOL, Outcome 10 Percentage of eyes that lost 1 or more lines of BSCVA at 6 months post‐treatment.
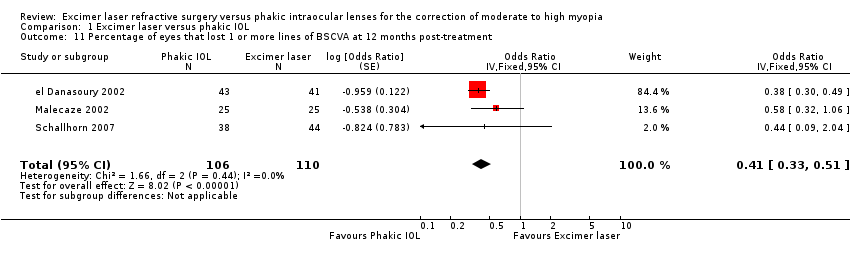
Comparison 1 Excimer laser versus phakic IOL, Outcome 11 Percentage of eyes that lost 1 or more lines of BSCVA at 12 months post‐treatment.
| Study | Complication rate | Flap/interface complication | Management | Outcome |
| el Danasoury 2002 | 1 interface complication in 45 LASIK treatments. No other flap/decentered ablation complications | Diffuse lamellar keratitis 3 days after uneventful LASIK | Topical steroid therapy | Inflammation completely resolved within one week |
| Malecaze 2002 | 0 flap/interface/decentered ablation complications in 25 LASIK treatments | N/A | N/A | N/A |
| Schallhorn 2007 | Flap/interface complications N/A as all treatments PRK. No decentered ablations or haze reported in 45 laser treatments | N/A | N/A | N/A |
| LASIK: laser assisted stromal in‐situ keratomileusis | ||||
| Study | Follow‐up | Findings |
| el Danasoury 2002 | One year | The mean endothelial cell loss 0.7% ± 1.1% (range ‐3.1% to 1.7 %) at 1 year in the Artisan group and mean 0.3% ± 0.9% (range ‐1.9% to 1.8%) at 1 year in the LASIK group. There was no statistically significant difference between endothelial cell loss in the 2 groups |
| Malecaze 2002 | One year | The differences between mean endothelial cell loss in LASIK treated eyes and Artisan‐treated eyes was not statistically different at either 3 months (P = 0.73) or 1 year (P = 0.60) postoperatively |
| Schallhorn 2007 | Endothelial cell loss was not reported. | N/A |
| LASIK: laser assisted stromal in‐situ keratomileusis | ||
| Study | IOL exchange rate | Indication for IOL exchange | Management | Outcome |
| el Danasoury 2002 | 1 eye (2.2%) | Severe night glare in a patient with a preoperative pupil at dim illumination of 5mm who received a 5 mm Artisan lens | Lens was removed and exchanged for a 6 mm Artisan lens | Night glare completely resolved. UCVA was 20/40 correcting to 20/20 |
| Malecaze 2002 | 0 cases reported of IOL exchange | N/A | N/A | N/A |
| Schallhorn 2007 | 1 eye (2.3%) | Anterior subcapsular cataract resulting in BCVA 20/50‐1 | Phakic IOL and cataract were removed and replaced with pseudophakic IOL | BSCVA of 20/20 |
| BCVA: best corrected visual acuity | ||||
| Study | Method | Findings |
| el Danasoury 2002 | Measured using the Vision Contrast Test System (VCTS‐6000, Vistech consultants, Inc. Dayton, OH) performed under normal room lighting | One year after surgery the contrast sensitivity curve of each eye was compared to its baseline curve. Two Artisan eyes (4.7%) and six LASIK eyes (14.6%) lost 2 or more lines, three Artisan eyes (7.0%) and nine LASIK eyes (22.0%) lost 1 line, four Artisan eyes (9.3%) and no LASIK eyes gained 2 or more lines, and seven Artisan eyes (16.3%) and five LASIK eyes (12.2%) gained 1 line. The contrast sensitivity did not change in 27 Artisan eyes (62.8%) and 21 LASIK eyes (51.2%). There was no comment on whether this difference was statistically significant or not |
| Malecaze 2002 | Not described | Pre‐operative contrast sensitivity measurements to one year postoperative measurements were slightly reduced in the LASIK group and slightly improved in the phakic IOL group. However this difference was not statistically significant at all 4 spatial frequencies (P = 0.66, 0.70, 0.06 and 0.29 for 3, 6, 12 and 18 cycles per degree cyc/deg respectively) |
| Schallhorn 2007 | Photopic contrast sensitivity was conducted with a back‐illuminated chart (5% ETDRS Chart, 9x14, Model 2186; Precision Vision, LaSalle, ILL) with room lights off. Mesopic testing was conducted with a 25% ETDRS chart (Precision Vision) behind two neutral density filters and room lights off | 5% photopic level: The mean BSCVA (logMAR) was significantly better in the phakic IOL group than the PRK laser group at all time points postoperatively (P = 0.002 at one week and P = <0.001 at all other time points). Loss of 2 or more lines of BSCVA was significantly higher in the PRK group at all time points except six months. Improvement in BSCVA by 2 or more lines and 1 or more lines was significantly better in the phakic IOL group from 1 to 12 months postoperatively 25% mesopic level: The mean BSCVA (logMAR) was significantly better in the phakic IOL group than the PRK laser group at all time points postoperatively (P = 0.048 at one week and P = <0.001 at all other time points). Improvement in BSCVA (2 or more lines) was significantly better in the phakic IOL group at all time points from 1 to 12 months. Losses of 1 or more lines of BSCVA was significantly higher in the PRK group at all time points after one week. Improvement of one or more lines of BSCVA was better in the phakic IOL series at 1, 3 and 12 months |
| BSCVA: best spectacle corrected visual acuity | ||
| Study | Methods | FIndings |
| el Danasoury 2002 | Patient satisfaction and preference questionnaire at 12 months postoperatively. This was only given to the 18 patients that had Artisan in one eye and LASIK in the other eye | There was no significant difference in the satisfaction levels between the two groups. 11 patients (61.1%) experienced more night glare or halos with their LASIK eye, 3 patients (16.7%) had more night glare with their Artisan eye, 1 patient (5.6%) reported equal glare in both eyes and 3 patients (16.7%) said that they had no glare with either eye (P = 0.001) Patient preference for Artisan was significantly higher (P = 0.0001) mainly because of better reported quality of vision |
| Malecaze 2002 | Patient satisfaction questionnaire at 12 months postoperatively | There was a slightly significantly increased frequency of halos following LASIK (P = 0.05) and non‐significantly increased frequency of halos following Artisan (P = 0.19). Both groups showed a significantly increased frequency of glare (P = 0.02 for LASIK and P = 0.01 for Artisan) but there was no statistically significant difference between the two groups (P = 0.30 for halos and P = 0.20 for glare). The satisfaction levels were not statistically different (P = 0.40) between the two groups. Concerning preference for one of the two techniques: 16% of patients preferred LASIK, 44% preferred Artisan and 40% had no preference |
| Schallhorn 2007 | Psychometric questionnaire was given preoperatively and 3, 6 and 12 months postoperatively. The questionnaire assessed subjective quality of vision (glare, halos, night vision, need for artificial tears) and satisfaction after the surgery | The PRK group showed significantly more need for artificial tears (P = 0.002) and more visual fluctuation (0.001) at the 3 and 6 month postoperative time periods. The PRK group had more glare symptoms at night (P = 0.033) and more trouble with oncoming car headlights at night (P = 0.014). All other questions at 3 and 6 months showed no difference between the two groups. The 12‐month questionnaire showed similar subjective visual results between the two groups with the exception of greater use of artificial tears in the PRK group (P = 0.008) and greater glare when watching television or computer monitors (P = 0.043) |
| LASIK: laser assisted stromal in‐situ keratomileusis | ||
| Outcome or subgroup title | No. of studies | No. of participants | Statistical method | Effect size |
| 1 Uncorrected visual acuity of 20/20 or better at 12 months post‐treatment Show forest plot | 2 | 166 | Odds Ratio (Fixed, 95% CI) | 1.33 [0.08, 22.55] |
| 2 UCVA of 20/20 or better at 6 months post‐treatment Show forest plot | 2 | 157 | Odds Ratio (Fixed, 95% CI) | 0.99 [0.25, 3.91] |
| 3 UCVA of 20/40 or better at 6 months post‐treatment Show forest plot | 2 | 125 | Odds Ratio (Fixed, 95% CI) | 0.71 [0.36, 1.39] |
| 4 UCVA of 20/40 or better at 12 months post‐treatment Show forest plot | 2 | 134 | Odds Ratio (Fixed, 95% CI) | 0.66 [0.36, 1.22] |
| 5 Percentage of eyes within ±0.50 D of target refraction at six months post‐treatment Show forest plot | 1 | Odds Ratio (Fixed, 95% CI) | Subtotals only | |
| 6 Percentage of eyes within ±0.50 D of target refraction at 12 months post‐treatment Show forest plot | 3 | 216 | Odds Ratio (Fixed, 95% CI) | 0.72 [0.40, 1.29] |
| 7 Percentage of eyes within ±1.00 D of target refraction at six months post‐treatment Show forest plot | 1 | Odds Ratio (Fixed, 95% CI) | Subtotals only | |
| 8 Percentage of eyes within ±1.00 D of target refraction at 12 months post‐treatment Show forest plot | 3 | 216 | Odds Ratio (Fixed, 95% CI) | 1.01 [0.42, 2.45] |
| 9 Percentage of eyes that lost 2 or more lines of BSCVA at 12 months post‐treatment Show forest plot | 3 | 216 | Odds Ratio (Fixed, 95% CI) | 0.35 [0.19, 0.66] |
| 10 Percentage of eyes that lost 1 or more lines of BSCVA at 6 months post‐treatment Show forest plot | 1 | Odds Ratio (Fixed, 95% CI) | Subtotals only | |
| 11 Percentage of eyes that lost 1 or more lines of BSCVA at 12 months post‐treatment Show forest plot | 3 | 216 | Odds Ratio (Fixed, 95% CI) | 0.41 [0.33, 0.51] |