Ecografía Doppler umbilical y fetal en embarazos de alto riesgo
References
Referencias de los estudios incluidos en esta revisión
Referencias de los estudios excluidos de esta revisión
Referencias adicionales
Referencias de otras versiones publicadas de esta revisión
Characteristics of studies
Characteristics of included studies [ordered by study ID]
Jump to:
| Methods | 2‐arm prospective RCT; randomised block design; individual women. | |
| Participants | Singleton pregnancies with suspected IUGR at 31 completed weeks of pregnancy. IUGR if fetal weight < 2 SD below the mean at 31 weeks. N = 427 women. | |
| Interventions | Intervention: Doppler of umbilical artery only every 2 weeks till birth unless:
Comparison: CTG (NST). | |
| Outcomes | Primary: GA at delivery, frequency of CS, frequency of operative delivery for fetal distress, CS, vacuum, forceps, length of stay at NICU. Secondary: number of fetal monitoring occasions, duration of antenatal hospital stay, frequency of labour induction, birthweight, frequency of small‐for‐dates infants, Apgar score at 1 min and 5 min, need for respiratory support. | |
| Notes | ||
| Risk of bias | ||
| Bias | Authors' judgement | Support for judgement |
| Random sequence generation (selection bias) | Unclear risk | Randomised block design. No information about how the randomisation was performed. |
| Allocation concealment (selection bias) | Unclear risk | Sealed numbered envelopes according to a randomisation block design. This may mean separate randomisation schedules for the 4 different hospitals. No mention of whether the envelopes were opaque. |
| Blinding of participants and personnel (performance bias) | Unclear risk | Blinding women and/or staff in these trials was not generally feasible. |
| Blinding of outcome assessment (detection bias) | Unclear risk | Blinding women and/or staff in these trials was not generally feasible. |
| Incomplete outcome data (attrition bias) | Low risk | No women were lost to follow‐up. 3 women declined to take part in the trial. 1 woman in the CTG group had to be excluded from data analysis since all her records were mislaid before evaluation. All women seemed to get their allocated Doppler or CTG, so this was an ITT analysis. |
| Selective reporting (reporting bias) | Unclear risk | All outcomes were described in results section, but we did not assess the trial protocol. |
| Other bias | High risk | The study was not stopped earlier. Baseline imbalance:
Differential diagnosis: Almstrom 1995 concluded that obstetricians may have been influenced by the knowledge of a normal umbilical Doppler examination when assessing the CTG in labour. This might have contributed bias to the finding of fewer emergency CS for fetal distress in the Doppler group than in the CTG group. |
| Methods | Randomised controlled study. | |
| Participants | Women with high‐risk singleton pregnancies. N = 674 women randomised. | |
| Interventions | Intervention: Doppler of umbilical artery revealed. N = 338. Comparison: no Doppler. N = 336. | |
| Outcomes | Elective births; GA at birth; birthweight; Apgar scores, admissions to NICU, length of time in NICU, number of babies ventilated, length of ventilation, perinatal mortality. | |
| Notes | The information came only from the 2 conference abstracts and personal communication (ZA). Sadly, Dr Biljan has died, so further detailed information on the study is not available. The information on the number of women randomised to each group was obtained from previous published version of this systematic review (Alfirevic 1995), and data on 'potentially preventable perineal deaths' was calculated from data in a previous version of this Cochrane review (Neilson 1996). | |
| Risk of bias | ||
| Bias | Authors' judgement | Support for judgement |
| Random sequence generation (selection bias) | Unclear risk | "...were randomised..." |
| Allocation concealment (selection bias) | Unclear risk | No information provided. |
| Blinding of participants and personnel (performance bias) | Unclear risk | Blinding women and/or staff in these trials was not generally feasible. |
| Blinding of outcome assessment (detection bias) | Unclear risk | Blinding women and/or staff in these trials was not generally feasible. |
| Incomplete outcome data (attrition bias) | Unclear risk | Insufficient information provided in the conference abstract to assess this. |
| Selective reporting (reporting bias) | High risk | Only gave data for the significant findings and reported the nonsignificant findings just as lower but not statistically significant. |
| Other bias | Unclear risk | Insufficient information provided in the conference abstract to assess this. |
| Methods | Prospective RCT, individual women, 2 trial arms. | |
| Participants | Women with high‐risk pregnancies (suspected IUGR, hypertensive disorders, previous baby < 2.5 kg, antepartum haemorrhage, previous perinatal death, diminished fetal movements, post maturity, diabetes, and others). N = 476 women. | |
| Interventions | Intervention: Doppler of umbilical artery and fetal biometry and BPP scoring. Comparison: fetal biometry and BPP scoring. | |
| Outcomes | Primary outcomes: induction of labour, elective and emergency CS, preterm delivery, and perinatal loss. | |
| Notes | ||
| Risk of bias | ||
| Bias | Authors' judgement | Support for judgement |
| Random sequence generation (selection bias) | Unclear risk | Randomisation by a random number sequence but it was unclear whether this was made by a third independent person. |
| Allocation concealment (selection bias) | Unclear risk | Sealed numbered envelopes but there was no information whether the envelopes were opaque and whether there was an ordered numbered sequence. |
| Blinding of participants and personnel (performance bias) | Unclear risk | Blinding women and/or staff in these trials was not generally feasible. |
| Blinding of outcome assessment (detection bias) | Unclear risk | Blinding women and/or staff in these trials was not generally feasible. |
| Incomplete outcome data (attrition bias) | Low risk | No exclusions after randomisation. Reported as ITT. |
| Selective reporting (reporting bias) | Unclear risk | All outcomes were described in the results section, but we did not assess the trial protocol. |
| Other bias | Low risk | The study was not stopped early. Baseline imbalance: "Doppler examinations were not carried out in the control group unless specifically requested by the consultant in charge of patients" ‐ 2 women in the control group had a Doppler and were not excluded. |
| Methods | 2‐arm RCT of individual women. | |
| Participants | Women with singleton post‐term pregnancies (40 + 3 weeks to 42 + 3 weeks). N = 107 women. | |
| Interventions | Intervention: Doppler US of umbilical artery. Comparison: no Doppler US, and standard care (FHR). | |
| Outcomes | CS, RDS and post maturity. | |
| Notes | Paper in French with English abstract, paper was translated. Most of the data were missing. | |
| Risk of bias | ||
| Bias | Authors' judgement | Support for judgement |
| Random sequence generation (selection bias) | Unclear risk | Women "...were randomly divided...". No information on how the random sequence was generated. |
| Allocation concealment (selection bias) | Unclear risk | Not described. |
| Blinding of participants and personnel (performance bias) | Unclear risk | Blinding women and/or staff in these trials was not generally feasible. |
| Blinding of outcome assessment (detection bias) | Unclear risk | Blinding women and/or staff in these trials was not generally feasible. |
| Incomplete outcome data (attrition bias) | Unclear risk | Describe any loss of participants to follow‐up at each data collection point:
Describe any exclusion of participants after randomisation:
Was the analysis ITT? If not, have the data been able to be reincluded?
|
| Selective reporting (reporting bias) | Unclear risk | There was no list of prespecified outcomes as far as we could ascertain and we did not assess the trial protocol. |
| Other bias | Unclear risk | If the study was stopped early, explain the reasons:
Describe any baseline imbalance:
Describe any differential diagnosis:
|
| Methods | Multi‐centred RCT; block randomisation, block of 20. Individual women, 2‐arm trial. | |
| Participants | Women with twin pregnancies (monochorionic and dichorionic) at 25 weeks. 2 viable apparently normally formed fetuses seen on US scan. Exclusions: fetal anomalies; polyhydramnios/oligohydramnios; demise of 1 twin before 25 weeks. Significance of chorionicity not realised at time randomisation began so no attempt was made to assess chorionicity. N = 539 women. | |
| Interventions | Intervention: Doppler and biometry US.
Comparison: biometry US.
| |
| Outcomes | Maternal: antenatal admission, presence of hypertension, gestation at delivery, indication for delivery and mode of delivery. Fetal: US biometry measurements, umbilical artery doppler systolic diastolic ratios and the occurrence of fetal death and causative factors. Neonatal: birthweight, Apgar scores, admission to NICU, admission to special care nursery, requirements for ventilation and occurrence of neonatal death (up to 28 days of life). | |
| Notes | ||
| Risk of bias | ||
| Bias | Authors' judgement | Support for judgement |
| Random sequence generation (selection bias) | Unclear risk | “....opaque sealed envelopes containing the randomisation code the envelope being opened by an observer remote from patient care”. |
| Allocation concealment (selection bias) | Low risk | “....opaque sealed envelopes containing the randomisation code the envelope being opened by an observer remote from patient care". |
| Blinding of participants and personnel (performance bias) | Unclear risk | Blinding women and/or staff in these trials was not generally feasible. |
| Blinding of outcome assessment (detection bias) | Unclear risk | Blinding women and/or staff in these trials was not generally feasible. |
| Incomplete outcome data (attrition bias) | Low risk | Describe any loss of participants to follow‐up at each data collection point:
Describe any exclusion of participants after randomisation: Was the analysis ITT? If not, have the data been able to be reincluded?
|
| Selective reporting (reporting bias) | Unclear risk | There seemed to be no evidence of selective reporting bias, but we did not assess the trial protocol. |
| Other bias | Low risk | If the study was stopped early, explain the reasons:
Describe any baseline imbalance:
|
| Methods | 2‐arm RCT with stratified block randomisation producing 4 groups: Caucasian primiparous and multiparous women, and Asian primiparous and multiparous women. Randomised in blocks of 8 using table of random numbers. However, the results are not reported by any of these subgroups ‐ only Doppler vs CTG overall. Randomisation was of individual women. | |
| Participants | Women with singleton fetuses with US examination showing the abdominal circumference < 2 SD of the mean for the GA FHR on charts recommended by British Medical Ultrasound Society. There was no GA constraint although all women were > 26 weeks' gestation. N = 150 women. | |
| Interventions | Intervention: Doppler of umbilical artery and no CTG. Comparison: CTG. | |
| Outcomes | Primary: duration of hospital antenatal admission, induction of labour rates. Secondary: number of investigations (CTG or Doppler), number of outpatient visits to hospital, emergency CS rate, length of stay on the NICU, birthweight, and 1 min and 5 min Apgar score. All women were sent a questionnaire asking their views on the process of their care. | |
| Notes | ||
| Risk of bias | ||
| Bias | Authors' judgement | Support for judgement |
| Random sequence generation (selection bias) | Low risk | Blocks of 8 using a table of random numbers. |
| Allocation concealment (selection bias) | Low risk | "...randomisation only possible by telephone .... sequentially numbered sealed opaque envelopes..." |
| Blinding of participants and personnel (performance bias) | Unclear risk | Blinding women and/or staff in these trials was not generally feasible. |
| Blinding of outcome assessment (detection bias) | Unclear risk | Blinding women and/or staff in these trials was not generally feasible. |
| Incomplete outcome data (attrition bias) | Low risk | No loss of participants at follow‐up. No exclusion after the randomisation. ITT analysis. |
| Selective reporting (reporting bias) | Unclear risk | We did not assess the trial protocol. Also, despite the stratified randomisation to look at ethnicity and parity, the results are not reported by any of these subgroups, only Doppler vs CTG overall. |
| Other bias | Low risk | Study went to completion. Baseline imbalance: more women had no live‐in support at home in the CTG group. Differential diagnosis: "...there was not a rigid protocol except that clinicians usually felt that a CTG record gave reassurance for 48 to 72 hours and a Doppler examination for a week or more ...". |
| Methods | 2‐arm RCT, but with additional evaluation by the nonallocated technique. Randomisation was of individual women. | |
| Participants | Women undergoing evaluation of fetal well‐being in the high‐risk obstetric unit. 867 women randomised. N = 897 women. | |
| Interventions | Intervention: Doppler US of umbilical artery. Comparison: computerised CTG. | |
| Outcomes | Number and duration of tests; perinatal outcomes. “Our objective was to determine whether the experimental policy of Doppler study followed when necessary by FHR testing would take less time than routine FHR testing alone". | |
| Notes | We contacted the authors to ask for clarification of the phrase, "computer generated algorithm based on the hospital number". They kindly responded with an explanation: "allocation was done automatically by a computer programme. Although the algorithm made use of the woman's hospital number, it was impossible for the midwife performing the fetal assessment to predict to which group the women would be allocated. The 'algorithm' was simply a mathematical sequence which was applied to the woman's hospital number to generate an allocation". | |
| Risk of bias | ||
| Bias | Authors' judgement | Support for judgement |
| Random sequence generation (selection bias) | Low risk | "...computer generated algorithm based on the hospital number...". We sought clarification from the authors who kindly responded: "allocation was done automatically by a computer programme". |
| Allocation concealment (selection bias) | Low risk | Not described in the paper but we wrote for clarification from the authors who kindly responded: "although the algorithm made use of the woman's hospital number, it was impossible for the midwife performing the fetal assessment to predict to which group the women would be allocated. The 'algorithm' was simply a mathematical sequence which was applied to the woman's hospital number to generate an allocation". |
| Blinding of participants and personnel (performance bias) | Unclear risk | Blinding women and/or staff in these trials was not generally feasible. |
| Blinding of outcome assessment (detection bias) | Unclear risk | Blinding women and/or staff in these trials was not generally feasible. |
| Incomplete outcome data (attrition bias) | Unclear risk | Describe any loss of participants to follow‐up at each data collection point:
Describe any exclusion of participants after randomisation:
Was the analysis ITT? If not, have the data been able to be reincluded?
|
| Selective reporting (reporting bias) | Unclear risk | There was no list of prespecified outcomes from the protocol, and we did not assess the trial protocol. |
| Other bias | High risk | If the study was stopped early, explain the reasons:
Describe any baseline imbalance:
|
| Methods | 2‐arm RCT. Randomisation by Zelen method ‐ only those randomised to Doppler were invited to participate in the trial. Those allocated to CTG were being given normal care so their permission was regarded as not required. Randomisation was of individual women. | |
| Participants | Women with pregnancies identified clinically as being at increased risk (N = 2289 out of the 8018 women giving birth at the hospital during the time of the study). Doppler or CTG or BPP was given to pregnant women where there was concern by medical staff about antenatal fetal well‐being by random allocation. Women were admitted to the trial if there was a wish for Doppler studies or a referral for AN fetal monitoring (CTG or BPP). So, all women meeting these criteria were randomised regardless of risk. N = 2289 women. | |
| Interventions | Intervention: Doppler US of umbilical artery (and other monitoring). Comparison: no Doppler ‐ but other monitoring used (CTG/BPP). | |
| Outcomes | Fetal mortality and morbidity; obstetric interventions; use of other tests of fetal monitoring; impact on obstetric decision making; health and personal costs; women’s satisfaction (to be presented in a separate report). | |
| Notes | ||
| Risk of bias | ||
| Bias | Authors' judgement | Support for judgement |
| Random sequence generation (selection bias) | Unclear risk | Just described as randomised. |
| Allocation concealment (selection bias) | Low risk | “Sequentially numbered opaque sealed envelopes were attached by stapling to the case notes of all women attending this hospital. Randomisation was carried out by opening the envelope for every woman who met the criteria described above.” |
| Blinding of participants and personnel (performance bias) | Unclear risk | Blinding women and/or staff in these trials was not generally feasible. |
| Blinding of outcome assessment (detection bias) | Unclear risk | Blinding women and/or staff in these trials was not generally feasible. |
| Incomplete outcome data (attrition bias) | Low risk | Describe any loss of participants to follow‐up at each data collection point:
Describe any exclusion of participants after randomisation:
Was the analysis ITT? If not, have the data been able to be reincluded?
|
| Selective reporting (reporting bias) | Unclear risk | They seemed to report on their prespecified outcomes but we did not assess the trial protocol. |
| Other bias | Low risk | If the study was stopped early, explain the reasons:
Describe any baseline imbalance:
Describe any differential diagnosis:
Receiving the other intervention:
|
| Methods | 3‐arm prospective randomised controlled study of individual women. | |
| Participants | Study in 20 tertiary care hospitals in 5 European countries (Austria, Germay, Italy, The Netherlands, UK). Women over 18 years capable of giving consent. Singleton pregnancy at 26 + 0 to 31 + 6 weeks’ gestation with FGR (defined as abdominal circumference below the 10th percentile based on local standards and abnormal umbilical artery Doppler pulsatility index (PI) above the 95th percentile based on local standards irrespective of the presence or absence of reversed end‐diastolic flow). In all cases, estimated fetal weight was > 500 g. Short‐term variation after 1 hour of CTG tracing had to be > 3.5 ms at 26 to 28 weeks and > 4 at 29 to 31 weeks with ductus venosus PI < 95th percentile. (GA determined by US at 14 and between 14 to 21 + 6 weeks). Women with known or planned impending delivery, major structural abnormality or fetal karyotype abnormality were excluded. N = 511 randomised (8 subsequently excluded). | |
| Interventions | Randomisation groups: 1. Cardiotocograph short term variation (CTG STV) and timing of delivery was assessed with a criterion for reduced STV. Umbilical artery Doppler measurements were taken but no waveform measurements of the ductus venosus were recorded. (166 allocated, 21 lost to follow‐up, 1 missing neonatal data, 144 in primary analysis). 2. Early abnormality of ductus venosus prompted delivery (early changes pulsatility index > 95th percentile) (n = 167, 25 lost to follow‐up, 142 in primary analysis). 3. Late ductus venosus changes (a wave indicated no or reversed flow) (n = 170, 13 lost to follow‐up, 157 in primary analysis). All measurements were confirmed by a second measurement at least 24 hours later. Monitoring in all groups included umbilical artery Doppler and CTG was recommended at least once a week but could be more frequent depending on local protocol. Irrespective of randomised group, there was a cutoff rescue value for STV based on CTG at 26 to 28.9 weeks that prompted delivery. At 32 weeks, deliveries were according to local protocol. In all groups, delivery could be undertaken based on a maternal indication such as severe pre‐eclampsia or clear CTG abnormalities such as recurrent late decelerations. | |
| Outcomes | Primary outcome: survival without cerebral palsy or neurosensory impairment, or a Bayley III developmental score of less than 85 at 2 years of age. Secondary outcomes: composite of adverse neonatal outcome defined as fetal or postnatal death (between trial entry in‐utero and discharge home from neonatal services) or 1 or more of the following severe morbidities: BPD (defined as supplemental oxygen to maintain SATs > 90% at 36 weeks), severe cerebral haemorrhage (IVH grade III or IV) cystic periventricular leukomalacia, proven neonatal sepsis (blood culture and requiring antibiotics) or NEC (presence of pneumatosis or perforation on X‐ray or disease present on laparotomy). | |
| Notes | ||
| Risk of bias | ||
| Bias | Authors' judgement | Support for judgement |
| Random sequence generation (selection bias) | Low risk | Through central randomisation website. Random block design, stratified by gestation (< 29 vs > 29 weeks) and centre. |
| Allocation concealment (selection bias) | Low risk | Through central randomisation website. |
| Blinding of participants and personnel (performance bias) | Unclear risk | It was not feasible to blind clinicians to intervention group. Women may have been aware of randomisation group. |
| Blinding of outcome assessment (detection bias) | Low risk | Neonatal outcome data entered directly from records and entered into database. Not possible to blind outcome assessment for all outcomes, however, the assessor of the primary outcome was blinded. “Concealment of the allocated monitoring regime was not possible, and clinicians responsible for the care of the women entered in the study and women themselves were aware of the treatment allocation. However, the paediatrician doing the follow‐up examination was masked to follow‐up assessment and data entry allocation”. |
| Incomplete outcome data (attrition bias) | Low risk | Of 511 randomised, missing data for 8 women and babies for the primary outcome. There was some attrition at 2‐year follow‐up (59 lost to follow‐up). ITT analysis. |
| Selective reporting (reporting bias) | Low risk | Protocol available and no evidence of outcome reporting bias. |
| Other bias | Low risk | Demographic data given for whole sample and those with poor composite outcome. Groups appeared similar at baseline. |
| Methods | 2‐arm randomised controlled study of individual women. | |
| Participants | Women of 24 weeks or greater gestation with a singleton pregnancy, and ultrasonic evidence of IUGR (abdominal circumference on or below 5th centile for GA). N = 467 women. | |
| Interventions | Intervention: Doppler US of umbilical artery revealed, weekly or more often if indicated. Documented in notes. Discussed with registrar. Comparison: Doppler US weekly but recorded in separate file and not disclosed to clinicians. | |
| Outcomes | Obstetric management: gestation at birth, time from enrolment to birth, mode of birth/onset of labour, fetal distress in labour. Neonatal outcome: perinatal mortality, birthweight, admission to NICU, neonatal outcome. | |
| Notes | ||
| Risk of bias | ||
| Bias | Authors' judgement | Support for judgement |
| Random sequence generation (selection bias) | Unclear risk | No information other than 'randomised'. |
| Allocation concealment (selection bias) | Unclear risk | Sealed envelopes but there was no information as to whether the envelopes were opaque and whether they were distributed in a sequential order. |
| Blinding of participants and personnel (performance bias) | Unclear risk | Blinding women and/or staff in these trials was not generally feasible. |
| Blinding of outcome assessment (detection bias) | Unclear risk | Blinding women and/or staff in these trials was not generally feasible. |
| Incomplete outcome data (attrition bias) | Low risk | Describe any loss of participants to follow‐up at each data collection point:
Describe any exclusion of participants after randomisation: no exclusion:
Was the analysis ITT? If not, have the data been able to be reincluded?
|
| Selective reporting (reporting bias) | High risk | Not all outcomes available and we did not assess the trial protocol. |
| Other bias | Unclear risk | If the study was stopped early, explain the reasons:
|
| Methods | 2‐arm RCT, stratified for twin pregnancies. Randomisation was of individual women. | |
| Participants | Women with high‐risk pregnancies, singletons and twins. Defined as those disorders of pregnancy in which an increased risk of retarded fetal growth or impaired fetal well‐being were considered likely. N = 505 women. | |
| Interventions | Intervention: Doppler of umbilical and utero‐placental (within the placental bed) artery.
Comparison: no Doppler.
| |
| Outcomes | Primary: duration of neonatal stay in hospital. Secondary: number and type of fetal heart monitoring studies, obstetric interventions, frequency of fetal distress, birthweight, Apgar score, and need for NICU. | |
| Notes | ||
| Risk of bias | ||
| Bias | Authors' judgement | Support for judgement |
| Random sequence generation (selection bias) | Unclear risk | Just described as random. |
| Allocation concealment (selection bias) | Low risk | Numbered opaque sealed envelopes. |
| Blinding of participants and personnel (performance bias) | Unclear risk | Blinding women and/or staff in these trials was not generally feasible. |
| Blinding of outcome assessment (detection bias) | Low risk | Assessors of neonatal outcomes were blind to Doppler results. |
| Incomplete outcome data (attrition bias) | Low risk | Describe any loss of participants to follow‐up at each data collection point:
Describe any exclusion of participants after randomisation:
Was the analysis ITT? If not, have the data been able to be reincluded?
|
| Selective reporting (reporting bias) | Unclear risk | Reported outcomes were the same as those prespecified but we did not assess the trial protocol. |
| Other bias | Low risk | If the study was stopped early, explain the reasons:
Describe any baseline imbalance:
Describe any differential diagnosis:
|
| Methods | Randomised controlled study ‐ stratified randomisation and block randomisation. Stratification by GA (< 32 weeks and > 32 weeks) and smoking (regardless of number of cigarettes smoked). Randomisation by individual women, 2‐arm trial. | |
| Participants | Women with clinically suspected IUGR of > 2 weeks diagnosed by fundal height measurements at the outpatient clinic. Singleton pregnancies. Exclusions: multiple pregnancies, uncertain GA, nonCaucasian origin, maternal or fetal conditional requiring immediate hospitalisation or intervention. N = 161 women. | |
| Interventions | Intervention: Doppler US of umbilical artery revealed:
Comparison: Doppler US of umbilical artery concealed:
| |
| Outcomes | Effect on costs in terms of hospitalisation, perinatal outcome, neurological development and postnatal catchup growth, onset and mode of birth, birthweight, and GA at birth. | |
| Notes | ||
| Risk of bias | ||
| Bias | Authors' judgement | Support for judgement |
| Random sequence generation (selection bias) | Low risk |
|
| Allocation concealment (selection bias) | Low risk |
|
| Blinding of participants and personnel (performance bias) | Unclear risk | Blinding women and/or staff in these trials was not generally feasible. |
| Blinding of outcome assessment (detection bias) | Low risk | Assessors of neonatal outcomes were blind to Doppler results. |
| Incomplete outcome data (attrition bias) | Unclear risk | Describe any loss of participants to follow‐up at each data collection point:
Describe any exclusion of participants after randomisation:
Was the analysis ITT? If not, have the data been able to be reincluded?
|
| Selective reporting (reporting bias) | Unclear risk | All the outcomes were reported but we did not assess the trial protocol. |
| Other bias | High risk | If the study was stopped early, explain the reasons:
Describe any baseline imbalance:
|
| Methods | RCT; 2‐arm trial randomising individual women. | |
| Participants | Pregnant women seen at the 'Fetal Assessment Unit' over 40 weeks' gestation. | |
| Interventions | Intervention: pulsed Doppler revealed. Fetal aorta and umbilical artery assessed. BPP and NST also undertaken. Comparison: pulsed Doppler concealed. BPP and NST were reported. | |
| Outcomes | CS; gestation at birth; meconium in amniotic fluid; need for phototherapy. | |
| Notes | Conference abstract available, but no full publication. | |
| Risk of bias | ||
| Bias | Authors' judgement | Support for judgement |
| Random sequence generation (selection bias) | Unclear risk | No information available. |
| Allocation concealment (selection bias) | Unclear risk | No information available. |
| Blinding of participants and personnel (performance bias) | Unclear risk | Blinding women and/or staff in these trials was not generally feasible. |
| Blinding of outcome assessment (detection bias) | Unclear risk | Blinding women and/or staff in these trials was not generally feasible. |
| Incomplete outcome data (attrition bias) | Unclear risk | No information available. |
| Selective reporting (reporting bias) | Unclear risk | Very limited data in the conference abstract. We did not assess the trial protocol. |
| Other bias | Unclear risk | No information available on which to judge this aspect. |
| Methods | RCT. Individual women randomised in 2 arms. | |
| Participants | Women with high‐risk pregnancies with recurrent pregnancy loss (2 or more mid trimester or early third trimester losses which resulted in IUFD, stillbirth or neonatal death) at least 24 weeks' pregnant. 54 women randomised. N = 54 women. | |
| Interventions | Intervention: Doppler velocimetry of umbilical artery revealed. Comparison: Doppler velocimetry of umbilical artery concealed. | |
| Outcomes | Maternal intervention, hospital stay, induction of labour, CS, perinatal mortality and morbidity. | |
| Notes | A conference poster (incomplete data). | |
| Risk of bias | ||
| Bias | Authors' judgement | Support for judgement |
| Random sequence generation (selection bias) | Unclear risk | Women were randomly allocated. |
| Allocation concealment (selection bias) | Unclear risk | Sealed envelope, but no mention of how they were distributed nor whether they were opaque. |
| Blinding of participants and personnel (performance bias) | Unclear risk | Blinding women and/or staff in these trials was not generally feasible. |
| Blinding of outcome assessment (detection bias) | Unclear risk | Blinding women and/or staff in these trials was not generally feasible. |
| Incomplete outcome data (attrition bias) | Unclear risk | Describe any loss of participants to follow‐up at each data collection point:
Describe any exclusion of participants after randomisation:
Was the analysis ITT? If not, have the data been able to be reincluded?
|
| Selective reporting (reporting bias) | Unclear risk | No information in the poster to enable this to be assessed. Also we did not assess the trial protocol. |
| Other bias | Low risk | If the study was stopped early, explain the reasons:
Describe any baseline imbalance:
Describe any differential diagnosis:
|
| Methods | 2‐arm RCT of individual women. | |
| Participants | Women referred to the perinatal laboratory so high‐risk pregnancies (risk of UPI; fetal risk; postdates; maternal diabetes; PROM/PTL; fluid abnormalities). N = 715 women. | |
| Interventions | Intervention: fetal and umbilical Doppler + modified BPP. Comparison: no Doppler but modified BPP. | |
| Outcomes | Primary outcome: neonatal morbidity rate (admission to NICU, length of stay in NICU, significant neonatal morbidity). Secondary outcome: GA at delivery, neonatal weight, CS for fetal distress. | |
| Notes | The outcome of 'significant neonatal morbidity' assessed in this study included central nervous system complications, sepsis, acidosis/asphyxia, cardiomyopathy, anaemia, metabolic outcomes but excluded RDS. Anaemia and metabolic outcomes were not defined. We considered this outcome to be sufficiently different from the review's primary outcome of 'serious neonatal morbidity (composite outcome including hypoxic ischaemic encephalopathy, IVH, BPD, NEC)' that we did not include these data in the meta‐analysis. This study found no significant difference in 'significant neonatal complications' between the Doppler group (8%) and the no Doppler group (6.6%). | |
| Risk of bias | ||
| Bias | Authors' judgement | Support for judgement |
| Random sequence generation (selection bias) | Low risk | “Computer‐generated random number allocation system.” |
| Allocation concealment (selection bias) | Unclear risk | No information provided. |
| Blinding of participants and personnel (performance bias) | Unclear risk | Blinding women and/or staff in these trials was not generally feasible. |
| Blinding of outcome assessment (detection bias) | Unclear risk | Blinding women and/or staff in these trials was not generally feasible. |
| Incomplete outcome data (attrition bias) | Unclear risk | Describe any loss of participants to follow‐up at each data collection point:
Describe any exclusion of participants after randomisation:
Was the analysis ITT? If not, have the data been able to be reincluded?
|
| Selective reporting (reporting bias) | Unclear risk | Although the prespecified outcomes in the paper were reported. we were not able to assess the protocol, so are not sure whether there was outcome reporting bias. The authors reported only on CS for fetal distress, and not on all CS. |
| Other bias | Low risk | If the study was stopped early, explain the reasons:
Describe any baseline imbalance:
Describe any differential diagnosis:
|
| Methods | RCT; block randomisation of individual women:
| |
| Participants | Women > 28 weeks' pregnant with hypertension and/or suspected SGA fetuses were referred for Doppler US. 212 women with singleton pregnancies. N = 212 women. | |
| Interventions | Intervention: Doppler velocimetry of umbilical artery revealed:
Comparison: Doppler velocimetry of umbilical artery concealed:
| |
| Outcomes | Perinatal mortality and morbidity, antenatal hospitalisation, maternal intervention, admission to the NICU, and hospitalisation until discharge from the neonatal wards. | |
| Notes | ||
| Risk of bias | ||
| Bias | Authors' judgement | Support for judgement |
| Random sequence generation (selection bias) | Unclear risk | “...randomisation was performed by the person doing the Doppler velocity .......” |
| Allocation concealment (selection bias) | Unclear risk | “......opaque sealed envelopes......”, but no mention of numbered and sequentially ordered envelopes. |
| Blinding of participants and personnel (performance bias) | Unclear risk | Blinding women and/or staff in these trials was not generally feasible. |
| Blinding of outcome assessment (detection bias) | Unclear risk | Blinding women and/or staff in these trials was not generally feasible. |
| Incomplete outcome data (attrition bias) | Low risk | Describe any loss of participants to follow‐up at each data collection point:
Describe any exclusion of participants after randomisation:
Was the analysis ITT? If not, have the data been able to be reincluded?
|
| Selective reporting (reporting bias) | Unclear risk | All the outcomes were reported but we did not assess the trial protocol. |
| Other bias | High risk | If the study was stopped early, explain the reasons:
Describe any differential diagnosis:
|
| Methods | 2‐arm RCT of Individual women. | |
| Participants | Women with high fetal risk (singletons). More than 28 weeks' gestation. N = 300 women. | |
| Interventions | Intervention: Doppler of umbilical artery revealed:
Comparison: Doppler of umbilical artery concealed:
| |
| Outcomes | Perinatal mortality, CS, induction of labour, etc. | |
| Notes | ||
| Risk of bias | ||
| Bias | Authors' judgement | Support for judgement |
| Random sequence generation (selection bias) | Unclear risk | Random number though no information on how they were generated and by whom. |
| Allocation concealment (selection bias) | Unclear risk | “Each patient was asked to draw an envelope containing a random number and those with even numbers were allocated to the Doppler report available group”. |
| Blinding of participants and personnel (performance bias) | Unclear risk | Blinding women and/or staff in these trials was not generally feasible. |
| Blinding of outcome assessment (detection bias) | Unclear risk | Blinding women and/or staff in these trials was not generally feasible. |
| Incomplete outcome data (attrition bias) | Low risk | Describe any loss of participants to follow‐up at each data collection point:
Was the analysis ITT? If not, have the data been able to be reincluded?
|
| Selective reporting (reporting bias) | Unclear risk | No outcome listed in methods section and we did not assess the trial protocol. |
| Other bias | Low risk | If the study was stopped early, explain the reasons:
Describe any baseline imbalance:
Describe any differential diagnosis:
|
| Methods | RCT; pragmatic 2‐arm trial. | |
| Participants | Women with high‐risk singleton pregnancies. Specifically, 500 pregnant women at high risk of growth retardation or stillbirth. IUGR clinically suspected or by US scan, previous SGA baby, previous antepartum haemorrhage, hypertension. Exclusions: women with diabetes, twin pregnancies. N = 500 women. | |
| Interventions | Intervention: routine use of Doppler and BPP testing + other tests:
Comparison: no Doppler and no biophysical assessment but other tests only:
| |
| Outcomes | Total number of days of antenatal admission, rate of induction of labour (by any method), mode of birth (elective CS and emergency CS), 1 and 5 min Apgar, birthweight, admission to NICU. | |
| Notes | ||
| Risk of bias | ||
| Bias | Authors' judgement | Support for judgement |
| Random sequence generation (selection bias) | Unclear risk |
|
| Allocation concealment (selection bias) | Unclear risk |
|
| Blinding of participants and personnel (performance bias) | Unclear risk | Blinding women and/or staff in these trials was not generally feasible. |
| Blinding of outcome assessment (detection bias) | Unclear risk | Blinding women and/or staff in these trials was not generally feasible. |
| Incomplete outcome data (attrition bias) | Unclear risk | Describe any loss of participants to follow‐up at each data collection point:
Describe any exclusion of participants after randomisation:
Was the analysis ITT? If not, have the data been able to be reincluded?
|
| Selective reporting (reporting bias) | Unclear risk | Not all outcomes were reported, emergency CS just reported in the text. We did not assess the trial protocol. |
| Other bias | Unclear risk | If the study was stopped early, explain the reasons:
Describe any baseline imbalance:
Describe any differential diagnosis:
|
| Methods | Randomised controlled study; block randomisation (block of 4 and 6). Individual women. | |
| Participants | Women with high‐risk pregnancies: singletons (IUGR 7%, hypertension 10%, diabetes 11%, prolonged pregnancy 43%, decreased fetal movements 22%). GA > 32 weeks. N = 1360 women. | |
| Interventions | Intervention: umbilical artery Doppler:
Comparison: electronic FHR with NST:
| |
| Outcomes | Primary outcome: incidence of CS for fetal distress in labour (nonreassuring FHR). Secondary outcome: total CS, Apgar score 1 and 5 min, the incidence of stillbirth, the presence of meconium, and the incidence of transfer to the NICU with severe neonatal morbidity. | |
| Notes | ||
| Risk of bias | ||
| Bias | Authors' judgement | Support for judgement |
| Random sequence generation (selection bias) | Low risk | Random number table with a variable block size of 4 and 6. |
| Allocation concealment (selection bias) | Unclear risk | Sequentially numbered opaque envelopes although no information as to whether they were sealed. “...envelopes were kept in a locked drawer that was accessible only to the unit clerk. The envelops was opened by the nurse/sonographer in the presence of the patient”. |
| Blinding of participants and personnel (performance bias) | Unclear risk | Blinding women and/or staff in these trials was not generally feasible. |
| Blinding of outcome assessment (detection bias) | Unclear risk | Blinding women and/or staff in these trials was not generally feasible. |
| Incomplete outcome data (attrition bias) | Unclear risk | Describe any loss of participants to follow‐up at each data collection point:
Describe any exclusion of participants after randomisation:
Was the analysis ITT?
|
| Selective reporting (reporting bias) | Unclear risk | All the outcomes were reported but we did not assess the trial protocol. |
| Other bias | Low risk | If the study was stopped early, explain the reasons:
Describe any baseline imbalance:
Describe any differential diagnosis:
|
AEDF: absent end diastolic flow
AEDV: absent end diastolic velocity
AN: antenatal
BPD: bronchopulmonary dysplasia
BPP: biophysical profile
CS: caesarean section
CTG: cardiotocography
D:
EDV: end diastolic velocities
FHR: fetal heart rate
GA: gestational age
HT:
ITT: intention‐to‐treat
IUFD: intrauterine fetal death
IUGR: intrauterine growth retardation
IVH: intraventricular haemorrhage
min: minute
NEC: necrotising enterocolitis
NICU: neonatal intensive care unit
NS: not significant
NST: nonstress test
PNM:
PTL: preterm labour
PROM: preterm rupture of membranes
RCT: randomised controlled trial
RDS: respiratory distress syndrome
S:
SAT:
SD: standard deviation
SGA: small‐for‐gestational age
STV:
UPI:
US: ultrasound
vs: versus
Characteristics of excluded studies [ordered by study ID]
Jump to:
| Study | Reason for exclusion |
| Participants were an "unselected population". | |
| Full report not available. | |
| Participants were "low‐risk primigravid women". | |
| Conference abstract only but outcomes were comparing women with normal and abnormal Doppler ultrasound readings, so not a randomised comparison. | |
| This study was never reported in full although it has been partly reported in a review article (McParland 1988) and a full manuscript was given to the review authors by Dr Pearce, who has been accused of publishing reports of trials whose veracity cannot be confirmed (BJOG 1995). Consequently, the Doppler trial data are not now thought by the review authors to be sufficiently reliable to be retained within this review. | |
| Participants were an "unselected population". | |
| Participants were a "non‐selected University Hospital population". | |
| Dr Pearce has been accused of publishing reports of trials whose veracity cannot be confirmed (BJOG 1995). Consequently, the Doppler trial data are not now thought by the reviewers to be sufficiently reliable to be retained within this review. | |
| Participants were an "unselected pregnant population". | |
| Participants were an "unselected population". |
Data and analyses
| Outcome or subgroup title | No. of studies | No. of participants | Statistical method | Effect size |
| 1 Any perinatal death after randomisation Show forest plot | 16 | 10225 | Risk Ratio (M‐H, Fixed, 95% CI) | 0.71 [0.52, 0.98] |
| Analysis 1.1  Comparison 1 Umbilical artery Doppler ultrasound versus no Doppler ultrasound, Outcome 1 Any perinatal death after randomisation. | ||||
| 1.1 Singleton pregnancy | 9 | 4661 | Risk Ratio (M‐H, Fixed, 95% CI) | 0.59 [0.35, 1.01] |
| 1.2 Multiple pregnancy | 1 | 1052 | Risk Ratio (M‐H, Fixed, 95% CI) | 0.88 [0.32, 2.41] |
| 1.3 Singleton plus multiple pregnancies, or not stated | 6 | 4512 | Risk Ratio (M‐H, Fixed, 95% CI) | 0.78 [0.51, 1.19] |
| 2 Serious neonatal morbidity Show forest plot | 3 | Risk Ratio (M‐H, Random, 95% CI) | Subtotals only | |
| Analysis 1.2  Comparison 1 Umbilical artery Doppler ultrasound versus no Doppler ultrasound, Outcome 2 Serious neonatal morbidity. | ||||
| 2.1 Singleton pregnancy | 1 | 500 | Risk Ratio (M‐H, Random, 95% CI) | 0.13 [0.02, 0.99] |
| 2.2 Multiple pregnancy | 0 | 0 | Risk Ratio (M‐H, Random, 95% CI) | 0.0 [0.0, 0.0] |
| 2.3 Singleton plus multiple pregnancies, or not stated | 2 | 598 | Risk Ratio (M‐H, Random, 95% CI) | 2.95 [0.31, 28.14] |
| 3 Stillbirth Show forest plot | 15 | 9560 | Risk Ratio (M‐H, Fixed, 95% CI) | 0.65 [0.41, 1.04] |
| Analysis 1.3  Comparison 1 Umbilical artery Doppler ultrasound versus no Doppler ultrasound, Outcome 3 Stillbirth. | ||||
| 3.1 Singleton pregnancy | 8 | 3996 | Risk Ratio (M‐H, Fixed, 95% CI) | 0.61 [0.31, 1.19] |
| 3.2 Multiple pregnancy | 1 | 1052 | Risk Ratio (M‐H, Fixed, 95% CI) | 0.67 [0.11, 4.00] |
| 3.3 Singleton plus multiple pregnancy, or not stated | 6 | 4512 | Risk Ratio (M‐H, Fixed, 95% CI) | 0.70 [0.35, 1.39] |
| 4 Neonatal death Show forest plot | 13 | 8167 | Risk Ratio (M‐H, Fixed, 95% CI) | 0.81 [0.53, 1.24] |
| Analysis 1.4  Comparison 1 Umbilical artery Doppler ultrasound versus no Doppler ultrasound, Outcome 4 Neonatal death. | ||||
| 4.1 Singleton pregnancy | 7 | 2656 | Risk Ratio (M‐H, Fixed, 95% CI) | 0.69 [0.31, 1.53] |
| 4.2 Multiple pregnancy | 1 | 1052 | Risk Ratio (M‐H, Fixed, 95% CI) | 1.01 [0.29, 3.46] |
| 4.3 Singleton plus multiple pregnancies, or not stated | 5 | 4459 | Risk Ratio (M‐H, Fixed, 95% CI) | 0.84 [0.48, 1.45] |
| 5 Any potentially preventable perinatal death* Show forest plot | 16 | 10225 | Risk Ratio (M‐H, Fixed, 95% CI) | 0.67 [0.46, 0.98] |
| Analysis 1.5  Comparison 1 Umbilical artery Doppler ultrasound versus no Doppler ultrasound, Outcome 5 Any potentially preventable perinatal death*. | ||||
| 5.1 Singleton pregnancy | 9 | 4661 | Risk Ratio (M‐H, Fixed, 95% CI) | 0.58 [0.30, 1.13] |
| 5.2 Multiple pregnancy | 1 | 1052 | Risk Ratio (M‐H, Fixed, 95% CI) | 0.88 [0.32, 2.41] |
| 5.3 Singleton plus multiple pregnancies or not stated | 6 | 4512 | Risk Ratio (M‐H, Fixed, 95% CI) | 0.69 [0.41, 1.15] |
| 6 Apgar < 7 at 5 minutes Show forest plot | 7 | 6321 | Risk Ratio (M‐H, Fixed, 95% CI) | 0.92 [0.69, 1.24] |
| Analysis 1.6  Comparison 1 Umbilical artery Doppler ultrasound versus no Doppler ultrasound, Outcome 6 Apgar < 7 at 5 minutes. | ||||
| 6.1 Singleton pregnancy | 4 | 2555 | Risk Ratio (M‐H, Fixed, 95% CI) | 0.70 [0.45, 1.09] |
| 6.2 Multiple pregnancy | 0 | 0 | Risk Ratio (M‐H, Fixed, 95% CI) | 0.0 [0.0, 0.0] |
| 6.3 Singleton plus multiple pregnancies or not stated | 3 | 3766 | Risk Ratio (M‐H, Fixed, 95% CI) | 1.16 [0.77, 1.73] |
| 7 Caesarean section (elective and emergency) Show forest plot | 14 | 7918 | Risk Ratio (M‐H, Fixed, 95% CI) | 0.90 [0.84, 0.97] |
| Analysis 1.7  Comparison 1 Umbilical artery Doppler ultrasound versus no Doppler ultrasound, Outcome 7 Caesarean section (elective and emergency). | ||||
| 7.1 Singleton pregnancy | 7 | 2929 | Risk Ratio (M‐H, Fixed, 95% CI) | 0.84 [0.75, 0.95] |
| 7.2 Multiple pregnancy | 1 | 526 | Risk Ratio (M‐H, Fixed, 95% CI) | 0.96 [0.77, 1.19] |
| 7.3 Singleton plus multiple pregnancies or not stated | 6 | 4463 | Risk Ratio (M‐H, Fixed, 95% CI) | 0.94 [0.84, 1.05] |
| 8 Caesarean section ‐ elective Show forest plot | 11 | 6627 | Risk Ratio (M‐H, Fixed, 95% CI) | 1.07 [0.93, 1.22] |
| Analysis 1.8  Comparison 1 Umbilical artery Doppler ultrasound versus no Doppler ultrasound, Outcome 8 Caesarean section ‐ elective. | ||||
| 8.1 Singleton pregnancy | 6 | 1934 | Risk Ratio (M‐H, Fixed, 95% CI) | 1.11 [0.90, 1.38] |
| 8.2 Multiple pregnancy | 1 | 526 | Risk Ratio (M‐H, Fixed, 95% CI) | 1.06 [0.77, 1.47] |
| 8.3 Singleton plus multiple pregnancies or not stated | 4 | 4167 | Risk Ratio (M‐H, Fixed, 95% CI) | 1.03 [0.84, 1.26] |
| 9 Caesarean section ‐ emergency Show forest plot | 10 | 6175 | Risk Ratio (M‐H, Random, 95% CI) | 0.81 [0.67, 0.98] |
| Analysis 1.9 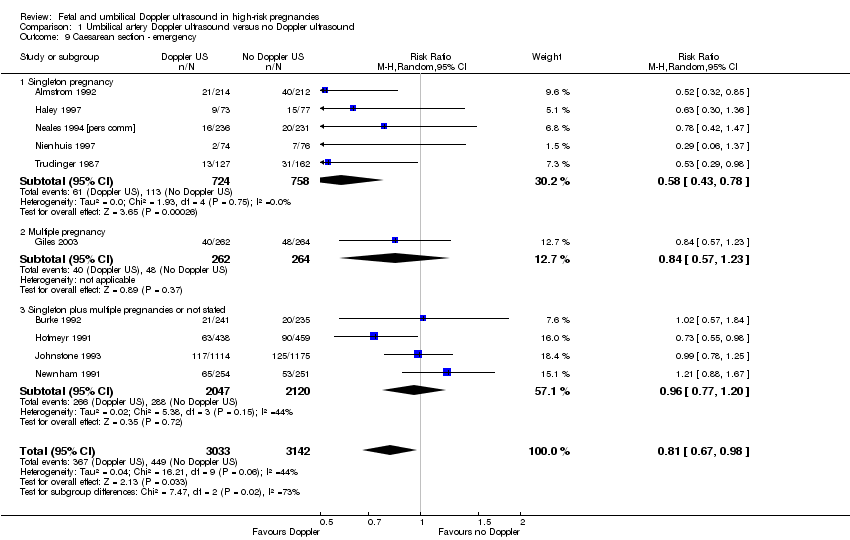 Comparison 1 Umbilical artery Doppler ultrasound versus no Doppler ultrasound, Outcome 9 Caesarean section ‐ emergency. | ||||
| 9.1 Singleton pregnancy | 5 | 1482 | Risk Ratio (M‐H, Random, 95% CI) | 0.58 [0.43, 0.78] |
| 9.2 Multiple pregnancy | 1 | 526 | Risk Ratio (M‐H, Random, 95% CI) | 0.84 [0.57, 1.23] |
| 9.3 Singleton plus multiple pregnancies or not stated | 4 | 4167 | Risk Ratio (M‐H, Random, 95% CI) | 0.96 [0.77, 1.20] |
| 10 Spontaneous vaginal birth Show forest plot | 5 | 2504 | Risk Ratio (M‐H, Fixed, 95% CI) | 1.04 [0.98, 1.10] |
| Analysis 1.10  Comparison 1 Umbilical artery Doppler ultrasound versus no Doppler ultrasound, Outcome 10 Spontaneous vaginal birth. | ||||
| 10.1 Singleton pregnancy | 2 | 576 | Risk Ratio (M‐H, Fixed, 95% CI) | 1.07 [0.96, 1.18] |
| 10.2 Multiple pregnancy | 1 | 526 | Risk Ratio (M‐H, Fixed, 95% CI) | 1.03 [0.90, 1.19] |
| 10.3 Singleton plus multiple pregnancies or not stated | 2 | 1402 | Risk Ratio (M‐H, Fixed, 95% CI) | 1.03 [0.95, 1.12] |
| 11 Operative vaginal birth Show forest plot | 4 | 2813 | Risk Ratio (M‐H, Fixed, 95% CI) | 0.95 [0.80, 1.14] |
| Analysis 1.11  Comparison 1 Umbilical artery Doppler ultrasound versus no Doppler ultrasound, Outcome 11 Operative vaginal birth. | ||||
| 11.1 Singleton pregnancy | 3 | 1916 | Risk Ratio (M‐H, Fixed, 95% CI) | 0.97 [0.78, 1.22] |
| 11.2 Multiple pregnancy | 0 | 0 | Risk Ratio (M‐H, Fixed, 95% CI) | 0.0 [0.0, 0.0] |
| 11.3 Singleton plus multiple pregnancies or not stated | 1 | 897 | Risk Ratio (M‐H, Fixed, 95% CI) | 0.92 [0.68, 1.25] |
| 12 Induction of labour Show forest plot | 10 | 5633 | Risk Ratio (M‐H, Random, 95% CI) | 0.89 [0.80, 0.99] |
| Analysis 1.12  Comparison 1 Umbilical artery Doppler ultrasound versus no Doppler ultrasound, Outcome 12 Induction of labour. | ||||
| 12.1 Singleton pregnancy | 5 | 1784 | Risk Ratio (M‐H, Random, 95% CI) | 0.79 [0.64, 0.97] |
| 12.2 Multiple pregnancy | 1 | 526 | Risk Ratio (M‐H, Random, 95% CI) | 1.10 [0.80, 1.50] |
| 12.3 Singleton plus multiple pregnancies or not stated | 4 | 3323 | Risk Ratio (M‐H, Random, 95% CI) | 0.95 [0.86, 1.04] |
| 13 Infant requiring intubation/ventilation Show forest plot | 6 | 3136 | Risk Ratio (M‐H, Random, 95% CI) | 1.42 [0.87, 2.30] |
| Analysis 1.13  Comparison 1 Umbilical artery Doppler ultrasound versus no Doppler ultrasound, Outcome 13 Infant requiring intubation/ventilation. | ||||
| 13.1 Singleton pregnancy | 4 | 1539 | Risk Ratio (M‐H, Random, 95% CI) | 2.89 [1.40, 5.96] |
| 13.2 Multiple pregnancy | 1 | 1052 | Risk Ratio (M‐H, Random, 95% CI) | 0.86 [0.59, 1.25] |
| 13.3 Singleton plus multiple pregnancies or not stated | 1 | 545 | Risk Ratio (M‐H, Random, 95% CI) | 1.25 [0.79, 1.98] |
| 14 Neonatal fitting/seizures Show forest plot | 1 | 150 | Risk Ratio (M‐H, Fixed, 95% CI) | 0.35 [0.01, 8.49] |
| Analysis 1.14  Comparison 1 Umbilical artery Doppler ultrasound versus no Doppler ultrasound, Outcome 14 Neonatal fitting/seizures. | ||||
| 14.1 Singleton pregnancy | 1 | 150 | Risk Ratio (M‐H, Fixed, 95% CI) | 0.35 [0.01, 8.49] |
| 14.2 Multiple pregnancy | 0 | 0 | Risk Ratio (M‐H, Fixed, 95% CI) | 0.0 [0.0, 0.0] |
| 14.3 Singleton plus multiple pregnancies or not stated | 0 | 0 | Risk Ratio (M‐H, Fixed, 95% CI) | 0.0 [0.0, 0.0] |
| 15 Preterm labour Show forest plot | 2 | 626 | Risk Ratio (M‐H, Fixed, 95% CI) | 1.12 [0.72, 1.75] |
| Analysis 1.15  Comparison 1 Umbilical artery Doppler ultrasound versus no Doppler ultrasound, Outcome 15 Preterm labour. | ||||
| 15.1 Singleton pregnancy | 1 | 150 | Risk Ratio (M‐H, Fixed, 95% CI) | 1.03 [0.51, 2.07] |
| 15.2 Multiple pregnancy | 0 | 0 | Risk Ratio (M‐H, Fixed, 95% CI) | 0.0 [0.0, 0.0] |
| 15.3 Singleton plus multiple pregnancy or not stated | 1 | 476 | Risk Ratio (M‐H, Fixed, 95% CI) | 1.18 [0.66, 2.11] |
| 16 Gestational age at birth (weeks) Show forest plot | 8 | 4066 | Mean Difference (IV, Random, 95% CI) | 0.21 [‐0.02, 0.43] |
| Analysis 1.16  Comparison 1 Umbilical artery Doppler ultrasound versus no Doppler ultrasound, Outcome 16 Gestational age at birth (weeks). | ||||
| 16.1 Singleton pregnancy | 3 | 1043 | Mean Difference (IV, Random, 95% CI) | 0.54 [‐0.00, 1.09] |
| 16.2 Multiple pregnancy | 1 | 1052 | Mean Difference (IV, Random, 95% CI) | 0.10 [‐0.24, 0.44] |
| 16.3 Singleton plus multiple pregnancies or not stated | 4 | 1971 | Mean Difference (IV, Random, 95% CI) | 0.06 [‐0.19, 0.31] |
| 17 Infant respiratory distress syndrome (RDS) Show forest plot | 1 | 107 | Risk Ratio (M‐H, Fixed, 95% CI) | 1.06 [0.07, 16.48] |
| Analysis 1.17  Comparison 1 Umbilical artery Doppler ultrasound versus no Doppler ultrasound, Outcome 17 Infant respiratory distress syndrome (RDS). | ||||
| 17.1 Singleton pregnancy | 1 | 107 | Risk Ratio (M‐H, Fixed, 95% CI) | 1.06 [0.07, 16.48] |
| 17.2 Multiple pregnancy | 0 | 0 | Risk Ratio (M‐H, Fixed, 95% CI) | 0.0 [0.0, 0.0] |
| 17.3 Singleton plus multiple pregnancies or not stated | 0 | 0 | Risk Ratio (M‐H, Fixed, 95% CI) | 0.0 [0.0, 0.0] |
| 18 Neonatal admission to SCBU and/or NICU Show forest plot | 12 | 9334 | Risk Ratio (M‐H, Fixed, 95% CI) | 0.95 [0.89, 1.03] |
| Analysis 1.18  Comparison 1 Umbilical artery Doppler ultrasound versus no Doppler ultrasound, Outcome 18 Neonatal admission to SCBU and/or NICU. | ||||
| 18.1 Singleton pregnancy | 8 | 4511 | Risk Ratio (M‐H, Fixed, 95% CI) | 0.92 [0.80, 1.06] |
| 18.2 Multiple pregnancy | 1 | 1052 | Risk Ratio (M‐H, Fixed, 95% CI) | 0.96 [0.88, 1.05] |
| 18.3 Singleton plus multiple pregnancies or not stated | 3 | 3771 | Risk Ratio (M‐H, Fixed, 95% CI) | 0.98 [0.85, 1.14] |
| 19 Hypoxic ischaemic encephalopathy Show forest plot | 2 | 1045 | Risk Ratio (M‐H, Random, 95% CI) | 0.65 [0.01, 33.07] |
| Analysis 1.19  Comparison 1 Umbilical artery Doppler ultrasound versus no Doppler ultrasound, Outcome 19 Hypoxic ischaemic encephalopathy. | ||||
| 19.1 Singleton pregnancy | 1 | 500 | Risk Ratio (M‐H, Random, 95% CI) | 0.09 [0.01, 1.64] |
| 19.2 Multiple pregnancy | 0 | 0 | Risk Ratio (M‐H, Random, 95% CI) | 0.0 [0.0, 0.0] |
| 19.3 Singleton plus multiple pregnancies or not stated | 1 | 545 | Risk Ratio (M‐H, Random, 95% CI) | 4.91 [0.24, 101.79] |
| 20 Intraventricular haemorrhage Show forest plot | 4 | 2008 | Risk Ratio (M‐H, Fixed, 95% CI) | 1.42 [0.47, 4.30] |
| Analysis 1.20  Comparison 1 Umbilical artery Doppler ultrasound versus no Doppler ultrasound, Outcome 20 Intraventricular haemorrhage. | ||||
| 20.1 Singleton pregnancy | 3 | 1463 | Risk Ratio (M‐H, Fixed, 95% CI) | 1.26 [0.38, 4.16] |
| 20.2 Multiple pregnancy | 0 | 0 | Risk Ratio (M‐H, Fixed, 95% CI) | 0.0 [0.0, 0.0] |
| 20.3 Singleton plus multiple pregnancies or not stated | 1 | 545 | Risk Ratio (M‐H, Fixed, 95% CI) | 2.95 [0.12, 71.99] |
| 21 Birthweight (grams) Show forest plot | 7 | 3887 | Mean Difference (IV, Fixed, 95% CI) | 31.33 [‐8.70, 71.37] |
| Analysis 1.21  Comparison 1 Umbilical artery Doppler ultrasound versus no Doppler ultrasound, Outcome 21 Birthweight (grams). | ||||
| 21.1 Singleton pregnancy | 3 | 1916 | Mean Difference (IV, Fixed, 95% CI) | 49.34 [‐0.62, 99.31] |
| 21.2 Multiple pregnancy | 0 | 0 | Mean Difference (IV, Fixed, 95% CI) | 0.0 [0.0, 0.0] |
| 21.3 Singleton plus multiple pregnancies or not stated | 4 | 1971 | Mean Difference (IV, Fixed, 95% CI) | ‐0.95 [‐67.84, 65.95] |
| 22 Length of infant hospital stay (days) Show forest plot | 3 | 1076 | Std. Mean Difference (IV, Fixed, 95% CI) | ‐0.28 [‐0.40, ‐0.16] |
| Analysis 1.22 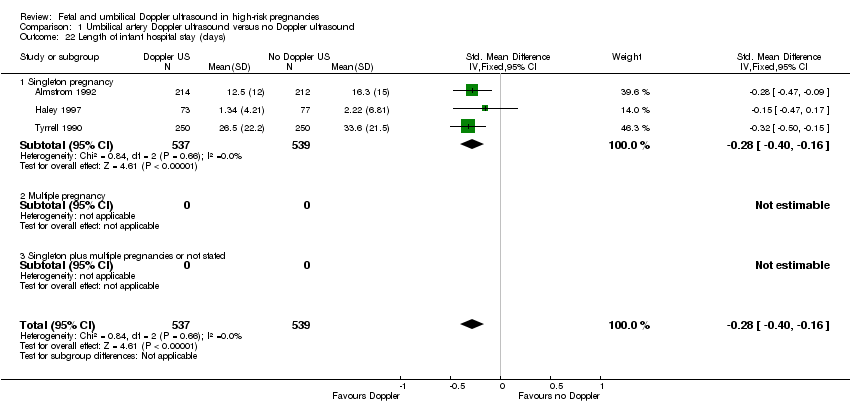 Comparison 1 Umbilical artery Doppler ultrasound versus no Doppler ultrasound, Outcome 22 Length of infant hospital stay (days). | ||||
| 22.1 Singleton pregnancy | 3 | 1076 | Std. Mean Difference (IV, Fixed, 95% CI) | ‐0.28 [‐0.40, ‐0.16] |
| 22.2 Multiple pregnancy | 0 | 0 | Std. Mean Difference (IV, Fixed, 95% CI) | 0.0 [0.0, 0.0] |
| 22.3 Singleton plus multiple pregnancies or not stated | 0 | 0 | Std. Mean Difference (IV, Fixed, 95% CI) | 0.0 [0.0, 0.0] |
| 23 Birth < 34 weeks (not prespecified) Show forest plot | 2 | 976 | Risk Ratio (M‐H, Random, 95% CI) | 2.04 [0.62, 6.69] |
| Analysis 1.23 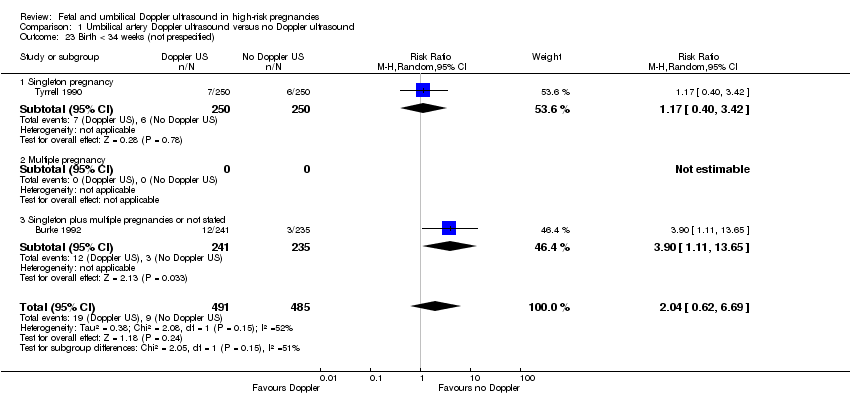 Comparison 1 Umbilical artery Doppler ultrasound versus no Doppler ultrasound, Outcome 23 Birth < 34 weeks (not prespecified). | ||||
| 23.1 Singleton pregnancy | 1 | 500 | Risk Ratio (M‐H, Random, 95% CI) | 1.17 [0.40, 3.42] |
| 23.2 Multiple pregnancy | 0 | 0 | Risk Ratio (M‐H, Random, 95% CI) | 0.0 [0.0, 0.0] |
| 23.3 Singleton plus multiple pregnancies or not stated | 1 | 476 | Risk Ratio (M‐H, Random, 95% CI) | 3.90 [1.11, 13.65] |
| 24 Antenatal admissions (not prespecified) Show forest plot | 2 | 893 | Risk Ratio (M‐H, Fixed, 95% CI) | 0.72 [0.60, 0.88] |
| Analysis 1.24  Comparison 1 Umbilical artery Doppler ultrasound versus no Doppler ultrasound, Outcome 24 Antenatal admissions (not prespecified). | ||||
| 24.1 Singleton pregnancy | 2 | 893 | Risk Ratio (M‐H, Fixed, 95% CI) | 0.72 [0.60, 0.88] |
| 24.2 Multiple pregnancy | 0 | 0 | Risk Ratio (M‐H, Fixed, 95% CI) | 0.0 [0.0, 0.0] |
| 24.3 Singleton plus multiple pregnancies or not stated | 0 | 0 | Risk Ratio (M‐H, Fixed, 95% CI) | 0.0 [0.0, 0.0] |
| 25 Phototherapy for neonatal jaundice (not prespecified) Show forest plot | 1 | 150 | Risk Ratio (M‐H, Fixed, 95% CI) | 0.15 [0.01, 2.87] |
| Analysis 1.25  Comparison 1 Umbilical artery Doppler ultrasound versus no Doppler ultrasound, Outcome 25 Phototherapy for neonatal jaundice (not prespecified). | ||||
| 25.1 Singleton pregnancy | 1 | 150 | Risk Ratio (M‐H, Fixed, 95% CI) | 0.15 [0.01, 2.87] |
| 25.2 Multiple pregnancy | 0 | 0 | Risk Ratio (M‐H, Fixed, 95% CI) | 0.0 [0.0, 0.0] |
| 25.3 Singleton plus multiple pregnancies or not stated | 0 | 0 | Risk Ratio (M‐H, Fixed, 95% CI) | 0.0 [0.0, 0.0] |
| 26 Abnormal neurological development at 9 months (not prespecified) Show forest plot | 1 | 137 | Risk Ratio (M‐H, Fixed, 95% CI) | 0.61 [0.26, 1.45] |
| Analysis 1.26  Comparison 1 Umbilical artery Doppler ultrasound versus no Doppler ultrasound, Outcome 26 Abnormal neurological development at 9 months (not prespecified). | ||||
| 26.1 Singleton pregnancy | 1 | 137 | Risk Ratio (M‐H, Fixed, 95% CI) | 0.61 [0.26, 1.45] |
| 26.2 Multiple pregnancy | 0 | 0 | Risk Ratio (M‐H, Fixed, 95% CI) | 0.0 [0.0, 0.0] |
| 26.3 Singleton plus multiple pregnancies or not stated | 0 | 0 | Risk Ratio (M‐H, Fixed, 95% CI) | 0.0 [0.0, 0.0] |
| 27 Hospitalisation for IUGR neonatal (not prespecified) Show forest plot | 1 | 142 | Risk Ratio (M‐H, Fixed, 95% CI) | 1.03 [0.75, 1.41] |
| Analysis 1.27  Comparison 1 Umbilical artery Doppler ultrasound versus no Doppler ultrasound, Outcome 27 Hospitalisation for IUGR neonatal (not prespecified). | ||||
| 27.1 Singleton pregnancy | 1 | 142 | Risk Ratio (M‐H, Fixed, 95% CI) | 1.03 [0.75, 1.41] |
| 27.2 Multiple pregnancy | 0 | 0 | Risk Ratio (M‐H, Fixed, 95% CI) | 0.0 [0.0, 0.0] |
| 27.3 Singleton plus multiple pregnancies or not stated | 0 | 0 | Risk Ratio (M‐H, Fixed, 95% CI) | 0.0 [0.0, 0.0] |
| 28 Fetal distress in labour (not prespecified) Show forest plot | 1 | 289 | Risk Ratio (M‐H, Fixed, 95% CI) | 0.35 [0.10, 1.22] |
| Analysis 1.28  Comparison 1 Umbilical artery Doppler ultrasound versus no Doppler ultrasound, Outcome 28 Fetal distress in labour (not prespecified). | ||||
| 28.1 Singleton pregnancy | 1 | 289 | Risk Ratio (M‐H, Fixed, 95% CI) | 0.35 [0.10, 1.22] |
| 28.2 Multiple pregnancy | 0 | 0 | Risk Ratio (M‐H, Fixed, 95% CI) | 0.0 [0.0, 0.0] |
| 28.3 Singleton plus multiple pregnancies or not stated | 0 | 0 | Risk Ratio (M‐H, Fixed, 95% CI) | 0.0 [0.0, 0.0] |
| 29 Birthweight < 5 percentile (not prespecified) Show forest plot | 1 | 289 | Risk Ratio (M‐H, Fixed, 95% CI) | 1.16 [0.51, 2.64] |
| Analysis 1.29  Comparison 1 Umbilical artery Doppler ultrasound versus no Doppler ultrasound, Outcome 29 Birthweight < 5 percentile (not prespecified). | ||||
| 29.1 Singleton pregnancy | 1 | 289 | Risk Ratio (M‐H, Fixed, 95% CI) | 1.16 [0.51, 2.64] |
| 29.2 Multiple pregnancy | 0 | 0 | Risk Ratio (M‐H, Fixed, 95% CI) | 0.0 [0.0, 0.0] |
| 29.3 Singleton plus multiple pregnancies or not stated | 0 | 0 | Risk Ratio (M‐H, Fixed, 95% CI) | 0.0 [0.0, 0.0] |
| 30 Periventricular leucomalacia (not prespecified) Show forest plot | 1 | 545 | Risk Ratio (M‐H, Fixed, 95% CI) | 0.33 [0.01, 8.00] |
| Analysis 1.30  Comparison 1 Umbilical artery Doppler ultrasound versus no Doppler ultrasound, Outcome 30 Periventricular leucomalacia (not prespecified). | ||||
| 30.1 Singleton pregnancy | 0 | 0 | Risk Ratio (M‐H, Fixed, 95% CI) | 0.0 [0.0, 0.0] |
| 30.2 Multiple pregnancy | 0 | 0 | Risk Ratio (M‐H, Fixed, 95% CI) | 0.0 [0.0, 0.0] |
| 30.3 Singleton plus multiple pregnancies or not stated | 1 | 545 | Risk Ratio (M‐H, Fixed, 95% CI) | 0.33 [0.01, 8.00] |
| 31 Antenatal hospital stay (days) (not prespecified) Show forest plot | 1 | 426 | Mean Difference (IV, Fixed, 95% CI) | ‐0.60 [‐2.39, 1.19] |
| Analysis 1.31  Comparison 1 Umbilical artery Doppler ultrasound versus no Doppler ultrasound, Outcome 31 Antenatal hospital stay (days) (not prespecified). | ||||
| 31.1 Singleton pregnancy | 1 | 426 | Mean Difference (IV, Fixed, 95% CI) | ‐0.60 [‐2.39, 1.19] |
| 31.2 Multiple pregnancy | 0 | 0 | Mean Difference (IV, Fixed, 95% CI) | 0.0 [0.0, 0.0] |
| 31.3 Singleton plus multiple pregnancies or not stated | 0 | 0 | Mean Difference (IV, Fixed, 95% CI) | 0.0 [0.0, 0.0] |
| Outcome or subgroup title | No. of studies | No. of participants | Statistical method | Effect size |
| 1 Any perinatal death after randomisation Show forest plot | 6 | Risk Ratio (M‐H, Fixed, 95% CI) | Subtotals only | |
| Analysis 2.1 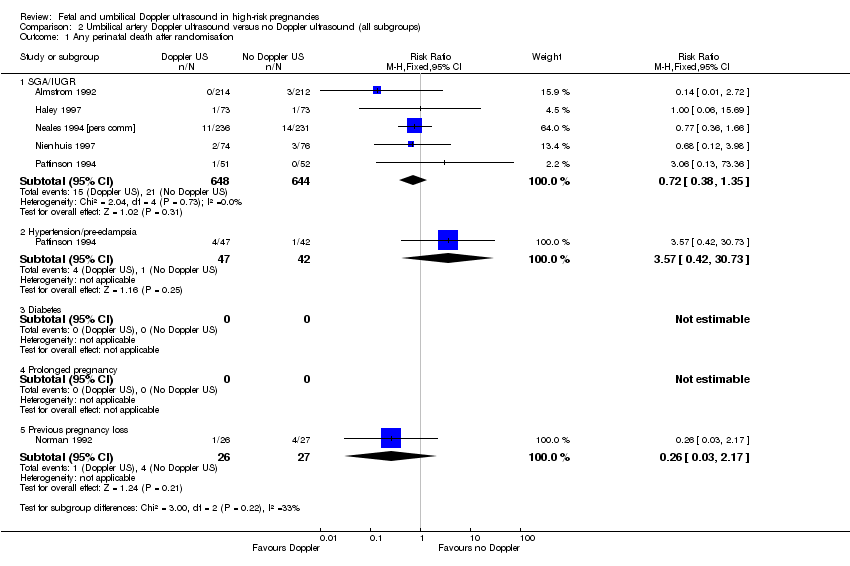 Comparison 2 Umbilical artery Doppler ultrasound versus no Doppler ultrasound (all subgroups), Outcome 1 Any perinatal death after randomisation. | ||||
| 1.1 SGA/IUGR | 5 | 1292 | Risk Ratio (M‐H, Fixed, 95% CI) | 0.72 [0.38, 1.35] |
| 1.2 Hypertension/pre‐eclampsia | 1 | 89 | Risk Ratio (M‐H, Fixed, 95% CI) | 3.57 [0.42, 30.73] |
| 1.3 Diabetes | 0 | 0 | Risk Ratio (M‐H, Fixed, 95% CI) | 0.0 [0.0, 0.0] |
| 1.4 Prolonged pregnancy | 0 | 0 | Risk Ratio (M‐H, Fixed, 95% CI) | 0.0 [0.0, 0.0] |
| 1.5 Previous pregnancy loss | 1 | 53 | Risk Ratio (M‐H, Fixed, 95% CI) | 0.26 [0.03, 2.17] |
| 2 Serious neonatal morbidity Show forest plot | 1 | 53 | Risk Ratio (M‐H, Random, 95% CI) | 0.0 [0.0, 0.0] |
| Analysis 2.2  Comparison 2 Umbilical artery Doppler ultrasound versus no Doppler ultrasound (all subgroups), Outcome 2 Serious neonatal morbidity. | ||||
| 2.1 SGA/IUGR | 0 | 0 | Risk Ratio (M‐H, Random, 95% CI) | 0.0 [0.0, 0.0] |
| 2.2 Hypertension/pre‐eclampsia | 0 | 0 | Risk Ratio (M‐H, Random, 95% CI) | 0.0 [0.0, 0.0] |
| 2.3 Diabetes | 0 | 0 | Risk Ratio (M‐H, Random, 95% CI) | 0.0 [0.0, 0.0] |
| 2.4 Prolonged pregnancy | 0 | 0 | Risk Ratio (M‐H, Random, 95% CI) | 0.0 [0.0, 0.0] |
| 2.5 Previous pregnancy loss | 1 | 53 | Risk Ratio (M‐H, Random, 95% CI) | 0.0 [0.0, 0.0] |
| Outcome or subgroup title | No. of studies | No. of participants | Statistical method | Effect size |
| 1 Any perinatal death after randomisation Show forest plot | 4 | 2813 | Risk Ratio (M‐H, Fixed, 95% CI) | 0.45 [0.17, 1.15] |
| Analysis 3.1  Comparison 3 Umbilical artery Doppler ultrasound alone versus CTG alone, Outcome 1 Any perinatal death after randomisation. | ||||
| 1.1 Singleton pregnancy | 3 | 1916 | Risk Ratio (M‐H, Fixed, 95% CI) | 0.34 [0.07, 1.68] |
| 1.2 Multiple pregnancy | 0 | 0 | Risk Ratio (M‐H, Fixed, 95% CI) | 0.0 [0.0, 0.0] |
| 1.3 Singleton plus multiple pregnancies or not stated | 1 | 897 | Risk Ratio (M‐H, Fixed, 95% CI) | 0.52 [0.16, 1.73] |
| 2 Stillbirth Show forest plot | 4 | 2813 | Risk Ratio (M‐H, Fixed, 95% CI) | 0.48 [0.14, 1.71] |
| Analysis 3.2  Comparison 3 Umbilical artery Doppler ultrasound alone versus CTG alone, Outcome 2 Stillbirth. | ||||
| 2.1 Singleton pregnancy | 3 | 1916 | Risk Ratio (M‐H, Fixed, 95% CI) | 0.28 [0.05, 1.70] |
| 2.2 Multiple pregnancy | 0 | 0 | Risk Ratio (M‐H, Fixed, 95% CI) | 0.0 [0.0, 0.0] |
| 2.3 Singleton plus multiple pregnancies or not stated | 1 | 897 | Risk Ratio (M‐H, Fixed, 95% CI) | 1.05 [0.15, 7.41] |
| 3 Neonatal death Show forest plot | 3 | 1473 | Risk Ratio (M‐H, Fixed, 95% CI) | 0.52 [0.16, 1.72] |
| Analysis 3.3 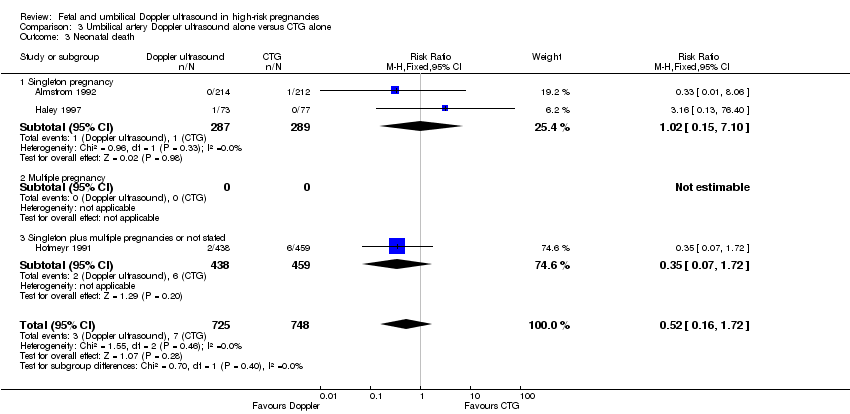 Comparison 3 Umbilical artery Doppler ultrasound alone versus CTG alone, Outcome 3 Neonatal death. | ||||
| 3.1 Singleton pregnancy | 2 | 576 | Risk Ratio (M‐H, Fixed, 95% CI) | 1.02 [0.15, 7.10] |
| 3.2 Multiple pregnancy | 0 | 0 | Risk Ratio (M‐H, Fixed, 95% CI) | 0.0 [0.0, 0.0] |
| 3.3 Singleton plus multiple pregnancies or not stated | 1 | 897 | Risk Ratio (M‐H, Fixed, 95% CI) | 0.35 [0.07, 1.72] |
| 4 Any potentially preventable perinatal death* Show forest plot | 4 | 2813 | Risk Ratio (M‐H, Fixed, 95% CI) | 0.38 [0.12, 1.18] |
| Analysis 3.4 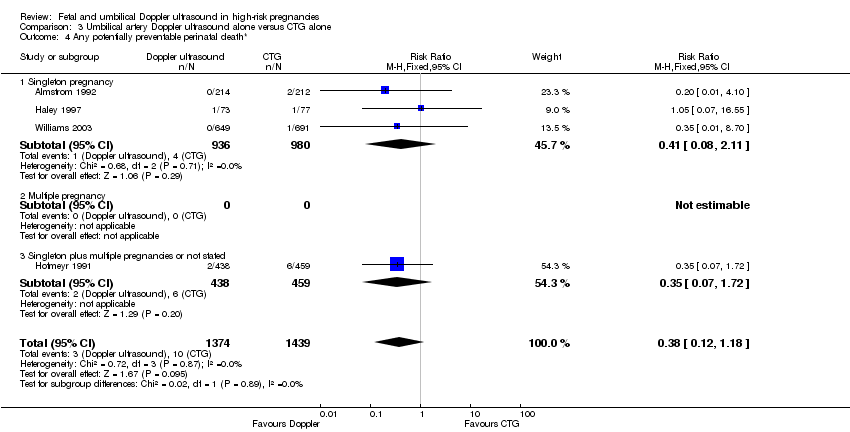 Comparison 3 Umbilical artery Doppler ultrasound alone versus CTG alone, Outcome 4 Any potentially preventable perinatal death*. | ||||
| 4.1 Singleton pregnancy | 3 | 1916 | Risk Ratio (M‐H, Fixed, 95% CI) | 0.41 [0.08, 2.11] |
| 4.2 Multiple pregnancy | 0 | 0 | Risk Ratio (M‐H, Fixed, 95% CI) | 0.0 [0.0, 0.0] |
| 4.3 Singleton plus multiple pregnancies or not stated | 1 | 897 | Risk Ratio (M‐H, Fixed, 95% CI) | 0.35 [0.07, 1.72] |
| 5 Apgar < 7 at 5 minutes Show forest plot | 3 | 2663 | Risk Ratio (M‐H, Fixed, 95% CI) | 0.86 [0.54, 1.37] |
| Analysis 3.5  Comparison 3 Umbilical artery Doppler ultrasound alone versus CTG alone, Outcome 5 Apgar < 7 at 5 minutes. | ||||
| 5.1 Singleton pregnancy | 2 | 1766 | Risk Ratio (M‐H, Fixed, 95% CI) | 0.83 [0.49, 1.43] |
| 5.2 Multiple pregnancy | 0 | 0 | Risk Ratio (M‐H, Fixed, 95% CI) | 0.0 [0.0, 0.0] |
| 5.3 Singleton plus multiple pregnancies or not stated | 1 | 897 | Risk Ratio (M‐H, Fixed, 95% CI) | 0.93 [0.36, 2.39] |
| 6 Caesarean section (elective and emergency) Show forest plot | 4 | 2813 | Risk Ratio (M‐H, Fixed, 95% CI) | 0.89 [0.79, 1.01] |
| Analysis 3.6 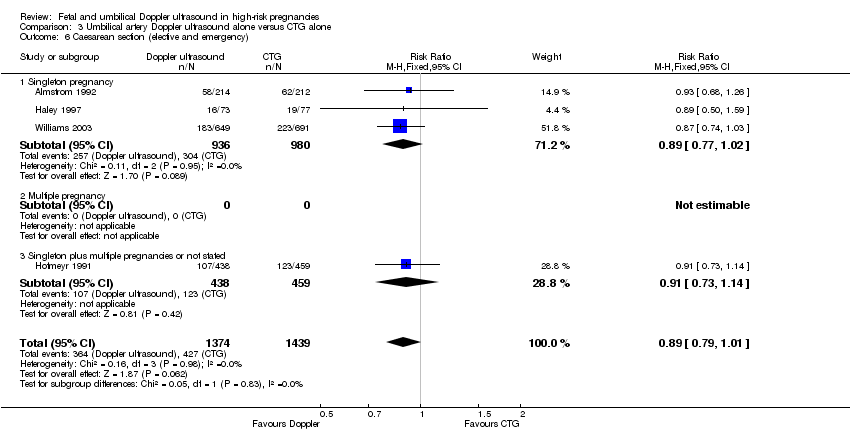 Comparison 3 Umbilical artery Doppler ultrasound alone versus CTG alone, Outcome 6 Caesarean section (elective and emergency). | ||||
| 6.1 Singleton pregnancy | 3 | 1916 | Risk Ratio (M‐H, Fixed, 95% CI) | 0.89 [0.77, 1.02] |
| 6.2 Multiple pregnancy | 0 | 0 | Risk Ratio (M‐H, Fixed, 95% CI) | 0.0 [0.0, 0.0] |
| 6.3 Singleton plus multiple pregnancies or not stated | 1 | 897 | Risk Ratio (M‐H, Fixed, 95% CI) | 0.91 [0.73, 1.14] |
| 7 Caesarean section ‐ elective Show forest plot | 3 | 1473 | Risk Ratio (M‐H, Fixed, 95% CI) | 1.53 [1.12, 2.09] |
| Analysis 3.7  Comparison 3 Umbilical artery Doppler ultrasound alone versus CTG alone, Outcome 7 Caesarean section ‐ elective. | ||||
| 7.1 Singleton pregnancy | 2 | 576 | Risk Ratio (M‐H, Fixed, 95% CI) | 1.69 [1.07, 2.67] |
| 7.2 Multiple pregnancy | 0 | 0 | Risk Ratio (M‐H, Fixed, 95% CI) | 0.0 [0.0, 0.0] |
| 7.3 Singleton plus multiple pregnancies or not stated | 1 | 897 | Risk Ratio (M‐H, Fixed, 95% CI) | 1.40 [0.91, 2.15] |
| 8 Caesarean section ‐ emergency Show forest plot | 3 | 1473 | Risk Ratio (M‐H, Fixed, 95% CI) | 0.66 [0.52, 0.84] |
| Analysis 3.8  Comparison 3 Umbilical artery Doppler ultrasound alone versus CTG alone, Outcome 8 Caesarean section ‐ emergency. | ||||
| 8.1 Singleton pregnancy | 2 | 576 | Risk Ratio (M‐H, Fixed, 95% CI) | 0.55 [0.36, 0.83] |
| 8.2 Multiple pregnancy | 0 | 0 | Risk Ratio (M‐H, Fixed, 95% CI) | 0.0 [0.0, 0.0] |
| 8.3 Singleton plus multiple pregnancies or not stated | 1 | 897 | Risk Ratio (M‐H, Fixed, 95% CI) | 0.73 [0.55, 0.98] |
| 9 Spontaneous vaginal birth Show forest plot | 2 | 1323 | Risk Ratio (M‐H, Fixed, 95% CI) | 1.06 [0.97, 1.15] |
| Analysis 3.9 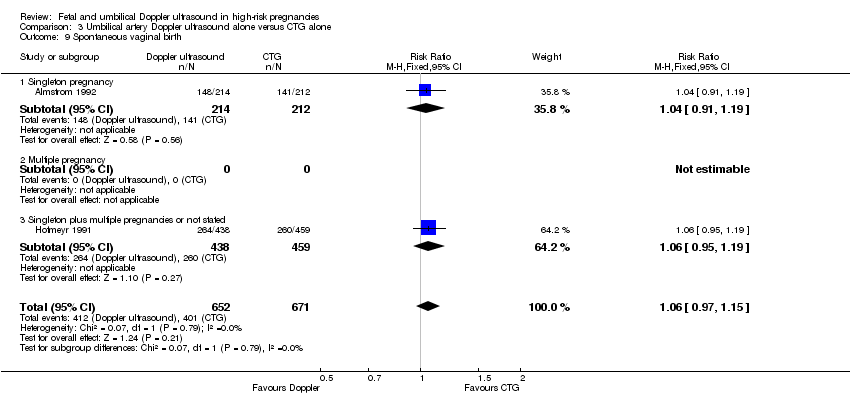 Comparison 3 Umbilical artery Doppler ultrasound alone versus CTG alone, Outcome 9 Spontaneous vaginal birth. | ||||
| 9.1 Singleton pregnancy | 1 | 426 | Risk Ratio (M‐H, Fixed, 95% CI) | 1.04 [0.91, 1.19] |
| 9.2 Multiple pregnancy | 0 | 0 | Risk Ratio (M‐H, Fixed, 95% CI) | 0.0 [0.0, 0.0] |
| 9.3 Singleton plus multiple pregnancies or not stated | 1 | 897 | Risk Ratio (M‐H, Fixed, 95% CI) | 1.06 [0.95, 1.19] |
| 10 Operative vaginal birth Show forest plot | 3 | 2663 | Risk Ratio (M‐H, Fixed, 95% CI) | 0.98 [0.81, 1.17] |
| Analysis 3.10  Comparison 3 Umbilical artery Doppler ultrasound alone versus CTG alone, Outcome 10 Operative vaginal birth. | ||||
| 10.1 Singleton pregnancy | 2 | 1766 | Risk Ratio (M‐H, Fixed, 95% CI) | 1.01 [0.80, 1.27] |
| 10.2 Multiple pregnancy | 0 | 0 | Risk Ratio (M‐H, Fixed, 95% CI) | 0.0 [0.0, 0.0] |
| 10.3 Singleton plus multiple pregnancies or not stated | 1 | 897 | Risk Ratio (M‐H, Fixed, 95% CI) | 0.92 [0.68, 1.25] |
| 11 Induction of labour Show forest plot | 2 | 576 | Risk Ratio (M‐H, Random, 95% CI) | 0.67 [0.32, 1.40] |
| Analysis 3.11  Comparison 3 Umbilical artery Doppler ultrasound alone versus CTG alone, Outcome 11 Induction of labour. | ||||
| 11.1 Singleton pregnancy | 2 | 576 | Risk Ratio (M‐H, Random, 95% CI) | 0.67 [0.32, 1.40] |
| 11.2 Multiple pregnancy | 0 | 0 | Risk Ratio (M‐H, Random, 95% CI) | 0.0 [0.0, 0.0] |
| 11.3 Singleton plus multiple pregnancies or not stated | 0 | 0 | Risk Ratio (M‐H, Random, 95% CI) | 0.0 [0.0, 0.0] |
| 12 Infant requiring intubation/ventilation Show forest plot | 2 | 576 | Risk Ratio (M‐H, Fixed, 95% CI) | 1.54 [0.26, 9.08] |
| Analysis 3.12  Comparison 3 Umbilical artery Doppler ultrasound alone versus CTG alone, Outcome 12 Infant requiring intubation/ventilation. | ||||
| 12.1 Singleton pregnancy | 2 | 576 | Risk Ratio (M‐H, Fixed, 95% CI) | 1.54 [0.26, 9.08] |
| 12.2 Multiple pregnancy | 0 | 0 | Risk Ratio (M‐H, Fixed, 95% CI) | 0.0 [0.0, 0.0] |
| 12.3 Singleton plus multiple pregnancies or not stated | 0 | 0 | Risk Ratio (M‐H, Fixed, 95% CI) | 0.0 [0.0, 0.0] |
| 13 Neonatal fitting/seizures Show forest plot | 1 | 150 | Risk Ratio (M‐H, Fixed, 95% CI) | 0.35 [0.01, 8.49] |
| Analysis 3.13  Comparison 3 Umbilical artery Doppler ultrasound alone versus CTG alone, Outcome 13 Neonatal fitting/seizures. | ||||
| 13.1 Singleton pregnancy | 1 | 150 | Risk Ratio (M‐H, Fixed, 95% CI) | 0.35 [0.01, 8.49] |
| 13.2 Multiple pregnancy | 0 | 0 | Risk Ratio (M‐H, Fixed, 95% CI) | 0.0 [0.0, 0.0] |
| 13.3 Singleton plus multiple pregnancies or not stated | 0 | 0 | Risk Ratio (M‐H, Fixed, 95% CI) | 0.0 [0.0, 0.0] |
| 14 Gestational age at birth Show forest plot | 3 | 1473 | Mean Difference (IV, Fixed, 95% CI) | 0.23 [‐0.00, 0.47] |
| Analysis 3.14  Comparison 3 Umbilical artery Doppler ultrasound alone versus CTG alone, Outcome 14 Gestational age at birth. | ||||
| 14.1 Singleton pregnancy | 2 | 576 | Mean Difference (IV, Fixed, 95% CI) | 0.26 [‐0.06, 0.59] |
| 14.2 Multiple pregnancy | 0 | 0 | Mean Difference (IV, Fixed, 95% CI) | 0.0 [0.0, 0.0] |
| 14.3 Singleton plus multiple pregnancies or not stated | 1 | 897 | Mean Difference (IV, Fixed, 95% CI) | 0.20 [‐0.15, 0.55] |
| 15 Neonatal admission to SCBU and/or NICU Show forest plot | 4 | 2813 | Risk Ratio (M‐H, Fixed, 95% CI) | 0.87 [0.73, 1.03] |
| Analysis 3.15 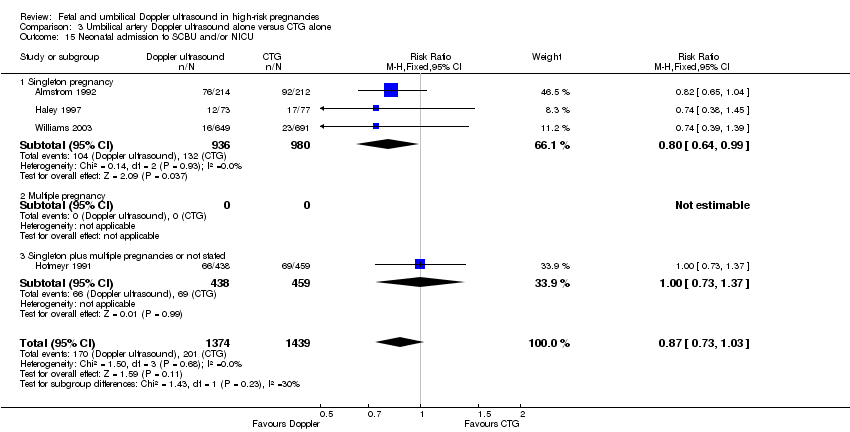 Comparison 3 Umbilical artery Doppler ultrasound alone versus CTG alone, Outcome 15 Neonatal admission to SCBU and/or NICU. | ||||
| 15.1 Singleton pregnancy | 3 | 1916 | Risk Ratio (M‐H, Fixed, 95% CI) | 0.80 [0.64, 0.99] |
| 15.2 Multiple pregnancy | 0 | 0 | Risk Ratio (M‐H, Fixed, 95% CI) | 0.0 [0.0, 0.0] |
| 15.3 Singleton plus multiple pregnancies or not stated | 1 | 897 | Risk Ratio (M‐H, Fixed, 95% CI) | 1.00 [0.73, 1.37] |
| 16 Infant birthweight (grams) Show forest plot | 4 | 2813 | Mean Difference (IV, Fixed, 95% CI) | 38.41 [‐6.14, 82.97] |
| Analysis 3.16  Comparison 3 Umbilical artery Doppler ultrasound alone versus CTG alone, Outcome 16 Infant birthweight (grams). | ||||
| 16.1 Singleton pregnancy | 3 | 1916 | Mean Difference (IV, Fixed, 95% CI) | 49.34 [‐0.62, 99.31] |
| 16.2 Multiple pregnancy | 0 | 0 | Mean Difference (IV, Fixed, 95% CI) | 0.0 [0.0, 0.0] |
| 16.3 Singleton plus multiple pregnancies or not stated | 1 | 897 | Mean Difference (IV, Fixed, 95% CI) | ‐4.0 [‐102.42, 94.42] |
| 17 Length of infant hospital stay (days) Show forest plot | 2 | 576 | Std. Mean Difference (IV, Fixed, 95% CI) | ‐0.25 [‐0.41, ‐0.08] |
| Analysis 3.17  Comparison 3 Umbilical artery Doppler ultrasound alone versus CTG alone, Outcome 17 Length of infant hospital stay (days). | ||||
| 17.1 Singleton pregnancy | 2 | 576 | Std. Mean Difference (IV, Fixed, 95% CI) | ‐0.25 [‐0.41, ‐0.08] |
| 17.2 Multiple pregnancy | 0 | 0 | Std. Mean Difference (IV, Fixed, 95% CI) | 0.0 [0.0, 0.0] |
| 17.3 Singleton plus multiple pregnancies or not stated | 0 | 0 | Std. Mean Difference (IV, Fixed, 95% CI) | 0.0 [0.0, 0.0] |
| 18 Antenatal admissions (not prespecified) Show forest plot | 1 | 426 | Risk Ratio (M‐H, Fixed, 95% CI) | 0.70 [0.55, 0.90] |
| Analysis 3.18  Comparison 3 Umbilical artery Doppler ultrasound alone versus CTG alone, Outcome 18 Antenatal admissions (not prespecified). | ||||
| 18.1 Singleton pregnancy | 1 | 426 | Risk Ratio (M‐H, Fixed, 95% CI) | 0.70 [0.55, 0.90] |
| 18.2 Multiple pregnancy | 0 | 0 | Risk Ratio (M‐H, Fixed, 95% CI) | 0.0 [0.0, 0.0] |
| 18.3 Singleton plus multiple pregnancies or not stated | 0 | 0 | Risk Ratio (M‐H, Fixed, 95% CI) | 0.0 [0.0, 0.0] |
| 19 Phototherapy for neonatal jaundice (not prespecified) Show forest plot | 1 | 150 | Risk Ratio (M‐H, Fixed, 95% CI) | 0.15 [0.01, 2.87] |
| Analysis 3.19  Comparison 3 Umbilical artery Doppler ultrasound alone versus CTG alone, Outcome 19 Phototherapy for neonatal jaundice (not prespecified). | ||||
| 19.1 Singleton pregnancy | 1 | 150 | Risk Ratio (M‐H, Fixed, 95% CI) | 0.15 [0.01, 2.87] |
| 19.2 Multiple pregnancy | 0 | 0 | Risk Ratio (M‐H, Fixed, 95% CI) | 0.0 [0.0, 0.0] |
| 19.3 Singleton plus multiple pregnancies or not stated | 0 | 0 | Risk Ratio (M‐H, Fixed, 95% CI) | 0.0 [0.0, 0.0] |
| 20 Antenatal hospital stay (days) (not prespecified) Show forest plot | 1 | 426 | Mean Difference (IV, Fixed, 95% CI) | ‐0.60 [‐2.39, 1.19] |
| Analysis 3.20  Comparison 3 Umbilical artery Doppler ultrasound alone versus CTG alone, Outcome 20 Antenatal hospital stay (days) (not prespecified). | ||||
| 20.1 Singleton pregnancy | 1 | 426 | Mean Difference (IV, Fixed, 95% CI) | ‐0.60 [‐2.39, 1.19] |
| 20.2 Multiple pregnancy | 0 | 0 | Mean Difference (IV, Fixed, 95% CI) | 0.0 [0.0, 0.0] |
| 20.3 Singleton plus multiple pregnancies or not stated | 0 | 0 | Mean Difference (IV, Fixed, 95% CI) | 0.0 [0.0, 0.0] |
| Outcome or subgroup title | No. of studies | No. of participants | Statistical method | Effect size |
| 1 Any perinatal death after randomisation Show forest plot | 3 | Risk Ratio (M‐H, Fixed, 95% CI) | Subtotals only | |
| Analysis 4.1  Comparison 4 Umbilical artery Doppler ultrasound alone versus CTG alone (all subgroups), Outcome 1 Any perinatal death after randomisation. | ||||
| 1.1 SGA/IUGR | 2 | 572 | Risk Ratio (M‐H, Fixed, 95% CI) | 0.33 [0.05, 2.09] |
| 1.2 Hypertension/pre‐eclampsia | 1 | 89 | Risk Ratio (M‐H, Fixed, 95% CI) | 3.57 [0.42, 30.73] |
| 1.3 Diabetes | 0 | 0 | Risk Ratio (M‐H, Fixed, 95% CI) | 0.0 [0.0, 0.0] |
| 1.4 Prolonged pregnancy | 0 | 0 | Risk Ratio (M‐H, Fixed, 95% CI) | 0.0 [0.0, 0.0] |
| 1.5 Previous pregnancy loss | 0 | 0 | Risk Ratio (M‐H, Fixed, 95% CI) | 0.0 [0.0, 0.0] |
| Outcome or subgroup title | No. of studies | No. of participants | Statistical method | Effect size |
| 1 Any perinatal death after randomisation Show forest plot | 1 | 333 | Risk Ratio (M‐H, Fixed, 95% CI) | 0.84 [0.39, 1.82] |
| Analysis 5.1  Comparison 5 Early ductus venosus Doppler ultrasound versus CTG, Outcome 1 Any perinatal death after randomisation. | ||||
| 1.1 Singleton pregnancy | 1 | 333 | Risk Ratio (M‐H, Fixed, 95% CI) | 0.84 [0.39, 1.82] |
| 2 Survival following severe neonatal morbidity Show forest plot | 1 | 333 | Risk Ratio (M‐H, Fixed, 95% CI) | 1.10 [0.75, 1.61] |
| Analysis 5.2  Comparison 5 Early ductus venosus Doppler ultrasound versus CTG, Outcome 2 Survival following severe neonatal morbidity. | ||||
| 3 Stillbirth Show forest plot | 1 | 333 | Risk Ratio (M‐H, Fixed, 95% CI) | 1.99 [0.37, 10.71] |
| Analysis 5.3 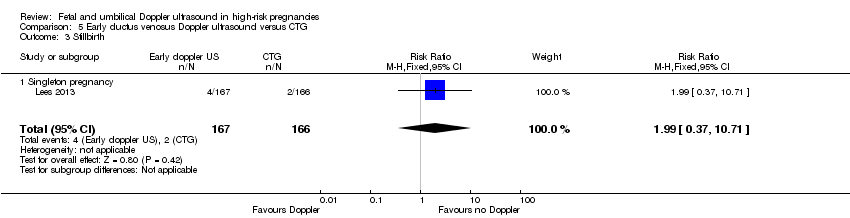 Comparison 5 Early ductus venosus Doppler ultrasound versus CTG, Outcome 3 Stillbirth. | ||||
| 3.1 Singleton pregnancy | 1 | 333 | Risk Ratio (M‐H, Fixed, 95% CI) | 1.99 [0.37, 10.71] |
| 4 Neonatal death Show forest plot | 1 | 333 | Risk Ratio (M‐H, Fixed, 95% CI) | 0.60 [0.22, 1.60] |
| Analysis 5.4  Comparison 5 Early ductus venosus Doppler ultrasound versus CTG, Outcome 4 Neonatal death. | ||||
| 4.1 Singleton pregnancy | 1 | 333 | Risk Ratio (M‐H, Fixed, 95% CI) | 0.60 [0.22, 1.60] |
| 5 Any potentially preventable perinatal death* Show forest plot | 1 | 333 | Risk Ratio (M‐H, Fixed, 95% CI) | 0.83 [0.37, 1.86] |
| Analysis 5.5  Comparison 5 Early ductus venosus Doppler ultrasound versus CTG, Outcome 5 Any potentially preventable perinatal death*. | ||||
| 5.1 Singleton pregnancy | 1 | 333 | Risk Ratio (M‐H, Fixed, 95% CI) | 0.83 [0.37, 1.86] |
| 6 Fetal acidosis Show forest plot | 1 | 333 | Risk Ratio (M‐H, Fixed, 95% CI) | 0.25 [0.03, 2.20] |
| Analysis 5.6  Comparison 5 Early ductus venosus Doppler ultrasound versus CTG, Outcome 6 Fetal acidosis. | ||||
| 6.1 Singleton pregnancy | 1 | 333 | Risk Ratio (M‐H, Fixed, 95% CI) | 0.25 [0.03, 2.20] |
| 7 Apgar < 7 at 5 minutes Show forest plot | 1 | 333 | Risk Ratio (M‐H, Fixed, 95% CI) | 0.87 [0.44, 1.72] |
| Analysis 5.7  Comparison 5 Early ductus venosus Doppler ultrasound versus CTG, Outcome 7 Apgar < 7 at 5 minutes. | ||||
| 7.1 Singleton pregnancy | 1 | 333 | Risk Ratio (M‐H, Fixed, 95% CI) | 0.87 [0.44, 1.72] |
| 8 Infant requiring intubation/ventilation Show forest plot | 1 | 333 | Risk Ratio (M‐H, Random, 95% CI) | 0.87 [0.67, 1.13] |
| Analysis 5.8 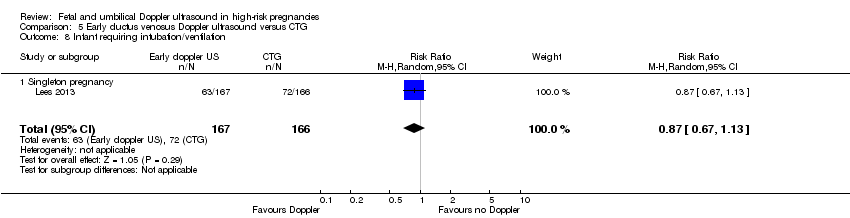 Comparison 5 Early ductus venosus Doppler ultrasound versus CTG, Outcome 8 Infant requiring intubation/ventilation. | ||||
| 8.1 Singleton pregnancy | 1 | 333 | Risk Ratio (M‐H, Random, 95% CI) | 0.87 [0.67, 1.13] |
| 9 Intraventricular haemorrhage Show forest plot | 1 | 333 | Risk Ratio (M‐H, Fixed, 95% CI) | 8.95 [0.49, 164.87] |
| Analysis 5.9  Comparison 5 Early ductus venosus Doppler ultrasound versus CTG, Outcome 9 Intraventricular haemorrhage. | ||||
| 9.1 Singleton pregnancy | 1 | 333 | Risk Ratio (M‐H, Fixed, 95% CI) | 8.95 [0.49, 164.87] |
| 10 Bronchopulmonary dysplasia Show forest plot | 1 | 333 | Risk Ratio (M‐H, Fixed, 95% CI) | 0.87 [0.55, 1.38] |
| Analysis 5.10  Comparison 5 Early ductus venosus Doppler ultrasound versus CTG, Outcome 10 Bronchopulmonary dysplasia. | ||||
| 10.1 Singleton pregnancy | 1 | 333 | Risk Ratio (M‐H, Fixed, 95% CI) | 0.87 [0.55, 1.38] |
| 11 Necrotising enterocolitis Show forest plot | 1 | 333 | Risk Ratio (M‐H, Fixed, 95% CI) | 0.33 [0.03, 3.15] |
| Analysis 5.11  Comparison 5 Early ductus venosus Doppler ultrasound versus CTG, Outcome 11 Necrotising enterocolitis. | ||||
| 11.1 Singleton pregnancy | 1 | 333 | Risk Ratio (M‐H, Fixed, 95% CI) | 0.33 [0.03, 3.15] |
| 12 Infant birthweight (grams) Show forest plot | 1 | 333 | Mean Difference (IV, Fixed, 95% CI) | 38.0 [‐31.53, 107.53] |
| Analysis 5.12  Comparison 5 Early ductus venosus Doppler ultrasound versus CTG, Outcome 12 Infant birthweight (grams). | ||||
| 12.1 Singleton pregnancy | 1 | 333 | Mean Difference (IV, Fixed, 95% CI) | 38.0 [‐31.53, 107.53] |
| 13 Long‐term infant neurodevelopmental outcome (impairment at 2 years) Show forest plot | 1 | 333 | Risk Ratio (M‐H, Fixed, 95% CI) | 0.60 [0.30, 1.18] |
| Analysis 5.13  Comparison 5 Early ductus venosus Doppler ultrasound versus CTG, Outcome 13 Long‐term infant neurodevelopmental outcome (impairment at 2 years). | ||||
| 13.1 Singleton pregnancy | 1 | 333 | Risk Ratio (M‐H, Fixed, 95% CI) | 0.60 [0.30, 1.18] |
| 14 Long‐term infant neurodevelopmental outcome (cerebral palsy at 2 years) Show forest plot | 1 | 333 | Risk Ratio (M‐H, Fixed, 95% CI) | 0.20 [0.02, 1.68] |
| Analysis 5.14  Comparison 5 Early ductus venosus Doppler ultrasound versus CTG, Outcome 14 Long‐term infant neurodevelopmental outcome (cerebral palsy at 2 years). | ||||
| 14.1 Singleton pregnancy | 1 | 333 | Risk Ratio (M‐H, Fixed, 95% CI) | 0.20 [0.02, 1.68] |
| 15 Infant survival at 2 years without neurodevelopmental impairment (not prespecified) Show forest plot | 1 | 333 | Risk Ratio (M‐H, Fixed, 95% CI) | 1.07 [0.92, 1.23] |
| Analysis 5.15  Comparison 5 Early ductus venosus Doppler ultrasound versus CTG, Outcome 15 Infant survival at 2 years without neurodevelopmental impairment (not prespecified). | ||||
| 15.1 Singleton pregnancy | 1 | 333 | Risk Ratio (M‐H, Fixed, 95% CI) | 1.07 [0.92, 1.23] |
| 16 Sepsis (proven) (not prespecified) Show forest plot | 1 | 333 | Risk Ratio (M‐H, Fixed, 95% CI) | 0.93 [0.60, 1.45] |
| Analysis 5.16  Comparison 5 Early ductus venosus Doppler ultrasound versus CTG, Outcome 16 Sepsis (proven) (not prespecified). | ||||
| 16.1 Singleton pregnancy | 1 | 333 | Risk Ratio (M‐H, Fixed, 95% CI) | 0.93 [0.60, 1.45] |
| Outcome or subgroup title | No. of studies | No. of participants | Statistical method | Effect size |
| 1 Any perinatal death after randomisation Show forest plot | 1 | 336 | Risk Ratio (M‐H, Fixed, 95% CI) | 1.28 [0.64, 2.55] |
| Analysis 6.1  Comparison 6 Late ductus venosus Doppler ultrasound versus CTG, Outcome 1 Any perinatal death after randomisation. | ||||
| 1.1 Singleton pregnancy | 1 | 336 | Risk Ratio (M‐H, Fixed, 95% CI) | 1.28 [0.64, 2.55] |
| 2 Survival following severe neonatal morbidity Show forest plot | 1 | 336 | Risk Ratio (M‐H, Fixed, 95% CI) | 0.98 [0.66, 1.45] |
| Analysis 6.2 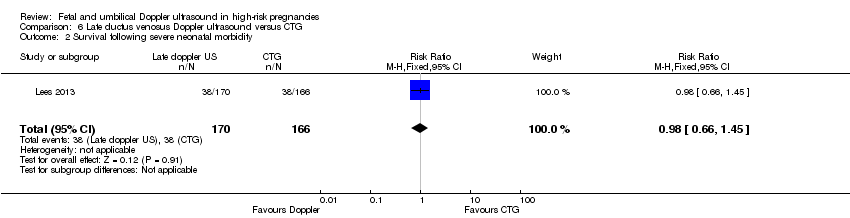 Comparison 6 Late ductus venosus Doppler ultrasound versus CTG, Outcome 2 Survival following severe neonatal morbidity. | ||||
| 3 Stillbirth Show forest plot | 1 | 336 | Risk Ratio (M‐H, Fixed, 95% CI) | 2.93 [0.60, 14.31] |
| Analysis 6.3  Comparison 6 Late ductus venosus Doppler ultrasound versus CTG, Outcome 3 Stillbirth. | ||||
| 3.1 Singleton pregnancy | 1 | 336 | Risk Ratio (M‐H, Fixed, 95% CI) | 2.93 [0.60, 14.31] |
| 4 Neonatal death Show forest plot | 1 | 336 | Risk Ratio (M‐H, Fixed, 95% CI) | 1.07 [0.47, 2.46] |
| Analysis 6.4  Comparison 6 Late ductus venosus Doppler ultrasound versus CTG, Outcome 4 Neonatal death. | ||||
| 4.1 Singleton pregnancy | 1 | 336 | Risk Ratio (M‐H, Fixed, 95% CI) | 1.07 [0.47, 2.46] |
| 5 Any potentially preventable perinatal death* Show forest plot | 1 | 336 | Risk Ratio (M‐H, Fixed, 95% CI) | 1.22 [0.59, 2.53] |
| Analysis 6.5  Comparison 6 Late ductus venosus Doppler ultrasound versus CTG, Outcome 5 Any potentially preventable perinatal death*. | ||||
| 5.1 Singleton pregnancy | 1 | 336 | Risk Ratio (M‐H, Fixed, 95% CI) | 1.22 [0.59, 2.53] |
| 6 Fetal acidosis Show forest plot | 1 | 336 | Risk Ratio (M‐H, Fixed, 95% CI) | 0.11 [0.01, 2.00] |
| Analysis 6.6  Comparison 6 Late ductus venosus Doppler ultrasound versus CTG, Outcome 6 Fetal acidosis. | ||||
| 6.1 Singleton pregnancy | 1 | 336 | Risk Ratio (M‐H, Fixed, 95% CI) | 0.11 [0.01, 2.00] |
| 7 Apgar < 7 at 5 minutes Show forest plot | 1 | 336 | Risk Ratio (M‐H, Fixed, 95% CI) | 1.28 [0.69, 2.37] |
| Analysis 6.7  Comparison 6 Late ductus venosus Doppler ultrasound versus CTG, Outcome 7 Apgar < 7 at 5 minutes. | ||||
| 7.1 Singleton pregnancy | 1 | 336 | Risk Ratio (M‐H, Fixed, 95% CI) | 1.28 [0.69, 2.37] |
| 8 Infant requiring intubation/ventilation Show forest plot | 1 | 336 | Risk Ratio (M‐H, Random, 95% CI) | 0.94 [0.73, 1.20] |
| Analysis 6.8  Comparison 6 Late ductus venosus Doppler ultrasound versus CTG, Outcome 8 Infant requiring intubation/ventilation. | ||||
| 8.1 Singleton pregnancy | 1 | 336 | Risk Ratio (M‐H, Random, 95% CI) | 0.94 [0.73, 1.20] |
| 9 Intraventricular haemorrhage Show forest plot | 1 | 336 | Risk Ratio (M‐H, Fixed, 95% CI) | 16.60 [0.97, 285.35] |
| Analysis 6.9  Comparison 6 Late ductus venosus Doppler ultrasound versus CTG, Outcome 9 Intraventricular haemorrhage. | ||||
| 9.1 Singleton pregnancy | 1 | 336 | Risk Ratio (M‐H, Fixed, 95% CI) | 16.60 [0.97, 285.35] |
| 10 Bronchopulmonary dysplasia Show forest plot | 1 | 336 | Risk Ratio (M‐H, Fixed, 95% CI) | 0.95 [0.61, 1.48] |
| Analysis 6.10 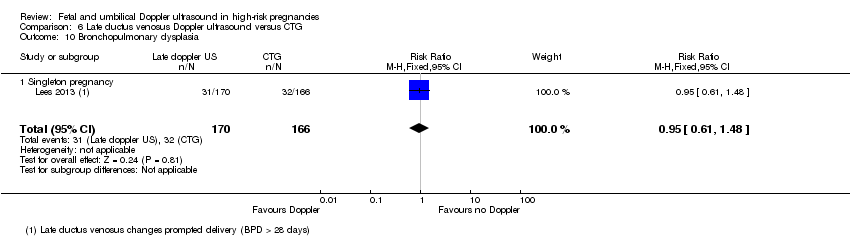 Comparison 6 Late ductus venosus Doppler ultrasound versus CTG, Outcome 10 Bronchopulmonary dysplasia. | ||||
| 10.1 Singleton pregnancy | 1 | 336 | Risk Ratio (M‐H, Fixed, 95% CI) | 0.95 [0.61, 1.48] |
| 11 Necrotising enterocolitis Show forest plot | 1 | 336 | Risk Ratio (M‐H, Fixed, 95% CI) | 0.98 [0.20, 4.77] |
| Analysis 6.11  Comparison 6 Late ductus venosus Doppler ultrasound versus CTG, Outcome 11 Necrotising enterocolitis. | ||||
| 11.1 Singleton pregnancy | 1 | 336 | Risk Ratio (M‐H, Fixed, 95% CI) | 0.98 [0.20, 4.77] |
| 12 Infant birthweight (grams) Show forest plot | 1 | 336 | Mean Difference (IV, Fixed, 95% CI) | 25.0 [‐40.06, 90.06] |
| Analysis 6.12  Comparison 6 Late ductus venosus Doppler ultrasound versus CTG, Outcome 12 Infant birthweight (grams). | ||||
| 12.1 Singleton pregnancy | 1 | 336 | Mean Difference (IV, Fixed, 95% CI) | 25.0 [‐40.06, 90.06] |
| 13 Long‐term infant neurodevelopmental outcome (impairment at 2 years) Show forest plot | 1 | 336 | Risk Ratio (M‐H, Fixed, 95% CI) | 0.34 [0.15, 0.79] |
| Analysis 6.13 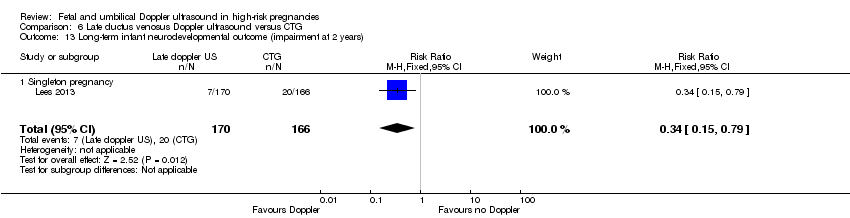 Comparison 6 Late ductus venosus Doppler ultrasound versus CTG, Outcome 13 Long‐term infant neurodevelopmental outcome (impairment at 2 years). | ||||
| 13.1 Singleton pregnancy | 1 | 336 | Risk Ratio (M‐H, Fixed, 95% CI) | 0.34 [0.15, 0.79] |
| 14 Long‐term infant neurodevelopmental outcome (cerebral palsy at 2 years) Show forest plot | 1 | 336 | Risk Ratio (M‐H, Fixed, 95% CI) | 0.09 [0.00, 1.59] |
| Analysis 6.14 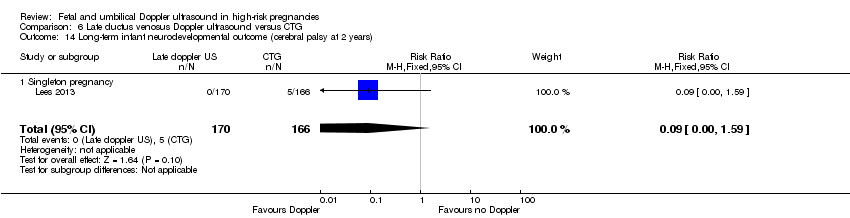 Comparison 6 Late ductus venosus Doppler ultrasound versus CTG, Outcome 14 Long‐term infant neurodevelopmental outcome (cerebral palsy at 2 years). | ||||
| 14.1 Singleton pregnancy | 1 | 336 | Risk Ratio (M‐H, Fixed, 95% CI) | 0.09 [0.00, 1.59] |
| 15 Infant survival at 2 years without neurodevelopmental impairment (not prespecified) Show forest plot | 1 | 336 | Risk Ratio (M‐H, Fixed, 95% CI) | 1.17 [1.02, 1.34] |
| Analysis 6.15  Comparison 6 Late ductus venosus Doppler ultrasound versus CTG, Outcome 15 Infant survival at 2 years without neurodevelopmental impairment (not prespecified). | ||||
| 15.1 Singleton pregnancy | 1 | 336 | Risk Ratio (M‐H, Fixed, 95% CI) | 1.17 [1.02, 1.34] |
| 16 Sepsis (proven) (not prespecified) Show forest plot | 1 | 336 | Risk Ratio (M‐H, Fixed, 95% CI) | 0.68 [0.42, 1.11] |
| Analysis 6.16  Comparison 6 Late ductus venosus Doppler ultrasound versus CTG, Outcome 16 Sepsis (proven) (not prespecified). | ||||
| 16.1 Singleton pregnancy | 1 | 336 | Risk Ratio (M‐H, Fixed, 95% CI) | 0.68 [0.42, 1.11] |
| Outcome or subgroup title | No. of studies | No. of participants | Statistical method | Effect size |
| 1 Any perinatal death after randomisation Show forest plot | 1 | 337 | Risk Ratio (M‐H, Fixed, 95% CI) | 0.66 [0.32, 1.36] |
| Analysis 7.1 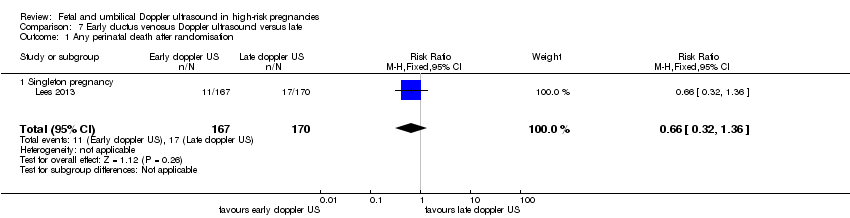 Comparison 7 Early ductus venosus Doppler ultrasound versus late, Outcome 1 Any perinatal death after randomisation. | ||||
| 1.1 Singleton pregnancy | 1 | 337 | Risk Ratio (M‐H, Fixed, 95% CI) | 0.66 [0.32, 1.36] |
| 2 Survival following severe neonatal morbidity Show forest plot | 1 | 337 | Risk Ratio (M‐H, Fixed, 95% CI) | 1.13 [0.77, 1.65] |
| Analysis 7.2  Comparison 7 Early ductus venosus Doppler ultrasound versus late, Outcome 2 Survival following severe neonatal morbidity. | ||||
| 3 Stillbirth Show forest plot | 1 | 337 | Risk Ratio (M‐H, Fixed, 95% CI) | 0.68 [0.20, 2.36] |
| Analysis 7.3  Comparison 7 Early ductus venosus Doppler ultrasound versus late, Outcome 3 Stillbirth. | ||||
| 3.1 Singleton pregnancy | 1 | 337 | Risk Ratio (M‐H, Fixed, 95% CI) | 0.68 [0.20, 2.36] |
| 4 Neonatal death Show forest plot | 1 | 337 | Risk Ratio (M‐H, Fixed, 95% CI) | 0.56 [0.21, 1.47] |
| Analysis 7.4 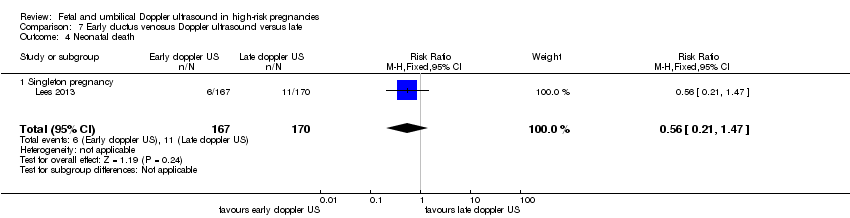 Comparison 7 Early ductus venosus Doppler ultrasound versus late, Outcome 4 Neonatal death. | ||||
| 4.1 Singleton pregnancy | 1 | 337 | Risk Ratio (M‐H, Fixed, 95% CI) | 0.56 [0.21, 1.47] |
| 5 Any potentially preventable perinatal death* Show forest plot | 1 | 337 | Risk Ratio (M‐H, Fixed, 95% CI) | 0.68 [0.31, 1.47] |
| Analysis 7.5  Comparison 7 Early ductus venosus Doppler ultrasound versus late, Outcome 5 Any potentially preventable perinatal death*. | ||||
| 5.1 Singleton pregnancy | 1 | 337 | Risk Ratio (M‐H, Fixed, 95% CI) | 0.68 [0.31, 1.47] |
| 6 Fetal acidosis Show forest plot | 1 | 337 | Risk Ratio (M‐H, Fixed, 95% CI) | 3.05 [0.13, 74.43] |
| Analysis 7.6  Comparison 7 Early ductus venosus Doppler ultrasound versus late, Outcome 6 Fetal acidosis. | ||||
| 6.1 Singleton pregnancy | 1 | 337 | Risk Ratio (M‐H, Fixed, 95% CI) | 3.05 [0.13, 74.43] |
| 7 Apgar < 7 at 5 minutes Show forest plot | 1 | 337 | Risk Ratio (M‐H, Fixed, 95% CI) | 0.68 [0.36, 1.29] |
| Analysis 7.7  Comparison 7 Early ductus venosus Doppler ultrasound versus late, Outcome 7 Apgar < 7 at 5 minutes. | ||||
| 7.1 Singleton pregnancy | 1 | 337 | Risk Ratio (M‐H, Fixed, 95% CI) | 0.68 [0.36, 1.29] |
| 8 Infant requiring intubation/ventilation Show forest plot | 1 | 337 | Risk Ratio (M‐H, Random, 95% CI) | 0.93 [0.71, 1.21] |
| Analysis 7.8  Comparison 7 Early ductus venosus Doppler ultrasound versus late, Outcome 8 Infant requiring intubation/ventilation. | ||||
| 8.1 Singleton pregnancy | 1 | 337 | Risk Ratio (M‐H, Random, 95% CI) | 0.93 [0.71, 1.21] |
| 9 Intraventricular haemorrhage Show forest plot | 1 | 337 | Risk Ratio (M‐H, Fixed, 95% CI) | 0.51 [0.16, 1.66] |
| Analysis 7.9 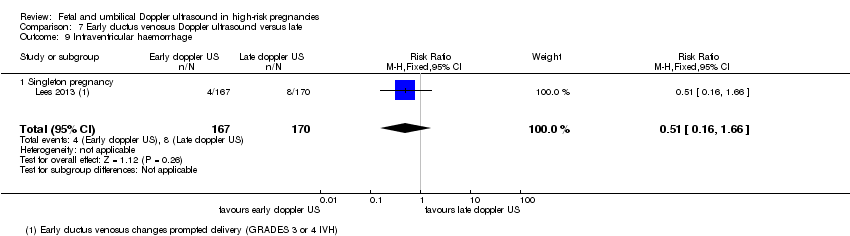 Comparison 7 Early ductus venosus Doppler ultrasound versus late, Outcome 9 Intraventricular haemorrhage. | ||||
| 9.1 Singleton pregnancy | 1 | 337 | Risk Ratio (M‐H, Fixed, 95% CI) | 0.51 [0.16, 1.66] |
| 10 Bronchopulmonary dysplasia Show forest plot | 1 | 337 | Risk Ratio (M‐H, Fixed, 95% CI) | 0.92 [0.58, 1.46] |
| Analysis 7.10  Comparison 7 Early ductus venosus Doppler ultrasound versus late, Outcome 10 Bronchopulmonary dysplasia. | ||||
| 10.1 Singleton pregnancy | 1 | 337 | Risk Ratio (M‐H, Fixed, 95% CI) | 0.92 [0.58, 1.46] |
| 11 Necrotising enterocolitis Show forest plot | 1 | 337 | Risk Ratio (M‐H, Fixed, 95% CI) | 0.34 [0.04, 3.23] |
| Analysis 7.11 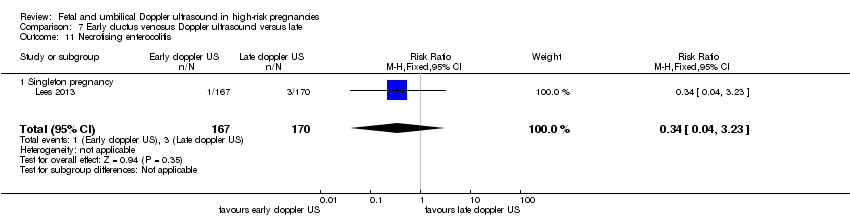 Comparison 7 Early ductus venosus Doppler ultrasound versus late, Outcome 11 Necrotising enterocolitis. | ||||
| 11.1 Singleton pregnancy | 1 | 337 | Risk Ratio (M‐H, Fixed, 95% CI) | 0.34 [0.04, 3.23] |
| 12 Infant birthweight (grams) Show forest plot | 1 | 337 | Mean Difference (IV, Fixed, 95% CI) | 13.0 [‐59.31, 85.31] |
| Analysis 7.12  Comparison 7 Early ductus venosus Doppler ultrasound versus late, Outcome 12 Infant birthweight (grams). | ||||
| 12.1 Singleton pregnancy | 1 | 337 | Mean Difference (IV, Fixed, 95% CI) | 13.0 [‐59.31, 85.31] |
| 13 Long‐term infant neurodevelopmental outcome (impairment at 2 years) Show forest plot | 1 | 337 | Risk Ratio (M‐H, Fixed, 95% CI) | 1.75 [0.70, 4.32] |
| Analysis 7.13  Comparison 7 Early ductus venosus Doppler ultrasound versus late, Outcome 13 Long‐term infant neurodevelopmental outcome (impairment at 2 years). | ||||
| 13.1 Singleton pregnancy | 1 | 337 | Risk Ratio (M‐H, Fixed, 95% CI) | 1.75 [0.70, 4.32] |
| 14 Long‐term infant neurodevelopmental outcome (cerebral palsy at 2 years) Show forest plot | 1 | 337 | Risk Ratio (M‐H, Fixed, 95% CI) | 3.05 [0.13, 74.43] |
| Analysis 7.14  Comparison 7 Early ductus venosus Doppler ultrasound versus late, Outcome 14 Long‐term infant neurodevelopmental outcome (cerebral palsy at 2 years). | ||||
| 14.1 Singleton pregnancy | 1 | 337 | Risk Ratio (M‐H, Fixed, 95% CI) | 3.05 [0.13, 74.43] |
| 15 Infant survival at 2 years without neurodevelopmental impairment (not prespecified) Show forest plot | 1 | 337 | Risk Ratio (M‐H, Fixed, 95% CI) | 0.91 [0.80, 1.03] |
| Analysis 7.15  Comparison 7 Early ductus venosus Doppler ultrasound versus late, Outcome 15 Infant survival at 2 years without neurodevelopmental impairment (not prespecified). | ||||
| 15.1 Singleton pregnancy | 1 | 337 | Risk Ratio (M‐H, Fixed, 95% CI) | 0.91 [0.80, 1.03] |
| 16 Sepsis (proven) (not prespecified) Show forest plot | 1 | 337 | Risk Ratio (M‐H, Fixed, 95% CI) | 1.37 [0.84, 2.25] |
| Analysis 7.16  Comparison 7 Early ductus venosus Doppler ultrasound versus late, Outcome 16 Sepsis (proven) (not prespecified). | ||||
| 16.1 Singleton pregnancy | 1 | 337 | Risk Ratio (M‐H, Fixed, 95% CI) | 1.37 [0.84, 2.25] |
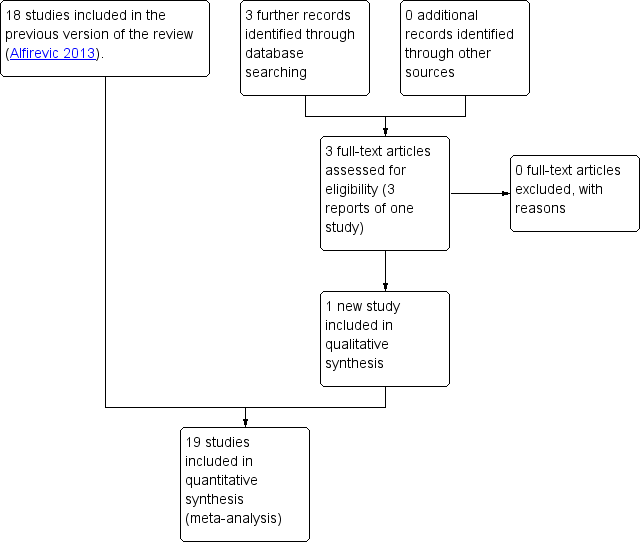
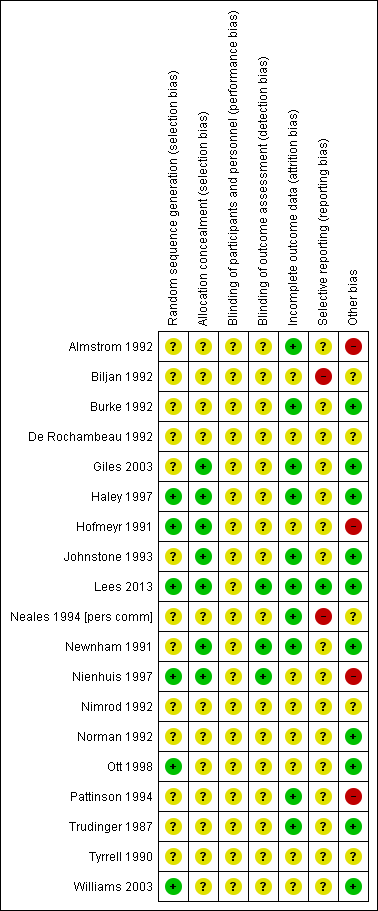
Methodological quality summary: review authors' judgements about each methodological quality item for each included study.

Funnel plot of comparison: 1 Doppler ultrasound versus no Doppler ultrasound, outcome: 1.1 Any perinatal death after randomisation.

Funnel plot of comparison: 1 Doppler ultrasound versus no Doppler ultrasound, outcome: 1.8 Cesarean section (elective and emergency).
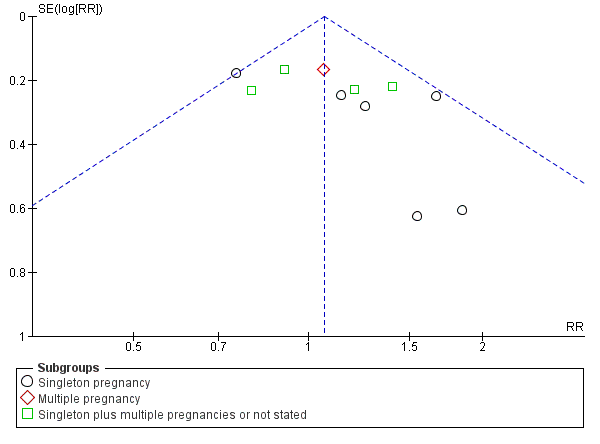
Funnel plot of comparison: 1 Doppler ultrasound versus no Doppler ultrasound, outcome: 1.9 Cesarean section ‐ elective.

Funnel plot of comparison: 1 Doppler ultrasound versus no Doppler ultrasound, outcome: 1.10 Cesarean section ‐ emergency.
Comparison 1 Umbilical artery Doppler ultrasound versus no Doppler ultrasound, Outcome 1 Any perinatal death after randomisation.
Comparison 1 Umbilical artery Doppler ultrasound versus no Doppler ultrasound, Outcome 2 Serious neonatal morbidity.
Comparison 1 Umbilical artery Doppler ultrasound versus no Doppler ultrasound, Outcome 3 Stillbirth.
Comparison 1 Umbilical artery Doppler ultrasound versus no Doppler ultrasound, Outcome 4 Neonatal death.
Comparison 1 Umbilical artery Doppler ultrasound versus no Doppler ultrasound, Outcome 5 Any potentially preventable perinatal death*.
Comparison 1 Umbilical artery Doppler ultrasound versus no Doppler ultrasound, Outcome 6 Apgar < 7 at 5 minutes.
Comparison 1 Umbilical artery Doppler ultrasound versus no Doppler ultrasound, Outcome 7 Caesarean section (elective and emergency).
Comparison 1 Umbilical artery Doppler ultrasound versus no Doppler ultrasound, Outcome 8 Caesarean section ‐ elective.
Comparison 1 Umbilical artery Doppler ultrasound versus no Doppler ultrasound, Outcome 9 Caesarean section ‐ emergency.
Comparison 1 Umbilical artery Doppler ultrasound versus no Doppler ultrasound, Outcome 10 Spontaneous vaginal birth.
Comparison 1 Umbilical artery Doppler ultrasound versus no Doppler ultrasound, Outcome 11 Operative vaginal birth.
Comparison 1 Umbilical artery Doppler ultrasound versus no Doppler ultrasound, Outcome 12 Induction of labour.
Comparison 1 Umbilical artery Doppler ultrasound versus no Doppler ultrasound, Outcome 13 Infant requiring intubation/ventilation.
Comparison 1 Umbilical artery Doppler ultrasound versus no Doppler ultrasound, Outcome 14 Neonatal fitting/seizures.
Comparison 1 Umbilical artery Doppler ultrasound versus no Doppler ultrasound, Outcome 15 Preterm labour.
Comparison 1 Umbilical artery Doppler ultrasound versus no Doppler ultrasound, Outcome 16 Gestational age at birth (weeks).
Comparison 1 Umbilical artery Doppler ultrasound versus no Doppler ultrasound, Outcome 17 Infant respiratory distress syndrome (RDS).
Comparison 1 Umbilical artery Doppler ultrasound versus no Doppler ultrasound, Outcome 18 Neonatal admission to SCBU and/or NICU.
Comparison 1 Umbilical artery Doppler ultrasound versus no Doppler ultrasound, Outcome 19 Hypoxic ischaemic encephalopathy.
Comparison 1 Umbilical artery Doppler ultrasound versus no Doppler ultrasound, Outcome 20 Intraventricular haemorrhage.
Comparison 1 Umbilical artery Doppler ultrasound versus no Doppler ultrasound, Outcome 21 Birthweight (grams).
Comparison 1 Umbilical artery Doppler ultrasound versus no Doppler ultrasound, Outcome 22 Length of infant hospital stay (days).
Comparison 1 Umbilical artery Doppler ultrasound versus no Doppler ultrasound, Outcome 23 Birth < 34 weeks (not prespecified).
Comparison 1 Umbilical artery Doppler ultrasound versus no Doppler ultrasound, Outcome 24 Antenatal admissions (not prespecified).
Comparison 1 Umbilical artery Doppler ultrasound versus no Doppler ultrasound, Outcome 25 Phototherapy for neonatal jaundice (not prespecified).
Comparison 1 Umbilical artery Doppler ultrasound versus no Doppler ultrasound, Outcome 26 Abnormal neurological development at 9 months (not prespecified).
Comparison 1 Umbilical artery Doppler ultrasound versus no Doppler ultrasound, Outcome 27 Hospitalisation for IUGR neonatal (not prespecified).
Comparison 1 Umbilical artery Doppler ultrasound versus no Doppler ultrasound, Outcome 28 Fetal distress in labour (not prespecified).
Comparison 1 Umbilical artery Doppler ultrasound versus no Doppler ultrasound, Outcome 29 Birthweight < 5 percentile (not prespecified).
Comparison 1 Umbilical artery Doppler ultrasound versus no Doppler ultrasound, Outcome 30 Periventricular leucomalacia (not prespecified).
Comparison 1 Umbilical artery Doppler ultrasound versus no Doppler ultrasound, Outcome 31 Antenatal hospital stay (days) (not prespecified).
Comparison 2 Umbilical artery Doppler ultrasound versus no Doppler ultrasound (all subgroups), Outcome 1 Any perinatal death after randomisation.
Comparison 2 Umbilical artery Doppler ultrasound versus no Doppler ultrasound (all subgroups), Outcome 2 Serious neonatal morbidity.
Comparison 3 Umbilical artery Doppler ultrasound alone versus CTG alone, Outcome 1 Any perinatal death after randomisation.
Comparison 3 Umbilical artery Doppler ultrasound alone versus CTG alone, Outcome 2 Stillbirth.
Comparison 3 Umbilical artery Doppler ultrasound alone versus CTG alone, Outcome 3 Neonatal death.
Comparison 3 Umbilical artery Doppler ultrasound alone versus CTG alone, Outcome 4 Any potentially preventable perinatal death*.
Comparison 3 Umbilical artery Doppler ultrasound alone versus CTG alone, Outcome 5 Apgar < 7 at 5 minutes.
Comparison 3 Umbilical artery Doppler ultrasound alone versus CTG alone, Outcome 6 Caesarean section (elective and emergency).
Comparison 3 Umbilical artery Doppler ultrasound alone versus CTG alone, Outcome 7 Caesarean section ‐ elective.
Comparison 3 Umbilical artery Doppler ultrasound alone versus CTG alone, Outcome 8 Caesarean section ‐ emergency.
Comparison 3 Umbilical artery Doppler ultrasound alone versus CTG alone, Outcome 9 Spontaneous vaginal birth.
Comparison 3 Umbilical artery Doppler ultrasound alone versus CTG alone, Outcome 10 Operative vaginal birth.
Comparison 3 Umbilical artery Doppler ultrasound alone versus CTG alone, Outcome 11 Induction of labour.
Comparison 3 Umbilical artery Doppler ultrasound alone versus CTG alone, Outcome 12 Infant requiring intubation/ventilation.
Comparison 3 Umbilical artery Doppler ultrasound alone versus CTG alone, Outcome 13 Neonatal fitting/seizures.
Comparison 3 Umbilical artery Doppler ultrasound alone versus CTG alone, Outcome 14 Gestational age at birth.
Comparison 3 Umbilical artery Doppler ultrasound alone versus CTG alone, Outcome 15 Neonatal admission to SCBU and/or NICU.
Comparison 3 Umbilical artery Doppler ultrasound alone versus CTG alone, Outcome 16 Infant birthweight (grams).
Comparison 3 Umbilical artery Doppler ultrasound alone versus CTG alone, Outcome 17 Length of infant hospital stay (days).
Comparison 3 Umbilical artery Doppler ultrasound alone versus CTG alone, Outcome 18 Antenatal admissions (not prespecified).
Comparison 3 Umbilical artery Doppler ultrasound alone versus CTG alone, Outcome 19 Phototherapy for neonatal jaundice (not prespecified).
Comparison 3 Umbilical artery Doppler ultrasound alone versus CTG alone, Outcome 20 Antenatal hospital stay (days) (not prespecified).
Comparison 4 Umbilical artery Doppler ultrasound alone versus CTG alone (all subgroups), Outcome 1 Any perinatal death after randomisation.
Comparison 5 Early ductus venosus Doppler ultrasound versus CTG, Outcome 1 Any perinatal death after randomisation.
Comparison 5 Early ductus venosus Doppler ultrasound versus CTG, Outcome 2 Survival following severe neonatal morbidity.
Comparison 5 Early ductus venosus Doppler ultrasound versus CTG, Outcome 3 Stillbirth.
Comparison 5 Early ductus venosus Doppler ultrasound versus CTG, Outcome 4 Neonatal death.
Comparison 5 Early ductus venosus Doppler ultrasound versus CTG, Outcome 5 Any potentially preventable perinatal death*.
Comparison 5 Early ductus venosus Doppler ultrasound versus CTG, Outcome 6 Fetal acidosis.
Comparison 5 Early ductus venosus Doppler ultrasound versus CTG, Outcome 7 Apgar < 7 at 5 minutes.
Comparison 5 Early ductus venosus Doppler ultrasound versus CTG, Outcome 8 Infant requiring intubation/ventilation.
Comparison 5 Early ductus venosus Doppler ultrasound versus CTG, Outcome 9 Intraventricular haemorrhage.
Comparison 5 Early ductus venosus Doppler ultrasound versus CTG, Outcome 10 Bronchopulmonary dysplasia.
Comparison 5 Early ductus venosus Doppler ultrasound versus CTG, Outcome 11 Necrotising enterocolitis.
Comparison 5 Early ductus venosus Doppler ultrasound versus CTG, Outcome 12 Infant birthweight (grams).
Comparison 5 Early ductus venosus Doppler ultrasound versus CTG, Outcome 13 Long‐term infant neurodevelopmental outcome (impairment at 2 years).
Comparison 5 Early ductus venosus Doppler ultrasound versus CTG, Outcome 14 Long‐term infant neurodevelopmental outcome (cerebral palsy at 2 years).
Comparison 5 Early ductus venosus Doppler ultrasound versus CTG, Outcome 15 Infant survival at 2 years without neurodevelopmental impairment (not prespecified).
Comparison 5 Early ductus venosus Doppler ultrasound versus CTG, Outcome 16 Sepsis (proven) (not prespecified).
Comparison 6 Late ductus venosus Doppler ultrasound versus CTG, Outcome 1 Any perinatal death after randomisation.
Comparison 6 Late ductus venosus Doppler ultrasound versus CTG, Outcome 2 Survival following severe neonatal morbidity.
Comparison 6 Late ductus venosus Doppler ultrasound versus CTG, Outcome 3 Stillbirth.
Comparison 6 Late ductus venosus Doppler ultrasound versus CTG, Outcome 4 Neonatal death.
Comparison 6 Late ductus venosus Doppler ultrasound versus CTG, Outcome 5 Any potentially preventable perinatal death*.
Comparison 6 Late ductus venosus Doppler ultrasound versus CTG, Outcome 6 Fetal acidosis.
Comparison 6 Late ductus venosus Doppler ultrasound versus CTG, Outcome 7 Apgar < 7 at 5 minutes.
Comparison 6 Late ductus venosus Doppler ultrasound versus CTG, Outcome 8 Infant requiring intubation/ventilation.
Comparison 6 Late ductus venosus Doppler ultrasound versus CTG, Outcome 9 Intraventricular haemorrhage.
Comparison 6 Late ductus venosus Doppler ultrasound versus CTG, Outcome 10 Bronchopulmonary dysplasia.
Comparison 6 Late ductus venosus Doppler ultrasound versus CTG, Outcome 11 Necrotising enterocolitis.
Comparison 6 Late ductus venosus Doppler ultrasound versus CTG, Outcome 12 Infant birthweight (grams).
Comparison 6 Late ductus venosus Doppler ultrasound versus CTG, Outcome 13 Long‐term infant neurodevelopmental outcome (impairment at 2 years).
Comparison 6 Late ductus venosus Doppler ultrasound versus CTG, Outcome 14 Long‐term infant neurodevelopmental outcome (cerebral palsy at 2 years).
Comparison 6 Late ductus venosus Doppler ultrasound versus CTG, Outcome 15 Infant survival at 2 years without neurodevelopmental impairment (not prespecified).
Comparison 6 Late ductus venosus Doppler ultrasound versus CTG, Outcome 16 Sepsis (proven) (not prespecified).
Comparison 7 Early ductus venosus Doppler ultrasound versus late, Outcome 1 Any perinatal death after randomisation.
Comparison 7 Early ductus venosus Doppler ultrasound versus late, Outcome 2 Survival following severe neonatal morbidity.
Comparison 7 Early ductus venosus Doppler ultrasound versus late, Outcome 3 Stillbirth.
Comparison 7 Early ductus venosus Doppler ultrasound versus late, Outcome 4 Neonatal death.
Comparison 7 Early ductus venosus Doppler ultrasound versus late, Outcome 5 Any potentially preventable perinatal death*.
Comparison 7 Early ductus venosus Doppler ultrasound versus late, Outcome 6 Fetal acidosis.
Comparison 7 Early ductus venosus Doppler ultrasound versus late, Outcome 7 Apgar < 7 at 5 minutes.
Comparison 7 Early ductus venosus Doppler ultrasound versus late, Outcome 8 Infant requiring intubation/ventilation.
Comparison 7 Early ductus venosus Doppler ultrasound versus late, Outcome 9 Intraventricular haemorrhage.
Comparison 7 Early ductus venosus Doppler ultrasound versus late, Outcome 10 Bronchopulmonary dysplasia.
Comparison 7 Early ductus venosus Doppler ultrasound versus late, Outcome 11 Necrotising enterocolitis.
Comparison 7 Early ductus venosus Doppler ultrasound versus late, Outcome 12 Infant birthweight (grams).
Comparison 7 Early ductus venosus Doppler ultrasound versus late, Outcome 13 Long‐term infant neurodevelopmental outcome (impairment at 2 years).
Comparison 7 Early ductus venosus Doppler ultrasound versus late, Outcome 14 Long‐term infant neurodevelopmental outcome (cerebral palsy at 2 years).
Comparison 7 Early ductus venosus Doppler ultrasound versus late, Outcome 15 Infant survival at 2 years without neurodevelopmental impairment (not prespecified).
Comparison 7 Early ductus venosus Doppler ultrasound versus late, Outcome 16 Sepsis (proven) (not prespecified).
| Umbilical artery Doppler ultrasound compared to no Doppler ultrasound in high‐risk pregnancies | ||||||
| Patient or population: pregnant women at increased risk of fetal complications | ||||||
| Outcomes | Anticipated absolute effects* (95% CI) | Relative effect | № of participants | Quality of the evidence | Comments | |
| Risk with no Doppler ultrasound | Risk with umbilical artery Doppler ultrasound | |||||
| Any perinatal death after randomisation | Study population | RR 0.71 | 10225 | ⊕⊕⊕⊝ | ||
| 17 per 1000 | 12 per 1000 | |||||
| Serious neonatal morbidity | Study population | 1098 | ⊕⊝⊝⊝ | We did not pool the data for this outcome due to high heterogeneity (the direction of effect in the 2 studies contributing data were not consistent). | ||
| Stillbirth | Study population | RR 0.65 | 9560 | ⊕⊕⊝⊝ | ||
| 9 per 1000 | 6 per 1000 | |||||
| Apgar < 7 at 5 minutes | Study population | RR 0.92 | 6321 | ⊕⊕⊝⊝ | ||
| 29 per 1000 | 26 per 1000 | |||||
| Caesarean section (elective and emergency) | Study population | RR 0.90 | 7918 | ⊕⊕⊕⊝ | ||
| 263 per 1000 | 237 per 1000 | |||||
| Induction of labour | Study population | RR 0.89 | 5633 | ⊕⊕⊕⊝ | ||
| 334 per 1000 | 298 per 1000 | |||||
| Long‐term infant neurodevelopmental outcome (impairment at 2 years) | Study population | ‐ | (0 studies) | ‐ | There has been no comparative long‐term follow‐up of babies exposed to Doppler ultrasound in pregnancy in women at increased risk of complications. | |
| see comment | see comment | |||||
| *The risk in the intervention group (and its 95% confidence interval) is based on the assumed risk in the comparison group and the relative effect of the intervention (and its 95% CI). | ||||||
| GRADE Working Group grades of evidence | ||||||
| 1 All studies assessed as having design limitations due to lack of information. 2 Although there was some evidence of funnel plot asymmetry suggesting small‐study effect (with studies with smaller sample sizes appearing to have a more pronounced effect), we did not downgrade for publication bias because, for our selected outcomes, individual studies did not reach statistical significance and there was low heterogeneity across all studies for this outcome. 3 High heterogeneity (I² statistic 76%) with direction of effect different in the 2 studies contributing data. 4 95% CI crossing the line of no effect. Low event rate. 5 Wide 95% CI crossing the line of no effect. | ||||||
| Outcome or subgroup title | No. of studies | No. of participants | Statistical method | Effect size |
| 1 Any perinatal death after randomisation Show forest plot | 16 | 10225 | Risk Ratio (M‐H, Fixed, 95% CI) | 0.71 [0.52, 0.98] |
| 1.1 Singleton pregnancy | 9 | 4661 | Risk Ratio (M‐H, Fixed, 95% CI) | 0.59 [0.35, 1.01] |
| 1.2 Multiple pregnancy | 1 | 1052 | Risk Ratio (M‐H, Fixed, 95% CI) | 0.88 [0.32, 2.41] |
| 1.3 Singleton plus multiple pregnancies, or not stated | 6 | 4512 | Risk Ratio (M‐H, Fixed, 95% CI) | 0.78 [0.51, 1.19] |
| 2 Serious neonatal morbidity Show forest plot | 3 | Risk Ratio (M‐H, Random, 95% CI) | Subtotals only | |
| 2.1 Singleton pregnancy | 1 | 500 | Risk Ratio (M‐H, Random, 95% CI) | 0.13 [0.02, 0.99] |
| 2.2 Multiple pregnancy | 0 | 0 | Risk Ratio (M‐H, Random, 95% CI) | 0.0 [0.0, 0.0] |
| 2.3 Singleton plus multiple pregnancies, or not stated | 2 | 598 | Risk Ratio (M‐H, Random, 95% CI) | 2.95 [0.31, 28.14] |
| 3 Stillbirth Show forest plot | 15 | 9560 | Risk Ratio (M‐H, Fixed, 95% CI) | 0.65 [0.41, 1.04] |
| 3.1 Singleton pregnancy | 8 | 3996 | Risk Ratio (M‐H, Fixed, 95% CI) | 0.61 [0.31, 1.19] |
| 3.2 Multiple pregnancy | 1 | 1052 | Risk Ratio (M‐H, Fixed, 95% CI) | 0.67 [0.11, 4.00] |
| 3.3 Singleton plus multiple pregnancy, or not stated | 6 | 4512 | Risk Ratio (M‐H, Fixed, 95% CI) | 0.70 [0.35, 1.39] |
| 4 Neonatal death Show forest plot | 13 | 8167 | Risk Ratio (M‐H, Fixed, 95% CI) | 0.81 [0.53, 1.24] |
| 4.1 Singleton pregnancy | 7 | 2656 | Risk Ratio (M‐H, Fixed, 95% CI) | 0.69 [0.31, 1.53] |
| 4.2 Multiple pregnancy | 1 | 1052 | Risk Ratio (M‐H, Fixed, 95% CI) | 1.01 [0.29, 3.46] |
| 4.3 Singleton plus multiple pregnancies, or not stated | 5 | 4459 | Risk Ratio (M‐H, Fixed, 95% CI) | 0.84 [0.48, 1.45] |
| 5 Any potentially preventable perinatal death* Show forest plot | 16 | 10225 | Risk Ratio (M‐H, Fixed, 95% CI) | 0.67 [0.46, 0.98] |
| 5.1 Singleton pregnancy | 9 | 4661 | Risk Ratio (M‐H, Fixed, 95% CI) | 0.58 [0.30, 1.13] |
| 5.2 Multiple pregnancy | 1 | 1052 | Risk Ratio (M‐H, Fixed, 95% CI) | 0.88 [0.32, 2.41] |
| 5.3 Singleton plus multiple pregnancies or not stated | 6 | 4512 | Risk Ratio (M‐H, Fixed, 95% CI) | 0.69 [0.41, 1.15] |
| 6 Apgar < 7 at 5 minutes Show forest plot | 7 | 6321 | Risk Ratio (M‐H, Fixed, 95% CI) | 0.92 [0.69, 1.24] |
| 6.1 Singleton pregnancy | 4 | 2555 | Risk Ratio (M‐H, Fixed, 95% CI) | 0.70 [0.45, 1.09] |
| 6.2 Multiple pregnancy | 0 | 0 | Risk Ratio (M‐H, Fixed, 95% CI) | 0.0 [0.0, 0.0] |
| 6.3 Singleton plus multiple pregnancies or not stated | 3 | 3766 | Risk Ratio (M‐H, Fixed, 95% CI) | 1.16 [0.77, 1.73] |
| 7 Caesarean section (elective and emergency) Show forest plot | 14 | 7918 | Risk Ratio (M‐H, Fixed, 95% CI) | 0.90 [0.84, 0.97] |
| 7.1 Singleton pregnancy | 7 | 2929 | Risk Ratio (M‐H, Fixed, 95% CI) | 0.84 [0.75, 0.95] |
| 7.2 Multiple pregnancy | 1 | 526 | Risk Ratio (M‐H, Fixed, 95% CI) | 0.96 [0.77, 1.19] |
| 7.3 Singleton plus multiple pregnancies or not stated | 6 | 4463 | Risk Ratio (M‐H, Fixed, 95% CI) | 0.94 [0.84, 1.05] |
| 8 Caesarean section ‐ elective Show forest plot | 11 | 6627 | Risk Ratio (M‐H, Fixed, 95% CI) | 1.07 [0.93, 1.22] |
| 8.1 Singleton pregnancy | 6 | 1934 | Risk Ratio (M‐H, Fixed, 95% CI) | 1.11 [0.90, 1.38] |
| 8.2 Multiple pregnancy | 1 | 526 | Risk Ratio (M‐H, Fixed, 95% CI) | 1.06 [0.77, 1.47] |
| 8.3 Singleton plus multiple pregnancies or not stated | 4 | 4167 | Risk Ratio (M‐H, Fixed, 95% CI) | 1.03 [0.84, 1.26] |
| 9 Caesarean section ‐ emergency Show forest plot | 10 | 6175 | Risk Ratio (M‐H, Random, 95% CI) | 0.81 [0.67, 0.98] |
| 9.1 Singleton pregnancy | 5 | 1482 | Risk Ratio (M‐H, Random, 95% CI) | 0.58 [0.43, 0.78] |
| 9.2 Multiple pregnancy | 1 | 526 | Risk Ratio (M‐H, Random, 95% CI) | 0.84 [0.57, 1.23] |
| 9.3 Singleton plus multiple pregnancies or not stated | 4 | 4167 | Risk Ratio (M‐H, Random, 95% CI) | 0.96 [0.77, 1.20] |
| 10 Spontaneous vaginal birth Show forest plot | 5 | 2504 | Risk Ratio (M‐H, Fixed, 95% CI) | 1.04 [0.98, 1.10] |
| 10.1 Singleton pregnancy | 2 | 576 | Risk Ratio (M‐H, Fixed, 95% CI) | 1.07 [0.96, 1.18] |
| 10.2 Multiple pregnancy | 1 | 526 | Risk Ratio (M‐H, Fixed, 95% CI) | 1.03 [0.90, 1.19] |
| 10.3 Singleton plus multiple pregnancies or not stated | 2 | 1402 | Risk Ratio (M‐H, Fixed, 95% CI) | 1.03 [0.95, 1.12] |
| 11 Operative vaginal birth Show forest plot | 4 | 2813 | Risk Ratio (M‐H, Fixed, 95% CI) | 0.95 [0.80, 1.14] |
| 11.1 Singleton pregnancy | 3 | 1916 | Risk Ratio (M‐H, Fixed, 95% CI) | 0.97 [0.78, 1.22] |
| 11.2 Multiple pregnancy | 0 | 0 | Risk Ratio (M‐H, Fixed, 95% CI) | 0.0 [0.0, 0.0] |
| 11.3 Singleton plus multiple pregnancies or not stated | 1 | 897 | Risk Ratio (M‐H, Fixed, 95% CI) | 0.92 [0.68, 1.25] |
| 12 Induction of labour Show forest plot | 10 | 5633 | Risk Ratio (M‐H, Random, 95% CI) | 0.89 [0.80, 0.99] |
| 12.1 Singleton pregnancy | 5 | 1784 | Risk Ratio (M‐H, Random, 95% CI) | 0.79 [0.64, 0.97] |
| 12.2 Multiple pregnancy | 1 | 526 | Risk Ratio (M‐H, Random, 95% CI) | 1.10 [0.80, 1.50] |
| 12.3 Singleton plus multiple pregnancies or not stated | 4 | 3323 | Risk Ratio (M‐H, Random, 95% CI) | 0.95 [0.86, 1.04] |
| 13 Infant requiring intubation/ventilation Show forest plot | 6 | 3136 | Risk Ratio (M‐H, Random, 95% CI) | 1.42 [0.87, 2.30] |
| 13.1 Singleton pregnancy | 4 | 1539 | Risk Ratio (M‐H, Random, 95% CI) | 2.89 [1.40, 5.96] |
| 13.2 Multiple pregnancy | 1 | 1052 | Risk Ratio (M‐H, Random, 95% CI) | 0.86 [0.59, 1.25] |
| 13.3 Singleton plus multiple pregnancies or not stated | 1 | 545 | Risk Ratio (M‐H, Random, 95% CI) | 1.25 [0.79, 1.98] |
| 14 Neonatal fitting/seizures Show forest plot | 1 | 150 | Risk Ratio (M‐H, Fixed, 95% CI) | 0.35 [0.01, 8.49] |
| 14.1 Singleton pregnancy | 1 | 150 | Risk Ratio (M‐H, Fixed, 95% CI) | 0.35 [0.01, 8.49] |
| 14.2 Multiple pregnancy | 0 | 0 | Risk Ratio (M‐H, Fixed, 95% CI) | 0.0 [0.0, 0.0] |
| 14.3 Singleton plus multiple pregnancies or not stated | 0 | 0 | Risk Ratio (M‐H, Fixed, 95% CI) | 0.0 [0.0, 0.0] |
| 15 Preterm labour Show forest plot | 2 | 626 | Risk Ratio (M‐H, Fixed, 95% CI) | 1.12 [0.72, 1.75] |
| 15.1 Singleton pregnancy | 1 | 150 | Risk Ratio (M‐H, Fixed, 95% CI) | 1.03 [0.51, 2.07] |
| 15.2 Multiple pregnancy | 0 | 0 | Risk Ratio (M‐H, Fixed, 95% CI) | 0.0 [0.0, 0.0] |
| 15.3 Singleton plus multiple pregnancy or not stated | 1 | 476 | Risk Ratio (M‐H, Fixed, 95% CI) | 1.18 [0.66, 2.11] |
| 16 Gestational age at birth (weeks) Show forest plot | 8 | 4066 | Mean Difference (IV, Random, 95% CI) | 0.21 [‐0.02, 0.43] |
| 16.1 Singleton pregnancy | 3 | 1043 | Mean Difference (IV, Random, 95% CI) | 0.54 [‐0.00, 1.09] |
| 16.2 Multiple pregnancy | 1 | 1052 | Mean Difference (IV, Random, 95% CI) | 0.10 [‐0.24, 0.44] |
| 16.3 Singleton plus multiple pregnancies or not stated | 4 | 1971 | Mean Difference (IV, Random, 95% CI) | 0.06 [‐0.19, 0.31] |
| 17 Infant respiratory distress syndrome (RDS) Show forest plot | 1 | 107 | Risk Ratio (M‐H, Fixed, 95% CI) | 1.06 [0.07, 16.48] |
| 17.1 Singleton pregnancy | 1 | 107 | Risk Ratio (M‐H, Fixed, 95% CI) | 1.06 [0.07, 16.48] |
| 17.2 Multiple pregnancy | 0 | 0 | Risk Ratio (M‐H, Fixed, 95% CI) | 0.0 [0.0, 0.0] |
| 17.3 Singleton plus multiple pregnancies or not stated | 0 | 0 | Risk Ratio (M‐H, Fixed, 95% CI) | 0.0 [0.0, 0.0] |
| 18 Neonatal admission to SCBU and/or NICU Show forest plot | 12 | 9334 | Risk Ratio (M‐H, Fixed, 95% CI) | 0.95 [0.89, 1.03] |
| 18.1 Singleton pregnancy | 8 | 4511 | Risk Ratio (M‐H, Fixed, 95% CI) | 0.92 [0.80, 1.06] |
| 18.2 Multiple pregnancy | 1 | 1052 | Risk Ratio (M‐H, Fixed, 95% CI) | 0.96 [0.88, 1.05] |
| 18.3 Singleton plus multiple pregnancies or not stated | 3 | 3771 | Risk Ratio (M‐H, Fixed, 95% CI) | 0.98 [0.85, 1.14] |
| 19 Hypoxic ischaemic encephalopathy Show forest plot | 2 | 1045 | Risk Ratio (M‐H, Random, 95% CI) | 0.65 [0.01, 33.07] |
| 19.1 Singleton pregnancy | 1 | 500 | Risk Ratio (M‐H, Random, 95% CI) | 0.09 [0.01, 1.64] |
| 19.2 Multiple pregnancy | 0 | 0 | Risk Ratio (M‐H, Random, 95% CI) | 0.0 [0.0, 0.0] |
| 19.3 Singleton plus multiple pregnancies or not stated | 1 | 545 | Risk Ratio (M‐H, Random, 95% CI) | 4.91 [0.24, 101.79] |
| 20 Intraventricular haemorrhage Show forest plot | 4 | 2008 | Risk Ratio (M‐H, Fixed, 95% CI) | 1.42 [0.47, 4.30] |
| 20.1 Singleton pregnancy | 3 | 1463 | Risk Ratio (M‐H, Fixed, 95% CI) | 1.26 [0.38, 4.16] |
| 20.2 Multiple pregnancy | 0 | 0 | Risk Ratio (M‐H, Fixed, 95% CI) | 0.0 [0.0, 0.0] |
| 20.3 Singleton plus multiple pregnancies or not stated | 1 | 545 | Risk Ratio (M‐H, Fixed, 95% CI) | 2.95 [0.12, 71.99] |
| 21 Birthweight (grams) Show forest plot | 7 | 3887 | Mean Difference (IV, Fixed, 95% CI) | 31.33 [‐8.70, 71.37] |
| 21.1 Singleton pregnancy | 3 | 1916 | Mean Difference (IV, Fixed, 95% CI) | 49.34 [‐0.62, 99.31] |
| 21.2 Multiple pregnancy | 0 | 0 | Mean Difference (IV, Fixed, 95% CI) | 0.0 [0.0, 0.0] |
| 21.3 Singleton plus multiple pregnancies or not stated | 4 | 1971 | Mean Difference (IV, Fixed, 95% CI) | ‐0.95 [‐67.84, 65.95] |
| 22 Length of infant hospital stay (days) Show forest plot | 3 | 1076 | Std. Mean Difference (IV, Fixed, 95% CI) | ‐0.28 [‐0.40, ‐0.16] |
| 22.1 Singleton pregnancy | 3 | 1076 | Std. Mean Difference (IV, Fixed, 95% CI) | ‐0.28 [‐0.40, ‐0.16] |
| 22.2 Multiple pregnancy | 0 | 0 | Std. Mean Difference (IV, Fixed, 95% CI) | 0.0 [0.0, 0.0] |
| 22.3 Singleton plus multiple pregnancies or not stated | 0 | 0 | Std. Mean Difference (IV, Fixed, 95% CI) | 0.0 [0.0, 0.0] |
| 23 Birth < 34 weeks (not prespecified) Show forest plot | 2 | 976 | Risk Ratio (M‐H, Random, 95% CI) | 2.04 [0.62, 6.69] |
| 23.1 Singleton pregnancy | 1 | 500 | Risk Ratio (M‐H, Random, 95% CI) | 1.17 [0.40, 3.42] |
| 23.2 Multiple pregnancy | 0 | 0 | Risk Ratio (M‐H, Random, 95% CI) | 0.0 [0.0, 0.0] |
| 23.3 Singleton plus multiple pregnancies or not stated | 1 | 476 | Risk Ratio (M‐H, Random, 95% CI) | 3.90 [1.11, 13.65] |
| 24 Antenatal admissions (not prespecified) Show forest plot | 2 | 893 | Risk Ratio (M‐H, Fixed, 95% CI) | 0.72 [0.60, 0.88] |
| 24.1 Singleton pregnancy | 2 | 893 | Risk Ratio (M‐H, Fixed, 95% CI) | 0.72 [0.60, 0.88] |
| 24.2 Multiple pregnancy | 0 | 0 | Risk Ratio (M‐H, Fixed, 95% CI) | 0.0 [0.0, 0.0] |
| 24.3 Singleton plus multiple pregnancies or not stated | 0 | 0 | Risk Ratio (M‐H, Fixed, 95% CI) | 0.0 [0.0, 0.0] |
| 25 Phototherapy for neonatal jaundice (not prespecified) Show forest plot | 1 | 150 | Risk Ratio (M‐H, Fixed, 95% CI) | 0.15 [0.01, 2.87] |
| 25.1 Singleton pregnancy | 1 | 150 | Risk Ratio (M‐H, Fixed, 95% CI) | 0.15 [0.01, 2.87] |
| 25.2 Multiple pregnancy | 0 | 0 | Risk Ratio (M‐H, Fixed, 95% CI) | 0.0 [0.0, 0.0] |
| 25.3 Singleton plus multiple pregnancies or not stated | 0 | 0 | Risk Ratio (M‐H, Fixed, 95% CI) | 0.0 [0.0, 0.0] |
| 26 Abnormal neurological development at 9 months (not prespecified) Show forest plot | 1 | 137 | Risk Ratio (M‐H, Fixed, 95% CI) | 0.61 [0.26, 1.45] |
| 26.1 Singleton pregnancy | 1 | 137 | Risk Ratio (M‐H, Fixed, 95% CI) | 0.61 [0.26, 1.45] |
| 26.2 Multiple pregnancy | 0 | 0 | Risk Ratio (M‐H, Fixed, 95% CI) | 0.0 [0.0, 0.0] |
| 26.3 Singleton plus multiple pregnancies or not stated | 0 | 0 | Risk Ratio (M‐H, Fixed, 95% CI) | 0.0 [0.0, 0.0] |
| 27 Hospitalisation for IUGR neonatal (not prespecified) Show forest plot | 1 | 142 | Risk Ratio (M‐H, Fixed, 95% CI) | 1.03 [0.75, 1.41] |
| 27.1 Singleton pregnancy | 1 | 142 | Risk Ratio (M‐H, Fixed, 95% CI) | 1.03 [0.75, 1.41] |
| 27.2 Multiple pregnancy | 0 | 0 | Risk Ratio (M‐H, Fixed, 95% CI) | 0.0 [0.0, 0.0] |
| 27.3 Singleton plus multiple pregnancies or not stated | 0 | 0 | Risk Ratio (M‐H, Fixed, 95% CI) | 0.0 [0.0, 0.0] |
| 28 Fetal distress in labour (not prespecified) Show forest plot | 1 | 289 | Risk Ratio (M‐H, Fixed, 95% CI) | 0.35 [0.10, 1.22] |
| 28.1 Singleton pregnancy | 1 | 289 | Risk Ratio (M‐H, Fixed, 95% CI) | 0.35 [0.10, 1.22] |
| 28.2 Multiple pregnancy | 0 | 0 | Risk Ratio (M‐H, Fixed, 95% CI) | 0.0 [0.0, 0.0] |
| 28.3 Singleton plus multiple pregnancies or not stated | 0 | 0 | Risk Ratio (M‐H, Fixed, 95% CI) | 0.0 [0.0, 0.0] |
| 29 Birthweight < 5 percentile (not prespecified) Show forest plot | 1 | 289 | Risk Ratio (M‐H, Fixed, 95% CI) | 1.16 [0.51, 2.64] |
| 29.1 Singleton pregnancy | 1 | 289 | Risk Ratio (M‐H, Fixed, 95% CI) | 1.16 [0.51, 2.64] |
| 29.2 Multiple pregnancy | 0 | 0 | Risk Ratio (M‐H, Fixed, 95% CI) | 0.0 [0.0, 0.0] |
| 29.3 Singleton plus multiple pregnancies or not stated | 0 | 0 | Risk Ratio (M‐H, Fixed, 95% CI) | 0.0 [0.0, 0.0] |
| 30 Periventricular leucomalacia (not prespecified) Show forest plot | 1 | 545 | Risk Ratio (M‐H, Fixed, 95% CI) | 0.33 [0.01, 8.00] |
| 30.1 Singleton pregnancy | 0 | 0 | Risk Ratio (M‐H, Fixed, 95% CI) | 0.0 [0.0, 0.0] |
| 30.2 Multiple pregnancy | 0 | 0 | Risk Ratio (M‐H, Fixed, 95% CI) | 0.0 [0.0, 0.0] |
| 30.3 Singleton plus multiple pregnancies or not stated | 1 | 545 | Risk Ratio (M‐H, Fixed, 95% CI) | 0.33 [0.01, 8.00] |
| 31 Antenatal hospital stay (days) (not prespecified) Show forest plot | 1 | 426 | Mean Difference (IV, Fixed, 95% CI) | ‐0.60 [‐2.39, 1.19] |
| 31.1 Singleton pregnancy | 1 | 426 | Mean Difference (IV, Fixed, 95% CI) | ‐0.60 [‐2.39, 1.19] |
| 31.2 Multiple pregnancy | 0 | 0 | Mean Difference (IV, Fixed, 95% CI) | 0.0 [0.0, 0.0] |
| 31.3 Singleton plus multiple pregnancies or not stated | 0 | 0 | Mean Difference (IV, Fixed, 95% CI) | 0.0 [0.0, 0.0] |
| Outcome or subgroup title | No. of studies | No. of participants | Statistical method | Effect size |
| 1 Any perinatal death after randomisation Show forest plot | 6 | Risk Ratio (M‐H, Fixed, 95% CI) | Subtotals only | |
| 1.1 SGA/IUGR | 5 | 1292 | Risk Ratio (M‐H, Fixed, 95% CI) | 0.72 [0.38, 1.35] |
| 1.2 Hypertension/pre‐eclampsia | 1 | 89 | Risk Ratio (M‐H, Fixed, 95% CI) | 3.57 [0.42, 30.73] |
| 1.3 Diabetes | 0 | 0 | Risk Ratio (M‐H, Fixed, 95% CI) | 0.0 [0.0, 0.0] |
| 1.4 Prolonged pregnancy | 0 | 0 | Risk Ratio (M‐H, Fixed, 95% CI) | 0.0 [0.0, 0.0] |
| 1.5 Previous pregnancy loss | 1 | 53 | Risk Ratio (M‐H, Fixed, 95% CI) | 0.26 [0.03, 2.17] |
| 2 Serious neonatal morbidity Show forest plot | 1 | 53 | Risk Ratio (M‐H, Random, 95% CI) | 0.0 [0.0, 0.0] |
| 2.1 SGA/IUGR | 0 | 0 | Risk Ratio (M‐H, Random, 95% CI) | 0.0 [0.0, 0.0] |
| 2.2 Hypertension/pre‐eclampsia | 0 | 0 | Risk Ratio (M‐H, Random, 95% CI) | 0.0 [0.0, 0.0] |
| 2.3 Diabetes | 0 | 0 | Risk Ratio (M‐H, Random, 95% CI) | 0.0 [0.0, 0.0] |
| 2.4 Prolonged pregnancy | 0 | 0 | Risk Ratio (M‐H, Random, 95% CI) | 0.0 [0.0, 0.0] |
| 2.5 Previous pregnancy loss | 1 | 53 | Risk Ratio (M‐H, Random, 95% CI) | 0.0 [0.0, 0.0] |
| Outcome or subgroup title | No. of studies | No. of participants | Statistical method | Effect size |
| 1 Any perinatal death after randomisation Show forest plot | 4 | 2813 | Risk Ratio (M‐H, Fixed, 95% CI) | 0.45 [0.17, 1.15] |
| 1.1 Singleton pregnancy | 3 | 1916 | Risk Ratio (M‐H, Fixed, 95% CI) | 0.34 [0.07, 1.68] |
| 1.2 Multiple pregnancy | 0 | 0 | Risk Ratio (M‐H, Fixed, 95% CI) | 0.0 [0.0, 0.0] |
| 1.3 Singleton plus multiple pregnancies or not stated | 1 | 897 | Risk Ratio (M‐H, Fixed, 95% CI) | 0.52 [0.16, 1.73] |
| 2 Stillbirth Show forest plot | 4 | 2813 | Risk Ratio (M‐H, Fixed, 95% CI) | 0.48 [0.14, 1.71] |
| 2.1 Singleton pregnancy | 3 | 1916 | Risk Ratio (M‐H, Fixed, 95% CI) | 0.28 [0.05, 1.70] |
| 2.2 Multiple pregnancy | 0 | 0 | Risk Ratio (M‐H, Fixed, 95% CI) | 0.0 [0.0, 0.0] |
| 2.3 Singleton plus multiple pregnancies or not stated | 1 | 897 | Risk Ratio (M‐H, Fixed, 95% CI) | 1.05 [0.15, 7.41] |
| 3 Neonatal death Show forest plot | 3 | 1473 | Risk Ratio (M‐H, Fixed, 95% CI) | 0.52 [0.16, 1.72] |
| 3.1 Singleton pregnancy | 2 | 576 | Risk Ratio (M‐H, Fixed, 95% CI) | 1.02 [0.15, 7.10] |
| 3.2 Multiple pregnancy | 0 | 0 | Risk Ratio (M‐H, Fixed, 95% CI) | 0.0 [0.0, 0.0] |
| 3.3 Singleton plus multiple pregnancies or not stated | 1 | 897 | Risk Ratio (M‐H, Fixed, 95% CI) | 0.35 [0.07, 1.72] |
| 4 Any potentially preventable perinatal death* Show forest plot | 4 | 2813 | Risk Ratio (M‐H, Fixed, 95% CI) | 0.38 [0.12, 1.18] |
| 4.1 Singleton pregnancy | 3 | 1916 | Risk Ratio (M‐H, Fixed, 95% CI) | 0.41 [0.08, 2.11] |
| 4.2 Multiple pregnancy | 0 | 0 | Risk Ratio (M‐H, Fixed, 95% CI) | 0.0 [0.0, 0.0] |
| 4.3 Singleton plus multiple pregnancies or not stated | 1 | 897 | Risk Ratio (M‐H, Fixed, 95% CI) | 0.35 [0.07, 1.72] |
| 5 Apgar < 7 at 5 minutes Show forest plot | 3 | 2663 | Risk Ratio (M‐H, Fixed, 95% CI) | 0.86 [0.54, 1.37] |
| 5.1 Singleton pregnancy | 2 | 1766 | Risk Ratio (M‐H, Fixed, 95% CI) | 0.83 [0.49, 1.43] |
| 5.2 Multiple pregnancy | 0 | 0 | Risk Ratio (M‐H, Fixed, 95% CI) | 0.0 [0.0, 0.0] |
| 5.3 Singleton plus multiple pregnancies or not stated | 1 | 897 | Risk Ratio (M‐H, Fixed, 95% CI) | 0.93 [0.36, 2.39] |
| 6 Caesarean section (elective and emergency) Show forest plot | 4 | 2813 | Risk Ratio (M‐H, Fixed, 95% CI) | 0.89 [0.79, 1.01] |
| 6.1 Singleton pregnancy | 3 | 1916 | Risk Ratio (M‐H, Fixed, 95% CI) | 0.89 [0.77, 1.02] |
| 6.2 Multiple pregnancy | 0 | 0 | Risk Ratio (M‐H, Fixed, 95% CI) | 0.0 [0.0, 0.0] |
| 6.3 Singleton plus multiple pregnancies or not stated | 1 | 897 | Risk Ratio (M‐H, Fixed, 95% CI) | 0.91 [0.73, 1.14] |
| 7 Caesarean section ‐ elective Show forest plot | 3 | 1473 | Risk Ratio (M‐H, Fixed, 95% CI) | 1.53 [1.12, 2.09] |
| 7.1 Singleton pregnancy | 2 | 576 | Risk Ratio (M‐H, Fixed, 95% CI) | 1.69 [1.07, 2.67] |
| 7.2 Multiple pregnancy | 0 | 0 | Risk Ratio (M‐H, Fixed, 95% CI) | 0.0 [0.0, 0.0] |
| 7.3 Singleton plus multiple pregnancies or not stated | 1 | 897 | Risk Ratio (M‐H, Fixed, 95% CI) | 1.40 [0.91, 2.15] |
| 8 Caesarean section ‐ emergency Show forest plot | 3 | 1473 | Risk Ratio (M‐H, Fixed, 95% CI) | 0.66 [0.52, 0.84] |
| 8.1 Singleton pregnancy | 2 | 576 | Risk Ratio (M‐H, Fixed, 95% CI) | 0.55 [0.36, 0.83] |
| 8.2 Multiple pregnancy | 0 | 0 | Risk Ratio (M‐H, Fixed, 95% CI) | 0.0 [0.0, 0.0] |
| 8.3 Singleton plus multiple pregnancies or not stated | 1 | 897 | Risk Ratio (M‐H, Fixed, 95% CI) | 0.73 [0.55, 0.98] |
| 9 Spontaneous vaginal birth Show forest plot | 2 | 1323 | Risk Ratio (M‐H, Fixed, 95% CI) | 1.06 [0.97, 1.15] |
| 9.1 Singleton pregnancy | 1 | 426 | Risk Ratio (M‐H, Fixed, 95% CI) | 1.04 [0.91, 1.19] |
| 9.2 Multiple pregnancy | 0 | 0 | Risk Ratio (M‐H, Fixed, 95% CI) | 0.0 [0.0, 0.0] |
| 9.3 Singleton plus multiple pregnancies or not stated | 1 | 897 | Risk Ratio (M‐H, Fixed, 95% CI) | 1.06 [0.95, 1.19] |
| 10 Operative vaginal birth Show forest plot | 3 | 2663 | Risk Ratio (M‐H, Fixed, 95% CI) | 0.98 [0.81, 1.17] |
| 10.1 Singleton pregnancy | 2 | 1766 | Risk Ratio (M‐H, Fixed, 95% CI) | 1.01 [0.80, 1.27] |
| 10.2 Multiple pregnancy | 0 | 0 | Risk Ratio (M‐H, Fixed, 95% CI) | 0.0 [0.0, 0.0] |
| 10.3 Singleton plus multiple pregnancies or not stated | 1 | 897 | Risk Ratio (M‐H, Fixed, 95% CI) | 0.92 [0.68, 1.25] |
| 11 Induction of labour Show forest plot | 2 | 576 | Risk Ratio (M‐H, Random, 95% CI) | 0.67 [0.32, 1.40] |
| 11.1 Singleton pregnancy | 2 | 576 | Risk Ratio (M‐H, Random, 95% CI) | 0.67 [0.32, 1.40] |
| 11.2 Multiple pregnancy | 0 | 0 | Risk Ratio (M‐H, Random, 95% CI) | 0.0 [0.0, 0.0] |
| 11.3 Singleton plus multiple pregnancies or not stated | 0 | 0 | Risk Ratio (M‐H, Random, 95% CI) | 0.0 [0.0, 0.0] |
| 12 Infant requiring intubation/ventilation Show forest plot | 2 | 576 | Risk Ratio (M‐H, Fixed, 95% CI) | 1.54 [0.26, 9.08] |
| 12.1 Singleton pregnancy | 2 | 576 | Risk Ratio (M‐H, Fixed, 95% CI) | 1.54 [0.26, 9.08] |
| 12.2 Multiple pregnancy | 0 | 0 | Risk Ratio (M‐H, Fixed, 95% CI) | 0.0 [0.0, 0.0] |
| 12.3 Singleton plus multiple pregnancies or not stated | 0 | 0 | Risk Ratio (M‐H, Fixed, 95% CI) | 0.0 [0.0, 0.0] |
| 13 Neonatal fitting/seizures Show forest plot | 1 | 150 | Risk Ratio (M‐H, Fixed, 95% CI) | 0.35 [0.01, 8.49] |
| 13.1 Singleton pregnancy | 1 | 150 | Risk Ratio (M‐H, Fixed, 95% CI) | 0.35 [0.01, 8.49] |
| 13.2 Multiple pregnancy | 0 | 0 | Risk Ratio (M‐H, Fixed, 95% CI) | 0.0 [0.0, 0.0] |
| 13.3 Singleton plus multiple pregnancies or not stated | 0 | 0 | Risk Ratio (M‐H, Fixed, 95% CI) | 0.0 [0.0, 0.0] |
| 14 Gestational age at birth Show forest plot | 3 | 1473 | Mean Difference (IV, Fixed, 95% CI) | 0.23 [‐0.00, 0.47] |
| 14.1 Singleton pregnancy | 2 | 576 | Mean Difference (IV, Fixed, 95% CI) | 0.26 [‐0.06, 0.59] |
| 14.2 Multiple pregnancy | 0 | 0 | Mean Difference (IV, Fixed, 95% CI) | 0.0 [0.0, 0.0] |
| 14.3 Singleton plus multiple pregnancies or not stated | 1 | 897 | Mean Difference (IV, Fixed, 95% CI) | 0.20 [‐0.15, 0.55] |
| 15 Neonatal admission to SCBU and/or NICU Show forest plot | 4 | 2813 | Risk Ratio (M‐H, Fixed, 95% CI) | 0.87 [0.73, 1.03] |
| 15.1 Singleton pregnancy | 3 | 1916 | Risk Ratio (M‐H, Fixed, 95% CI) | 0.80 [0.64, 0.99] |
| 15.2 Multiple pregnancy | 0 | 0 | Risk Ratio (M‐H, Fixed, 95% CI) | 0.0 [0.0, 0.0] |
| 15.3 Singleton plus multiple pregnancies or not stated | 1 | 897 | Risk Ratio (M‐H, Fixed, 95% CI) | 1.00 [0.73, 1.37] |
| 16 Infant birthweight (grams) Show forest plot | 4 | 2813 | Mean Difference (IV, Fixed, 95% CI) | 38.41 [‐6.14, 82.97] |
| 16.1 Singleton pregnancy | 3 | 1916 | Mean Difference (IV, Fixed, 95% CI) | 49.34 [‐0.62, 99.31] |
| 16.2 Multiple pregnancy | 0 | 0 | Mean Difference (IV, Fixed, 95% CI) | 0.0 [0.0, 0.0] |
| 16.3 Singleton plus multiple pregnancies or not stated | 1 | 897 | Mean Difference (IV, Fixed, 95% CI) | ‐4.0 [‐102.42, 94.42] |
| 17 Length of infant hospital stay (days) Show forest plot | 2 | 576 | Std. Mean Difference (IV, Fixed, 95% CI) | ‐0.25 [‐0.41, ‐0.08] |
| 17.1 Singleton pregnancy | 2 | 576 | Std. Mean Difference (IV, Fixed, 95% CI) | ‐0.25 [‐0.41, ‐0.08] |
| 17.2 Multiple pregnancy | 0 | 0 | Std. Mean Difference (IV, Fixed, 95% CI) | 0.0 [0.0, 0.0] |
| 17.3 Singleton plus multiple pregnancies or not stated | 0 | 0 | Std. Mean Difference (IV, Fixed, 95% CI) | 0.0 [0.0, 0.0] |
| 18 Antenatal admissions (not prespecified) Show forest plot | 1 | 426 | Risk Ratio (M‐H, Fixed, 95% CI) | 0.70 [0.55, 0.90] |
| 18.1 Singleton pregnancy | 1 | 426 | Risk Ratio (M‐H, Fixed, 95% CI) | 0.70 [0.55, 0.90] |
| 18.2 Multiple pregnancy | 0 | 0 | Risk Ratio (M‐H, Fixed, 95% CI) | 0.0 [0.0, 0.0] |
| 18.3 Singleton plus multiple pregnancies or not stated | 0 | 0 | Risk Ratio (M‐H, Fixed, 95% CI) | 0.0 [0.0, 0.0] |
| 19 Phototherapy for neonatal jaundice (not prespecified) Show forest plot | 1 | 150 | Risk Ratio (M‐H, Fixed, 95% CI) | 0.15 [0.01, 2.87] |
| 19.1 Singleton pregnancy | 1 | 150 | Risk Ratio (M‐H, Fixed, 95% CI) | 0.15 [0.01, 2.87] |
| 19.2 Multiple pregnancy | 0 | 0 | Risk Ratio (M‐H, Fixed, 95% CI) | 0.0 [0.0, 0.0] |
| 19.3 Singleton plus multiple pregnancies or not stated | 0 | 0 | Risk Ratio (M‐H, Fixed, 95% CI) | 0.0 [0.0, 0.0] |
| 20 Antenatal hospital stay (days) (not prespecified) Show forest plot | 1 | 426 | Mean Difference (IV, Fixed, 95% CI) | ‐0.60 [‐2.39, 1.19] |
| 20.1 Singleton pregnancy | 1 | 426 | Mean Difference (IV, Fixed, 95% CI) | ‐0.60 [‐2.39, 1.19] |
| 20.2 Multiple pregnancy | 0 | 0 | Mean Difference (IV, Fixed, 95% CI) | 0.0 [0.0, 0.0] |
| 20.3 Singleton plus multiple pregnancies or not stated | 0 | 0 | Mean Difference (IV, Fixed, 95% CI) | 0.0 [0.0, 0.0] |
| Outcome or subgroup title | No. of studies | No. of participants | Statistical method | Effect size |
| 1 Any perinatal death after randomisation Show forest plot | 3 | Risk Ratio (M‐H, Fixed, 95% CI) | Subtotals only | |
| 1.1 SGA/IUGR | 2 | 572 | Risk Ratio (M‐H, Fixed, 95% CI) | 0.33 [0.05, 2.09] |
| 1.2 Hypertension/pre‐eclampsia | 1 | 89 | Risk Ratio (M‐H, Fixed, 95% CI) | 3.57 [0.42, 30.73] |
| 1.3 Diabetes | 0 | 0 | Risk Ratio (M‐H, Fixed, 95% CI) | 0.0 [0.0, 0.0] |
| 1.4 Prolonged pregnancy | 0 | 0 | Risk Ratio (M‐H, Fixed, 95% CI) | 0.0 [0.0, 0.0] |
| 1.5 Previous pregnancy loss | 0 | 0 | Risk Ratio (M‐H, Fixed, 95% CI) | 0.0 [0.0, 0.0] |
| Outcome or subgroup title | No. of studies | No. of participants | Statistical method | Effect size |
| 1 Any perinatal death after randomisation Show forest plot | 1 | 333 | Risk Ratio (M‐H, Fixed, 95% CI) | 0.84 [0.39, 1.82] |
| 1.1 Singleton pregnancy | 1 | 333 | Risk Ratio (M‐H, Fixed, 95% CI) | 0.84 [0.39, 1.82] |
| 2 Survival following severe neonatal morbidity Show forest plot | 1 | 333 | Risk Ratio (M‐H, Fixed, 95% CI) | 1.10 [0.75, 1.61] |
| 3 Stillbirth Show forest plot | 1 | 333 | Risk Ratio (M‐H, Fixed, 95% CI) | 1.99 [0.37, 10.71] |
| 3.1 Singleton pregnancy | 1 | 333 | Risk Ratio (M‐H, Fixed, 95% CI) | 1.99 [0.37, 10.71] |
| 4 Neonatal death Show forest plot | 1 | 333 | Risk Ratio (M‐H, Fixed, 95% CI) | 0.60 [0.22, 1.60] |
| 4.1 Singleton pregnancy | 1 | 333 | Risk Ratio (M‐H, Fixed, 95% CI) | 0.60 [0.22, 1.60] |
| 5 Any potentially preventable perinatal death* Show forest plot | 1 | 333 | Risk Ratio (M‐H, Fixed, 95% CI) | 0.83 [0.37, 1.86] |
| 5.1 Singleton pregnancy | 1 | 333 | Risk Ratio (M‐H, Fixed, 95% CI) | 0.83 [0.37, 1.86] |
| 6 Fetal acidosis Show forest plot | 1 | 333 | Risk Ratio (M‐H, Fixed, 95% CI) | 0.25 [0.03, 2.20] |
| 6.1 Singleton pregnancy | 1 | 333 | Risk Ratio (M‐H, Fixed, 95% CI) | 0.25 [0.03, 2.20] |
| 7 Apgar < 7 at 5 minutes Show forest plot | 1 | 333 | Risk Ratio (M‐H, Fixed, 95% CI) | 0.87 [0.44, 1.72] |
| 7.1 Singleton pregnancy | 1 | 333 | Risk Ratio (M‐H, Fixed, 95% CI) | 0.87 [0.44, 1.72] |
| 8 Infant requiring intubation/ventilation Show forest plot | 1 | 333 | Risk Ratio (M‐H, Random, 95% CI) | 0.87 [0.67, 1.13] |
| 8.1 Singleton pregnancy | 1 | 333 | Risk Ratio (M‐H, Random, 95% CI) | 0.87 [0.67, 1.13] |
| 9 Intraventricular haemorrhage Show forest plot | 1 | 333 | Risk Ratio (M‐H, Fixed, 95% CI) | 8.95 [0.49, 164.87] |
| 9.1 Singleton pregnancy | 1 | 333 | Risk Ratio (M‐H, Fixed, 95% CI) | 8.95 [0.49, 164.87] |
| 10 Bronchopulmonary dysplasia Show forest plot | 1 | 333 | Risk Ratio (M‐H, Fixed, 95% CI) | 0.87 [0.55, 1.38] |
| 10.1 Singleton pregnancy | 1 | 333 | Risk Ratio (M‐H, Fixed, 95% CI) | 0.87 [0.55, 1.38] |
| 11 Necrotising enterocolitis Show forest plot | 1 | 333 | Risk Ratio (M‐H, Fixed, 95% CI) | 0.33 [0.03, 3.15] |
| 11.1 Singleton pregnancy | 1 | 333 | Risk Ratio (M‐H, Fixed, 95% CI) | 0.33 [0.03, 3.15] |
| 12 Infant birthweight (grams) Show forest plot | 1 | 333 | Mean Difference (IV, Fixed, 95% CI) | 38.0 [‐31.53, 107.53] |
| 12.1 Singleton pregnancy | 1 | 333 | Mean Difference (IV, Fixed, 95% CI) | 38.0 [‐31.53, 107.53] |
| 13 Long‐term infant neurodevelopmental outcome (impairment at 2 years) Show forest plot | 1 | 333 | Risk Ratio (M‐H, Fixed, 95% CI) | 0.60 [0.30, 1.18] |
| 13.1 Singleton pregnancy | 1 | 333 | Risk Ratio (M‐H, Fixed, 95% CI) | 0.60 [0.30, 1.18] |
| 14 Long‐term infant neurodevelopmental outcome (cerebral palsy at 2 years) Show forest plot | 1 | 333 | Risk Ratio (M‐H, Fixed, 95% CI) | 0.20 [0.02, 1.68] |
| 14.1 Singleton pregnancy | 1 | 333 | Risk Ratio (M‐H, Fixed, 95% CI) | 0.20 [0.02, 1.68] |
| 15 Infant survival at 2 years without neurodevelopmental impairment (not prespecified) Show forest plot | 1 | 333 | Risk Ratio (M‐H, Fixed, 95% CI) | 1.07 [0.92, 1.23] |
| 15.1 Singleton pregnancy | 1 | 333 | Risk Ratio (M‐H, Fixed, 95% CI) | 1.07 [0.92, 1.23] |
| 16 Sepsis (proven) (not prespecified) Show forest plot | 1 | 333 | Risk Ratio (M‐H, Fixed, 95% CI) | 0.93 [0.60, 1.45] |
| 16.1 Singleton pregnancy | 1 | 333 | Risk Ratio (M‐H, Fixed, 95% CI) | 0.93 [0.60, 1.45] |
| Outcome or subgroup title | No. of studies | No. of participants | Statistical method | Effect size |
| 1 Any perinatal death after randomisation Show forest plot | 1 | 336 | Risk Ratio (M‐H, Fixed, 95% CI) | 1.28 [0.64, 2.55] |
| 1.1 Singleton pregnancy | 1 | 336 | Risk Ratio (M‐H, Fixed, 95% CI) | 1.28 [0.64, 2.55] |
| 2 Survival following severe neonatal morbidity Show forest plot | 1 | 336 | Risk Ratio (M‐H, Fixed, 95% CI) | 0.98 [0.66, 1.45] |
| 3 Stillbirth Show forest plot | 1 | 336 | Risk Ratio (M‐H, Fixed, 95% CI) | 2.93 [0.60, 14.31] |
| 3.1 Singleton pregnancy | 1 | 336 | Risk Ratio (M‐H, Fixed, 95% CI) | 2.93 [0.60, 14.31] |
| 4 Neonatal death Show forest plot | 1 | 336 | Risk Ratio (M‐H, Fixed, 95% CI) | 1.07 [0.47, 2.46] |
| 4.1 Singleton pregnancy | 1 | 336 | Risk Ratio (M‐H, Fixed, 95% CI) | 1.07 [0.47, 2.46] |
| 5 Any potentially preventable perinatal death* Show forest plot | 1 | 336 | Risk Ratio (M‐H, Fixed, 95% CI) | 1.22 [0.59, 2.53] |
| 5.1 Singleton pregnancy | 1 | 336 | Risk Ratio (M‐H, Fixed, 95% CI) | 1.22 [0.59, 2.53] |
| 6 Fetal acidosis Show forest plot | 1 | 336 | Risk Ratio (M‐H, Fixed, 95% CI) | 0.11 [0.01, 2.00] |
| 6.1 Singleton pregnancy | 1 | 336 | Risk Ratio (M‐H, Fixed, 95% CI) | 0.11 [0.01, 2.00] |
| 7 Apgar < 7 at 5 minutes Show forest plot | 1 | 336 | Risk Ratio (M‐H, Fixed, 95% CI) | 1.28 [0.69, 2.37] |
| 7.1 Singleton pregnancy | 1 | 336 | Risk Ratio (M‐H, Fixed, 95% CI) | 1.28 [0.69, 2.37] |
| 8 Infant requiring intubation/ventilation Show forest plot | 1 | 336 | Risk Ratio (M‐H, Random, 95% CI) | 0.94 [0.73, 1.20] |
| 8.1 Singleton pregnancy | 1 | 336 | Risk Ratio (M‐H, Random, 95% CI) | 0.94 [0.73, 1.20] |
| 9 Intraventricular haemorrhage Show forest plot | 1 | 336 | Risk Ratio (M‐H, Fixed, 95% CI) | 16.60 [0.97, 285.35] |
| 9.1 Singleton pregnancy | 1 | 336 | Risk Ratio (M‐H, Fixed, 95% CI) | 16.60 [0.97, 285.35] |
| 10 Bronchopulmonary dysplasia Show forest plot | 1 | 336 | Risk Ratio (M‐H, Fixed, 95% CI) | 0.95 [0.61, 1.48] |
| 10.1 Singleton pregnancy | 1 | 336 | Risk Ratio (M‐H, Fixed, 95% CI) | 0.95 [0.61, 1.48] |
| 11 Necrotising enterocolitis Show forest plot | 1 | 336 | Risk Ratio (M‐H, Fixed, 95% CI) | 0.98 [0.20, 4.77] |
| 11.1 Singleton pregnancy | 1 | 336 | Risk Ratio (M‐H, Fixed, 95% CI) | 0.98 [0.20, 4.77] |
| 12 Infant birthweight (grams) Show forest plot | 1 | 336 | Mean Difference (IV, Fixed, 95% CI) | 25.0 [‐40.06, 90.06] |
| 12.1 Singleton pregnancy | 1 | 336 | Mean Difference (IV, Fixed, 95% CI) | 25.0 [‐40.06, 90.06] |
| 13 Long‐term infant neurodevelopmental outcome (impairment at 2 years) Show forest plot | 1 | 336 | Risk Ratio (M‐H, Fixed, 95% CI) | 0.34 [0.15, 0.79] |
| 13.1 Singleton pregnancy | 1 | 336 | Risk Ratio (M‐H, Fixed, 95% CI) | 0.34 [0.15, 0.79] |
| 14 Long‐term infant neurodevelopmental outcome (cerebral palsy at 2 years) Show forest plot | 1 | 336 | Risk Ratio (M‐H, Fixed, 95% CI) | 0.09 [0.00, 1.59] |
| 14.1 Singleton pregnancy | 1 | 336 | Risk Ratio (M‐H, Fixed, 95% CI) | 0.09 [0.00, 1.59] |
| 15 Infant survival at 2 years without neurodevelopmental impairment (not prespecified) Show forest plot | 1 | 336 | Risk Ratio (M‐H, Fixed, 95% CI) | 1.17 [1.02, 1.34] |
| 15.1 Singleton pregnancy | 1 | 336 | Risk Ratio (M‐H, Fixed, 95% CI) | 1.17 [1.02, 1.34] |
| 16 Sepsis (proven) (not prespecified) Show forest plot | 1 | 336 | Risk Ratio (M‐H, Fixed, 95% CI) | 0.68 [0.42, 1.11] |
| 16.1 Singleton pregnancy | 1 | 336 | Risk Ratio (M‐H, Fixed, 95% CI) | 0.68 [0.42, 1.11] |
| Outcome or subgroup title | No. of studies | No. of participants | Statistical method | Effect size |
| 1 Any perinatal death after randomisation Show forest plot | 1 | 337 | Risk Ratio (M‐H, Fixed, 95% CI) | 0.66 [0.32, 1.36] |
| 1.1 Singleton pregnancy | 1 | 337 | Risk Ratio (M‐H, Fixed, 95% CI) | 0.66 [0.32, 1.36] |
| 2 Survival following severe neonatal morbidity Show forest plot | 1 | 337 | Risk Ratio (M‐H, Fixed, 95% CI) | 1.13 [0.77, 1.65] |
| 3 Stillbirth Show forest plot | 1 | 337 | Risk Ratio (M‐H, Fixed, 95% CI) | 0.68 [0.20, 2.36] |
| 3.1 Singleton pregnancy | 1 | 337 | Risk Ratio (M‐H, Fixed, 95% CI) | 0.68 [0.20, 2.36] |
| 4 Neonatal death Show forest plot | 1 | 337 | Risk Ratio (M‐H, Fixed, 95% CI) | 0.56 [0.21, 1.47] |
| 4.1 Singleton pregnancy | 1 | 337 | Risk Ratio (M‐H, Fixed, 95% CI) | 0.56 [0.21, 1.47] |
| 5 Any potentially preventable perinatal death* Show forest plot | 1 | 337 | Risk Ratio (M‐H, Fixed, 95% CI) | 0.68 [0.31, 1.47] |
| 5.1 Singleton pregnancy | 1 | 337 | Risk Ratio (M‐H, Fixed, 95% CI) | 0.68 [0.31, 1.47] |
| 6 Fetal acidosis Show forest plot | 1 | 337 | Risk Ratio (M‐H, Fixed, 95% CI) | 3.05 [0.13, 74.43] |
| 6.1 Singleton pregnancy | 1 | 337 | Risk Ratio (M‐H, Fixed, 95% CI) | 3.05 [0.13, 74.43] |
| 7 Apgar < 7 at 5 minutes Show forest plot | 1 | 337 | Risk Ratio (M‐H, Fixed, 95% CI) | 0.68 [0.36, 1.29] |
| 7.1 Singleton pregnancy | 1 | 337 | Risk Ratio (M‐H, Fixed, 95% CI) | 0.68 [0.36, 1.29] |
| 8 Infant requiring intubation/ventilation Show forest plot | 1 | 337 | Risk Ratio (M‐H, Random, 95% CI) | 0.93 [0.71, 1.21] |
| 8.1 Singleton pregnancy | 1 | 337 | Risk Ratio (M‐H, Random, 95% CI) | 0.93 [0.71, 1.21] |
| 9 Intraventricular haemorrhage Show forest plot | 1 | 337 | Risk Ratio (M‐H, Fixed, 95% CI) | 0.51 [0.16, 1.66] |
| 9.1 Singleton pregnancy | 1 | 337 | Risk Ratio (M‐H, Fixed, 95% CI) | 0.51 [0.16, 1.66] |
| 10 Bronchopulmonary dysplasia Show forest plot | 1 | 337 | Risk Ratio (M‐H, Fixed, 95% CI) | 0.92 [0.58, 1.46] |
| 10.1 Singleton pregnancy | 1 | 337 | Risk Ratio (M‐H, Fixed, 95% CI) | 0.92 [0.58, 1.46] |
| 11 Necrotising enterocolitis Show forest plot | 1 | 337 | Risk Ratio (M‐H, Fixed, 95% CI) | 0.34 [0.04, 3.23] |
| 11.1 Singleton pregnancy | 1 | 337 | Risk Ratio (M‐H, Fixed, 95% CI) | 0.34 [0.04, 3.23] |
| 12 Infant birthweight (grams) Show forest plot | 1 | 337 | Mean Difference (IV, Fixed, 95% CI) | 13.0 [‐59.31, 85.31] |
| 12.1 Singleton pregnancy | 1 | 337 | Mean Difference (IV, Fixed, 95% CI) | 13.0 [‐59.31, 85.31] |
| 13 Long‐term infant neurodevelopmental outcome (impairment at 2 years) Show forest plot | 1 | 337 | Risk Ratio (M‐H, Fixed, 95% CI) | 1.75 [0.70, 4.32] |
| 13.1 Singleton pregnancy | 1 | 337 | Risk Ratio (M‐H, Fixed, 95% CI) | 1.75 [0.70, 4.32] |
| 14 Long‐term infant neurodevelopmental outcome (cerebral palsy at 2 years) Show forest plot | 1 | 337 | Risk Ratio (M‐H, Fixed, 95% CI) | 3.05 [0.13, 74.43] |
| 14.1 Singleton pregnancy | 1 | 337 | Risk Ratio (M‐H, Fixed, 95% CI) | 3.05 [0.13, 74.43] |
| 15 Infant survival at 2 years without neurodevelopmental impairment (not prespecified) Show forest plot | 1 | 337 | Risk Ratio (M‐H, Fixed, 95% CI) | 0.91 [0.80, 1.03] |
| 15.1 Singleton pregnancy | 1 | 337 | Risk Ratio (M‐H, Fixed, 95% CI) | 0.91 [0.80, 1.03] |
| 16 Sepsis (proven) (not prespecified) Show forest plot | 1 | 337 | Risk Ratio (M‐H, Fixed, 95% CI) | 1.37 [0.84, 2.25] |
| 16.1 Singleton pregnancy | 1 | 337 | Risk Ratio (M‐H, Fixed, 95% CI) | 1.37 [0.84, 2.25] |