Deferasirox para el tratamiento de la sobrecarga de hierro en pacientes con talasemia
References
Referencias de los estudios incluidos en esta revisión
Referencias de los estudios excluidos de esta revisión
Referencias de los estudios en espera de evaluación
Referencias de los estudios en curso
Referencias adicionales
Referencias de otras versiones publicadas de esta revisión
Characteristics of studies
Characteristics of included studies [ordered by study ID]
| Methods | Open‐label, multinational, multicentre, randomised, phase III, non‐inferiority study. | |
| Participants | 586 β‐thalassaemia individuals Age (mean (SD)): DFX: 17 (9.47) years; DFO: 17.3 (9.96) years Gender (male/female): DFX: 140/156 DFO: 142/148 Setting and country: 65 centres (mentioned in full text publication) in 12 countries: Argentina, Belgium, Brazil, Canada, France, Germany, Greece, Italy, Tunisia, Turkey, UK, USA Inclusion criteria
Exclusion criteria
Follow‐up: 1 year | |
| Interventions | 2 groups
Protocol assigned dose, mg/kg, Average daily dose, mg/kg/day (mean (SD)): ‐ LIC ≤ 3 mg Fe/g dry weight: 5; 6.2 (1.6) ‐ LIC > 3 mg Fe/g dry weight ‐ 7 mg Fe/g dry weight: 10; 10.2 (1.2) ‐ LIC > 7 mg Fe/g dry weight ‐ 14 mg Fe/g dry weight: 20; 19.4 (1.7) ‐ LIC > 14 mg Fe/g dry weight: 30; 28.2 (3.5)
Protocol assigned dose, mg/kg, Average daily dose, mg/kg/day (mean (SD)): ‐ LIC ≤ 3 mg Fe/g dry weight: 20 ‐ 30; 33.9 (9.9) ‐ LIC > 3 mg Fe/g dry weight ‐ 7 mg Fe/g dry weight: 25 ‐ 35; 36.7 (9.2) ‐ LIC > 7 mg Fe/g dry weight ‐ 14 mg Fe/g dry weight: 35 ‐ 50; 42.4 (6.6) ‐ LIC > 14 mg Fe/g dry weight: ≥ 50; 51.6 (5.8) ‐ Exceptions were permitted to the number of days of administration (ranged 3 ‐ 7 days) ‐ DFO doses reported are normalized to administration for 5 days a week | |
| Outcomes |
Success criteria: LIC at baseline (mg Fe/g dry weight): success, LIC value after 1 year (mg Fe/g dry weight); failure, LIC value after 1 year (mg Fe/g dry weight) 2 to less than 7: 1 to less than 7, less than 1 or at least 7 7 to less than 10: 1 to less than 7, less than 1 or at least 7 10 or more: decrease in LIC of at least 3, decrease in LIC below 3
Furthermore, mortality, discontinuations, willingness to continue treatment, time lost from normal activities due to treatment, satisfaction with treatment, dose adjustments and dose interruptions, convenience and AEs were reported. | |
| Notes | Funding and conflict of interests Study was supported in part by research funding from Novartis Pharma to some of the authors. Two authors have declared a financial interest in a company whose product was studied in the present work. Several of the authors are employed by Novartis Pharma. | |
| Risk of bias | ||
| Bias | Authors' judgement | Support for judgement |
| Random sequence generation (selection bias) | Unclear risk | No details given with regard to sequence generation. "Randomisation was stratified by age groups: 2 to younger than 12 years, 12 to younger than 18 years, and 18 years or older. After randomization, patients were assigned by the investigator to a dose dependent on their baseline LIC according to the algorithm noted in Table 2." |
| Allocation concealment (selection bias) | Unclear risk | No details given with regard to concealment of allocation. "Randomisation was stratified by age groups: 2 to younger than 12 years, 12 to younger than 18 years, and 18 years or older. After randomisation, patients were assigned by the investigator to a dose dependent on their baseline LIC according to the algorithm noted in Table 2." |
| Blinding (performance bias and detection bias) | High risk | This was an open‐label study. |
| Incomplete outcome data (attrition bias) | Unclear risk | No flowchart according to CONSORT available. 586 individuals were randomised of which 29 discontinued and 4 died. The primary efficacy population consists of 553 individuals. However, it is stated that 541 participants completed one year of therapy. It remains unclear, what happened to the remaining 12 participants. "Most patients completed 1 year of therapy on this study: 541 (92.3%) of 586 underwent both baseline and 1‐year LIC assessments. Discontinuations were relatively similar in the groups receiving deferasirox (n = 17) and deferoxamine (n = 12)." "The primary efficacy population in this study consisted of 553 patients with LIC evaluations at baseline and after 52 weeks and those who discontinued due to safety reasons (AE, abnormal laboratory value or test procedure result, or iron overload–related death)." |
| Selective reporting (reporting bias) | Unclear risk | See also "Outcomes" in "Characteristics of included studies" table Cappellini 2005b above. Not all time points nor all parameters (secondary: e.g. trace elements) reported. However, EOS primary results are reported and secondary as outlined in methods section. However, it remains unclear whether any others were measured. |
| Other bias | Low risk | No other risk of bias detected. |
| Methods | Prospective study with randomised groups in the last 2 years of study period. | |
| Participants | 72 β‐thalassaemia participants: 21 non‐transfusion‐dependent thalassaemia participants, 51 transfusion‐dependent thalassaemia participants Randomised in the last 2 years of study: n = 37 Age (mean (SD)): DFO : 30.2 (7.3) years; DFP: 28.8 (8.9) years; DFX: 31.4 (7.4) years Gender: not mentioned Setting: Thalassaemia Unit, Department of Pediatrics, University of Messina Country: Italy Inclusion criteria: not mentioned Exclusion criteria:
Follow‐up: whole study: 8 years; randomised phase: 2 years | |
| Interventions | All participants received DFO monotherapy for 4 years or until the appearance of thyreopathy. Afterwards, individuals with thyreopathy received DFO (20 ‐ 40 mg/kg, 8 ‐ 12 hours, 2 ‐ 6 days/week) and DFP (daily oral administration 75 ‐ 100 mg/kg/day in 3 divided doses). Individuals without thyreopathy continued with DFO. After the end of 2 years, participants with a new diagnosis of thyreopathy started combined chelation therapy, whereas those without thyroid dysfunction were randomised in 3 arms for further 2 years.
Only results of participants randomised to the 3 monotherapy groups in the last phase of the study were included in this systematic review. All transfusion‐dependent thalassaemia participants followed a standard treatment protocol and were regularly transfused with packed red cells every 3 weeks, with the aim of maintaining pre‐transfusion haemoglobin levels above 9 g/dL. | |
| Outcomes |
Furthermore, FT₃, FT₄, TSH, TGA, TPO, thyroid dysfunction (overt hypothyroidism: low FT₄ and/or FT₃, increased TSH levels; subclinical hypothyroidism: normal FT₄, FT₃ and increased TSH concentration (> 5 TSH ɥIU/mL)); central hypothyroidism (inappropriately low serum TSH concentration in the presence of subnormal serum T₄ and T₃ concentrations), thyroid volumes, lipid profile, blood pressure and metabolic parameters (in particular insulin resistance) were measured. | |
| Notes | The authors declare that they have no conflict of interest. The authors state that this research did not receive any specific grant from any funding agency in the public, commercial or not‐for‐profit sector. | |
| Risk of bias | ||
| Bias | Authors' judgement | Support for judgement |
| Random sequence generation (selection bias) | Unclear risk | "This latter group was randomised into three arms, based on the type of iron chelation [...]" Not mentioned how random sequence was generated. |
| Allocation concealment (selection bias) | Unclear risk | Not details given with regard to allocation concealment. |
| Blinding (performance bias and detection bias) | High risk | "The patients, physicians, laboratory staff and the epidemiologist who analysed the data were not aware of the intervention of each group" No placebo treatment is mentioned, so blinding of participants and physicians is unlikely due to different administration routes and frequencies of application. |
| Incomplete outcome data (attrition bias) | Low risk | Results of all randomised participants at end of study are reported. |
| Selective reporting (reporting bias) | High risk | No results reported for TSH, FT₃, FT₄, but likely included in definition for thyroid dysfunction. No results reported for TGA, TPO, thyroid volumes, insulin resistance, lipid profile, blood pressure at the end of the randomised phase. |
| Other bias | Unclear risk | Baseline data for randomised patients not reported apart from serum ferritin, age, splenectomy rate and haemoglobin before transfusion. |
| Methods | Randomised, prospective study. | |
| Participants | 180 people with β‐thalassaemia major Age: ≤ 18 years Gender: not mentioned Setting: regular attendants of the Hematology Clinic, Pediatric Hospital, Ain Shams University Country: Egypt Inclusion criteria
Exclusion criteria
Follow up: 1 year | |
| Interventions | 3 groups:
‐ Each chelation group were further randomly divided into two subgroups according to vitamin C supplementation (n = 30 in each group): Oral vitamin C in the morning 100 mg daily ‐ Previous chelation therapy was withdrawn for 2 weeks before randomisation ‐ Patients consumed a low‐iron diet (11 ‐ 15 mg of iron/day) and standard vitamin C diet during the study | |
| Outcomes |
Furthermore: transfusion index, haemoglobin, iron, total iron binding capacity, transferrin saturation, vitamin C, compliance. | |
| Notes | The authors declare that they have no conflict of interests. | |
| Risk of bias | ||
| Bias | Authors' judgement | Support for judgement |
| Random sequence generation (selection bias) | Low risk | "Drug administration was according to a predetermined schedule generated from random numbers in a 1:1:1 manner based on a computer‐generated randomisation sequence maintained within the investigational drug pharmacy[...]". |
| Allocation concealment (selection bias) | Low risk | "[...] with allocation concealment by opaque sequentially numbered sealed envelope". |
| Blinding (performance bias and detection bias) | High risk | No details given with regard to blinding. No placebo treatment is mentioned. Due to different administration routes, blinding is not likely. |
| Incomplete outcome data (attrition bias) | Low risk | "Five patients in DFO subgroup did not continue till the end of study because of poor compliance [...]" No ITT analysis performed, but proportion of missing outcome data was regarded as too low to have a large impact on effect size. |
| Selective reporting (reporting bias) | High risk | "The same improvement was found when each chelation subgroup receiving vitamin C supplementation was compared separately with the subgroup without vitamin C (data not shown)". Only summarized data for patients with vitamin C supplementation versus patients without vitamin C supplementation and data for all chelation groups with vitamin C supplementation were reported. The outcome "occurrence of AE" is mentioned, but only serious AE related to iron chelators are reported. Serum ferritin is reported as median and IQR, but no reason for this reporting style is mentioned. |
| Other bias | Unclear risk | Baseline data are not given for all treatment groups |
| Methods | Interventional prospective randomised open‐labelled study with blinded data management and data analyses. | |
| Participants | 96 people with β‐thalassaemia major were randomised. Age (mean (SD)): DFX + DFP : 14.05 (2.21), DFP + DFO: 15.25 (2.31) Gender (male/female): 62/34 Setting: Thalassemia Centers of Ain Shams University, Egypt and Sultan Qaboos University Hospital, Oman Countries: Egypt and Oman Inclusion criteria
Exclusion criteria
Follow‐up: 1 year | |
| Interventions | 2 groups:
‐ Chelation therapy was withdrawn for 2 weeks before randomisation ‐ The patients consumed a low‐iron diet (11 ‐ 15 mg of iron per day) during the study ‐ The transfusion regimen aimed to maintain the patients pre‐transfusion haemoglobin ≥ 8.0 g/dL by receiving approximately 15 mL/kg packed red blood cells every 3 ‐ 4 week | |
| Outcomes |
| |
| Notes | The authors state that they have nothing to declare | |
| Risk of bias | ||
| Bias | Authors' judgement | Support for judgement |
| Random sequence generation (selection bias) | Low risk | "The randomisation sequence was based on a computer randomised list in permuted blocks of 10 with a 1:1 ratio, generated at both University of Ain Shams and Sultan Qaboos". |
| Allocation concealment (selection bias) | Low risk | "To ensure no allocation bias, treatment group was assigned by telephone contact from the coordinating centre in Ain Shams". |
| Blinding (performance bias and detection bias) | High risk | "[...] open‐labelled study with blinded data management and data analyses" High risk of bias in particular of performance bias. |
| Incomplete outcome data (attrition bias) | Low risk | " [...] all the included patients continued till the end of study with no patients were lost follow‐up". |
| Selective reporting (reporting bias) | High risk | Patient‐reported satisfaction, percentage of patient's with self reported adherence, proportion of patients who never thought about stopping iron‐chelating therapy and 18‐months‐follow‐up results were reported incompletely so that they cannot be entered in a meta‐analysis. Serum creatinine, liver function, audiometric and ophthalmological assessment were conducted as described in a conference abstract, but no or only incomplete results are published. Although not pre‐defined as an outcome, the authors describe that "change in mean LVEF after 1 yr was not different between the two treatment groups (data not shown)." On clinicaltrials.gov, only change in serum ferritin and the number of patients developing adverse reactions are predefined as outcomes. |
| Other bias | Low risk | No other bias detected. |
| Methods | 2‐period, randomised, double‐blind, placebo‐controlled, sequential parallel‐group design. | |
| Participants | 25 people with transfusion‐dependent β‐thalassaemia were randomised Age (mean (SD)): 21.6 (3.3) years Gender (male/female): 25/0 Setting and country: 2 centers in Italy Country: Italy Inclusion criteria:
Exclusion criteria:
Follow‐up: safety: Up to 10 days post dose | |
| Interventions | "Following a 16‐day run‐in period, 24 patients were allocated to one of three study groups, with each group consisting of 8 patients. Each group was administered two single oral doses of ICL670 at an interval of at least 7 weeks, first a lower dose and later a higher dose. Group 1 received 2.5 and 20 mg/kg, group 2 received 5 and 40 mg/kg, and group 3 received 10 and 80 mg/kg ICL670, in all cases given as an oral suspension of 100 mL prepared from dispersible tablets. Before proceeding to a higher dose, the safety and tolerability of the preceding dose had to be assessed as satisfactory. In each treatment period, 2 of 8 patients received placebo in such a way that a given patient did not receive placebo more than once. Patients went back to their usual deferoxamine therapy and transfusion scheme in the interval between study periods." | |
| Outcomes |
| |
| Notes | Novartis involved in trial. No details given and no information available with regard to potential conflicts of interest. | |
| Risk of bias | ||
| Bias | Authors' judgement | Support for judgement |
| Random sequence generation (selection bias) | Unclear risk | No details given with regard to sequence generation. From information given in paper, unclear, whether randomisation took place both in group assignment and in allocating patients to placebo. Author confirmed that randomisation was used to allocate placebo. "Randomization was used to assign both drug (all treatment groups) and placebo. Hope to have clarified." |
| Allocation concealment (selection bias) | Unclear risk | No details given with regards to concealment of allocation. |
| Blinding (performance bias and detection bias) | Low risk | "The study employed a two‐period, randomised, double‐blind, placebo‐controlled, sequential parallel group design." However, no definition of double‐blind. Unclear whether, e.g. outcome assessors and data analysts were blinded. |
| Incomplete outcome data (attrition bias) | Low risk | Not applicable. Data from all participants are presented. |
| Selective reporting (reporting bias) | Unclear risk | Only general information with regard to safety issues. No clear‐cut comparison of placebo vs verum groups. Unclear, whether other parameters were evaluated than those reported. |
| Other bias | Low risk | No other risk of bias detected. |
| Methods | Randomised clinical study | |
| Participants | 30 people with thalassaemia major Age: not mentioned Gender: not mentioned Setting: Bahonar hospital of Karaj Country: Iran Inclusion criteria: not mentioned Exclusion criteria: not mentioned Follow‐up: 1 year | |
| Interventions | 2 groups:
| |
| Outcomes | Serum ferritin | |
| Notes | The study was only reported in a conference abstract | |
| Risk of bias | ||
| Bias | Authors' judgement | Support for judgement |
| Random sequence generation (selection bias) | Unclear risk | "In this randomized clinical trial [...]" Not mentioned how random sequence generation was generated. |
| Allocation concealment (selection bias) | Unclear risk | No details given with regard to concealment of allocation. |
| Blinding (performance bias and detection bias) | High risk | No details given with regard to blinding. |
| Incomplete outcome data (attrition bias) | Unclear risk | Not reported how many patients reached end of study. |
| Selective reporting (reporting bias) | High risk | No results were reported. |
| Other bias | Unclear risk | No baseline characteristics were reported. |
| Methods | Prospective randomised study | |
| Participants | 60 β‐thalassemia major participants Age (mean (SD)): DFX group: 8.9 (2.2), DFO group: 9.7 (1.9) Gender: 19 male, 41 female Setting: Out‐patient paediatric hematology clinic of Al‐Hussein University Hospital, Al‐Azhar University, Cairo Country: Egypt Inclusion criteria:
Exclusion criteria:
Follow‐up: 1 year | |
| Interventions | Two groups:
| |
| Outcomes |
Furthermore, serum ferritin, ALT, AST, blood urea, serum creatinine, neutrophilic and platelet counts and some AEs were reported | |
| Notes | The authors state that there is no conflict of interest to be declared. | |
| Risk of bias | ||
| Bias | Authors' judgement | Support for judgement |
| Random sequence generation (selection bias) | Unclear risk | "[...] the patients were randomized in a 1:1 ratio based on permuted blocks [...]" Not mentioned how random sequence generation was generated. |
| Allocation concealment (selection bias) | Unclear risk | No details given with regard to concealment of allocation. |
| Blinding (performance bias and detection bias) | High risk | No details given with regard to blinding. Due to different administration routes, blinding is not likely. |
| Incomplete outcome data (attrition bias) | Low risk | "[...] no discontinuation of drugs or drop‐out of follow‐up occurred." |
| Selective reporting (reporting bias) | Low risk | No protocol available. All predefined outcomes in the method section were reported. |
| Other bias | Low risk | No other bias detected. |
| Methods | Randomised controlled study. | |
| Participants | 40 thalassaemia major participants Age: 5 ‐ 18 years Gender: not mentioned Setting: unclear Country: unclear Inclusion criteria: not mentioned Exclusion criteria: not mentioned Follow‐up: not mentioned | |
| Interventions | Three groups:
| |
| Outcomes |
| |
| Notes | The study was only reported in a conference abstract. | |
| Risk of bias | ||
| Bias | Authors' judgement | Support for judgement |
| Random sequence generation (selection bias) | Unclear risk | "[...] were randomised to three groups [...]" Not mentioned how random sequence generation was generated. |
| Allocation concealment (selection bias) | Unclear risk | No details given with regard to concealment of allocation. |
| Blinding (performance bias and detection bias) | High risk | No placebo treatment mentioned. High risk of bias in particular of performance bias and outcome assessment. |
| Incomplete outcome data (attrition bias) | Unclear risk | Not reported how many patients reached end of study. |
| Selective reporting (reporting bias) | High risk | Regarding cardiac MRI T2*, only baseline data and P value for DFP vs DFP+DFX at the end of the study was reported. For liver MRI T2* it is unclear whether values given are baseline or end of study data. Missing data for serum ferritin. CBC, liver enzymes and renal function tests. Only untoward side‐effects reported and only for group receiving combination therapy. |
| Other bias | Unclear risk | No baseline data reported. |
| Methods | Randomised controlled open‐label study. | |
| Participants | 138 patients with β‐thalassemia major (n = 122) and thalassaemia intermedia (n = 16) Age (mean (SD)): 13.59 (6.81) (range: 4 ‐ 27 years) Gender (male/female): 62/76 Setting: Bandar Abbas Pediatric Hematology Clinic Country: Iran Inclusion criteria
Exclusion criteria
Follow‐up: 8 months | |
| Interventions | 2 groups:
| |
| Outcomes |
Furthermore, patients were visited weekly on the base of drug tolerance and side effects. | |
| Notes | No funding or conflict of interest mentioned. | |
| Risk of bias | ||
| Bias | Authors' judgement | Support for judgement |
| Random sequence generation (selection bias) | Unclear risk | "Patients were assigned randomly in two groups" No details given with regard to sequence generation. |
| Allocation concealment (selection bias) | Unclear risk | No details given with regard to concealment of allocation. |
| Blinding (performance bias and detection bias) | High risk | No placebo treatment mentioned. Due to different administration routes, blinding is not likely. |
| Incomplete outcome data (attrition bias) | Low risk | Although number of patients who reached end of study was not clearly stated, we concluded from given means, SDs and P values, that 69 participants were included in the results. |
| Selective reporting (reporting bias) | High risk | ALT, AST, creatinine evaluated at EOS, but only baseline values given Only ferritin level, haemoglobin level and drug side effects predefined as outcomes on clinicaltrials.gov Exclusion criteria were stated as, among others, “vision and hearing problems”, “severe skin rash”: implies that AEs were known for DFX/DFO and these data were collected; however they were not reported; Only AEs reported: leukopenia, thrombocytopenia, although patients were visited weekly for drug tolerance and side effects. |
| Other bias | Low risk | No other bias detected. |
| Methods | Randomised clinical study. | |
| Participants | 100 children with thalassaemia major were selected, 94 participants entered study Age (mean (SD)):12.23 (4.09) years (range: 2 ‐ 15 years) Gender (male/female): 44/48 Setting: Thalassemia medical centre of Bandar Abbas Country: Iran Inclusion criteria:
Exclusion criteria: not mentioned Follow‐up: 12 months | |
| Interventions | Two groups:
| |
| Outcomes |
| |
| Notes | Conflict of interest not mentioned. | |
| Risk of bias | ||
| Bias | Authors' judgement | Support for judgement |
| Random sequence generation (selection bias) | Unclear risk | "Randomly and in the order of visiting the centre, they were divided in two 50‐member groups" No details given on how random sequence was generated. |
| Allocation concealment (selection bias) | Unclear risk | No details mentioned with regard to concealment of allocation. |
| Blinding (performance bias and detection bias) | High risk | No placebo treatment in the Desferal monotherapy group is mentioned, so blinding is not likely in particular of performance bias. |
| Incomplete outcome data (attrition bias) | Low risk | It remains unclear wether six patients were excluded due to exclusion criteria before or after randomisation; small number doesn't seem to affect results. |
| Selective reporting (reporting bias) | High risk | Level of creatinine was measured, but results were not reported. |
| Other bias | Low risk | No other bias detected. |
| Methods | Randomised, double‐blind, placebo‐controlled dose‐escalation study. | |
| Participants | 24 participants with transfusion‐dependent β‐thalassaemia (23 analysed, 3 replacements for participants who were withdrawn for serious AEs during the study) Age (median (range): placebo: 32 (22 ‐ 38) years; 10 mg/kg DFX: 28 (20 ‐ 39) years; 20 mg/kg DFX: 24 (18 ‐ 38); 40 mg DFX: 27 (19 ‐ 34) Gender (male/female): 11/12 Setting: Children's Hospital, Boston; Weill Medical College, New York; Toronto General Hospital, Toronto Country: USA (2 centres) and Canda (1 centre) Participant characteristics:
Follow‐up: 12 days | |
| Interventions | Four groups:
| |
| Outcomes |
| |
| Notes | Conflict of interest and funding: Novartis was involved in design and monitoring of the study.Study was financial supported by Novartis Pharmaceuticals Corporation. | |
| Risk of bias | ||
| Bias | Authors' judgement | Support for judgement |
| Random sequence generation (selection bias) | Unclear risk | Details of sequence generation process not stated. "The randomisation sequence was generated by Novartis Pharmaceuticals and delivered to the research pharmacy in duplicate sealed envelopes." |
| Allocation concealment (selection bias) | Unclear risk | Sealed envelopes were used. However, unclear whether opaque and numbered. "The randomisation sequence was generated by Novartis Pharmaceuticals and delivered to the research pharmacy in duplicate sealed envelopes." |
| Blinding (performance bias and detection bias) | Low risk | This was a placebo‐controlled study, in which investigators and those responsible for administering study drug were blinded with regard to treatment allocation. However, it remains unclear whether outcome assessors and data analysts were blinded as well. "The investigators and those responsible for administering study drug were unaware of treatment allocation." "Placebo and ICL670 were prepared as dispersible tablets with standard excipients. Tablets were suspended in water, and patients ingested the drug or placebo on an empty stomach." |
| Incomplete outcome data (attrition bias) | Low risk | "Therefore, all patients who began either placebo or drug were included in the data analysis, whether they completed the 12‐day course or withdrew prematurely." |
| Selective reporting (reporting bias) | Unclear risk | "We did clinical, laboratory, and other safety assessments regularly throughout the study." However, only a limited amount of data are presented in the publication. |
| Other bias | Low risk | No other bias detected. |
| Methods | Randomised controlled study. | |
| Participants | 26 individuals were recruited, who were diagnosed as β‐severe thalassaemia by gene screening, 2 met exclusion criteria 24 participants were randomised Gender: 13 male, 11 female Age (mean (SD) (range)): (14 (3) (11 ‐ 26)) years Setting: First Affiliated Hospital, Guangxi Medical University, Nanning Country: China Inclusion criteria:
Exclusion criteria:
Follow up: 12 months | |
| Interventions | Two groups:
‐ Parameters of the body of patient, LIC, serum ferritin, serum creatinine, liver function and toxicity of the drugs are regarded as standards to adjust the dose or discontinue the therapy ‐ Meanwhile, the patients still receive the former transfusion program (red blood cell transfusion ≥ 10 units per year) to maintain the haemoglobin > 90 g/L ‐ 5‐day washout period without chelation therapz before treatment | |
| Outcomes |
| |
| Notes | Study funding sources: National Natural Science Foundation of China, the Natural Science Foundation of Guangxi, China | |
| Risk of bias | ||
| Bias | Authors' judgement | Support for judgement |
| Random sequence generation (selection bias) | Unclear risk | "[...] 24 iron‐overloaded patients were randomly divided into 2 groups [...]" No details given with regard to sequence generation. |
| Allocation concealment (selection bias) | Unclear risk | No details given with regard to concealment of allocation. |
| Blinding (performance bias and detection bias) | High risk | No details given with regard to blinding. Due to different administration routes, blinding is not likely. |
| Incomplete outcome data (attrition bias) | Low risk | There were no missing outcome data. |
| Selective reporting (reporting bias) | High risk | Side effects were not reported. |
| Other bias | Low risk | No other bias detected. |
| Methods | Prospective, multinational, randomised, open‐label, parallel‐group, phase 2 study; Non‐inferiority study. | |
| Participants | 197 participants were randomised 160 participants completed one year of treatment Age (mean (SD)): 19.8 (6.4) years (range: 10 ‐ 40 years) Gender (male/female): 115/82 Setting and countries: 22 centres across 11 countries Inclusion criteria:
Exclusion criteria:
Follow‐up: 12 months | |
| Interventions | Two groups:
| |
| Outcomes |
Furthermore, safety, compliance, dose interruptions/reductions and laboratory parameters (serum creatinine, blood creatinine, ALT) were measured. | |
| Notes | Study was sponsored by Novartis Pharma AG. Novartis Pharma AG was involved in design of the study, conducted the statistical analysis and paid a medical writer who assisted with writing the article. Some of the authors received research grant funding, honoraria or lecture fees from Novartis Pharmaceuticals and/or other pharmaceutical companies. | |
| Risk of bias | ||
| Bias | Authors' judgement | Support for judgement |
| Random sequence generation (selection bias) | Low risk | "[...]patients were randomised in a 1:1 ratio [...]" "Randomization was based on permuted blocks; stratification by centre was not conducted." |
| Allocation concealment (selection bias) | Unclear risk | No details given with regard to concealment of allocation. |
| Blinding (performance bias and detection bias) | High risk | "Core laboratories were blinded to treatment allocation." "In order to eliminate potential unrecognised biases, the core clinical trial team was blinded to the treatment assignment prior to the database lock for the primary analysis." "Open‐label trial" No placebo treatment mentioned. Due to different administration routes, blinding is not likely in particular of performance bias. |
| Incomplete outcome data (attrition bias) | High risk | ITT was done regarding myocardial T2*, but the number of included patients (n=180) was lower than the number of randomised patients (n=197) Apart from that, per‐protocol analysis was done for the other outcomes. |
| Selective reporting (reporting bias) | High risk | Only most common AE (≥ 5%) and drug related AE ≥ 2 participants were reported |
| Other bias | Low risk | No other bias detected. |
| Methods | Open label, randomised, multicenter, phase II study. | |
| Participants | 71 people with thalassaemia and transfusional iron overload: 69 people with β‐thalassemia major, 2 people with β‐thalassemia intermedia Age mean (range): DFX 10 mg/kg/day: 23.7 years (17 ‐ 33 years); DFX 20 mg/kg/day: 25.6 years (19 ‐ 50 years); DFO: 22.7 (18 ‐ 29 years) Gender (male/female): 26/45 Setting and country: 4 centres in Italy Inclusion criteria:
Exclusion criteria:
Follow‐up: 48 weeks | |
| Interventions | 3 groups:
‐ During the 14‐day run‐in period, eligible patients had their usual DFO therapy adjusted to 40 mg/kg given on 5 consecutive days each week ‐ The study protocol allowed for dose adjustment within the range of 5 ‐ 40 mg/kg/day in the DFX groups and 20 ‐ 50 mg/kg in the DFO group ‐ Depending on response, assessed primarily using the change in LIC at 3 consecutive determinations, dose increases or decreases were made by ±5 or ±10 mg/kg in the DFX groups and by ± 10 mg/kg in the DFO group ‐ Dose reductions were performed if the decrease in LIC was extrapolated to fall below 2 mg Fe/g dry weight within the next 12 weeks and dose increases were prescribed if an increasing trend in LIC was noted ‐ Dose adjustments were decided on a case‐by‐case basis in joint consultation between the Study Monitoring Committee and the sponsor ‐ On day ‐5, participants were admitted to the study site to receive a blood transfusion to achieve a target haemoglobin level of ≥ 13g/dL prior to commencing study treatment followed by a DFO washout period of 5 days | |
| Outcomes |
| |
| Notes | Study was supported by Novartis Pharma AG. Some of the authors are employed by Novartis Pharma or received lecture fees from the manufacturer. | |
| Risk of bias | ||
| Bias | Authors' judgement | Support for judgement |
| Random sequence generation (selection bias) | Low risk | "Randomization was performed using a validated system that generates an automated random assignment of numbers to treatment groups." We expect that using this system resulted in an adequate sequence generation. |
| Allocation concealment (selection bias) | Unclear risk | "Randomization was performed using a validated system that generates an automated random assignment of numbers to treatment groups." No information is given with regard to allocation concealment. |
| Blinding (performance bias and detection bias) | High risk | It is classified as an open‐label study. There is no mentioning of blinding. |
| Incomplete outcome data (attrition bias) | Low risk | All participants are included in safety analysis (primary objective). Few patients only are not included in efficacy analysis (secondary objective). |
| Selective reporting (reporting bias) | Unclear risk | "Laboratory tests, including evaluation of blood indices, liver and renal function, serum electrolytes, copper and zinc, were performed at baseline and at 2‐weekly intervals throughout the study. All laboratory parameters were measured at a central laboratory (EXACTA Clinical Trials Services, Verona, Italy). Second void urine samples were collected for measurement of N‐acetyl‐b‐glucosaminidase and an aliquot of urine was alkalinized for measurement of b‐2 microglobulin. An ophthalmology examination, including a slit lamp examination of the lens and retinal fundoscopy, was performed every 2 weeks. Audiometry, ECG and liver ultrasonography were carried out every 3 months. Adverse events were recorded at each study visit and the severity of each adverse event was graded as mild, moderate or severe. A serious adverse event was defined as a medically significant event that was either fatal or life threatening, required surgical intervention, prolonged hospitalization or resulted in persistent disability. All adverse events and serious adverse events were assessed by the investigator for a possible relationship to the study drug. Adverse events were ranked according to incidence in the deferasirox 20 mg/kg/day treatment group." "All biomagnetic liver susceptometry evaluations were performed at the Ospedale Regina Margherita, University of Turin, Italy. LIC was determined at screening and then every 12 weeks during treatment and at the end of the study...... During the study, markers of iron metabolism (serum ferritin, serum iron, serum transferrin and transferrin saturation) were analyzed by a central laboratory (EXACTA Clinical Trials Services, Verona, Italy). The transferrin saturation was calculated from the serum iron and the transferrin concentrations. Urinary iron excretion was determined in 24‐hour urine collections in ten patients taking deferasirox (five in each dose group) who also underwent blood sampling for pharmacokinetic analyses. Urinary iron excretion was measured using atomic absorption spectrometry." Only selected parameters at selected time points are reported. |
| Other bias | Low risk | No other bias detected. |
| Methods | Prospective randomised comparative study. | |
| Participants | 41 participants were randomised 38 participants reached end of study Age (mean (SD)): DFX (n = 19): 5.23 (2.76) years; DFP (n = 19): 7.26 (2.42) years Gender (male/female): 22/16 Setting: Thalassemia day care centre of Indira Gandhi Institute of child health, Bengaluru Country: India Inclusion criteria
Exclusion criteria
Follow‐up: 12 months | |
| Interventions | 2 groups:
| |
| Outcomes |
| |
| Notes | No funding or conflict of interest mentioned | |
| Risk of bias | ||
| Bias | Authors' judgement | Support for judgement |
| Random sequence generation (selection bias) | Low risk | "These children were randomly divided into two groups as group 1 and group 2 by computer generated randomisation." |
| Allocation concealment (selection bias) | Unclear risk | No details mentioned with regard to concealment of allocation. |
| Blinding (performance bias and detection bias) | High risk | No details given with regard to blinding. Due to different application frequencies, blinding is not likely, in particular regarding performance bias. |
| Incomplete outcome data (attrition bias) | High risk | 3 dropouts due to AEs in deferiprone group, per protocol analysis. |
| Selective reporting (reporting bias) | High risk | Measurements other than serum ferritin and AEs only given for 9 months (and only in the thesis document), but not for end of study (unsure whether not measured or not reported), although the author report measurements every 3 months. In the thesis document, fundoscopy, growth harm and hearing were part of the evaluation sheet at 12‐month follow‐up, but no results were reported. |
| Other bias | Low risk | No other bias detected. |
| Methods | Multinational, prospective, randomised, double‐blind, placebo‐controlled phase 2 study. | |
| Participants | 166 participants were randomised. 95 non‐transfusion‐dependent β‐thalassaemia, 22 α‐thalassaemia, 49 HbE/β‐thalassaemia 148 participants completed 1 year of the study. Inclusion criteria
Exclusion criteria
Follow‐up: 1 year | |
| Interventions | 4 groups:
‐ Doses were doubled at 24 weeks for patients with LIC > 7 mg Fe/g dry weight and LIC reduction < 15% from baseline ‐ Dose adjustment recommendations were also provided based on continuous safety assessments ‐ If serum ferritin was <100 ng/mL or LIC was <3 mg Fe/g dry weight at any visit, treatment was to be suspended until LIC increased to ≥ 5 mg Fe/g dry weight and serum ferritin to > 300 ng/m | |
| Outcomes |
| |
| Notes | Study was sponsored by Novartis Pharma AG. Novartis was involved in design and statistical analysis | |
| Risk of bias | ||
| Bias | Authors' judgement | Support for judgement |
| Random sequence generation (selection bias) | Unclear risk | "[...] patients were block randomised [...]". No details given on how random sequence was generated. |
| Allocation concealment (selection bias) | Low risk | "[...] patients were block randomised using an interactive voice response system. After confirming that the patient fulfilled the inclusion/exclusion criteria, the investigator contacted the interactive voice response system to obtain a randomisation number linking the patient to a treatment arm." |
| Blinding (performance bias and detection bias) | Unclear risk | "Because blinding of dose was not possible, blinding was only applied to the treatment received. All persons were blinded to the treatment from the time of randomisation until database lock." |
| Incomplete outcome data (attrition bias) | Unclear risk | Attrition was 12.7%, 10.9% and 8.9% for the DFX 5 mg, DFX 10 mg and the placebo group, respectively In the journal publication, the authors state that "efficacy was assessed for the full analysis set (all randomised patients).[...] If there was no LIC measurement available at week 52, the last available post‐baseline LIC measurement was carried forward." Number of participants analysed on clinicaltrials.gov doesn't include all randomised patients for continuous outcomes. |
| Selective reporting (reporting bias) | High risk | Extensive data set available on ClinicalTrials.gov (along with prespecified protocol), but AEs and SAEs were not reported separately for the core phase In the journal publication AEs and drug‐related AEs were not reported completely |
| Other bias | Low risk | No other bias detected. |
AE: adverse event
ALP: alkaline phosphatase
ALT: alanine aminotransferase
AST: aspartate aminotransferase
A‐V: atrio‐ventricular
CBC: complete blood count
CONSORT: consolidated standards of reporting trials
DFO: deferoxamine
DFP: deferiprone
DFX: deferasirox
ECG: electrocardiogram
EF: ejection fraction
EOS: eosinophil count
Fe: iron
FT₃: serum‐free triiodothyronine
FT₄: serum‐free thyroxine
GI: gastrointestinal
HBV: hepatitis B virus
ITT: intention‐to‐treat
LVEF: left ventricular ejection fraction
LIC: liver iron concentration
MRI: magnetic resonance imaging
QoL: quality of life
PCR: polymerase chain reaction
RBCs: red blood cells
RNA: ribonucleic acid
SD: standard deviation
SQUID: superconducting quantum interference device
TGA: antithyroglobulin
TSH: thyroid‐stimulating hormone
TPO: antithyroid peroxidase
UIBC: unsaturated iron binding capacity
ULN: upper limit of normal
WBC: white blood count
Characteristics of excluded studies [ordered by study ID]
| Study | Reason for exclusion |
| Not randomised. Two‐arm observational study. | |
| Not randomised, no comparison group. Single‐arm observational study. | |
| Not randomised. Two‐arm observational study. | |
| Not randomised, no comparison group. Single‐arm observational study. | |
| Randomised, evaluating amlodipine added to standard iron chelation therapy. | |
| Not randomised. Study comparing different doses of DFX and DFX to deferiprone and DFO. | |
| Not randomised. Single‐arm interventional study. | |
| Not randomised. Three‐arm observational study. | |
| Not randomised. No adequate random sequence generation. | |
| Non‐randomised. Single‐arm interventional study. | |
| Randomised. Evaluating silymarin versus placebo added to DFX. | |
| Not randomised. Case‐control study. | |
| Randomised controlled study on people with thalassaemia having undergone curative hematopoietic stem cell transplantation. | |
| Not randomised. Two‐arm interventional study. | |
| Not randomised. Three‐arm observational study. | |
| Not randomised. Two single‐arm interventional studies. | |
| Randomised. Pharmacokinetic study with a very small population (n = 8). | |
| Randomised. No individuals with thalassaemia included. | |
| Not randomised. Three‐arm observational study. | |
| Randomised controlled study on people with thalassaemia having undergone curative hematopoietic stem cell transplantation. | |
| Study not randomised. Three‐arm observational study. | |
| Study not randomised. Two‐arm observational study. | |
| Randomised. No individuals with thalassaemia included. | |
| Randomised. Pharmacokinetic study with a very small population (n = 8). | |
| Not randomised. Three‐arm observational study. | |
| Not randomised. Single‐arm interventional study. |
DFO: deferoxamine
DFX: deferasirox
Characteristics of studies awaiting assessment [ordered by study ID]
| Methods | Unclear, if study was randomised. |
| Participants | 108 people with thalassemia major Age: > 10 years Inclusion criteria
|
| Interventions | 3 groups:
|
| Outcomes |
|
| Notes | Author was contacted. |
| Methods | A phase IV, open‐label, partial cross‐over partial parallel, randomised, multi‐centre study. |
| Participants | Target sample size: 64 Inclusion criteria
For non‐naive cohort
Exclusion criteria
|
| Interventions | Once daily oral DFX (dispersible tablet), when administered before or after food in people with transfusional haemosiderosis |
| Outcomes | Primary outcome
Secondary outcomes
|
| Notes | Date of first enrolment: 27/01/2012 Date of the global end of the study: 16/07/2012 Sponsor: University College London Recruitment status: Not Recruiting In the EU Clinical Trials Register, a premature end of the study is reported. As of now, no data have been published. Author was contacted |
| Methods | Unclear, if study was randomised. |
| Participants | 120 people with β‐thalassemia major were included. Age (mean (SD)): 5.43 (1.37) (range 4 ‐ 7) years Gender: 68 males, 52 females Setting: Hematology Unit, Pediatric Department, Tanta University Hospital Country: Egypt Inclusion criteria "Children with beta thalassaemia major with serum ferritin levels of more than 1000 ng/mL who had not received iron chelation before this study and maintained on regular use of chelation during this study." Exclusion criteria "Children with thalassaemia with serum ferritin level less than 1000 ng/mL. Children with thalassaemia with hepatitis A, B or C." Follow‐up: 6 months |
| Interventions | Group A: "30 patients were treated with 8 hours intravenous infusion of Desferrioxamine, 40 mg/kg/day, 6 days per week for 6 months." Group B: " 30 patients were treated with subcutaneous infusion of Desferrioxamine, 40 mg/kg/day, 6 days per week 8 hours per day at night using Desferal pump for 6 months." Group C: " 30 patients were treated with oral Deferiprone 75 mg/kg/day in three divided doses daily for 6 months." Group D: " 30 patients were treated with oral Deferasirox 30 mg/kg/day in single daily dose on empty stomach for 6 months." |
| Outcomes |
|
| Notes | Author was contacted. |
| Methods | Comparative study of incidence of lens opacity between Osferal and Deferoxamine in thalassaemia major. |
| Participants | 50 people with thalassaemia major Inclusion criteria: ‐ children with thalassaemia major ‐ being candidate for chelator therapy because of iron overload Exclusion criteria: ‐ diabetes mellitus and rheumatologic diseases ‐ any lens disease or chelator therapy before the study Follow‐up: 12 months |
| Interventions | "Then the patients will be divided into two 25 membered groups, and each group will receive one of the chelators randomly." "Intervention:In this group, 25 patients are put on a new Iranian drug Osferal, and then it's side effect that is "lens opacity", will be compared with that of the control group." "Control:Based on the present policy, 25 patients who receive Deferoxamine and have a known percent of "lens opacity", are considered as the control group." |
| Outcomes | Lens opacity |
| Notes | Expected recruitment start date: 2010‐12‐22 Expected recruitment end date: 2011‐12‐22 Author was contacted |
| Methods | Prospective randomised study. |
| Participants | Size of study population: not mentioned Setting: Thalassemia ward of Department of Pediatrics, Dayanand Medical College and Hospital, Ludhiana Country: India Inclusion and exclusion criteria: not mentioned Follow‐up: not mentioned |
| Interventions | 2 groups:
|
| Outcomes |
|
| Notes | The study was only reported in a conference abstract. Author was contacted. |
| Methods | Randomised, open‐label, single‐centre, cross‐over study. |
| Participants | Target sample size: 13 Inclusion criteria
Exclusion criteria
|
| Interventions | Experimental: combination treatment: DFX and DFP Active comparator: DFX Active comparator: DFP |
| Outcomes | Primary outcome:
Secondary outcome:
|
| Notes | Primary completion date: July 2008 Recruitment status: completed Author was contacted |
AE: adverse event
AUC: area under the curve
Cmax: maximum or peak concentration (of a drug observed after its administration)
Cmin: minimum concentration (of a drug observed after its administration)
DFO: deferoxamine
DFP: deferiprone
DFX: deferasirox
EU: European Union
GFR: glomerular filtration rate
GIQLI: Gastrointestinal Quality of Life Index
GI: gastrointestinal
GSRS: Gastrointestinal Symptom Rating Scale
LIC: liver iron concentration
LVEF: left ventricular ejection fraction
MRI: magnetic resonance imaging
SD: standard deviation
SGPT: serum glutamic‐pyruvic transaminase
TIBC: total iron building capacity
Characteristics of ongoing studies [ordered by study ID]
| Trial name or title | Sequential DFX‐DFP versus DFX or DFP multicentre randomised study |
| Methods | Randomised, parallel‐group, open study. |
| Participants | Planned number of participants to be included in the member state: 363 Inclusion criteria:
Exclusion criteria:
|
| Interventions | Experimental: sequential DFX‐DFP Comparator 1: DFX Comparator 2: DFP |
| Outcomes | Primary outcome measure:
Secondary outcome measures:
|
| Starting date | Date of first enrolment: 27/01/2010 |
| Contact information | N/A Sponsor: FONDAZIONE FRANCO E PIERA CUTINO |
| Notes | Initial estimate of the duration of the study: 5 years |
| Trial name or title | Efficacy and safety study to compare deferiprone versus deferasirox in paediatric patients |
| Methods | Multicentre, randomised, open label, non‐inferiority active‐controlled study |
| Participants | Estimated enrolment: 344 Inclusion criteria;
Exclusion criteria:
|
| Interventions | Experimental: DFP oral solution Comparator: DFX |
| Outcomes | Primary outcome measure
Secondary outcome measures
|
| Starting date | Date of first enrolment: 29/11/2012 |
| Contact information | Direzione Scientifica via Luigi Porta, 14 27100 Pavia Italy Arianna Gambino, M.Sc. phone: +39.0382.25075 email: deep.2@deep‐project.net / [email protected] |
| Notes | Estimated study completion date: December 2014 Estimated primary completion date: December 2014 (Final data collection date for primary outcome measure) |
| Trial name or title | Phase II Study to Investigate the Benefits of an Improved Deferasirox Formulation (Film‐coated Tablet) |
| Methods | A randomised, open‐label, multicentre, 2‐arm, phase II study. |
| Participants | Enrollment: 168 Inclusion criteria:
Exclusion criteria:
|
| Interventions | Experimental: DFX film‐coated tablet Active comparator: DFX dispersible tablet |
| Outcomes | Primary outcome
Secondary outcome
|
| Starting date | July 2014 |
| Contact information | Sponsor: Novartis Pharmaceuticals |
| Notes | Estimated study completion date: February 2016 Estimated primary completion date: February 2016 (Final data collection date for primary outcome measure) |
| Trial name or title | Study to Evaluate Treatment Compliance, Efficacy and Safety of an Improved Deferasirox Formulation (Granules) in Pediatric Patients (2 ‐ < 18 years old) With Iron Overload |
| Methods | Randomised, open‐label, multicentre, 2‐arm, phase II study. Randomisation will be stratified by age groups (2 to < 10 years, 10 to < 18 years). The study treatment duration will be 48 weeks |
| Participants | Target sample size:120 Inclusion criteria:
Exclusion criteria:
Other protocol‐defined inclusion/exclusion may apply |
| Interventions | Experimental: DFX granule formulation Active comparator: DFX dispersible tablet formulation |
| Outcomes | Primary outcomes:
Secondary outcomes:
|
| Starting date | September 2015 |
| Contact information | Novartis Pharmaceuticals 1‐888‐669‐6682 |
| Notes | Estimated study completion date: August 2017 Estimated primary completion date: August 2017 (Final data collection for primary outcome measure) |
Information given in table according to www.clinicaltrials.gov or http://apps.who.int/trialsearch/ or http://www.irct.ir/. Data were extracted in October 2015.
AEs: adverse events
ALT: alanine aminotransferase
AST: aspartate transaminase
AUCinf: area under the concentration‐time curve extrapolated to time infinity
AUClast: area under the curve up to the last measurable concentration
AUCtau: area under the plasma concentration‐time curve during the dosing interval
Cmax: maximum or peak concentration (of a drug observed after its administration)
CMR: cardiovascular magnetic resonance
DFO: deferoxamine
DFP: deferiprone
DFX: deferasirox
GI: gastrointestinal
HCG: human chorionic gonadotropin
LIC: liver iron concentration
LVEF: left ventricular ejection fraction
MRI: magnetic resonance imaging
PRBC: packed red blood cells
QoL: quality of life
SD: standard deviation
SGPT: serum glutamic‐pyruvic transaminase
Tmax: amount of time that a drug is present at the maximum concentration in serum
ULN: upper limit of normal
Data and analyses
| Outcome or subgroup title | No. of studies | No. of participants | Statistical method | Effect size |
| 1 Mortality at any time point Show forest plot | 2 | 47 | Risk Ratio (M‐H, Fixed, 95% CI) | 0.0 [0.0, 0.0] |
| Analysis 1.1  Comparison 1 Transfusion‐dependent thalassemia: deferasirox vs placebo, Outcome 1 Mortality at any time point. | ||||
| 2 AEs Show forest plot | 1 | Risk Ratio (M‐H, Fixed, 95% CI) | Totals not selected | |
| Analysis 1.2 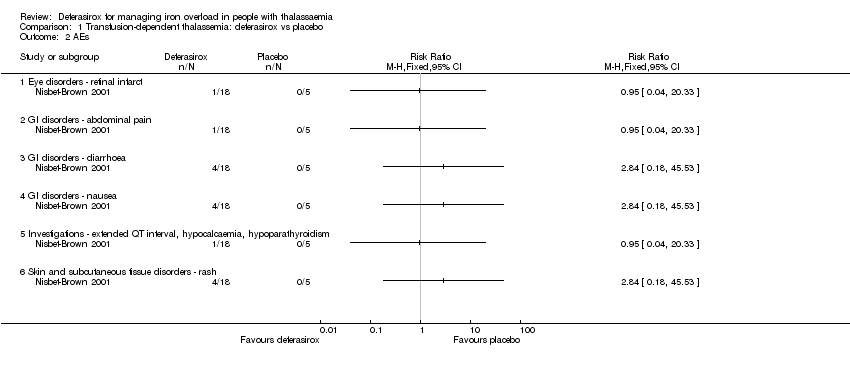 Comparison 1 Transfusion‐dependent thalassemia: deferasirox vs placebo, Outcome 2 AEs. | ||||
| 2.1 Eye disorders ‐ retinal infarct | 1 | Risk Ratio (M‐H, Fixed, 95% CI) | 0.0 [0.0, 0.0] | |
| 2.2 GI disorders ‐ abdominal pain | 1 | Risk Ratio (M‐H, Fixed, 95% CI) | 0.0 [0.0, 0.0] | |
| 2.3 GI disorders ‐ diarrhoea | 1 | Risk Ratio (M‐H, Fixed, 95% CI) | 0.0 [0.0, 0.0] | |
| 2.4 GI disorders ‐ nausea | 1 | Risk Ratio (M‐H, Fixed, 95% CI) | 0.0 [0.0, 0.0] | |
| 2.5 Investigations ‐ extended QT interval, hypocalcaemia, hypoparathyroidism | 1 | Risk Ratio (M‐H, Fixed, 95% CI) | 0.0 [0.0, 0.0] | |
| 2.6 Skin and subcutaneous tissue disorders ‐ rash | 1 | Risk Ratio (M‐H, Fixed, 95% CI) | 0.0 [0.0, 0.0] | |
| 3 Discontinuations due to serious AEs Show forest plot | 1 | Risk Ratio (M‐H, Fixed, 95% CI) | Totals not selected | |
| Analysis 1.3  Comparison 1 Transfusion‐dependent thalassemia: deferasirox vs placebo, Outcome 3 Discontinuations due to serious AEs. | ||||
| Outcome or subgroup title | No. of studies | No. of participants | Statistical method | Effect size |
| 1 Mortality at any time point Show forest plot | 8 | 1170 | Risk Ratio (M‐H, Fixed, 95% CI) | 0.48 [0.09, 2.63] |
| Analysis 2.1  Comparison 2 Transfusion‐dependent thalassemia: deferasirox vs deferoxamine, Outcome 1 Mortality at any time point. | ||||
| 1.1 At 8 months | 1 | 138 | Risk Ratio (M‐H, Fixed, 95% CI) | 0.0 [0.0, 0.0] |
| 1.2 At 48 weeks (deferasirox 10 mg/kg/day) | 1 | 35 | Risk Ratio (M‐H, Fixed, 95% CI) | 0.0 [0.0, 0.0] |
| 1.3 At 48 weeks (deferasirox 20 mg/kg/day ) | 1 | 36 | Risk Ratio (M‐H, Fixed, 95% CI) | 0.0 [0.0, 0.0] |
| 1.4 At 1 year | 5 | 942 | Risk Ratio (M‐H, Fixed, 95% CI) | 0.48 [0.09, 2.63] |
| 1.5 At 2 years | 1 | 19 | Risk Ratio (M‐H, Fixed, 95% CI) | 0.0 [0.0, 0.0] |
| 2 LVEF (%): least squares mean change from baseline Show forest plot | 1 | Mean Difference (IV, Fixed, 95% CI) | Totals not selected | |
| Analysis 2.2  Comparison 2 Transfusion‐dependent thalassemia: deferasirox vs deferoxamine, Outcome 2 LVEF (%): least squares mean change from baseline. | ||||
| 3 LVEF (# participants affected) Show forest plot | 1 | Risk Ratio (M‐H, Fixed, 95% CI) | Totals not selected | |
| Analysis 2.3  Comparison 2 Transfusion‐dependent thalassemia: deferasirox vs deferoxamine, Outcome 3 LVEF (# participants affected). | ||||
| 3.1 Improvement from abnormal LVEF to normal range | 1 | Risk Ratio (M‐H, Fixed, 95% CI) | 0.0 [0.0, 0.0] | |
| 3.2 Decrease from normal LVEF to below LLN | 1 | Risk Ratio (M‐H, Fixed, 95% CI) | 0.0 [0.0, 0.0] | |
| 4 Incidence of thyroid disease at end of study Show forest plot | 1 | Risk Ratio (M‐H, Fixed, 95% CI) | Totals not selected | |
| Analysis 2.4  Comparison 2 Transfusion‐dependent thalassemia: deferasirox vs deferoxamine, Outcome 4 Incidence of thyroid disease at end of study. | ||||
| 5 ALT (# participants affected): improvement from abnormal to normal range Show forest plot | 1 | Risk Ratio (M‐H, Fixed, 95% CI) | Totals not selected | |
| Analysis 2.5  Comparison 2 Transfusion‐dependent thalassemia: deferasirox vs deferoxamine, Outcome 5 ALT (# participants affected): improvement from abnormal to normal range. | ||||
| 6 ALT (U/L) at end of study Show forest plot | 1 | Mean Difference (IV, Fixed, 95% CI) | Totals not selected | |
| Analysis 2.6  Comparison 2 Transfusion‐dependent thalassemia: deferasirox vs deferoxamine, Outcome 6 ALT (U/L) at end of study. | ||||
| 7 AST (U/L) at end of study Show forest plot | 1 | Mean Difference (IV, Fixed, 95% CI) | Totals not selected | |
| Analysis 2.7 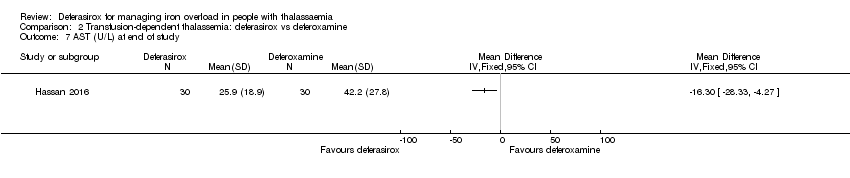 Comparison 2 Transfusion‐dependent thalassemia: deferasirox vs deferoxamine, Outcome 7 AST (U/L) at end of study. | ||||
| 8 Serum creatinine (mg/dL) at end of study Show forest plot | 1 | Mean Difference (IV, Fixed, 95% CI) | Totals not selected | |
| Analysis 2.8 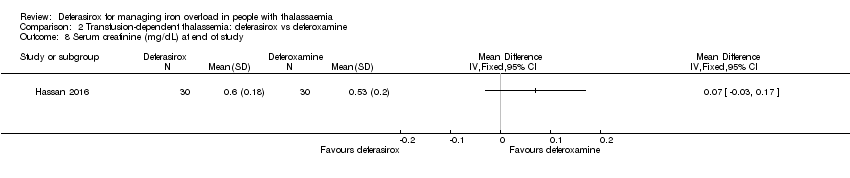 Comparison 2 Transfusion‐dependent thalassemia: deferasirox vs deferoxamine, Outcome 8 Serum creatinine (mg/dL) at end of study. | ||||
| 9 Blood urea (mg/dL): mean at end of study Show forest plot | 1 | Mean Difference (IV, Fixed, 95% CI) | Totals not selected | |
| Analysis 2.9  Comparison 2 Transfusion‐dependent thalassemia: deferasirox vs deferoxamine, Outcome 9 Blood urea (mg/dL): mean at end of study. | ||||
| 10 Serum ferritin (ng/mL): mean change from baseline and at end of study Show forest plot | 6 | 1002 | Mean Difference (IV, Fixed, 95% CI) | 454.42 [337.13, 571.71] |
| Analysis 2.10 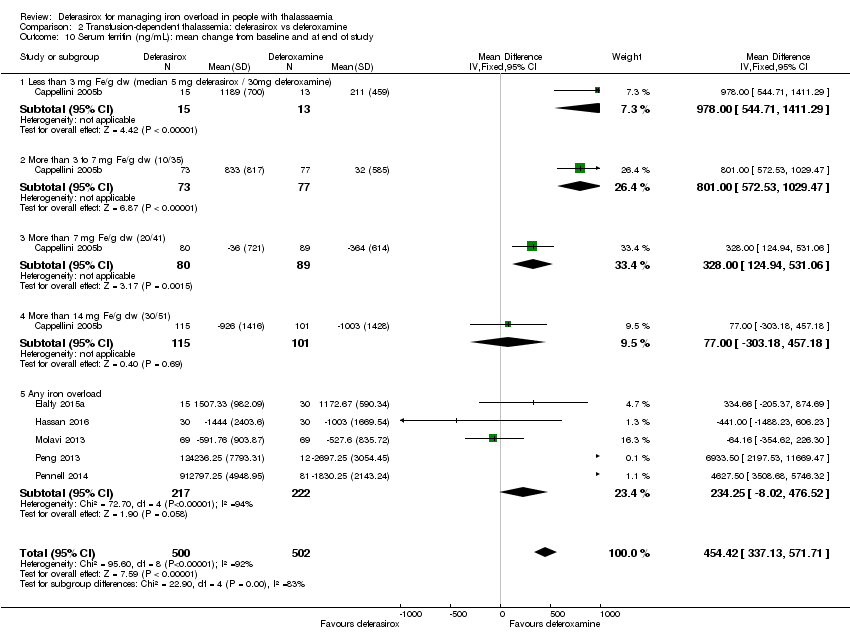 Comparison 2 Transfusion‐dependent thalassemia: deferasirox vs deferoxamine, Outcome 10 Serum ferritin (ng/mL): mean change from baseline and at end of study. | ||||
| 10.1 Less than 3 mg Fe/g dw (median 5 mg deferasirox / 30mg deferoxamine) | 1 | 28 | Mean Difference (IV, Fixed, 95% CI) | 978.0 [544.71, 1411.29] |
| 10.2 More than 3 to 7 mg Fe/g dw (10/35) | 1 | 150 | Mean Difference (IV, Fixed, 95% CI) | 801.0 [572.53, 1029.47] |
| 10.3 More than 7 mg Fe/g dw (20/41) | 1 | 169 | Mean Difference (IV, Fixed, 95% CI) | 328.0 [124.94, 531.06] |
| 10.4 More than 14 mg Fe/g dw (30/51) | 1 | 216 | Mean Difference (IV, Fixed, 95% CI) | 77.0 [‐303.18, 457.18] |
| 10.5 Any iron overload | 5 | 439 | Mean Difference (IV, Fixed, 95% CI) | 234.25 [‐8.02, 476.52] |
| 11 Sensitivity analysis: serum ferritin (ng/mL): mean change from baseline Show forest plot | 2 | 701 | Mean Difference (IV, Fixed, 95% CI) | 418.94 [297.23, 540.65] |
| Analysis 2.11 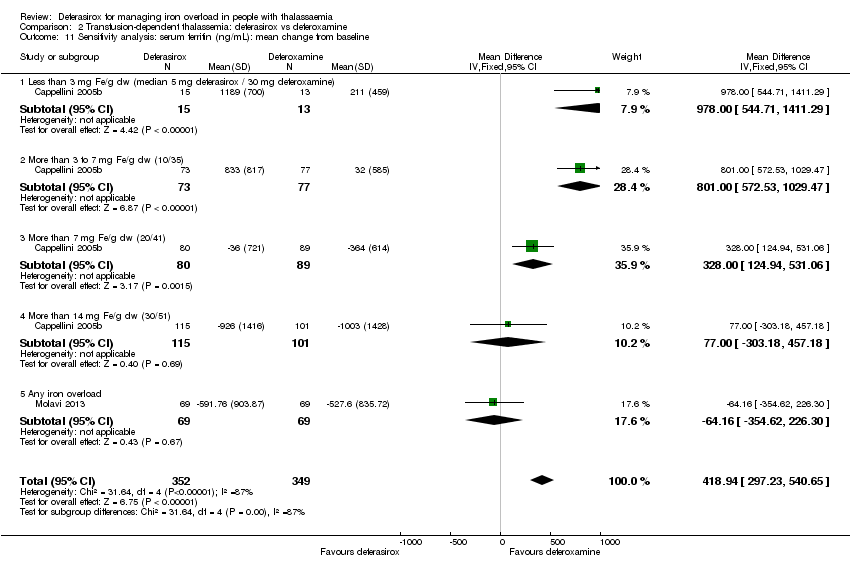 Comparison 2 Transfusion‐dependent thalassemia: deferasirox vs deferoxamine, Outcome 11 Sensitivity analysis: serum ferritin (ng/mL): mean change from baseline. | ||||
| 11.1 Less than 3 mg Fe/g dw (median 5 mg deferasirox / 30 mg deferoxamine) | 1 | 28 | Mean Difference (IV, Fixed, 95% CI) | 978.0 [544.71, 1411.29] |
| 11.2 More than 3 to 7 mg Fe/g dw (10/35) | 1 | 150 | Mean Difference (IV, Fixed, 95% CI) | 801.0 [572.53, 1029.47] |
| 11.3 More than 7 mg Fe/g dw (20/41) | 1 | 169 | Mean Difference (IV, Fixed, 95% CI) | 328.0 [124.94, 531.06] |
| 11.4 More than 14 mg Fe/g dw (30/51) | 1 | 216 | Mean Difference (IV, Fixed, 95% CI) | 77.0 [‐303.18, 457.18] |
| 11.5 Any iron overload | 1 | 138 | Mean Difference (IV, Fixed, 95% CI) | ‐64.16 [‐354.62, 226.30] |
| 12 Liver R2* (Hz): mean change from baseline Show forest plot | 1 | Mean Difference (IV, Fixed, 95% CI) | Totals not selected | |
| Analysis 2.12  Comparison 2 Transfusion‐dependent thalassemia: deferasirox vs deferoxamine, Outcome 12 Liver R2* (Hz): mean change from baseline. | ||||
| 13 LIC (mg/g) evaluated by MRI (R2/R2*): mean change from baseline Show forest plot | 2 | 217 | Mean Difference (IV, Fixed, 95% CI) | 0.36 [‐1.01, 1.72] |
| Analysis 2.13 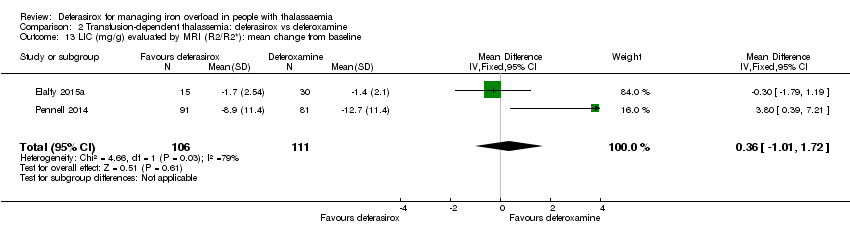 Comparison 2 Transfusion‐dependent thalassemia: deferasirox vs deferoxamine, Outcome 13 LIC (mg/g) evaluated by MRI (R2/R2*): mean change from baseline. | ||||
| 14 LIC (mg Fe/g dw) evaluated by biopsy or SQUID: mean change from baseline Show forest plot | 1 | 541 | Mean Difference (IV, Fixed, 95% CI) | 2.37 [1.68, 3.07] |
| Analysis 2.14  Comparison 2 Transfusion‐dependent thalassemia: deferasirox vs deferoxamine, Outcome 14 LIC (mg Fe/g dw) evaluated by biopsy or SQUID: mean change from baseline. | ||||
| 14.1 LIC 3 mg Fe/g dw or less (5/30) | 1 | 28 | Mean Difference (IV, Fixed, 95% CI) | 4.3 [2.30, 6.30] |
| 14.2 LIC more than 3 mg to 7 mg (10/35) Fe/g dw | 1 | 143 | Mean Difference (IV, Fixed, 95% CI) | 3.80 [2.74, 4.86] |
| 14.3 LIC more than 7 mg to 14 mg Fe/g dw (20/41) | 1 | 164 | Mean Difference (IV, Fixed, 95% CI) | 1.5 [0.28, 2.72] |
| 14.4 LIC more than 14 mg Fe/g dw (30/51) | 1 | 206 | Mean Difference (IV, Fixed, 95% CI) | ‐2.5 [‐4.55, ‐0.45] |
| 15 Responder analysis I (responder: fall in LIC > 10%) Show forest plot | 1 | Risk Ratio (M‐H, Fixed, 95% CI) | Totals not selected | |
| Analysis 2.15  Comparison 2 Transfusion‐dependent thalassemia: deferasirox vs deferoxamine, Outcome 15 Responder analysis I (responder: fall in LIC > 10%). | ||||
| 15.1 Response at 48 weeks (deferasirox 10 mg/kg/day) | 1 | Risk Ratio (M‐H, Fixed, 95% CI) | 0.0 [0.0, 0.0] | |
| 15.2 Response at 48 weeks (deferasirox 20 mg/kg/day) | 1 | Risk Ratio (M‐H, Fixed, 95% CI) | 0.0 [0.0, 0.0] | |
| 16 Responder analysis II (responder: LIC 1 to < 7 mg Fe/g dw) Show forest plot | 1 | 553 | Risk Ratio (M‐H, Fixed, 95% CI) | 0.80 [0.69, 0.92] |
| Analysis 2.16 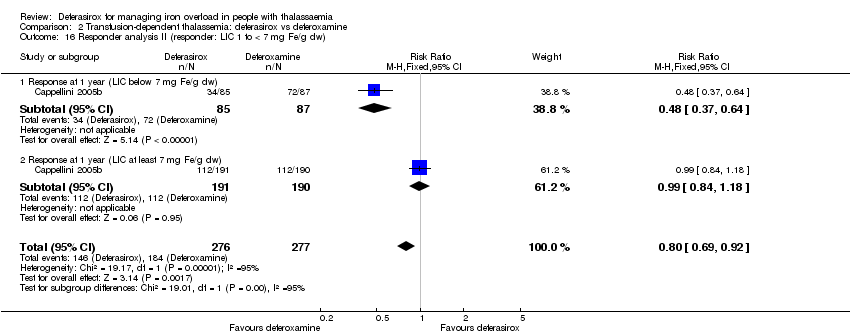 Comparison 2 Transfusion‐dependent thalassemia: deferasirox vs deferoxamine, Outcome 16 Responder analysis II (responder: LIC 1 to < 7 mg Fe/g dw). | ||||
| 16.1 Response at 1 year (LIC below 7 mg Fe/g dw) | 1 | 172 | Risk Ratio (M‐H, Fixed, 95% CI) | 0.48 [0.37, 0.64] |
| 16.2 Response at 1 year (LIC at least 7 mg Fe/g dw) | 1 | 381 | Risk Ratio (M‐H, Fixed, 95% CI) | 0.99 [0.84, 1.18] |
| 17 Myocardial T2* (ms): mean change from baseline Show forest plot | 1 | Mean Difference (IV, Fixed, 95% CI) | Totals not selected | |
| Analysis 2.17  Comparison 2 Transfusion‐dependent thalassemia: deferasirox vs deferoxamine, Outcome 17 Myocardial T2* (ms): mean change from baseline. | ||||
| 18 Myocardial iron concentration derived from T2* value (mg Fe/g dw): change from baseline Show forest plot | 1 | Mean Difference (IV, Fixed, 95% CI) | Totals not selected | |
| Analysis 2.18  Comparison 2 Transfusion‐dependent thalassemia: deferasirox vs deferoxamine, Outcome 18 Myocardial iron concentration derived from T2* value (mg Fe/g dw): change from baseline. | ||||
| 18.1 All participants | 1 | Mean Difference (IV, Fixed, 95% CI) | 0.0 [0.0, 0.0] | |
| 18.2 Participants with T2* <10 ms | 1 | Mean Difference (IV, Fixed, 95% CI) | 0.0 [0.0, 0.0] | |
| 18.3 Participants with T2* ≥10 ms | 1 | Mean Difference (IV, Fixed, 95% CI) | 0.0 [0.0, 0.0] | |
| 19 Myocardial T2* (# participants affected) Show forest plot | 1 | Risk Ratio (M‐H, Fixed, 95% CI) | Totals not selected | |
| Analysis 2.19  Comparison 2 Transfusion‐dependent thalassemia: deferasirox vs deferoxamine, Outcome 19 Myocardial T2* (# participants affected). | ||||
| 19.1 Normalization | 1 | Risk Ratio (M‐H, Fixed, 95% CI) | 0.0 [0.0, 0.0] | |
| 19.2 Improvement (from 6 ‐ < 10 ms to 10 ‐ ≤ 20 ms) | 1 | Risk Ratio (M‐H, Fixed, 95% CI) | 0.0 [0.0, 0.0] | |
| 19.3 Worsening (from 10‐ ≤ 20 ms to 6 ‐ < 10 ms) | 1 | Risk Ratio (M‐H, Fixed, 95% CI) | 0.0 [0.0, 0.0] | |
| 20 Iron excretion‐intake ratio Show forest plot | 1 | 541 | Mean Difference (IV, Fixed, 95% CI) | ‐0.18 [‐0.24, ‐0.12] |
| Analysis 2.20 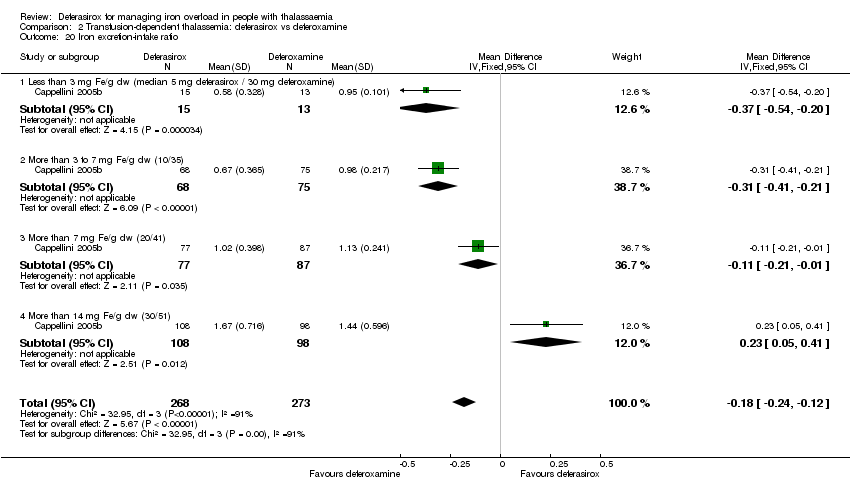 Comparison 2 Transfusion‐dependent thalassemia: deferasirox vs deferoxamine, Outcome 20 Iron excretion‐intake ratio. | ||||
| 20.1 Less than 3 mg Fe/g dw (median 5 mg deferasirox / 30 mg deferoxamine) | 1 | 28 | Mean Difference (IV, Fixed, 95% CI) | ‐0.37 [‐0.54, ‐0.20] |
| 20.2 More than 3 to 7 mg Fe/g dw (10/35) | 1 | 143 | Mean Difference (IV, Fixed, 95% CI) | ‐0.31 [‐0.41, ‐0.21] |
| 20.3 More than 7 mg Fe/g dw (20/41) | 1 | 164 | Mean Difference (IV, Fixed, 95% CI) | ‐0.11 [‐0.21, ‐0.01] |
| 20.4 More than 14 mg Fe/g dw (30/51) | 1 | 206 | Mean Difference (IV, Fixed, 95% CI) | 0.23 [0.05, 0.41] |
| 21 Any serious AEs (# participants affected) Show forest plot | 2 | 773 | Risk Ratio (M‐H, Fixed, 95% CI) | 0.88 [0.42, 1.86] |
| Analysis 2.21 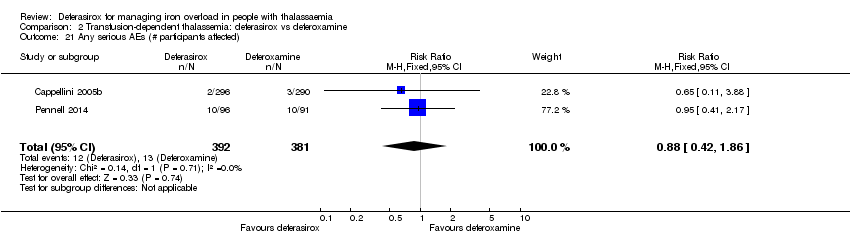 Comparison 2 Transfusion‐dependent thalassemia: deferasirox vs deferoxamine, Outcome 21 Any serious AEs (# participants affected). | ||||
| 22 Serious AEs Show forest plot | 1 | Risk Ratio (M‐H, Fixed, 95% CI) | Totals not selected | |
| Analysis 2.22  Comparison 2 Transfusion‐dependent thalassemia: deferasirox vs deferoxamine, Outcome 22 Serious AEs. | ||||
| 22.1 Cardiac disorders ‐ arrhythmia | 1 | Risk Ratio (M‐H, Fixed, 95% CI) | 0.0 [0.0, 0.0] | |
| 22.2 Endocrine disorders ‐ hypogonadism | 1 | Risk Ratio (M‐H, Fixed, 95% CI) | 0.0 [0.0, 0.0] | |
| 22.3 GI disorders abdominal abscess | 1 | Risk Ratio (M‐H, Fixed, 95% CI) | 0.0 [0.0, 0.0] | |
| 22.4 GI disorders amoebiasis | 1 | Risk Ratio (M‐H, Fixed, 95% CI) | 0.0 [0.0, 0.0] | |
| 22.5 GI disorders ‐ appendicitis | 1 | Risk Ratio (M‐H, Fixed, 95% CI) | 0.0 [0.0, 0.0] | |
| 22.6 GI disorders ‐ colitis | 1 | Risk Ratio (M‐H, Fixed, 95% CI) | 0.0 [0.0, 0.0] | |
| 22.7 GI disorders ‐ diarrhoea | 1 | Risk Ratio (M‐H, Fixed, 95% CI) | 0.0 [0.0, 0.0] | |
| 22.8 GI disorders ‐ gastric haemorrhage | 1 | Risk Ratio (M‐H, Fixed, 95% CI) | 0.0 [0.0, 0.0] | |
| 22.9 GI disorders ‐ gastroenteritis | 1 | Risk Ratio (M‐H, Fixed, 95% CI) | 0.0 [0.0, 0.0] | |
| 22.10 GI disorders ‐ ileus | 1 | Risk Ratio (M‐H, Fixed, 95% CI) | 0.0 [0.0, 0.0] | |
| 22.11 GI disorders ‐ upper abdominal pain | 1 | Risk Ratio (M‐H, Fixed, 95% CI) | 0.0 [0.0, 0.0] | |
| 22.12 GI disorders ‐ vomiting | 1 | Risk Ratio (M‐H, Fixed, 95% CI) | 0.0 [0.0, 0.0] | |
| 22.13 GI disorders ‐ GI infection | 1 | Risk Ratio (M‐H, Fixed, 95% CI) | 0.0 [0.0, 0.0] | |
| 22.14 General disorders and administration site conditions ‐ pyrexia | 1 | Risk Ratio (M‐H, Fixed, 95% CI) | 0.0 [0.0, 0.0] | |
| 22.15 General disorders and administration site conditions ‐ local swelling | 1 | Risk Ratio (M‐H, Fixed, 95% CI) | 0.0 [0.0, 0.0] | |
| 22.16 Hepatobiliary disorders ‐ liver abscess | 1 | Risk Ratio (M‐H, Fixed, 95% CI) | 0.0 [0.0, 0.0] | |
| 22.17 Hepatobiliary disorders ‐ cholelithiasis | 1 | Risk Ratio (M‐H, Fixed, 95% CI) | 0.0 [0.0, 0.0] | |
| 22.18 Immune system disorders ‐ face oedema | 1 | Risk Ratio (M‐H, Fixed, 95% CI) | 0.0 [0.0, 0.0] | |
| 22.19 Infections and infestations ‐ herpes zoster | 1 | Risk Ratio (M‐H, Fixed, 95% CI) | 0.0 [0.0, 0.0] | |
| 22.20 Infections and infestations ‐ tooth infection | 1 | Risk Ratio (M‐H, Fixed, 95% CI) | 0.0 [0.0, 0.0] | |
| 22.21 Infections and infestations ‐ urinary tract infection | 1 | Risk Ratio (M‐H, Fixed, 95% CI) | 0.0 [0.0, 0.0] | |
| 22.22 Injury, poisoning and procedural complications ‐ oesophageal rupture | 1 | Risk Ratio (M‐H, Fixed, 95% CI) | 0.0 [0.0, 0.0] | |
| 22.23 Injury, poisoning and procedural complications ‐ haemosiderosis | 1 | Risk Ratio (M‐H, Fixed, 95% CI) | 0.0 [0.0, 0.0] | |
| 22.24 Injury, poisoning and procedural complications ‐ iron overload | 1 | Risk Ratio (M‐H, Fixed, 95% CI) | 0.0 [0.0, 0.0] | |
| 22.25 Metabolism and nutrition disorders ‐ hyperglycaemia | 1 | Risk Ratio (M‐H, Fixed, 95% CI) | 0.0 [0.0, 0.0] | |
| 22.26 Musculoskeletal and connective tissue disorders ‐ back pain | 1 | Risk Ratio (M‐H, Fixed, 95% CI) | 0.0 [0.0, 0.0] | |
| 22.27 Musculoskeletal and connective tissue disorders ‐ pain in jaw | 1 | Risk Ratio (M‐H, Fixed, 95% CI) | 0.0 [0.0, 0.0] | |
| 22.28 Nervous system disorders ‐ grand mal convulsion | 1 | Risk Ratio (M‐H, Fixed, 95% CI) | 0.0 [0.0, 0.0] | |
| 22.29 Nervous system disorders ‐ meningitis | 1 | Risk Ratio (M‐H, Fixed, 95% CI) | 0.0 [0.0, 0.0] | |
| 22.30 Respiratory, thoracic and mediastinal disorders ‐ acute tonsilitis | 1 | Risk Ratio (M‐H, Fixed, 95% CI) | 0.0 [0.0, 0.0] | |
| 23 Any AE (# participants affected) Show forest plot | 2 | 258 | Risk Ratio (M‐H, Fixed, 95% CI) | 0.94 [0.83, 1.08] |
| Analysis 2.23  Comparison 2 Transfusion‐dependent thalassemia: deferasirox vs deferoxamine, Outcome 23 Any AE (# participants affected). | ||||
| 24 AEs Show forest plot | 5 | Risk Ratio (M‐H, Fixed, 95% CI) | Subtotals only | |
| Analysis 2.24  Comparison 2 Transfusion‐dependent thalassemia: deferasirox vs deferoxamine, Outcome 24 AEs. | ||||
| 24.1 Blood and lymphatic system disorder ‐ agranulocytosis | 2 | 657 | Risk Ratio (M‐H, Fixed, 95% CI) | 0.0 [0.0, 0.0] |
| 24.2 Blood and lymphatic system disorder ‐ leukopenia | 1 | 138 | Risk Ratio (M‐H, Fixed, 95% CI) | 7.0 [0.37, 133.02] |
| 24.3 Blood and lymphatic system disorder ‐ neutropenia | 1 | 71 | Risk Ratio (M‐H, Fixed, 95% CI) | 0.0 [0.0, 0.0] |
| 24.4 Blood and lymphatic system disorder ‐ thrombocytopenia | 2 | 209 | Risk Ratio (M‐H, Fixed, 95% CI) | 4.0 [0.46, 34.88] |
| 24.5 Cardiac disorders ‐ cardiac AE | 1 | 586 | Risk Ratio (M‐H, Fixed, 95% CI) | 0.73 [0.38, 1.41] |
| 24.6 Ear and labyrinth disorders ‐ hearing loss | 2 | 657 | Risk Ratio (M‐H, Fixed, 95% CI) | 1.12 [0.41, 3.05] |
| 24.7 Eye disorder ‐ lens abnormality | 2 | 657 | Risk Ratio (M‐H, Fixed, 95% CI) | 0.39 [0.08, 2.00] |
| 24.8 Eye disorder ‐ retinal abnormality | 1 | 71 | Risk Ratio (M‐H, Fixed, 95% CI) | 0.0 [0.0, 0.0] |
| 24.9 GI disorders ‐ abdominal pain | 2 | 258 | Risk Ratio (M‐H, Fixed, 95% CI) | 1.69 [0.93, 3.05] |
| 24.10 GI disorders ‐ abdominal pain upper | 1 | 187 | Risk Ratio (M‐H, Fixed, 95% CI) | 1.14 [0.36, 3.60] |
| 24.11 GI disorders ‐ diarrhoea | 2 | 258 | Risk Ratio (M‐H, Fixed, 95% CI) | 1.65 [0.86, 3.16] |
| 24.12 GI disorders ‐ dyspepsia | 1 | 71 | Risk Ratio (M‐H, Fixed, 95% CI) | 1.20 [0.25, 5.72] |
| 24.13 GI disorders ‐ GIT upset | 1 | 60 | Risk Ratio (M‐H, Fixed, 95% CI) | 3.0 [0.66, 13.69] |
| 24.14 GI disorders ‐ nausea | 2 | 258 | Risk Ratio (M‐H, Fixed, 95% CI) | 2.59 [0.90, 7.47] |
| 24.15 GI disorders ‐ vomiting | 2 | 258 | Risk Ratio (M‐H, Fixed, 95% CI) | 2.95 [0.91, 9.55] |
| 24.16 General disorders and administration site conditions ‐ asthenia | 1 | 71 | Risk Ratio (M‐H, Fixed, 95% CI) | 1.20 [0.42, 3.42] |
| 24.17 General disorders and administration site conditions ‐ influenza‐like illness | 1 | 71 | Risk Ratio (M‐H, Fixed, 95% CI) | 1.20 [0.42, 3.42] |
| 24.18 General disorders and administration site conditions ‐ pyrexia | 2 | 258 | Risk Ratio (M‐H, Fixed, 95% CI) | 1.27 [0.66, 2.44] |
| 24.19 Immune system disorders ‐ allergic conjunctivitis | 1 | 71 | Risk Ratio (M‐H, Fixed, 95% CI) | 4.41 [0.25, 78.58] |
| 24.20 Infections and infestations ‐ bronchitis | 1 | 71 | Risk Ratio (M‐H, Fixed, 95% CI) | 2.40 [0.30, 19.35] |
| 24.21 Infections and infestations ‐ upper respiratory tract infection | 1 | 187 | Risk Ratio (M‐H, Fixed, 95% CI) | 0.95 [0.37, 2.42] |
| 24.22 Infections and infestations ‐ urinary tract infection | 1 | 71 | Risk Ratio (M‐H, Fixed, 95% CI) | 2.40 [0.30, 19.35] |
| 24.23 Investigations ‐ ALT increased | 1 | 187 | Risk Ratio (M‐H, Fixed, 95% CI) | 1.71 [0.59, 4.90] |
| 24.24 Investigations ‐ elevated ALT (>2 UNL) | 1 | 586 | Risk Ratio (M‐H, Fixed, 95% CI) | 4.90 [0.24, 101.60] |
| 24.25 Investigations ‐ AST increased | 1 | 187 | Risk Ratio (M‐H, Fixed, 95% CI) | 2.21 [0.59, 8.29] |
| 24.26 Investigations ‐ blood creatinine increased | 1 | 187 | Risk Ratio (M‐H, Fixed, 95% CI) | 3.79 [0.83, 17.38] |
| 24.27 Investigations ‐ isolated serum creatinine increase above upper limit of normal | 2 | 657 | Risk Ratio (M‐H, Fixed, 95% CI) | 2.57 [1.88, 3.51] |
| 24.28 Investigations ‐ platelet count increased | 1 | 187 | Risk Ratio (M‐H, Fixed, 95% CI) | 0.38 [0.08, 1.91] |
| 24.29 Musculoskeletal and connective tissue disorders ‐ arthralgia | 2 | 258 | Risk Ratio (M‐H, Fixed, 95% CI) | 1.31 [0.55, 3.13] |
| 24.30 Musculoskeletal and connective tissue disorders ‐ back pain | 2 | 258 | Risk Ratio (M‐H, Fixed, 95% CI) | 1.30 [0.73, 2.34] |
| 24.31 Musculoskeletal and connective tissue disorders ‐ osteoporosis | 1 | 187 | Risk Ratio (M‐H, Fixed, 95% CI) | 2.37 [0.47, 11.91] |
| 24.32 Nervous system disorders ‐ headache | 2 | 258 | Risk Ratio (M‐H, Fixed, 95% CI) | 1.44 [0.68, 3.05] |
| 24.33 Nervous system disorders ‐ vertigo | 1 | 71 | Risk Ratio (M‐H, Fixed, 95% CI) | 1.12 [0.32, 3.93] |
| 24.34 Renal and urinary disorders ‐ proteinuria | 1 | 187 | Risk Ratio (M‐H, Fixed, 95% CI) | 1.16 [0.50, 2.66] |
| 24.35 Respiratory, thoracic and mediastinal disorders ‐ cough | 1 | 71 | Risk Ratio (M‐H, Fixed, 95% CI) | 1.80 [0.67, 4.81] |
| 24.36 Respiratory, thoracic and mediastinal disorders ‐ influenza | 2 | 258 | Risk Ratio (M‐H, Fixed, 95% CI) | 1.05 [0.52, 2.13] |
| 24.37 Respiratory, thoracic and mediastinal disorders ‐ nasopharyngitis | 1 | 187 | Risk Ratio (M‐H, Fixed, 95% CI) | 1.90 [0.59, 6.08] |
| 24.38 Respiratory, thoracic and mediastinal disorders ‐ oropharyngeal pain | 1 | 187 | Risk Ratio (M‐H, Fixed, 95% CI) | 2.84 [0.59, 13.73] |
| 24.39 Respiratory, thoracic and mediastinal disorders ‐ pharyngitis | 1 | 71 | Risk Ratio (M‐H, Fixed, 95% CI) | 1.02 [0.52, 2.00] |
| 24.40 Respiratory, thoracic and mediastinal disorders ‐ pharyngolaryngeal pain | 1 | 71 | Risk Ratio (M‐H, Fixed, 95% CI) | 0.88 [0.37, 2.08] |
| 24.41 Respiratory, thoracic and mediastinal disorders ‐ rhinitis | 1 | 71 | Risk Ratio (M‐H, Fixed, 95% CI) | 1.28 [0.58, 2.83] |
| 24.42 Skin and subcutaneous tissue disorders ‐ Rash | 1 | 60 | Risk Ratio (M‐H, Fixed, 95% CI) | 2.67 [0.78, 9.09] |
| 25 Any drug‐related AE (# participants affected) Show forest plot | 1 | Risk Ratio (M‐H, Fixed, 95% CI) | Totals not selected | |
| Analysis 2.25  Comparison 2 Transfusion‐dependent thalassemia: deferasirox vs deferoxamine, Outcome 25 Any drug‐related AE (# participants affected). | ||||
| 26 Drug‐related AEs Show forest plot | 2 | Risk Ratio (M‐H, Fixed, 95% CI) | Totals not selected | |
| Analysis 2.26  Comparison 2 Transfusion‐dependent thalassemia: deferasirox vs deferoxamine, Outcome 26 Drug‐related AEs. | ||||
| 26.1 Blood and lymphatic system disorder ‐ neutropenia | 1 | Risk Ratio (M‐H, Fixed, 95% CI) | 0.0 [0.0, 0.0] | |
| 26.2 Injury, poisoning and procedural complications ‐ infusion site haemorrhage | 1 | Risk Ratio (M‐H, Fixed, 95% CI) | 0.0 [0.0, 0.0] | |
| 26.3 Injury, poisoning and procedural complications ‐ infusion site pain | 1 | Risk Ratio (M‐H, Fixed, 95% CI) | 0.0 [0.0, 0.0] | |
| 26.4 Injury, poisoning and procedural complications ‐ infusion site swelling | 1 | Risk Ratio (M‐H, Fixed, 95% CI) | 0.0 [0.0, 0.0] | |
| 26.5 Injury, poisoning and procedural complications ‐ injection site pain | 1 | Risk Ratio (M‐H, Fixed, 95% CI) | 0.0 [0.0, 0.0] | |
| 26.6 Injury, poisoning and procedural complications ‐ injection site reaction | 1 | Risk Ratio (M‐H, Fixed, 95% CI) | 0.0 [0.0, 0.0] | |
| 26.7 Investigations ‐ blood creatinine increased | 1 | Risk Ratio (M‐H, Fixed, 95% CI) | 0.0 [0.0, 0.0] | |
| 26.8 Investigations ‐ ALT increased | 1 | Risk Ratio (M‐H, Fixed, 95% CI) | 0.0 [0.0, 0.0] | |
| 26.9 Investigations ‐ AST increased | 1 | Risk Ratio (M‐H, Fixed, 95% CI) | 0.0 [0.0, 0.0] | |
| 26.10 GI disorders ‐ abdominal pain | 1 | Risk Ratio (M‐H, Fixed, 95% CI) | 0.0 [0.0, 0.0] | |
| 26.11 GI disorders ‐ abdominal pain upper | 1 | Risk Ratio (M‐H, Fixed, 95% CI) | 0.0 [0.0, 0.0] | |
| 26.12 GI disorders ‐ diarrhoea | 1 | Risk Ratio (M‐H, Fixed, 95% CI) | 0.0 [0.0, 0.0] | |
| 26.13 GI disorders ‐ nausea | 1 | Risk Ratio (M‐H, Fixed, 95% CI) | 0.0 [0.0, 0.0] | |
| 26.14 GI disorders ‐ vomiting | 1 | Risk Ratio (M‐H, Fixed, 95% CI) | 0.0 [0.0, 0.0] | |
| 26.15 Immune system disorders ‐ hypersensitivity | 1 | Risk Ratio (M‐H, Fixed, 95% CI) | 0.0 [0.0, 0.0] | |
| 26.16 Immune system disorders ‐ urticaria | 1 | Risk Ratio (M‐H, Fixed, 95% CI) | 0.0 [0.0, 0.0] | |
| 26.17 Musculoskeletal and connective tissue disorders ‐ arthropathy | 1 | Risk Ratio (M‐H, Fixed, 95% CI) | 0.0 [0.0, 0.0] | |
| 26.18 Renal and urinary disorders ‐ proteinuria | 1 | Risk Ratio (M‐H, Fixed, 95% CI) | 0.0 [0.0, 0.0] | |
| 26.19 Skin and subcutaneous tissue disorders ‐ alopecia | 1 | Risk Ratio (M‐H, Fixed, 95% CI) | 0.0 [0.0, 0.0] | |
| 26.20 Skin and subcutaneous tissue disorders ‐ rash | 1 | Risk Ratio (M‐H, Fixed, 95% CI) | 0.0 [0.0, 0.0] | |
| 26.21 Injury, poisoning and procedural complications ‐ pulmonary toxicity | 1 | Risk Ratio (M‐H, Fixed, 95% CI) | 0.0 [0.0, 0.0] | |
| 26.22 Eye disorders ‐ Ophthalmological toxicity | 1 | Risk Ratio (M‐H, Fixed, 95% CI) | 0.0 [0.0, 0.0] | |
| 26.23 Ear and labyrinth disorders ‐ Audiological toxicity | 1 | Risk Ratio (M‐H, Fixed, 95% CI) | 0.0 [0.0, 0.0] | |
| 27 Satisfaction with treatment (very satisfied or satisfied) Show forest plot | 1 | Risk Ratio (M‐H, Fixed, 95% CI) | Totals not selected | |
| Analysis 2.27  Comparison 2 Transfusion‐dependent thalassemia: deferasirox vs deferoxamine, Outcome 27 Satisfaction with treatment (very satisfied or satisfied). | ||||
| 27.1 Week 4 ‐ participants previously treated with DFO | 1 | Risk Ratio (M‐H, Fixed, 95% CI) | 0.0 [0.0, 0.0] | |
| 27.2 Week 24 ‐ participants previously treated with DFO | 1 | Risk Ratio (M‐H, Fixed, 95% CI) | 0.0 [0.0, 0.0] | |
| 27.3 End of study (1 year) ‐ participants previously treated with DFO | 1 | Risk Ratio (M‐H, Fixed, 95% CI) | 0.0 [0.0, 0.0] | |
| 27.4 Week 4 ‐ DFO‐naive participants | 1 | Risk Ratio (M‐H, Fixed, 95% CI) | 0.0 [0.0, 0.0] | |
| 27.5 Week 24 ‐ DFO‐naive participants | 1 | Risk Ratio (M‐H, Fixed, 95% CI) | 0.0 [0.0, 0.0] | |
| 27.6 End of study (1 year) ‐ DFO‐naive participants | 1 | Risk Ratio (M‐H, Fixed, 95% CI) | 0.0 [0.0, 0.0] | |
| 28 Convenience (good or very good) Show forest plot | 1 | Risk Ratio (M‐H, Fixed, 95% CI) | Totals not selected | |
| Analysis 2.28 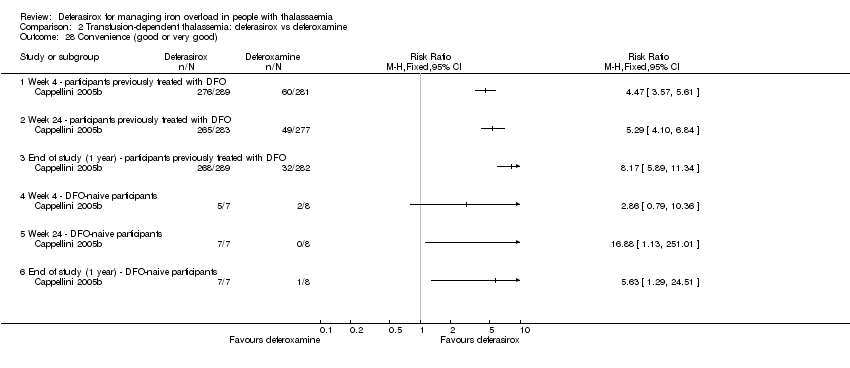 Comparison 2 Transfusion‐dependent thalassemia: deferasirox vs deferoxamine, Outcome 28 Convenience (good or very good). | ||||
| 28.1 Week 4 ‐ participants previously treated with DFO | 1 | Risk Ratio (M‐H, Fixed, 95% CI) | 0.0 [0.0, 0.0] | |
| 28.2 Week 24 ‐ participants previously treated with DFO | 1 | Risk Ratio (M‐H, Fixed, 95% CI) | 0.0 [0.0, 0.0] | |
| 28.3 End of study (1 year) ‐ participants previously treated with DFO | 1 | Risk Ratio (M‐H, Fixed, 95% CI) | 0.0 [0.0, 0.0] | |
| 28.4 Week 4 ‐ DFO‐naive participants | 1 | Risk Ratio (M‐H, Fixed, 95% CI) | 0.0 [0.0, 0.0] | |
| 28.5 Week 24 ‐ DFO‐naive participants | 1 | Risk Ratio (M‐H, Fixed, 95% CI) | 0.0 [0.0, 0.0] | |
| 28.6 End of study (1 year) ‐ DFO‐naive participants | 1 | Risk Ratio (M‐H, Fixed, 95% CI) | 0.0 [0.0, 0.0] | |
| 29 Willingness to continue treatment Show forest plot | 1 | Risk Ratio (M‐H, Fixed, 95% CI) | Totals not selected | |
| Analysis 2.29 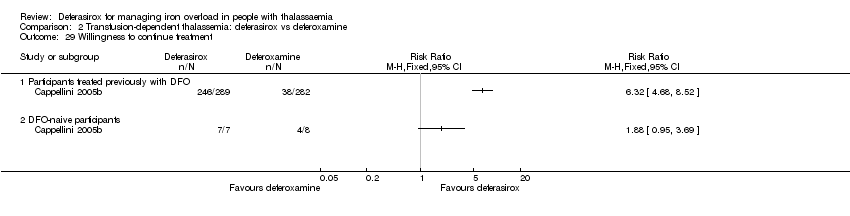 Comparison 2 Transfusion‐dependent thalassemia: deferasirox vs deferoxamine, Outcome 29 Willingness to continue treatment. | ||||
| 29.1 Participants treated previously with DFO | 1 | Risk Ratio (M‐H, Fixed, 95% CI) | 0.0 [0.0, 0.0] | |
| 29.2 DFO‐naive participants | 1 | Risk Ratio (M‐H, Fixed, 95% CI) | 0.0 [0.0, 0.0] | |
| 30 Time lost from normal activities due to treatment (hours/month): participants treated previously with DFO Show forest plot | 1 | Mean Difference (IV, Fixed, 95% CI) | Totals not selected | |
| Analysis 2.30  Comparison 2 Transfusion‐dependent thalassemia: deferasirox vs deferoxamine, Outcome 30 Time lost from normal activities due to treatment (hours/month): participants treated previously with DFO. | ||||
| 30.1 week 4 ‐ patients treated previously with DFO | 1 | Mean Difference (IV, Fixed, 95% CI) | 0.0 [0.0, 0.0] | |
| 30.2 week 24 ‐ patients treated previously with DFO | 1 | Mean Difference (IV, Fixed, 95% CI) | 0.0 [0.0, 0.0] | |
| 30.3 end of study (1 year) ‐ patients treated previously with DFO | 1 | Mean Difference (IV, Fixed, 95% CI) | 0.0 [0.0, 0.0] | |
| 30.4 week 4 ‐ DFO‐naive patients | 1 | Mean Difference (IV, Fixed, 95% CI) | 0.0 [0.0, 0.0] | |
| 30.5 week 24 ‐ DFO‐naive patients | 1 | Mean Difference (IV, Fixed, 95% CI) | 0.0 [0.0, 0.0] | |
| 30.6 end of study (1 year) ‐ DFO‐naive patients | 1 | Mean Difference (IV, Fixed, 95% CI) | 0.0 [0.0, 0.0] | |
| 31 Adherence (% of planned dose) Show forest plot | 1 | Mean Difference (IV, Fixed, 95% CI) | Totals not selected | |
| Analysis 2.31  Comparison 2 Transfusion‐dependent thalassemia: deferasirox vs deferoxamine, Outcome 31 Adherence (% of planned dose). | ||||
| 32 Discontinuations Show forest plot | 8 | 1211 | Risk Ratio (M‐H, Fixed, 95% CI) | 0.95 [0.60, 1.50] |
| Analysis 2.32  Comparison 2 Transfusion‐dependent thalassemia: deferasirox vs deferoxamine, Outcome 32 Discontinuations. | ||||
| 32.1 Deferasirox 10 mg/kg/day | 1 | 35 | Risk Ratio (M‐H, Fixed, 95% CI) | 0.16 [0.01, 3.64] |
| 32.2 Deferasirox 20 mg/kg/day | 2 | 174 | Risk Ratio (M‐H, Fixed, 95% CI) | 1.0 [0.10, 9.96] |
| 32.3 Deferasirox 25 mg/kg/day | 1 | 120 | Risk Ratio (M‐H, Fixed, 95% CI) | 0.09 [0.01, 1.61] |
| 32.4 Deferasirox 40 mg/kg/day | 2 | 211 | Risk Ratio (M‐H, Fixed, 95% CI) | 1.02 [0.51, 2.05] |
| 32.5 Deferasirox ‐ variable dosage | 2 | 646 | Risk Ratio (M‐H, Fixed, 95% CI) | 1.39 [0.67, 2.85] |
| 32.6 Deferasirox dosing unknown | 1 | 25 | Risk Ratio (M‐H, Fixed, 95% CI) | 0.0 [0.0, 0.0] |
| 33 Dose adjustments and dose interruptions Show forest plot | 1 | Risk Ratio (M‐H, Fixed, 95% CI) | Totals not selected | |
| Analysis 2.33  Comparison 2 Transfusion‐dependent thalassemia: deferasirox vs deferoxamine, Outcome 33 Dose adjustments and dose interruptions. | ||||
| 34 Dose interruptions (interrupted at least once) Show forest plot | 1 | Risk Ratio (M‐H, Fixed, 95% CI) | Totals not selected | |
| Analysis 2.34 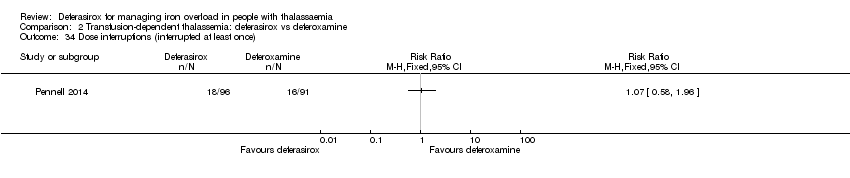 Comparison 2 Transfusion‐dependent thalassemia: deferasirox vs deferoxamine, Outcome 34 Dose interruptions (interrupted at least once). | ||||
| 35 Dose reduction (at least once) Show forest plot | 1 | Risk Ratio (M‐H, Fixed, 95% CI) | Totals not selected | |
| Analysis 2.35  Comparison 2 Transfusion‐dependent thalassemia: deferasirox vs deferoxamine, Outcome 35 Dose reduction (at least once). | ||||
| 36 Dose adjustments (# participants affected) Show forest plot | 1 | Risk Ratio (M‐H, Fixed, 95% CI) | Totals not selected | |
| Analysis 2.36  Comparison 2 Transfusion‐dependent thalassemia: deferasirox vs deferoxamine, Outcome 36 Dose adjustments (# participants affected). | ||||
| 37 Dose interruptions due to an AE (# participants affected) Show forest plot | 1 | Risk Ratio (M‐H, Fixed, 95% CI) | Totals not selected | |
| Analysis 2.37  Comparison 2 Transfusion‐dependent thalassemia: deferasirox vs deferoxamine, Outcome 37 Dose interruptions due to an AE (# participants affected). | ||||
| 38 Haemoglobin (g/dL): mean change from baseline and at end of study Show forest plot | 2 | 180 | Mean Difference (IV, Fixed, 95% CI) | ‐0.52 [‐0.82, ‐0.21] |
| Analysis 2.38  Comparison 2 Transfusion‐dependent thalassemia: deferasirox vs deferoxamine, Outcome 38 Haemoglobin (g/dL): mean change from baseline and at end of study. | ||||
| 38.1 At 8 months (change from baseline) | 1 | 138 | Mean Difference (IV, Fixed, 95% CI) | ‐0.46 [‐0.81, ‐0.11] |
| 38.2 At 1 year (at end of study) | 1 | 42 | Mean Difference (IV, Fixed, 95% CI) | ‐0.70 [‐1.33, ‐0.07] |
| 39 Transfusion index (mL/kg/year): mean at end of study Show forest plot | 1 | Mean Difference (IV, Fixed, 95% CI) | Totals not selected | |
| Analysis 2.39  Comparison 2 Transfusion‐dependent thalassemia: deferasirox vs deferoxamine, Outcome 39 Transfusion index (mL/kg/year): mean at end of study. | ||||
| 40 Transferrin saturation (%): mean at end of study Show forest plot | 1 | Mean Difference (IV, Fixed, 95% CI) | Totals not selected | |
| Analysis 2.40 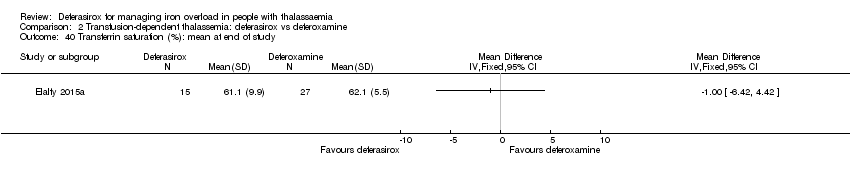 Comparison 2 Transfusion‐dependent thalassemia: deferasirox vs deferoxamine, Outcome 40 Transferrin saturation (%): mean at end of study. | ||||
| 41 Platelet count (x10³/mm³): mean at end of study Show forest plot | 1 | Mean Difference (IV, Fixed, 95% CI) | Totals not selected | |
| Analysis 2.41  Comparison 2 Transfusion‐dependent thalassemia: deferasirox vs deferoxamine, Outcome 41 Platelet count (x10³/mm³): mean at end of study. | ||||
| 42 Absolute neutrophilic count (/mm³): mean at end of study Show forest plot | 1 | Mean Difference (IV, Fixed, 95% CI) | Totals not selected | |
| Analysis 2.42  Comparison 2 Transfusion‐dependent thalassemia: deferasirox vs deferoxamine, Outcome 42 Absolute neutrophilic count (/mm³): mean at end of study. | ||||
| Outcome or subgroup title | No. of studies | No. of participants | Statistical method | Effect size |
| 1 Mortality at any time point Show forest plot | 3 | 146 | Risk Ratio (M‐H, Fixed, 95% CI) | 0.0 [0.0, 0.0] |
| Analysis 3.1 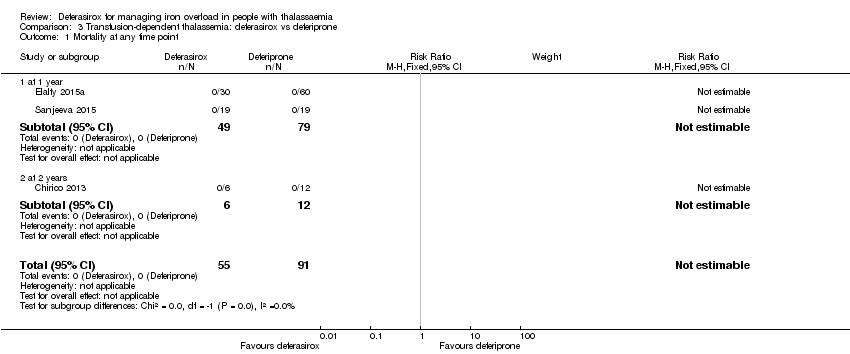 Comparison 3 Transfusion‐dependent thalassemia: deferasirox vs deferiprone, Outcome 1 Mortality at any time point. | ||||
| 1.1 at 1 year | 2 | 128 | Risk Ratio (M‐H, Fixed, 95% CI) | 0.0 [0.0, 0.0] |
| 1.2 at 2 years | 1 | 18 | Risk Ratio (M‐H, Fixed, 95% CI) | 0.0 [0.0, 0.0] |
| 2 Incidence of thyroid disease at end of study Show forest plot | 1 | Risk Ratio (M‐H, Fixed, 95% CI) | Totals not selected | |
| Analysis 3.2  Comparison 3 Transfusion‐dependent thalassemia: deferasirox vs deferiprone, Outcome 2 Incidence of thyroid disease at end of study. | ||||
| 3 ALT (U/L): mean change from baseline Show forest plot | 1 | Mean Difference (IV, Fixed, 95% CI) | Totals not selected | |
| Analysis 3.3  Comparison 3 Transfusion‐dependent thalassemia: deferasirox vs deferiprone, Outcome 3 ALT (U/L): mean change from baseline. | ||||
| 4 AST (U/L): mean change from baseline Show forest plot | 1 | Mean Difference (IV, Fixed, 95% CI) | Totals not selected | |
| Analysis 3.4  Comparison 3 Transfusion‐dependent thalassemia: deferasirox vs deferiprone, Outcome 4 AST (U/L): mean change from baseline. | ||||
| 5 Urea (mg/dL): mean change from baseline Show forest plot | 1 | Mean Difference (IV, Fixed, 95% CI) | Totals not selected | |
| Analysis 3.5 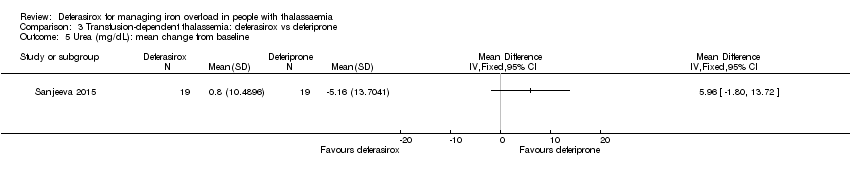 Comparison 3 Transfusion‐dependent thalassemia: deferasirox vs deferiprone, Outcome 5 Urea (mg/dL): mean change from baseline. | ||||
| 6 Creatinine (mg/dL): mean change from baseline Show forest plot | 1 | Mean Difference (IV, Fixed, 95% CI) | Totals not selected | |
| Analysis 3.6  Comparison 3 Transfusion‐dependent thalassemia: deferasirox vs deferiprone, Outcome 6 Creatinine (mg/dL): mean change from baseline. | ||||
| 7 Neutrophil (count per mm³): mean change from baseline Show forest plot | 1 | Mean Difference (IV, Fixed, 95% CI) | Totals not selected | |
| Analysis 3.7  Comparison 3 Transfusion‐dependent thalassemia: deferasirox vs deferiprone, Outcome 7 Neutrophil (count per mm³): mean change from baseline. | ||||
| 8 Serum ferritin (ng/mL): mean change from baseline and at end of study Show forest plot | 2 | Mean Difference (IV, Fixed, 95% CI) | Subtotals only | |
| Analysis 3.8  Comparison 3 Transfusion‐dependent thalassemia: deferasirox vs deferiprone, Outcome 8 Serum ferritin (ng/mL): mean change from baseline and at end of study. | ||||
| 8.1 All participants | 2 | 83 | Mean Difference (IV, Fixed, 95% CI) | 229.99 [‐403.14, 863.11] |
| 8.2 Ferritin > 4000 | 1 | 11 | Mean Difference (IV, Fixed, 95% CI) | 1129.0 [‐2226.18, 4484.18] |
| 8.3 Ferritin 2000 ‐ 4000 | 1 | 16 | Mean Difference (IV, Fixed, 95% CI) | ‐151.0 [‐743.80, 441.80] |
| 8.4 Ferritin < 2000 | 1 | 11 | Mean Difference (IV, Fixed, 95% CI) | 388.0 [‐255.71, 1031.71] |
| 9 LIC (mg/g) evaluated by MRI (R2*): mean change from baseline Show forest plot | 1 | Mean Difference (IV, Fixed, 95% CI) | Totals not selected | |
| Analysis 3.9  Comparison 3 Transfusion‐dependent thalassemia: deferasirox vs deferiprone, Outcome 9 LIC (mg/g) evaluated by MRI (R2*): mean change from baseline. | ||||
| 10 Myocardial T2* (ms): mean change from baseline Show forest plot | 1 | Mean Difference (IV, Fixed, 95% CI) | Totals not selected | |
| Analysis 3.10  Comparison 3 Transfusion‐dependent thalassemia: deferasirox vs deferiprone, Outcome 10 Myocardial T2* (ms): mean change from baseline. | ||||
| 11 Any AE (# participants affected) Show forest plot | 1 | Risk Ratio (M‐H, Fixed, 95% CI) | Totals not selected | |
| Analysis 3.11  Comparison 3 Transfusion‐dependent thalassemia: deferasirox vs deferiprone, Outcome 11 Any AE (# participants affected). | ||||
| 12 AEs Show forest plot | 1 | Risk Ratio (M‐H, Fixed, 95% CI) | Totals not selected | |
| Analysis 3.12  Comparison 3 Transfusion‐dependent thalassemia: deferasirox vs deferiprone, Outcome 12 AEs. | ||||
| 12.1 GI disorders ‐ diarrhoea | 1 | Risk Ratio (M‐H, Fixed, 95% CI) | 0.0 [0.0, 0.0] | |
| 12.2 GI disorders ‐ nausea | 1 | Risk Ratio (M‐H, Fixed, 95% CI) | 0.0 [0.0, 0.0] | |
| 12.3 GI disorders ‐ pain abdomen | 1 | Risk Ratio (M‐H, Fixed, 95% CI) | 0.0 [0.0, 0.0] | |
| 12.4 GI disorders ‐ vomiting | 1 | Risk Ratio (M‐H, Fixed, 95% CI) | 0.0 [0.0, 0.0] | |
| 12.5 Musculoskeletal and connective tissue disorders ‐ arthralgia | 1 | Risk Ratio (M‐H, Fixed, 95% CI) | 0.0 [0.0, 0.0] | |
| 12.6 Skin and subcutaneous tissue disorders ‐ rash | 1 | Risk Ratio (M‐H, Fixed, 95% CI) | 0.0 [0.0, 0.0] | |
| 12.7 Blood and lymphatic system disorder ‐ agranulocytosis | 1 | Risk Ratio (M‐H, Fixed, 95% CI) | 0.0 [0.0, 0.0] | |
| 12.8 Blood and lymphatic system disorder ‐ neutropenia | 1 | Risk Ratio (M‐H, Fixed, 95% CI) | 0.0 [0.0, 0.0] | |
| 12.9 Investigations ‐ AST levels > 2x UNL | 1 | Risk Ratio (M‐H, Fixed, 95% CI) | 0.0 [0.0, 0.0] | |
| 12.10 Investigations ‐ ALT levels > 2x UNL | 1 | Risk Ratio (M‐H, Fixed, 95% CI) | 0.0 [0.0, 0.0] | |
| 12.11 Investigations ‐ serum creatinine 50% increase from baseline | 1 | Risk Ratio (M‐H, Fixed, 95% CI) | 0.0 [0.0, 0.0] | |
| 12.12 Renal and urinary disorders ‐ renal failure | 1 | Risk Ratio (M‐H, Fixed, 95% CI) | 0.0 [0.0, 0.0] | |
| 13 Discontinuations (# participants affected) Show forest plot | 3 | 179 | Risk Ratio (M‐H, Fixed, 95% CI) | 0.16 [0.01, 2.99] |
| Analysis 3.13  Comparison 3 Transfusion‐dependent thalassemia: deferasirox vs deferiprone, Outcome 13 Discontinuations (# participants affected). | ||||
| 14 Discontinuation due to an AE (# participants affected) Show forest plot | 1 | Risk Ratio (M‐H, Fixed, 95% CI) | Totals not selected | |
| Analysis 3.14  Comparison 3 Transfusion‐dependent thalassemia: deferasirox vs deferiprone, Outcome 14 Discontinuation due to an AE (# participants affected). | ||||
| 15 Transferrin saturation (%): mean at end of study Show forest plot | 1 | Mean Difference (IV, Fixed, 95% CI) | Totals not selected | |
| Analysis 3.15 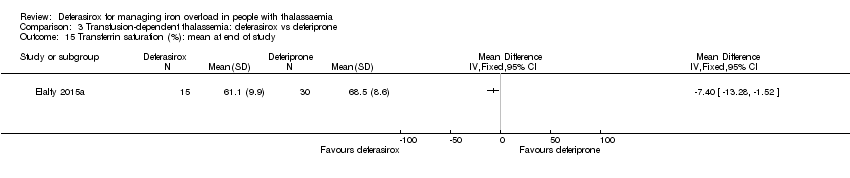 Comparison 3 Transfusion‐dependent thalassemia: deferasirox vs deferiprone, Outcome 15 Transferrin saturation (%): mean at end of study. | ||||
| 16 Haemoglobin (g/dL): mean at end of study Show forest plot | 1 | Mean Difference (IV, Fixed, 95% CI) | Totals not selected | |
| Analysis 3.16  Comparison 3 Transfusion‐dependent thalassemia: deferasirox vs deferiprone, Outcome 16 Haemoglobin (g/dL): mean at end of study. | ||||
| 17 Transfusion index (mL/kg/year): mean at end of study Show forest plot | 1 | Mean Difference (IV, Fixed, 95% CI) | Totals not selected | |
| Analysis 3.17 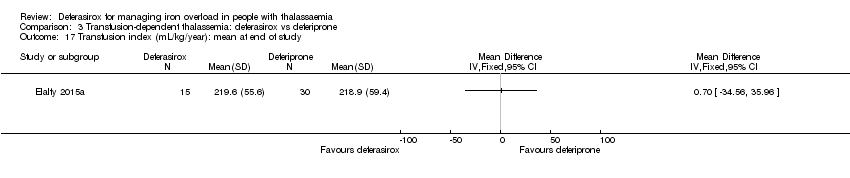 Comparison 3 Transfusion‐dependent thalassemia: deferasirox vs deferiprone, Outcome 17 Transfusion index (mL/kg/year): mean at end of study. | ||||
| 18 ALP (U/L): mean change from baseline Show forest plot | 1 | Mean Difference (IV, Fixed, 95% CI) | Totals not selected | |
| Analysis 3.18 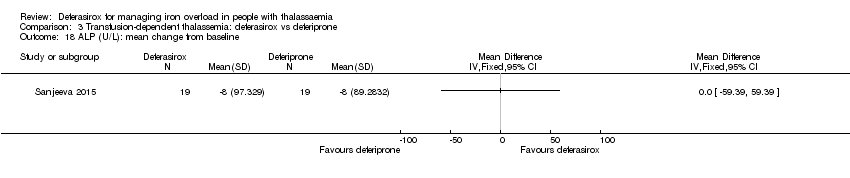 Comparison 3 Transfusion‐dependent thalassemia: deferasirox vs deferiprone, Outcome 18 ALP (U/L): mean change from baseline. | ||||
| Outcome or subgroup title | No. of studies | No. of participants | Statistical method | Effect size |
| 1 Mortality at any time point Show forest plot | 1 | Risk Ratio (M‐H, Fixed, 95% CI) | Totals not selected | |
| Analysis 6.1  Comparison 6 Transfusion‐dependent thalassemia: deferasirox + deferoxamine vs deferoxamine, Outcome 1 Mortality at any time point. | ||||
| 1.1 at 12 months | 1 | Risk Ratio (M‐H, Fixed, 95% CI) | 0.0 [0.0, 0.0] | |
| 2 Neutrophil (µg/L): mean at end of study Show forest plot | 1 | Mean Difference (IV, Fixed, 95% CI) | Totals not selected | |
| Analysis 6.2  Comparison 6 Transfusion‐dependent thalassemia: deferasirox + deferoxamine vs deferoxamine, Outcome 2 Neutrophil (µg/L): mean at end of study. | ||||
| 3 ALT (g/dL): mean at end of study Show forest plot | 1 | Mean Difference (IV, Fixed, 95% CI) | Totals not selected | |
| Analysis 6.3 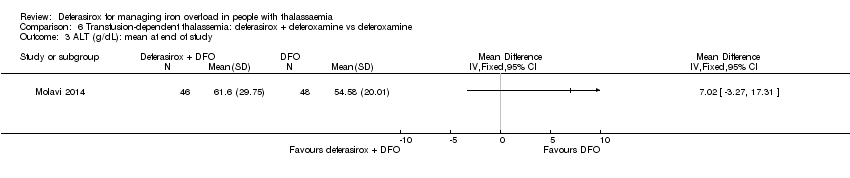 Comparison 6 Transfusion‐dependent thalassemia: deferasirox + deferoxamine vs deferoxamine, Outcome 3 ALT (g/dL): mean at end of study. | ||||
| 4 AST (g/dL): mean at end of study Show forest plot | 1 | Mean Difference (IV, Fixed, 95% CI) | Totals not selected | |
| Analysis 6.4  Comparison 6 Transfusion‐dependent thalassemia: deferasirox + deferoxamine vs deferoxamine, Outcome 4 AST (g/dL): mean at end of study. | ||||
| 5 Serum ferritin: mean at end of study (ng/mL) Show forest plot | 1 | Mean Difference (IV, Fixed, 95% CI) | Totals not selected | |
| Analysis 6.5  Comparison 6 Transfusion‐dependent thalassemia: deferasirox + deferoxamine vs deferoxamine, Outcome 5 Serum ferritin: mean at end of study (ng/mL). | ||||
| 6 Discontinuations Show forest plot | 1 | Risk Ratio (M‐H, Fixed, 95% CI) | Totals not selected | |
| Analysis 6.6  Comparison 6 Transfusion‐dependent thalassemia: deferasirox + deferoxamine vs deferoxamine, Outcome 6 Discontinuations. | ||||
| 7 Haemoglobin (g/dL): mean at end of study Show forest plot | 1 | Mean Difference (IV, Fixed, 95% CI) | Totals not selected | |
| Analysis 6.7 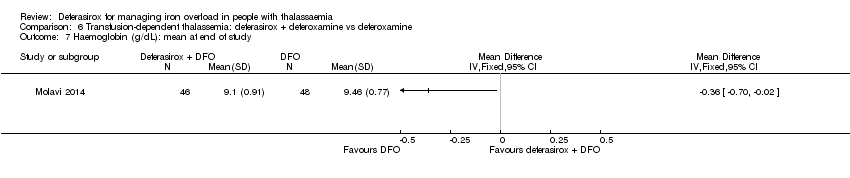 Comparison 6 Transfusion‐dependent thalassemia: deferasirox + deferoxamine vs deferoxamine, Outcome 7 Haemoglobin (g/dL): mean at end of study. | ||||
| 8 ALP (g/dL): mean at end of study Show forest plot | 1 | Mean Difference (IV, Fixed, 95% CI) | Totals not selected | |
| Analysis 6.8  Comparison 6 Transfusion‐dependent thalassemia: deferasirox + deferoxamine vs deferoxamine, Outcome 8 ALP (g/dL): mean at end of study. | ||||
| Outcome or subgroup title | No. of studies | No. of participants | Statistical method | Effect size |
| 1 Mortality at any time point Show forest plot | 1 | Risk Ratio (M‐H, Fixed, 95% CI) | Totals not selected | |
| Analysis 7.1  Comparison 7 Transfusion‐dependent thalassemia: deferasirox + deferiprone vs deferiprone + deferoxamine, Outcome 1 Mortality at any time point. | ||||
| 1.1 at 12 months | 1 | Risk Ratio (M‐H, Fixed, 95% CI) | 0.0 [0.0, 0.0] | |
| 2 Serum ferritin (ng/mL): mean change from baseline Show forest plot | 1 | Mean Difference (IV, Fixed, 95% CI) | Totals not selected | |
| Analysis 7.2  Comparison 7 Transfusion‐dependent thalassemia: deferasirox + deferiprone vs deferiprone + deferoxamine, Outcome 2 Serum ferritin (ng/mL): mean change from baseline. | ||||
| 3 LIC (mg/g) evaluated by MRI (R2*): mean change from baseline Show forest plot | 1 | Mean Difference (IV, Fixed, 95% CI) | Totals not selected | |
| Analysis 7.3  Comparison 7 Transfusion‐dependent thalassemia: deferasirox + deferiprone vs deferiprone + deferoxamine, Outcome 3 LIC (mg/g) evaluated by MRI (R2*): mean change from baseline. | ||||
| 4 Myocardial T2* (ms): mean change from baseline Show forest plot | 1 | Mean Difference (IV, Fixed, 95% CI) | Totals not selected | |
| Analysis 7.4  Comparison 7 Transfusion‐dependent thalassemia: deferasirox + deferiprone vs deferiprone + deferoxamine, Outcome 4 Myocardial T2* (ms): mean change from baseline. | ||||
| 5 Serious AE (# participants affected) Show forest plot | 1 | Risk Ratio (M‐H, Fixed, 95% CI) | Totals not selected | |
| Analysis 7.5  Comparison 7 Transfusion‐dependent thalassemia: deferasirox + deferiprone vs deferiprone + deferoxamine, Outcome 5 Serious AE (# participants affected). | ||||
| 6 Serious drug‐related AE (# participants affected) Show forest plot | 1 | Risk Ratio (M‐H, Fixed, 95% CI) | Totals not selected | |
| Analysis 7.6  Comparison 7 Transfusion‐dependent thalassemia: deferasirox + deferiprone vs deferiprone + deferoxamine, Outcome 6 Serious drug‐related AE (# participants affected). | ||||
| 6.1 Cholecystitis | 1 | Risk Ratio (M‐H, Fixed, 95% CI) | 0.0 [0.0, 0.0] | |
| 7 Serious non‐related drug AE Show forest plot | 1 | Risk Ratio (M‐H, Fixed, 95% CI) | Totals not selected | |
| Analysis 7.7  Comparison 7 Transfusion‐dependent thalassemia: deferasirox + deferiprone vs deferiprone + deferoxamine, Outcome 7 Serious non‐related drug AE. | ||||
| 7.1 Appendicitis | 1 | Risk Ratio (M‐H, Fixed, 95% CI) | 0.0 [0.0, 0.0] | |
| 8 AEs Show forest plot | 1 | Risk Ratio (M‐H, Fixed, 95% CI) | Totals not selected | |
| Analysis 7.8 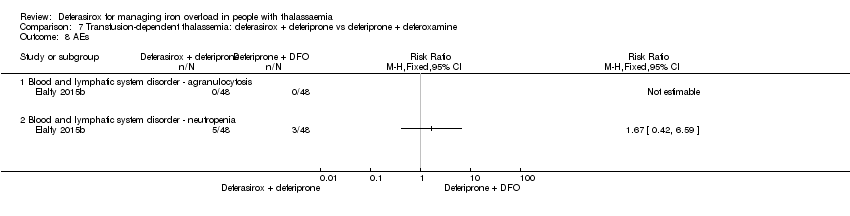 Comparison 7 Transfusion‐dependent thalassemia: deferasirox + deferiprone vs deferiprone + deferoxamine, Outcome 8 AEs. | ||||
| 8.1 Blood and lymphatic system disorder ‐ agranulocytosis | 1 | Risk Ratio (M‐H, Fixed, 95% CI) | 0.0 [0.0, 0.0] | |
| 8.2 Blood and lymphatic system disorder ‐ neutropenia | 1 | Risk Ratio (M‐H, Fixed, 95% CI) | 0.0 [0.0, 0.0] | |
| 9 Drug‐related AEs (# participants affected) Show forest plot | 1 | Risk Ratio (M‐H, Fixed, 95% CI) | Totals not selected | |
| Analysis 7.9  Comparison 7 Transfusion‐dependent thalassemia: deferasirox + deferiprone vs deferiprone + deferoxamine, Outcome 9 Drug‐related AEs (# participants affected). | ||||
| 10 Drug‐related AEs Show forest plot | 1 | Risk Ratio (M‐H, Fixed, 95% CI) | Totals not selected | |
| Analysis 7.10 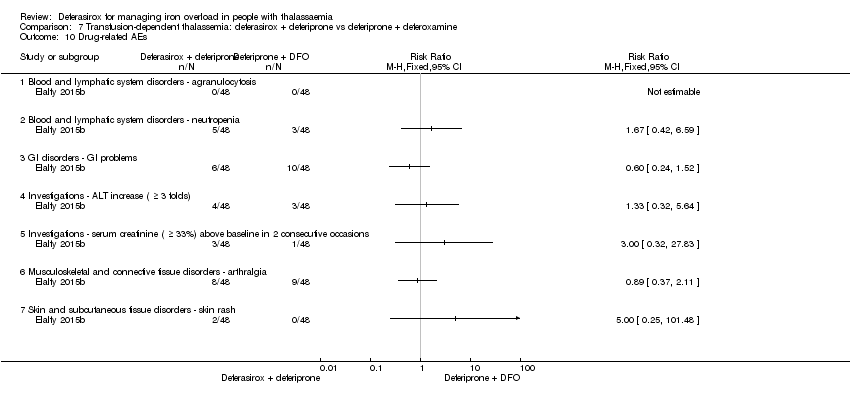 Comparison 7 Transfusion‐dependent thalassemia: deferasirox + deferiprone vs deferiprone + deferoxamine, Outcome 10 Drug‐related AEs. | ||||
| 10.1 Blood and lymphatic system disorders ‐ agranulocytosis | 1 | Risk Ratio (M‐H, Fixed, 95% CI) | 0.0 [0.0, 0.0] | |
| 10.2 Blood and lymphatic system disorders ‐ neutropenia | 1 | Risk Ratio (M‐H, Fixed, 95% CI) | 0.0 [0.0, 0.0] | |
| 10.3 GI disorders ‐ GI problems | 1 | Risk Ratio (M‐H, Fixed, 95% CI) | 0.0 [0.0, 0.0] | |
| 10.4 Investigations ‐ ALT increase ( ≥ 3 folds) | 1 | Risk Ratio (M‐H, Fixed, 95% CI) | 0.0 [0.0, 0.0] | |
| 10.5 Investigations ‐ serum creatinine ( ≥ 33%) above baseline in 2 consecutive occasions | 1 | Risk Ratio (M‐H, Fixed, 95% CI) | 0.0 [0.0, 0.0] | |
| 10.6 Musculoskeletal and connective tissue disorders ‐ arthralgia | 1 | Risk Ratio (M‐H, Fixed, 95% CI) | 0.0 [0.0, 0.0] | |
| 10.7 Skin and subcutaneous tissue disorders ‐ skin rash | 1 | Risk Ratio (M‐H, Fixed, 95% CI) | 0.0 [0.0, 0.0] | |
| 11 Non‐related drug AEs (# participants affected) Show forest plot | 1 | Risk Ratio (M‐H, Fixed, 95% CI) | Totals not selected | |
| Analysis 7.11 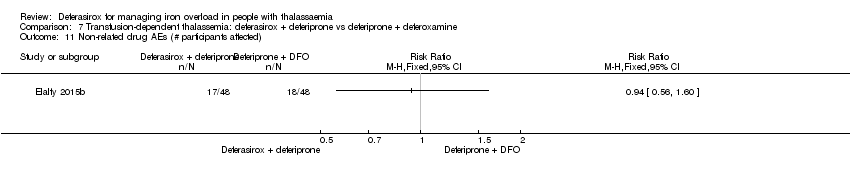 Comparison 7 Transfusion‐dependent thalassemia: deferasirox + deferiprone vs deferiprone + deferoxamine, Outcome 11 Non‐related drug AEs (# participants affected). | ||||
| 12 Non‐related drug AEs Show forest plot | 1 | Risk Ratio (M‐H, Fixed, 95% CI) | Totals not selected | |
| Analysis 7.12  Comparison 7 Transfusion‐dependent thalassemia: deferasirox + deferiprone vs deferiprone + deferoxamine, Outcome 12 Non‐related drug AEs. | ||||
| 12.1 Infections and infestations ‐ infections | 1 | Risk Ratio (M‐H, Fixed, 95% CI) | 0.0 [0.0, 0.0] | |
| 12.2 GI disorders | 1 | Risk Ratio (M‐H, Fixed, 95% CI) | 0.0 [0.0, 0.0] | |
| 12.3 Skin and subcutaneous tissue disorders | 1 | Risk Ratio (M‐H, Fixed, 95% CI) | 0.0 [0.0, 0.0] | |
| 13 Mild elevation of hepatic transaminases at start of therapy (# participants affected) Show forest plot | 1 | Risk Ratio (M‐H, Fixed, 95% CI) | Totals not selected | |
| Analysis 7.13  Comparison 7 Transfusion‐dependent thalassemia: deferasirox + deferiprone vs deferiprone + deferoxamine, Outcome 13 Mild elevation of hepatic transaminases at start of therapy (# participants affected). | ||||
| 14 Initial gastrointestinal manifestations (# participants affected) Show forest plot | 1 | Risk Ratio (M‐H, Fixed, 95% CI) | Totals not selected | |
| Analysis 7.14  Comparison 7 Transfusion‐dependent thalassemia: deferasirox + deferiprone vs deferiprone + deferoxamine, Outcome 14 Initial gastrointestinal manifestations (# participants affected). | ||||
| 15 Quality of life (%) (measured by SF‐36): mean change from baseline Show forest plot | 1 | Mean Difference (IV, Fixed, 95% CI) | Totals not selected | |
| Analysis 7.15  Comparison 7 Transfusion‐dependent thalassemia: deferasirox + deferiprone vs deferiprone + deferoxamine, Outcome 15 Quality of life (%) (measured by SF‐36): mean change from baseline. | ||||
| 16 Adherence: actual dose/total prescribed dose Show forest plot | 1 | Mean Difference (IV, Fixed, 95% CI) | Totals not selected | |
| Analysis 7.16  Comparison 7 Transfusion‐dependent thalassemia: deferasirox + deferiprone vs deferiprone + deferoxamine, Outcome 16 Adherence: actual dose/total prescribed dose. | ||||
| 17 Discontinuations Show forest plot | 1 | Risk Ratio (M‐H, Fixed, 95% CI) | Totals not selected | |
| Analysis 7.17  Comparison 7 Transfusion‐dependent thalassemia: deferasirox + deferiprone vs deferiprone + deferoxamine, Outcome 17 Discontinuations. | ||||
| 18 Serious AE resulting in study discontinuation or interruption Show forest plot | 1 | Risk Ratio (M‐H, Fixed, 95% CI) | Totals not selected | |
| Analysis 7.18 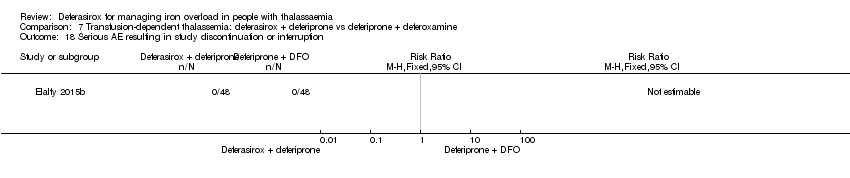 Comparison 7 Transfusion‐dependent thalassemia: deferasirox + deferiprone vs deferiprone + deferoxamine, Outcome 18 Serious AE resulting in study discontinuation or interruption. | ||||
| Outcome or subgroup title | No. of studies | No. of participants | Statistical method | Effect size |
| 1 Mortality at any time point Show forest plot | 1 | 148 | Risk Ratio (M‐H, Fixed, 95% CI) | 0.0 [0.0, 0.0] |
| Analysis 8.1  Comparison 8 Non‐transfusion‐dependent thalassemia: deferasirox vs placebo, Outcome 1 Mortality at any time point. | ||||
| 1.1 Deferasirox 5 mg/kg/day: at 12 months | 1 | 73 | Risk Ratio (M‐H, Fixed, 95% CI) | 0.0 [0.0, 0.0] |
| 1.2 Deferasirox 10 mg/kg/day: at 12 months | 1 | 75 | Risk Ratio (M‐H, Fixed, 95% CI) | 0.0 [0.0, 0.0] |
| 2 Serum ferritin (ng/mL): mean change from baseline Show forest plot | 1 | 154 | Mean Difference (IV, Fixed, 95% CI) | ‐306.74 [‐398.23, ‐215.24] |
| Analysis 8.2  Comparison 8 Non‐transfusion‐dependent thalassemia: deferasirox vs placebo, Outcome 2 Serum ferritin (ng/mL): mean change from baseline. | ||||
| 2.1 Deferasirox 5 mg/kg/day | 1 | 78 | Mean Difference (IV, Fixed, 95% CI) | ‐259.1 [‐377.35, ‐140.85] |
| 2.2 Deferasirox 10 mg/kg/day | 1 | 76 | Mean Difference (IV, Fixed, 95% CI) | ‐377.79 [‐522.21, ‐233.37] |
| 3 LIC (mg Fe/g dw) evaluated by MRI R2: least squares mean change from baseline Show forest plot | 1 | 159 | Mean Difference (IV, Fixed, 95% CI) | ‐3.27 [‐4.44, ‐2.09] |
| Analysis 8.3  Comparison 8 Non‐transfusion‐dependent thalassemia: deferasirox vs placebo, Outcome 3 LIC (mg Fe/g dw) evaluated by MRI R2: least squares mean change from baseline. | ||||
| 3.1 Deferasirox 5 mg/kg/day | 1 | 78 | Mean Difference (IV, Fixed, 95% CI) | ‐2.33 [‐4.00, ‐0.66] |
| 3.2 Deferasirox 10 mg/kg/day | 1 | 81 | Mean Difference (IV, Fixed, 95% CI) | ‐4.18 [‐5.83, ‐2.53] |
| 4 LIC (mg Fe/g dw) evaluated by MRI R2: mean change from baseline Show forest plot | 1 | Mean Difference (IV, Fixed, 95% CI) | Totals not selected | |
| Analysis 8.4  Comparison 8 Non‐transfusion‐dependent thalassemia: deferasirox vs placebo, Outcome 4 LIC (mg Fe/g dw) evaluated by MRI R2: mean change from baseline. | ||||
| 4.1 Non‐transfusion‐dependent β‐thalassemia 5 mg/kg/day | 1 | Mean Difference (IV, Fixed, 95% CI) | 0.0 [0.0, 0.0] | |
| 4.2 Non‐transfusion‐dependent β‐thalassemia 10 mg/kg/day | 1 | Mean Difference (IV, Fixed, 95% CI) | 0.0 [0.0, 0.0] | |
| 4.3 α‐thalassemia 5 mg/kg/day | 1 | Mean Difference (IV, Fixed, 95% CI) | 0.0 [0.0, 0.0] | |
| 4.4 α‐thalassemia 10 mg/kg/day | 1 | Mean Difference (IV, Fixed, 95% CI) | 0.0 [0.0, 0.0] | |
| 4.5 HbE/β‐thalassemia 5 mg/kg/day | 1 | Mean Difference (IV, Fixed, 95% CI) | 0.0 [0.0, 0.0] | |
| 4.6 HbE/β‐thalassemia 10 mg/kg/day | 1 | Mean Difference (IV, Fixed, 95% CI) | 0.0 [0.0, 0.0] | |
| 4.7 < 18 years 5 mg/kg/day | 1 | Mean Difference (IV, Fixed, 95% CI) | 0.0 [0.0, 0.0] | |
| 4.8 < 18 years 10 mg/kg/day | 1 | Mean Difference (IV, Fixed, 95% CI) | 0.0 [0.0, 0.0] | |
| 4.9 ≥18 years 5 mg/kg/day | 1 | Mean Difference (IV, Fixed, 95% CI) | 0.0 [0.0, 0.0] | |
| 4.10 ≥18 years 10 mg/kg/day | 1 | Mean Difference (IV, Fixed, 95% CI) | 0.0 [0.0, 0.0] | |
| 5 LIC: decrease of ≥ 3 mg Fe/g dw (# participants affected) Show forest plot | 1 | 166 | Risk Ratio (M‐H, Fixed, 95% CI) | 4.16 [1.90, 9.11] |
| Analysis 8.5  Comparison 8 Non‐transfusion‐dependent thalassemia: deferasirox vs placebo, Outcome 5 LIC: decrease of ≥ 3 mg Fe/g dw (# participants affected). | ||||
| 5.1 Deferasirox 5 mg/kg/day | 1 | 83 | Risk Ratio (M‐H, Fixed, 95% CI) | 3.05 [0.98, 9.50] |
| 5.2 Deferasirox 10 mg/kg/day | 1 | 83 | Risk Ratio (M‐H, Fixed, 95% CI) | 5.26 [1.76, 15.71] |
| 6 LIC: ≥ 30% reduction Fe/g dw (# participants affected) Show forest plot | 1 | 166 | Risk Ratio (M‐H, Fixed, 95% CI) | 14.17 [2.88, 69.74] |
| Analysis 8.6  Comparison 8 Non‐transfusion‐dependent thalassemia: deferasirox vs placebo, Outcome 6 LIC: ≥ 30% reduction Fe/g dw (# participants affected). | ||||
| 6.1 Deferasirox 5 mg/kg/day | 1 | 83 | Risk Ratio (M‐H, Fixed, 95% CI) | 15.02 [0.93, 242.87] |
| 6.2 Deferasirox 10 mg/kg/day | 1 | 83 | Risk Ratio (M‐H, Fixed, 95% CI) | 13.75 [1.97, 95.97] |
| 7 LIC: shift to lower iron burden range (# participants affected) Show forest plot | 1 | 166 | Risk Ratio (M‐H, Fixed, 95% CI) | 3.35 [1.62, 6.91] |
| Analysis 8.7 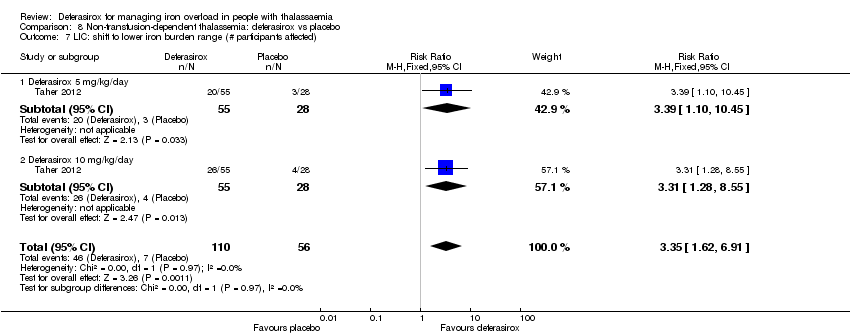 Comparison 8 Non‐transfusion‐dependent thalassemia: deferasirox vs placebo, Outcome 7 LIC: shift to lower iron burden range (# participants affected). | ||||
| 7.1 Deferasirox 5 mg/kg/day | 1 | 83 | Risk Ratio (M‐H, Fixed, 95% CI) | 3.39 [1.10, 10.45] |
| 7.2 Deferasirox 10 mg/kg/day | 1 | 83 | Risk Ratio (M‐H, Fixed, 95% CI) | 3.31 [1.28, 8.55] |
| 8 LIC: achieve LIC < 5 mg Fe/g dw (# participants affected) Show forest plot | 1 | 166 | Risk Ratio (M‐H, Fixed, 95% CI) | 5.35 [1.30, 21.99] |
| Analysis 8.8 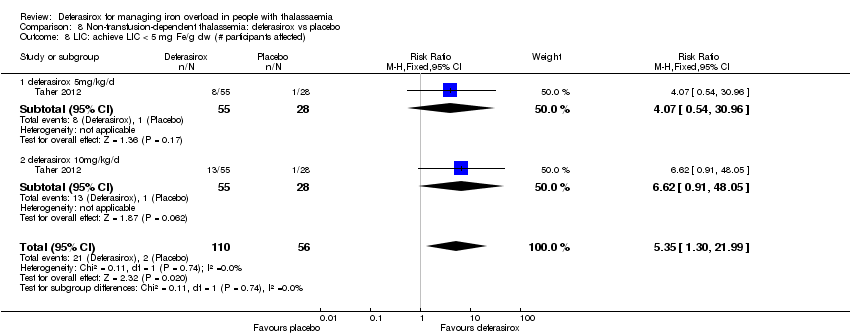 Comparison 8 Non‐transfusion‐dependent thalassemia: deferasirox vs placebo, Outcome 8 LIC: achieve LIC < 5 mg Fe/g dw (# participants affected). | ||||
| 8.1 deferasirox 5mg/kg/d | 1 | 83 | Risk Ratio (M‐H, Fixed, 95% CI) | 4.07 [0.54, 30.96] |
| 8.2 deferasirox 10mg/kg/d | 1 | 83 | Risk Ratio (M‐H, Fixed, 95% CI) | 6.62 [0.91, 48.05] |
| 9 Drug‐related serious AEs (# participants affected) Show forest plot | 1 | Risk Ratio (M‐H, Fixed, 95% CI) | Totals not selected | |
| Analysis 8.9 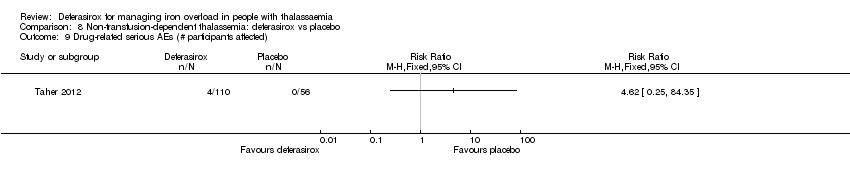 Comparison 8 Non‐transfusion‐dependent thalassemia: deferasirox vs placebo, Outcome 9 Drug‐related serious AEs (# participants affected). | ||||
| 10 Drug‐related serious AEs (# participants affected) Show forest plot | 1 | Risk Ratio (M‐H, Fixed, 95% CI) | Totals not selected | |
| Analysis 8.10  Comparison 8 Non‐transfusion‐dependent thalassemia: deferasirox vs placebo, Outcome 10 Drug‐related serious AEs (# participants affected). | ||||
| 10.1 GI disorders ‐ abdominal pain | 1 | Risk Ratio (M‐H, Fixed, 95% CI) | 0.0 [0.0, 0.0] | |
| 10.2 Infections and infestations ‐ cellulitis | 1 | Risk Ratio (M‐H, Fixed, 95% CI) | 0.0 [0.0, 0.0] | |
| 10.3 Skin and subcutaneous tissue disorders ‐ pruritus | 1 | Risk Ratio (M‐H, Fixed, 95% CI) | 0.0 [0.0, 0.0] | |
| 10.4 Skin and subcutaneous tissue disorders ‐ rash | 1 | Risk Ratio (M‐H, Fixed, 95% CI) | 0.0 [0.0, 0.0] | |
| 10.5 General disorders ‐ pyrexia | 1 | Risk Ratio (M‐H, Fixed, 95% CI) | 0.0 [0.0, 0.0] | |
| 10.6 Hepatobiliary disorders ‐ hepatotoxicity | 1 | Risk Ratio (M‐H, Fixed, 95% CI) | 0.0 [0.0, 0.0] | |
| 11 Any AE (# participants affected) Show forest plot | 1 | Risk Ratio (M‐H, Fixed, 95% CI) | Totals not selected | |
| Analysis 8.11  Comparison 8 Non‐transfusion‐dependent thalassemia: deferasirox vs placebo, Outcome 11 Any AE (# participants affected). | ||||
| 12 Mild AE (# participants affected) Show forest plot | 1 | Risk Ratio (M‐H, Fixed, 95% CI) | Totals not selected | |
| Analysis 8.12  Comparison 8 Non‐transfusion‐dependent thalassemia: deferasirox vs placebo, Outcome 12 Mild AE (# participants affected). | ||||
| 13 Moderate AE (# participants affected) Show forest plot | 1 | Risk Ratio (M‐H, Fixed, 95% CI) | Totals not selected | |
| Analysis 8.13  Comparison 8 Non‐transfusion‐dependent thalassemia: deferasirox vs placebo, Outcome 13 Moderate AE (# participants affected). | ||||
| 14 Severe AE (# participants affected) Show forest plot | 1 | Risk Ratio (M‐H, Fixed, 95% CI) | Totals not selected | |
| Analysis 8.14  Comparison 8 Non‐transfusion‐dependent thalassemia: deferasirox vs placebo, Outcome 14 Severe AE (# participants affected). | ||||
| 15 AEs Show forest plot | 1 | Risk Ratio (M‐H, Fixed, 95% CI) | Totals not selected | |
| Analysis 8.15  Comparison 8 Non‐transfusion‐dependent thalassemia: deferasirox vs placebo, Outcome 15 AEs. | ||||
| 15.1 Ear and labyrinth disorders ‐ neurosensory deafness | 1 | Risk Ratio (M‐H, Fixed, 95% CI) | 0.0 [0.0, 0.0] | |
| 15.2 Investigations ‐ abnormal platelet count (post‐baseline) | 1 | Risk Ratio (M‐H, Fixed, 95% CI) | 0.0 [0.0, 0.0] | |
| 15.3 Investigations ‐ abnormal neutrophils count (post‐baseline) | 1 | Risk Ratio (M‐H, Fixed, 95% CI) | 0.0 [0.0, 0.0] | |
| 15.4 Investigations ‐ abnormal ALT (post‐baseline) | 1 | Risk Ratio (M‐H, Fixed, 95% CI) | 0.0 [0.0, 0.0] | |
| 15.5 Investigations ‐ abnormal AST (post‐baseline) | 1 | Risk Ratio (M‐H, Fixed, 95% CI) | 0.0 [0.0, 0.0] | |
| 15.6 Investigations ‐ abnormal serum creatinine (post‐baseline) | 1 | Risk Ratio (M‐H, Fixed, 95% CI) | 0.0 [0.0, 0.0] | |
| 15.7 Investigations ‐ abnormal creatinine clearance (post‐baseline) | 1 | Risk Ratio (M‐H, Fixed, 95% CI) | 0.0 [0.0, 0.0] | |
| 15.8 Investigations ‐ urinary protein/creatinine ratio (post‐baseline) | 1 | Risk Ratio (M‐H, Fixed, 95% CI) | 0.0 [0.0, 0.0] | |
| 15.9 Investigations ‐ abnormal (low) systolic blood pressure (post‐baseline) | 1 | Risk Ratio (M‐H, Fixed, 95% CI) | 0.0 [0.0, 0.0] | |
| 15.10 Investigations ‐ abnormal (high) systolic blood pressure (post‐baseline) | 1 | Risk Ratio (M‐H, Fixed, 95% CI) | 0.0 [0.0, 0.0] | |
| 15.11 Investigations ‐ abnormal (low) diastolic blood pressure (post‐baseline) | 1 | Risk Ratio (M‐H, Fixed, 95% CI) | 0.0 [0.0, 0.0] | |
| 15.12 Investigations ‐ abnormal (high) diastolic blood pressure (post‐baseline) | 1 | Risk Ratio (M‐H, Fixed, 95% CI) | 0.0 [0.0, 0.0] | |
| 15.13 Investigations ‐ abnormal (low) pulse rate (post‐baseline) | 1 | Risk Ratio (M‐H, Fixed, 95% CI) | 0.0 [0.0, 0.0] | |
| 15.14 Investigations ‐ abnormal (high) pulse rate (post‐baseline) | 1 | Risk Ratio (M‐H, Fixed, 95% CI) | 0.0 [0.0, 0.0] | |
| 15.15 Renal and urinary disorders ‐ proteinuria | 1 | Risk Ratio (M‐H, Fixed, 95% CI) | 0.0 [0.0, 0.0] | |
| 16 Drug‐related AEs Show forest plot | 1 | Risk Ratio (M‐H, Fixed, 95% CI) | Totals not selected | |
| Analysis 8.16  Comparison 8 Non‐transfusion‐dependent thalassemia: deferasirox vs placebo, Outcome 16 Drug‐related AEs. | ||||
| 16.1 GI disorders ‐ abdominal pain | 1 | Risk Ratio (M‐H, Fixed, 95% CI) | 0.0 [0.0, 0.0] | |
| 16.2 GI disorders ‐ abdominal pain upper | 1 | Risk Ratio (M‐H, Fixed, 95% CI) | 0.0 [0.0, 0.0] | |
| 16.3 GI disorders ‐ diarrhoea | 1 | Risk Ratio (M‐H, Fixed, 95% CI) | 0.0 [0.0, 0.0] | |
| 16.4 GI disorders ‐ nausea | 1 | Risk Ratio (M‐H, Fixed, 95% CI) | 0.0 [0.0, 0.0] | |
| 16.5 Nervous system disorders ‐ headache | 1 | Risk Ratio (M‐H, Fixed, 95% CI) | 0.0 [0.0, 0.0] | |
| 16.6 Skin and subcutaneous tissue disorders ‐ skin rash | 1 | Risk Ratio (M‐H, Fixed, 95% CI) | 0.0 [0.0, 0.0] | |
| 17 Adherence (# participants taking the planned study dose) Show forest plot | 1 | Risk Ratio (M‐H, Fixed, 95% CI) | Totals not selected | |
| Analysis 8.17  Comparison 8 Non‐transfusion‐dependent thalassemia: deferasirox vs placebo, Outcome 17 Adherence (# participants taking the planned study dose). | ||||
| 18 Discontinuations Show forest plot | 1 | 166 | Risk Ratio (M‐H, Fixed, 95% CI) | 1.32 [0.50, 3.52] |
| Analysis 8.18  Comparison 8 Non‐transfusion‐dependent thalassemia: deferasirox vs placebo, Outcome 18 Discontinuations. | ||||
| 18.1 Deferasirox 5 mg/kg/day | 1 | 83 | Risk Ratio (M‐H, Fixed, 95% CI) | 1.19 [0.33, 4.25] |
| 18.2 Deferasirox 10 mg/kg/day | 1 | 83 | Risk Ratio (M‐H, Fixed, 95% CI) | 1.53 [0.33, 7.08] |
| 19 Discontinuing study due to AE (# participants affected) Show forest plot | 1 | Risk Ratio (M‐H, Fixed, 95% CI) | Totals not selected | |
| Analysis 8.19  Comparison 8 Non‐transfusion‐dependent thalassemia: deferasirox vs placebo, Outcome 19 Discontinuing study due to AE (# participants affected). | ||||
| 20 Dose increase Show forest plot | 1 | 166 | Risk Ratio (M‐H, Fixed, 95% CI) | 0.87 [0.63, 1.19] |
| Analysis 8.20  Comparison 8 Non‐transfusion‐dependent thalassemia: deferasirox vs placebo, Outcome 20 Dose increase. | ||||
| 20.1 Deferasirox 5 mg/kg/day | 1 | 83 | Risk Ratio (M‐H, Fixed, 95% CI) | 0.88 [0.57, 1.38] |
| 20.2 Deferasirox 10 mg/kg/day | 1 | 83 | Risk Ratio (M‐H, Fixed, 95% CI) | 0.85 [0.54, 1.33] |
| 21 Dose interruption (at least once) Show forest plot | 1 | 166 | Risk Ratio (M‐H, Fixed, 95% CI) | 1.10 [0.88, 1.39] |
| Analysis 8.21  Comparison 8 Non‐transfusion‐dependent thalassemia: deferasirox vs placebo, Outcome 21 Dose interruption (at least once). | ||||
| 21.1 Deferasirox 5 mg/kg/day | 1 | 83 | Risk Ratio (M‐H, Fixed, 95% CI) | 1.02 [0.73, 1.43] |
| 21.2 Deferasirox 10 mg/kg/day | 1 | 83 | Risk Ratio (M‐H, Fixed, 95% CI) | 1.19 [0.87, 1.62] |
| 22 Dose reduction Show forest plot | 1 | 166 | Risk Ratio (M‐H, Fixed, 95% CI) | 1.46 [0.70, 3.06] |
| Analysis 8.22  Comparison 8 Non‐transfusion‐dependent thalassemia: deferasirox vs placebo, Outcome 22 Dose reduction. | ||||
| 22.1 Deferasirox 5 mg/kg/day | 1 | 83 | Risk Ratio (M‐H, Fixed, 95% CI) | 1.53 [0.54, 4.30] |
| 22.2 Deferasirox 10 mg/kg/day | 1 | 83 | Risk Ratio (M‐H, Fixed, 95% CI) | 1.4 [0.49, 4.00] |
| 23 Dose reduction due to AE Show forest plot | 1 | 166 | Risk Ratio (M‐H, Fixed, 95% CI) | 1.53 [0.69, 3.38] |
| Analysis 8.23  Comparison 8 Non‐transfusion‐dependent thalassemia: deferasirox vs placebo, Outcome 23 Dose reduction due to AE. | ||||
| 23.1 Deferasirox 5 mg/kg/day | 1 | 83 | Risk Ratio (M‐H, Fixed, 95% CI) | 2.04 [0.63, 6.63] |
| 23.2 Deferasirox 10 mg/kg/day | 1 | 83 | Risk Ratio (M‐H, Fixed, 95% CI) | 1.15 [0.39, 3.39] |
| 24 Haemoglobin (g/L): mean change from baseline Show forest plot | 1 | 144 | Mean Difference (IV, Fixed, 95% CI) | 1.54 [‐0.82, 3.90] |
| Analysis 8.24  Comparison 8 Non‐transfusion‐dependent thalassemia: deferasirox vs placebo, Outcome 24 Haemoglobin (g/L): mean change from baseline. | ||||
| 24.1 Deferasirox 5 mg/kg/day | 1 | 71 | Mean Difference (IV, Fixed, 95% CI) | 1.00 [‐2.31, 4.31] |
| 24.2 Deferasirox 10 mg/kg/day | 1 | 73 | Mean Difference (IV, Fixed, 95% CI) | 2.10 [‐1.27, 5.47] |
| 25 Transferrin saturation (%): mean change from baseline Show forest plot | 1 | 141 | Mean Difference (IV, Fixed, 95% CI) | ‐7.10 [‐11.71, ‐2.50] |
| Analysis 8.25  Comparison 8 Non‐transfusion‐dependent thalassemia: deferasirox vs placebo, Outcome 25 Transferrin saturation (%): mean change from baseline. | ||||
| 25.1 Deferasirox 5 mg/kg/day | 1 | 70 | Mean Difference (IV, Fixed, 95% CI) | ‐7.16 [‐12.95, ‐1.37] |
| 25.2 Deferasirox 10 mg/kg/day | 1 | 71 | Mean Difference (IV, Fixed, 95% CI) | ‐7.01 [‐14.59, 0.57] |

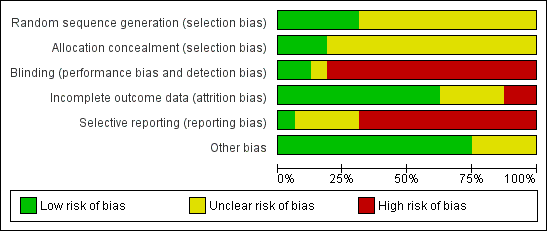
Risk of bias graph: review authors' judgements about each risk of bias item presented as percentages across all included studies.
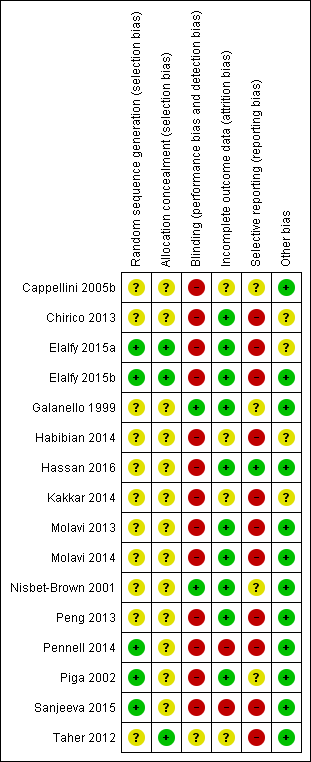
Risk of bias summary: review authors' judgements about each risk of bias item for each included study.
Comparison 1 Transfusion‐dependent thalassemia: deferasirox vs placebo, Outcome 1 Mortality at any time point.
Comparison 1 Transfusion‐dependent thalassemia: deferasirox vs placebo, Outcome 2 AEs.
Comparison 1 Transfusion‐dependent thalassemia: deferasirox vs placebo, Outcome 3 Discontinuations due to serious AEs.
Comparison 2 Transfusion‐dependent thalassemia: deferasirox vs deferoxamine, Outcome 1 Mortality at any time point.
Comparison 2 Transfusion‐dependent thalassemia: deferasirox vs deferoxamine, Outcome 2 LVEF (%): least squares mean change from baseline.
Comparison 2 Transfusion‐dependent thalassemia: deferasirox vs deferoxamine, Outcome 3 LVEF (# participants affected).
Comparison 2 Transfusion‐dependent thalassemia: deferasirox vs deferoxamine, Outcome 4 Incidence of thyroid disease at end of study.
Comparison 2 Transfusion‐dependent thalassemia: deferasirox vs deferoxamine, Outcome 5 ALT (# participants affected): improvement from abnormal to normal range.
Comparison 2 Transfusion‐dependent thalassemia: deferasirox vs deferoxamine, Outcome 6 ALT (U/L) at end of study.
Comparison 2 Transfusion‐dependent thalassemia: deferasirox vs deferoxamine, Outcome 7 AST (U/L) at end of study.
Comparison 2 Transfusion‐dependent thalassemia: deferasirox vs deferoxamine, Outcome 8 Serum creatinine (mg/dL) at end of study.
Comparison 2 Transfusion‐dependent thalassemia: deferasirox vs deferoxamine, Outcome 9 Blood urea (mg/dL): mean at end of study.
Comparison 2 Transfusion‐dependent thalassemia: deferasirox vs deferoxamine, Outcome 10 Serum ferritin (ng/mL): mean change from baseline and at end of study.
Comparison 2 Transfusion‐dependent thalassemia: deferasirox vs deferoxamine, Outcome 11 Sensitivity analysis: serum ferritin (ng/mL): mean change from baseline.
Comparison 2 Transfusion‐dependent thalassemia: deferasirox vs deferoxamine, Outcome 12 Liver R2* (Hz): mean change from baseline.
Comparison 2 Transfusion‐dependent thalassemia: deferasirox vs deferoxamine, Outcome 13 LIC (mg/g) evaluated by MRI (R2/R2*): mean change from baseline.
Comparison 2 Transfusion‐dependent thalassemia: deferasirox vs deferoxamine, Outcome 14 LIC (mg Fe/g dw) evaluated by biopsy or SQUID: mean change from baseline.
Comparison 2 Transfusion‐dependent thalassemia: deferasirox vs deferoxamine, Outcome 15 Responder analysis I (responder: fall in LIC > 10%).
Comparison 2 Transfusion‐dependent thalassemia: deferasirox vs deferoxamine, Outcome 16 Responder analysis II (responder: LIC 1 to < 7 mg Fe/g dw).
Comparison 2 Transfusion‐dependent thalassemia: deferasirox vs deferoxamine, Outcome 17 Myocardial T2* (ms): mean change from baseline.
Comparison 2 Transfusion‐dependent thalassemia: deferasirox vs deferoxamine, Outcome 18 Myocardial iron concentration derived from T2* value (mg Fe/g dw): change from baseline.
Comparison 2 Transfusion‐dependent thalassemia: deferasirox vs deferoxamine, Outcome 19 Myocardial T2* (# participants affected).
Comparison 2 Transfusion‐dependent thalassemia: deferasirox vs deferoxamine, Outcome 20 Iron excretion‐intake ratio.
Comparison 2 Transfusion‐dependent thalassemia: deferasirox vs deferoxamine, Outcome 21 Any serious AEs (# participants affected).
Comparison 2 Transfusion‐dependent thalassemia: deferasirox vs deferoxamine, Outcome 22 Serious AEs.
Comparison 2 Transfusion‐dependent thalassemia: deferasirox vs deferoxamine, Outcome 23 Any AE (# participants affected).
Comparison 2 Transfusion‐dependent thalassemia: deferasirox vs deferoxamine, Outcome 24 AEs.
Comparison 2 Transfusion‐dependent thalassemia: deferasirox vs deferoxamine, Outcome 25 Any drug‐related AE (# participants affected).
Comparison 2 Transfusion‐dependent thalassemia: deferasirox vs deferoxamine, Outcome 26 Drug‐related AEs.
Comparison 2 Transfusion‐dependent thalassemia: deferasirox vs deferoxamine, Outcome 27 Satisfaction with treatment (very satisfied or satisfied).
Comparison 2 Transfusion‐dependent thalassemia: deferasirox vs deferoxamine, Outcome 28 Convenience (good or very good).
Comparison 2 Transfusion‐dependent thalassemia: deferasirox vs deferoxamine, Outcome 29 Willingness to continue treatment.
Comparison 2 Transfusion‐dependent thalassemia: deferasirox vs deferoxamine, Outcome 30 Time lost from normal activities due to treatment (hours/month): participants treated previously with DFO.
Comparison 2 Transfusion‐dependent thalassemia: deferasirox vs deferoxamine, Outcome 31 Adherence (% of planned dose).
Comparison 2 Transfusion‐dependent thalassemia: deferasirox vs deferoxamine, Outcome 32 Discontinuations.
Comparison 2 Transfusion‐dependent thalassemia: deferasirox vs deferoxamine, Outcome 33 Dose adjustments and dose interruptions.
Comparison 2 Transfusion‐dependent thalassemia: deferasirox vs deferoxamine, Outcome 34 Dose interruptions (interrupted at least once).
Comparison 2 Transfusion‐dependent thalassemia: deferasirox vs deferoxamine, Outcome 35 Dose reduction (at least once).
Comparison 2 Transfusion‐dependent thalassemia: deferasirox vs deferoxamine, Outcome 36 Dose adjustments (# participants affected).
Comparison 2 Transfusion‐dependent thalassemia: deferasirox vs deferoxamine, Outcome 37 Dose interruptions due to an AE (# participants affected).
Comparison 2 Transfusion‐dependent thalassemia: deferasirox vs deferoxamine, Outcome 38 Haemoglobin (g/dL): mean change from baseline and at end of study.
Comparison 2 Transfusion‐dependent thalassemia: deferasirox vs deferoxamine, Outcome 39 Transfusion index (mL/kg/year): mean at end of study.
Comparison 2 Transfusion‐dependent thalassemia: deferasirox vs deferoxamine, Outcome 40 Transferrin saturation (%): mean at end of study.
Comparison 2 Transfusion‐dependent thalassemia: deferasirox vs deferoxamine, Outcome 41 Platelet count (x10³/mm³): mean at end of study.
Comparison 2 Transfusion‐dependent thalassemia: deferasirox vs deferoxamine, Outcome 42 Absolute neutrophilic count (/mm³): mean at end of study.
Comparison 3 Transfusion‐dependent thalassemia: deferasirox vs deferiprone, Outcome 1 Mortality at any time point.
Comparison 3 Transfusion‐dependent thalassemia: deferasirox vs deferiprone, Outcome 2 Incidence of thyroid disease at end of study.
Comparison 3 Transfusion‐dependent thalassemia: deferasirox vs deferiprone, Outcome 3 ALT (U/L): mean change from baseline.
Comparison 3 Transfusion‐dependent thalassemia: deferasirox vs deferiprone, Outcome 4 AST (U/L): mean change from baseline.
Comparison 3 Transfusion‐dependent thalassemia: deferasirox vs deferiprone, Outcome 5 Urea (mg/dL): mean change from baseline.
Comparison 3 Transfusion‐dependent thalassemia: deferasirox vs deferiprone, Outcome 6 Creatinine (mg/dL): mean change from baseline.
Comparison 3 Transfusion‐dependent thalassemia: deferasirox vs deferiprone, Outcome 7 Neutrophil (count per mm³): mean change from baseline.
Comparison 3 Transfusion‐dependent thalassemia: deferasirox vs deferiprone, Outcome 8 Serum ferritin (ng/mL): mean change from baseline and at end of study.
Comparison 3 Transfusion‐dependent thalassemia: deferasirox vs deferiprone, Outcome 9 LIC (mg/g) evaluated by MRI (R2*): mean change from baseline.
Comparison 3 Transfusion‐dependent thalassemia: deferasirox vs deferiprone, Outcome 10 Myocardial T2* (ms): mean change from baseline.
Comparison 3 Transfusion‐dependent thalassemia: deferasirox vs deferiprone, Outcome 11 Any AE (# participants affected).
Comparison 3 Transfusion‐dependent thalassemia: deferasirox vs deferiprone, Outcome 12 AEs.
Comparison 3 Transfusion‐dependent thalassemia: deferasirox vs deferiprone, Outcome 13 Discontinuations (# participants affected).
Comparison 3 Transfusion‐dependent thalassemia: deferasirox vs deferiprone, Outcome 14 Discontinuation due to an AE (# participants affected).
Comparison 3 Transfusion‐dependent thalassemia: deferasirox vs deferiprone, Outcome 15 Transferrin saturation (%): mean at end of study.
Comparison 3 Transfusion‐dependent thalassemia: deferasirox vs deferiprone, Outcome 16 Haemoglobin (g/dL): mean at end of study.
Comparison 3 Transfusion‐dependent thalassemia: deferasirox vs deferiprone, Outcome 17 Transfusion index (mL/kg/year): mean at end of study.
Comparison 3 Transfusion‐dependent thalassemia: deferasirox vs deferiprone, Outcome 18 ALP (U/L): mean change from baseline.
Comparison 6 Transfusion‐dependent thalassemia: deferasirox + deferoxamine vs deferoxamine, Outcome 1 Mortality at any time point.
Comparison 6 Transfusion‐dependent thalassemia: deferasirox + deferoxamine vs deferoxamine, Outcome 2 Neutrophil (µg/L): mean at end of study.
Comparison 6 Transfusion‐dependent thalassemia: deferasirox + deferoxamine vs deferoxamine, Outcome 3 ALT (g/dL): mean at end of study.
Comparison 6 Transfusion‐dependent thalassemia: deferasirox + deferoxamine vs deferoxamine, Outcome 4 AST (g/dL): mean at end of study.
Comparison 6 Transfusion‐dependent thalassemia: deferasirox + deferoxamine vs deferoxamine, Outcome 5 Serum ferritin: mean at end of study (ng/mL).
Comparison 6 Transfusion‐dependent thalassemia: deferasirox + deferoxamine vs deferoxamine, Outcome 6 Discontinuations.
Comparison 6 Transfusion‐dependent thalassemia: deferasirox + deferoxamine vs deferoxamine, Outcome 7 Haemoglobin (g/dL): mean at end of study.
Comparison 6 Transfusion‐dependent thalassemia: deferasirox + deferoxamine vs deferoxamine, Outcome 8 ALP (g/dL): mean at end of study.
Comparison 7 Transfusion‐dependent thalassemia: deferasirox + deferiprone vs deferiprone + deferoxamine, Outcome 1 Mortality at any time point.
Comparison 7 Transfusion‐dependent thalassemia: deferasirox + deferiprone vs deferiprone + deferoxamine, Outcome 2 Serum ferritin (ng/mL): mean change from baseline.
Comparison 7 Transfusion‐dependent thalassemia: deferasirox + deferiprone vs deferiprone + deferoxamine, Outcome 3 LIC (mg/g) evaluated by MRI (R2*): mean change from baseline.
Comparison 7 Transfusion‐dependent thalassemia: deferasirox + deferiprone vs deferiprone + deferoxamine, Outcome 4 Myocardial T2* (ms): mean change from baseline.
Comparison 7 Transfusion‐dependent thalassemia: deferasirox + deferiprone vs deferiprone + deferoxamine, Outcome 5 Serious AE (# participants affected).
Comparison 7 Transfusion‐dependent thalassemia: deferasirox + deferiprone vs deferiprone + deferoxamine, Outcome 6 Serious drug‐related AE (# participants affected).
Comparison 7 Transfusion‐dependent thalassemia: deferasirox + deferiprone vs deferiprone + deferoxamine, Outcome 7 Serious non‐related drug AE.
Comparison 7 Transfusion‐dependent thalassemia: deferasirox + deferiprone vs deferiprone + deferoxamine, Outcome 8 AEs.
Comparison 7 Transfusion‐dependent thalassemia: deferasirox + deferiprone vs deferiprone + deferoxamine, Outcome 9 Drug‐related AEs (# participants affected).
Comparison 7 Transfusion‐dependent thalassemia: deferasirox + deferiprone vs deferiprone + deferoxamine, Outcome 10 Drug‐related AEs.
Comparison 7 Transfusion‐dependent thalassemia: deferasirox + deferiprone vs deferiprone + deferoxamine, Outcome 11 Non‐related drug AEs (# participants affected).
Comparison 7 Transfusion‐dependent thalassemia: deferasirox + deferiprone vs deferiprone + deferoxamine, Outcome 12 Non‐related drug AEs.
Comparison 7 Transfusion‐dependent thalassemia: deferasirox + deferiprone vs deferiprone + deferoxamine, Outcome 13 Mild elevation of hepatic transaminases at start of therapy (# participants affected).
Comparison 7 Transfusion‐dependent thalassemia: deferasirox + deferiprone vs deferiprone + deferoxamine, Outcome 14 Initial gastrointestinal manifestations (# participants affected).
Comparison 7 Transfusion‐dependent thalassemia: deferasirox + deferiprone vs deferiprone + deferoxamine, Outcome 15 Quality of life (%) (measured by SF‐36): mean change from baseline.
Comparison 7 Transfusion‐dependent thalassemia: deferasirox + deferiprone vs deferiprone + deferoxamine, Outcome 16 Adherence: actual dose/total prescribed dose.
Comparison 7 Transfusion‐dependent thalassemia: deferasirox + deferiprone vs deferiprone + deferoxamine, Outcome 17 Discontinuations.
Comparison 7 Transfusion‐dependent thalassemia: deferasirox + deferiprone vs deferiprone + deferoxamine, Outcome 18 Serious AE resulting in study discontinuation or interruption.
Comparison 8 Non‐transfusion‐dependent thalassemia: deferasirox vs placebo, Outcome 1 Mortality at any time point.
Comparison 8 Non‐transfusion‐dependent thalassemia: deferasirox vs placebo, Outcome 2 Serum ferritin (ng/mL): mean change from baseline.
Comparison 8 Non‐transfusion‐dependent thalassemia: deferasirox vs placebo, Outcome 3 LIC (mg Fe/g dw) evaluated by MRI R2: least squares mean change from baseline.
Comparison 8 Non‐transfusion‐dependent thalassemia: deferasirox vs placebo, Outcome 4 LIC (mg Fe/g dw) evaluated by MRI R2: mean change from baseline.
Comparison 8 Non‐transfusion‐dependent thalassemia: deferasirox vs placebo, Outcome 5 LIC: decrease of ≥ 3 mg Fe/g dw (# participants affected).
Comparison 8 Non‐transfusion‐dependent thalassemia: deferasirox vs placebo, Outcome 6 LIC: ≥ 30% reduction Fe/g dw (# participants affected).
Comparison 8 Non‐transfusion‐dependent thalassemia: deferasirox vs placebo, Outcome 7 LIC: shift to lower iron burden range (# participants affected).
Comparison 8 Non‐transfusion‐dependent thalassemia: deferasirox vs placebo, Outcome 8 LIC: achieve LIC < 5 mg Fe/g dw (# participants affected).
Comparison 8 Non‐transfusion‐dependent thalassemia: deferasirox vs placebo, Outcome 9 Drug‐related serious AEs (# participants affected).
Comparison 8 Non‐transfusion‐dependent thalassemia: deferasirox vs placebo, Outcome 10 Drug‐related serious AEs (# participants affected).
Comparison 8 Non‐transfusion‐dependent thalassemia: deferasirox vs placebo, Outcome 11 Any AE (# participants affected).
Comparison 8 Non‐transfusion‐dependent thalassemia: deferasirox vs placebo, Outcome 12 Mild AE (# participants affected).
Comparison 8 Non‐transfusion‐dependent thalassemia: deferasirox vs placebo, Outcome 13 Moderate AE (# participants affected).
Comparison 8 Non‐transfusion‐dependent thalassemia: deferasirox vs placebo, Outcome 14 Severe AE (# participants affected).
Comparison 8 Non‐transfusion‐dependent thalassemia: deferasirox vs placebo, Outcome 15 AEs.
Comparison 8 Non‐transfusion‐dependent thalassemia: deferasirox vs placebo, Outcome 16 Drug‐related AEs.
Comparison 8 Non‐transfusion‐dependent thalassemia: deferasirox vs placebo, Outcome 17 Adherence (# participants taking the planned study dose).
Comparison 8 Non‐transfusion‐dependent thalassemia: deferasirox vs placebo, Outcome 18 Discontinuations.
Comparison 8 Non‐transfusion‐dependent thalassemia: deferasirox vs placebo, Outcome 19 Discontinuing study due to AE (# participants affected).
Comparison 8 Non‐transfusion‐dependent thalassemia: deferasirox vs placebo, Outcome 20 Dose increase.
Comparison 8 Non‐transfusion‐dependent thalassemia: deferasirox vs placebo, Outcome 21 Dose interruption (at least once).
Comparison 8 Non‐transfusion‐dependent thalassemia: deferasirox vs placebo, Outcome 22 Dose reduction.
Comparison 8 Non‐transfusion‐dependent thalassemia: deferasirox vs placebo, Outcome 23 Dose reduction due to AE.
Comparison 8 Non‐transfusion‐dependent thalassemia: deferasirox vs placebo, Outcome 24 Haemoglobin (g/L): mean change from baseline.
Comparison 8 Non‐transfusion‐dependent thalassemia: deferasirox vs placebo, Outcome 25 Transferrin saturation (%): mean change from baseline.
| Deferasirox compared to deferoxamine in people with transfusion‐dependent thalassemia | ||||||
| Patient or population: people with transfusion‐dependent thalassemia | ||||||
| Outcomes | Anticipated absolute effects* (95% CI) | Relative effect | № of participants | Quality of the evidence | Comments | |
| Risk with deferoxamine | Risk with deferasirox | |||||
| Mortality at any time point | Study population | RR 0.48 | 1170 | ⊕⊕⊝⊝ | ||
| 7 per 1.000 | 3 per 1.000 | |||||
| Responder analysis II (responder: LIC 1 to less than 7 mg Fe/g dw) | Study population | RR 0.80 | 553 | ⊕⊕⊕⊝ | ||
| 664 per 1.000 | 531 per 1.000 | |||||
| Serum ferritin (ng/mL): mean change from baseline and at end of study | MD 454.42 higher | ‐ | 1002 | ⊕⊕⊕⊝ | ||
| LIC (mg Fe/g dw) evaluated by biopsy or SQUID: mean change from baseline | MD 2.37 higher | ‐ | 541 | ⊕⊕⊕⊝ | ||
| Satisfaction with treatment (very satisfied or satisfied): participants previously treated with DFO | Study population | RR 2.20 | 571 | ⊕⊕⊕⊝ | ||
| 1.330 per 1.000 | 1000 per 1.000 | |||||
| Adherence: discontinuations | Study population | RR 0.95 | 1211 | ⊕⊕⊝⊝ | ||
| 54 per 1.000 | 52 per 1.000 | |||||
| AE: investigations ‐ isolated serum creatinine increase above ULN | Study population | RR 2.57 | 657 | ⊕⊕⊝⊝ | ||
| 137 per 1.000 | 353 per 1.000 | |||||
| *The risk in the intervention group (and its 95% CI) is based on the assumed risk in the comparison group and the relative effect of the intervention (and its 95% CI). | ||||||
| GRADE Working Group grades of evidence | ||||||
| 1 Serious risk of bias: studies that carry large weight for the overall effect estimate rated as high risk of bias due to lack of blinding and selective reporting. | ||||||
| Deferasirox compared to deferiprone in people with transfusion‐dependent thalassemia | ||||||
| Patient or population:people with transfusion‐dependent thalassemia | ||||||
| Outcomes | Anticipated absolute effects* (95% CI) | Relative effect | № of participants | Quality of the evidence | Comments | |
| Risk with deferiprone | Risk with deferasirox | |||||
| Mortality at any time point | Study population | not estimable | 146 | ⊕⊝⊝⊝ | ||
| 0 per 1.000 | 0 per 1.000 | |||||
| Responder analysis | Not measured | NA | ||||
| Serum ferritin (ng/mL): mean change from baseline and at end of study | MD 229.99 ng/mL higher | ‐ | 83 | ⊕⊝⊝⊝ | ||
| LIC (mg/g) evaluated by MRI R2*: mean change from baseline | MD 0.8 mg/g lower | ‐ | 45 | ⊕⊝⊝⊝ | ||
| Satisfaction | Not measured | NA | ||||
| Adherence: discontinuations | Study population | RR 0.16 | 179 | ⊕⊕⊝⊝ | ||
| 32 per 1.000 | 5 per 1.000 | |||||
| Renal failure | Study population | not estimable | 38 | ⊕⊝⊝⊝ | ||
| 0 per 1.000 | 0 per 1.000 | |||||
| *The risk in the intervention group (and its 95% CI) is based on the assumed risk in the comparison group and the relative effect of the intervention (and its 95% CI). | ||||||
| GRADE Working Group grades of evidence | ||||||
| 1 Very serious imprecision: only very few number of included participants. | ||||||
| Deferasirox alone compared to combined deferasirox and deferiprone in people with transfusion‐dependent thalassaemia | ||||||
| Patient or population: people with transfusion‐dependent thalassaemia | ||||||
| Outcomes | Anticipated absolute effects* (95% CI) | Relative effect | № of participants | Quality of the evidence | Comments | |
| Risk with deferasirox and deferiprone | Risk with deferasirox | |||||
| Mortality at any time point | Not reported1 | NA | ||||
| Responder analysis | Not measured1 | NA | ||||
| Serum ferritin (ng/mL) | Not reported1 | NA | ||||
| LIC (mg Fe/g dry weight) | Not reported1 | NA | ||||
| Satisfaction with treatment | Not measured1 | NA | ||||
| Adherence | Not reported1 | NA | ||||
| AE: serum creatinine increase | Not measured1 | NA | ||||
| *The risk in the intervention group (and its 95% CI) is based on the assumed risk in the comparison group and the relative effect of the intervention (and its 95% CI). | ||||||
| GRADE Working Group grades of evidence | ||||||
| 1 One RCT (40 participants) contributed to this comparison, but no relevant outcome data to this table are available (Kakkar 2014). | ||||||
| Combined deferasirox and deferiprone compared to deferiprone alone in people with transfusion‐dependent thalassaemia | ||||||
| Patient or population: people with transfusion‐dependent thalassemia | ||||||
| Outcomes | Anticipated absolute effects* (95% CI) | Relative effect | № of participants | Quality of the evidence | Comments | |
| Risk with deferasirox and deferiprone | Risk with deferasirox | |||||
| Mortality at any time point | Not reported1 | NA | ||||
| Responder analysis | Not measured1 | NA | ||||
| Serum ferritin (ng/mL) | Not reported1 | NA | ||||
| LIC (mg Fe/g dry weight) | Not reported1 | NA | ||||
| Satisfaction with treatment | Not measured1 | NA | ||||
| Adherence | Not reported1 | NA | ||||
| AE: Serum creatinine increase | Not measured1 | NA | ||||
| *The risk in the intervention group (and its 95% CI) is based on the assumed risk in the comparison group and the relative effect of the intervention (and its 95% CI). | ||||||
| GRADE Working Group grades of evidence | ||||||
| 1 One RCT (40 participants) contributed to this comparison, but no relevant outcome data to this table are available (Kakkar 2014). | ||||||
| Deferasirox and deferoxamine compared to deferoxamine in people with transfusion‐dependent thalassemia | ||||||
| Patient or population: people with transfusion‐dependent thalassemia | ||||||
| Outcomes | Anticipated absolute effects* (95% CI) | Relative effect | № of participants | Quality of the evidence | Comments | |
| Risk with deferoxamine | Risk with deferasirox and deferoxamine | |||||
| Mortality at any time point | Study population | not estimable | 94 | ⊕⊕⊝⊝ | ||
| 0 per 1.000 | 0 per 1.000 | |||||
| Responder analysis | Not measured | NA | ||||
| Serum ferritin (ng/mL) ‐ mean at end of study | MD 87.84 ng/mL higher | ‐ | 94 | ⊕⊝⊝⊝ | ||
| LIC | Not measured | NA | ||||
| Satisfaction with treatment | Not measured | NA | ||||
| Adherence: Discontinuations | Study population | not estimable | 94 | ⊕⊝⊝⊝ | ||
| 0 per 1.000 | 0 per 1.000 | |||||
| AE: serum creatinine increased | Not reported | NA | Serum creatinine was measured in Molavi 2014, but no results were reported. | |||
| *The risk in the intervention group (and its 95% CI) is based on the assumed risk in the comparison group and the relative effect of the intervention (and its 95% CI). | ||||||
| GRADE Working Group grades of evidence | ||||||
| 1 Very serious imprecision: only very few participants included. | ||||||
| Deferasirox and deferiprone compared to deferiprone and deferoxamine in people with transfusion‐dependent thalassemia | ||||||
| Patient or population: people with transfusion‐dependent thalassemia | ||||||
| Outcomes | Anticipated absolute effects* (95% CI) | Relative effect | № of participants | Quality of the evidence | Comments | |
| Risk with deferiprone and deferoxamine | Risk with deferasirox and deferiprone | |||||
| Mortality at any time point | Study population | not estimable | 96 | ⊕⊕⊝⊝ | "All the included patients continued till the end of study with no patients were lost follow‐up." (Elalfy 2015b) | |
| 0 per 1.000 | 0 per 1.000 | |||||
| Responder analysis | Not measured | NA | ||||
| Serum ferritin (ng/mL): mean change from baseline | MD 315.9 ng/mL lower | ‐ | 96 | ⊕⊝⊝⊝ | ||
| LIC evaluated by MRI R2*: mean change from baseline | MD 0.62 mg/g lower | ‐ | 96 | ⊕⊕⊝⊝ | ||
| Satisfaction | Not reported | NA | "Compared to baseline, patient‐reported satisfaction associated with ICT was significantly higher in group B [DFX and DFP] compared to group A [DFP and DFO] (p<0.01)" (Elalfy 2015b) | |||
| Adherence: Discontinuations | Study population | not estimable | 96 | ⊕⊝⊝⊝ | ||
| 0 per 1.000 | 0 per 1.000 | |||||
| Drug‐related AE: serum creatinine increased (≥ 33%) above baseline in 2 consecutive occasions | Study population | RR 3.00 | 96 | ⊕⊝⊝⊝ | ||
| 21 per 1.000 | 63 per 1.000 | |||||
| *The risk in the intervention group (and its 95% CI) is based on the assumed risk in the comparison group and the relative effect of the intervention (and its 95% CI). | ||||||
| GRADE Working Group grades of evidence | ||||||
| 1 Very serious imprecision: very few participants included. | ||||||
| Deferasirox compared to placebo in people with non‐transfusion‐dependent thalassemia | ||||||
| Patient or population: people with non‐transfusion‐dependent thalassemia | ||||||
| Outcomes | Anticipated absolute effects* (95% CI) | Relative effect | № of participants | Quality of the evidence | Comments | |
| Risk with placebo | Risk with deferasirox | |||||
| Mortality at any time point | Study population | not estimable | 148 | ⊕⊕⊕⊝ | "No deaths occurred during the study in any group" (Taher 2012) | |
| 0 per 1.000 | 0 per 1.000 | |||||
| Responder analysis | Not measured | NA | ||||
| Serum ferritin (ng/mL): mean change from baseline | MD 306.74 ng/mL lower | ‐ | 154 | ⊕⊕⊕⊝ | ||
| LIC (mg Fe/g dry weight) evaluated by MRI R2: least squares mean change from baseline | MD 3.27 mg Fe/g dry weight lower | ‐ | 159 | ⊕⊕⊕⊝ | ||
| Satisfaction with treatment | Not measured | NA | ||||
| Adherence: Discontinuations | Study population | RR 1.32 | 166 | ⊕⊕⊝⊝ | ||
| 89 per 1.000 | 118 per 1.000 | |||||
| AE: abnormal serum creatinine (post‐baseline) | Study population | RR 3.59 | 166 | ⊕⊝⊝⊝ | ||
| 0 per 1.000 | 0 per 1.000 | |||||
| *The risk in the intervention group (and its 95% CI) is based on the assumed risk in the comparison group and the relative effect of the intervention (and its 95% CI). | ||||||
| GRADE Working Group grades of evidence | ||||||
| 1 Serious imprecision: only few patients included. | ||||||
| Outcome or subgroup title | No. of studies | No. of participants | Statistical method | Effect size |
| 1 Mortality at any time point Show forest plot | 2 | 47 | Risk Ratio (M‐H, Fixed, 95% CI) | 0.0 [0.0, 0.0] |
| 2 AEs Show forest plot | 1 | Risk Ratio (M‐H, Fixed, 95% CI) | Totals not selected | |
| 2.1 Eye disorders ‐ retinal infarct | 1 | Risk Ratio (M‐H, Fixed, 95% CI) | 0.0 [0.0, 0.0] | |
| 2.2 GI disorders ‐ abdominal pain | 1 | Risk Ratio (M‐H, Fixed, 95% CI) | 0.0 [0.0, 0.0] | |
| 2.3 GI disorders ‐ diarrhoea | 1 | Risk Ratio (M‐H, Fixed, 95% CI) | 0.0 [0.0, 0.0] | |
| 2.4 GI disorders ‐ nausea | 1 | Risk Ratio (M‐H, Fixed, 95% CI) | 0.0 [0.0, 0.0] | |
| 2.5 Investigations ‐ extended QT interval, hypocalcaemia, hypoparathyroidism | 1 | Risk Ratio (M‐H, Fixed, 95% CI) | 0.0 [0.0, 0.0] | |
| 2.6 Skin and subcutaneous tissue disorders ‐ rash | 1 | Risk Ratio (M‐H, Fixed, 95% CI) | 0.0 [0.0, 0.0] | |
| 3 Discontinuations due to serious AEs Show forest plot | 1 | Risk Ratio (M‐H, Fixed, 95% CI) | Totals not selected | |
| Outcome or subgroup title | No. of studies | No. of participants | Statistical method | Effect size |
| 1 Mortality at any time point Show forest plot | 8 | 1170 | Risk Ratio (M‐H, Fixed, 95% CI) | 0.48 [0.09, 2.63] |
| 1.1 At 8 months | 1 | 138 | Risk Ratio (M‐H, Fixed, 95% CI) | 0.0 [0.0, 0.0] |
| 1.2 At 48 weeks (deferasirox 10 mg/kg/day) | 1 | 35 | Risk Ratio (M‐H, Fixed, 95% CI) | 0.0 [0.0, 0.0] |
| 1.3 At 48 weeks (deferasirox 20 mg/kg/day ) | 1 | 36 | Risk Ratio (M‐H, Fixed, 95% CI) | 0.0 [0.0, 0.0] |
| 1.4 At 1 year | 5 | 942 | Risk Ratio (M‐H, Fixed, 95% CI) | 0.48 [0.09, 2.63] |
| 1.5 At 2 years | 1 | 19 | Risk Ratio (M‐H, Fixed, 95% CI) | 0.0 [0.0, 0.0] |
| 2 LVEF (%): least squares mean change from baseline Show forest plot | 1 | Mean Difference (IV, Fixed, 95% CI) | Totals not selected | |
| 3 LVEF (# participants affected) Show forest plot | 1 | Risk Ratio (M‐H, Fixed, 95% CI) | Totals not selected | |
| 3.1 Improvement from abnormal LVEF to normal range | 1 | Risk Ratio (M‐H, Fixed, 95% CI) | 0.0 [0.0, 0.0] | |
| 3.2 Decrease from normal LVEF to below LLN | 1 | Risk Ratio (M‐H, Fixed, 95% CI) | 0.0 [0.0, 0.0] | |
| 4 Incidence of thyroid disease at end of study Show forest plot | 1 | Risk Ratio (M‐H, Fixed, 95% CI) | Totals not selected | |
| 5 ALT (# participants affected): improvement from abnormal to normal range Show forest plot | 1 | Risk Ratio (M‐H, Fixed, 95% CI) | Totals not selected | |
| 6 ALT (U/L) at end of study Show forest plot | 1 | Mean Difference (IV, Fixed, 95% CI) | Totals not selected | |
| 7 AST (U/L) at end of study Show forest plot | 1 | Mean Difference (IV, Fixed, 95% CI) | Totals not selected | |
| 8 Serum creatinine (mg/dL) at end of study Show forest plot | 1 | Mean Difference (IV, Fixed, 95% CI) | Totals not selected | |
| 9 Blood urea (mg/dL): mean at end of study Show forest plot | 1 | Mean Difference (IV, Fixed, 95% CI) | Totals not selected | |
| 10 Serum ferritin (ng/mL): mean change from baseline and at end of study Show forest plot | 6 | 1002 | Mean Difference (IV, Fixed, 95% CI) | 454.42 [337.13, 571.71] |
| 10.1 Less than 3 mg Fe/g dw (median 5 mg deferasirox / 30mg deferoxamine) | 1 | 28 | Mean Difference (IV, Fixed, 95% CI) | 978.0 [544.71, 1411.29] |
| 10.2 More than 3 to 7 mg Fe/g dw (10/35) | 1 | 150 | Mean Difference (IV, Fixed, 95% CI) | 801.0 [572.53, 1029.47] |
| 10.3 More than 7 mg Fe/g dw (20/41) | 1 | 169 | Mean Difference (IV, Fixed, 95% CI) | 328.0 [124.94, 531.06] |
| 10.4 More than 14 mg Fe/g dw (30/51) | 1 | 216 | Mean Difference (IV, Fixed, 95% CI) | 77.0 [‐303.18, 457.18] |
| 10.5 Any iron overload | 5 | 439 | Mean Difference (IV, Fixed, 95% CI) | 234.25 [‐8.02, 476.52] |
| 11 Sensitivity analysis: serum ferritin (ng/mL): mean change from baseline Show forest plot | 2 | 701 | Mean Difference (IV, Fixed, 95% CI) | 418.94 [297.23, 540.65] |
| 11.1 Less than 3 mg Fe/g dw (median 5 mg deferasirox / 30 mg deferoxamine) | 1 | 28 | Mean Difference (IV, Fixed, 95% CI) | 978.0 [544.71, 1411.29] |
| 11.2 More than 3 to 7 mg Fe/g dw (10/35) | 1 | 150 | Mean Difference (IV, Fixed, 95% CI) | 801.0 [572.53, 1029.47] |
| 11.3 More than 7 mg Fe/g dw (20/41) | 1 | 169 | Mean Difference (IV, Fixed, 95% CI) | 328.0 [124.94, 531.06] |
| 11.4 More than 14 mg Fe/g dw (30/51) | 1 | 216 | Mean Difference (IV, Fixed, 95% CI) | 77.0 [‐303.18, 457.18] |
| 11.5 Any iron overload | 1 | 138 | Mean Difference (IV, Fixed, 95% CI) | ‐64.16 [‐354.62, 226.30] |
| 12 Liver R2* (Hz): mean change from baseline Show forest plot | 1 | Mean Difference (IV, Fixed, 95% CI) | Totals not selected | |
| 13 LIC (mg/g) evaluated by MRI (R2/R2*): mean change from baseline Show forest plot | 2 | 217 | Mean Difference (IV, Fixed, 95% CI) | 0.36 [‐1.01, 1.72] |
| 14 LIC (mg Fe/g dw) evaluated by biopsy or SQUID: mean change from baseline Show forest plot | 1 | 541 | Mean Difference (IV, Fixed, 95% CI) | 2.37 [1.68, 3.07] |
| 14.1 LIC 3 mg Fe/g dw or less (5/30) | 1 | 28 | Mean Difference (IV, Fixed, 95% CI) | 4.3 [2.30, 6.30] |
| 14.2 LIC more than 3 mg to 7 mg (10/35) Fe/g dw | 1 | 143 | Mean Difference (IV, Fixed, 95% CI) | 3.80 [2.74, 4.86] |
| 14.3 LIC more than 7 mg to 14 mg Fe/g dw (20/41) | 1 | 164 | Mean Difference (IV, Fixed, 95% CI) | 1.5 [0.28, 2.72] |
| 14.4 LIC more than 14 mg Fe/g dw (30/51) | 1 | 206 | Mean Difference (IV, Fixed, 95% CI) | ‐2.5 [‐4.55, ‐0.45] |
| 15 Responder analysis I (responder: fall in LIC > 10%) Show forest plot | 1 | Risk Ratio (M‐H, Fixed, 95% CI) | Totals not selected | |
| 15.1 Response at 48 weeks (deferasirox 10 mg/kg/day) | 1 | Risk Ratio (M‐H, Fixed, 95% CI) | 0.0 [0.0, 0.0] | |
| 15.2 Response at 48 weeks (deferasirox 20 mg/kg/day) | 1 | Risk Ratio (M‐H, Fixed, 95% CI) | 0.0 [0.0, 0.0] | |
| 16 Responder analysis II (responder: LIC 1 to < 7 mg Fe/g dw) Show forest plot | 1 | 553 | Risk Ratio (M‐H, Fixed, 95% CI) | 0.80 [0.69, 0.92] |
| 16.1 Response at 1 year (LIC below 7 mg Fe/g dw) | 1 | 172 | Risk Ratio (M‐H, Fixed, 95% CI) | 0.48 [0.37, 0.64] |
| 16.2 Response at 1 year (LIC at least 7 mg Fe/g dw) | 1 | 381 | Risk Ratio (M‐H, Fixed, 95% CI) | 0.99 [0.84, 1.18] |
| 17 Myocardial T2* (ms): mean change from baseline Show forest plot | 1 | Mean Difference (IV, Fixed, 95% CI) | Totals not selected | |
| 18 Myocardial iron concentration derived from T2* value (mg Fe/g dw): change from baseline Show forest plot | 1 | Mean Difference (IV, Fixed, 95% CI) | Totals not selected | |
| 18.1 All participants | 1 | Mean Difference (IV, Fixed, 95% CI) | 0.0 [0.0, 0.0] | |
| 18.2 Participants with T2* <10 ms | 1 | Mean Difference (IV, Fixed, 95% CI) | 0.0 [0.0, 0.0] | |
| 18.3 Participants with T2* ≥10 ms | 1 | Mean Difference (IV, Fixed, 95% CI) | 0.0 [0.0, 0.0] | |
| 19 Myocardial T2* (# participants affected) Show forest plot | 1 | Risk Ratio (M‐H, Fixed, 95% CI) | Totals not selected | |
| 19.1 Normalization | 1 | Risk Ratio (M‐H, Fixed, 95% CI) | 0.0 [0.0, 0.0] | |
| 19.2 Improvement (from 6 ‐ < 10 ms to 10 ‐ ≤ 20 ms) | 1 | Risk Ratio (M‐H, Fixed, 95% CI) | 0.0 [0.0, 0.0] | |
| 19.3 Worsening (from 10‐ ≤ 20 ms to 6 ‐ < 10 ms) | 1 | Risk Ratio (M‐H, Fixed, 95% CI) | 0.0 [0.0, 0.0] | |
| 20 Iron excretion‐intake ratio Show forest plot | 1 | 541 | Mean Difference (IV, Fixed, 95% CI) | ‐0.18 [‐0.24, ‐0.12] |
| 20.1 Less than 3 mg Fe/g dw (median 5 mg deferasirox / 30 mg deferoxamine) | 1 | 28 | Mean Difference (IV, Fixed, 95% CI) | ‐0.37 [‐0.54, ‐0.20] |
| 20.2 More than 3 to 7 mg Fe/g dw (10/35) | 1 | 143 | Mean Difference (IV, Fixed, 95% CI) | ‐0.31 [‐0.41, ‐0.21] |
| 20.3 More than 7 mg Fe/g dw (20/41) | 1 | 164 | Mean Difference (IV, Fixed, 95% CI) | ‐0.11 [‐0.21, ‐0.01] |
| 20.4 More than 14 mg Fe/g dw (30/51) | 1 | 206 | Mean Difference (IV, Fixed, 95% CI) | 0.23 [0.05, 0.41] |
| 21 Any serious AEs (# participants affected) Show forest plot | 2 | 773 | Risk Ratio (M‐H, Fixed, 95% CI) | 0.88 [0.42, 1.86] |
| 22 Serious AEs Show forest plot | 1 | Risk Ratio (M‐H, Fixed, 95% CI) | Totals not selected | |
| 22.1 Cardiac disorders ‐ arrhythmia | 1 | Risk Ratio (M‐H, Fixed, 95% CI) | 0.0 [0.0, 0.0] | |
| 22.2 Endocrine disorders ‐ hypogonadism | 1 | Risk Ratio (M‐H, Fixed, 95% CI) | 0.0 [0.0, 0.0] | |
| 22.3 GI disorders abdominal abscess | 1 | Risk Ratio (M‐H, Fixed, 95% CI) | 0.0 [0.0, 0.0] | |
| 22.4 GI disorders amoebiasis | 1 | Risk Ratio (M‐H, Fixed, 95% CI) | 0.0 [0.0, 0.0] | |
| 22.5 GI disorders ‐ appendicitis | 1 | Risk Ratio (M‐H, Fixed, 95% CI) | 0.0 [0.0, 0.0] | |
| 22.6 GI disorders ‐ colitis | 1 | Risk Ratio (M‐H, Fixed, 95% CI) | 0.0 [0.0, 0.0] | |
| 22.7 GI disorders ‐ diarrhoea | 1 | Risk Ratio (M‐H, Fixed, 95% CI) | 0.0 [0.0, 0.0] | |
| 22.8 GI disorders ‐ gastric haemorrhage | 1 | Risk Ratio (M‐H, Fixed, 95% CI) | 0.0 [0.0, 0.0] | |
| 22.9 GI disorders ‐ gastroenteritis | 1 | Risk Ratio (M‐H, Fixed, 95% CI) | 0.0 [0.0, 0.0] | |
| 22.10 GI disorders ‐ ileus | 1 | Risk Ratio (M‐H, Fixed, 95% CI) | 0.0 [0.0, 0.0] | |
| 22.11 GI disorders ‐ upper abdominal pain | 1 | Risk Ratio (M‐H, Fixed, 95% CI) | 0.0 [0.0, 0.0] | |
| 22.12 GI disorders ‐ vomiting | 1 | Risk Ratio (M‐H, Fixed, 95% CI) | 0.0 [0.0, 0.0] | |
| 22.13 GI disorders ‐ GI infection | 1 | Risk Ratio (M‐H, Fixed, 95% CI) | 0.0 [0.0, 0.0] | |
| 22.14 General disorders and administration site conditions ‐ pyrexia | 1 | Risk Ratio (M‐H, Fixed, 95% CI) | 0.0 [0.0, 0.0] | |
| 22.15 General disorders and administration site conditions ‐ local swelling | 1 | Risk Ratio (M‐H, Fixed, 95% CI) | 0.0 [0.0, 0.0] | |
| 22.16 Hepatobiliary disorders ‐ liver abscess | 1 | Risk Ratio (M‐H, Fixed, 95% CI) | 0.0 [0.0, 0.0] | |
| 22.17 Hepatobiliary disorders ‐ cholelithiasis | 1 | Risk Ratio (M‐H, Fixed, 95% CI) | 0.0 [0.0, 0.0] | |
| 22.18 Immune system disorders ‐ face oedema | 1 | Risk Ratio (M‐H, Fixed, 95% CI) | 0.0 [0.0, 0.0] | |
| 22.19 Infections and infestations ‐ herpes zoster | 1 | Risk Ratio (M‐H, Fixed, 95% CI) | 0.0 [0.0, 0.0] | |
| 22.20 Infections and infestations ‐ tooth infection | 1 | Risk Ratio (M‐H, Fixed, 95% CI) | 0.0 [0.0, 0.0] | |
| 22.21 Infections and infestations ‐ urinary tract infection | 1 | Risk Ratio (M‐H, Fixed, 95% CI) | 0.0 [0.0, 0.0] | |
| 22.22 Injury, poisoning and procedural complications ‐ oesophageal rupture | 1 | Risk Ratio (M‐H, Fixed, 95% CI) | 0.0 [0.0, 0.0] | |
| 22.23 Injury, poisoning and procedural complications ‐ haemosiderosis | 1 | Risk Ratio (M‐H, Fixed, 95% CI) | 0.0 [0.0, 0.0] | |
| 22.24 Injury, poisoning and procedural complications ‐ iron overload | 1 | Risk Ratio (M‐H, Fixed, 95% CI) | 0.0 [0.0, 0.0] | |
| 22.25 Metabolism and nutrition disorders ‐ hyperglycaemia | 1 | Risk Ratio (M‐H, Fixed, 95% CI) | 0.0 [0.0, 0.0] | |
| 22.26 Musculoskeletal and connective tissue disorders ‐ back pain | 1 | Risk Ratio (M‐H, Fixed, 95% CI) | 0.0 [0.0, 0.0] | |
| 22.27 Musculoskeletal and connective tissue disorders ‐ pain in jaw | 1 | Risk Ratio (M‐H, Fixed, 95% CI) | 0.0 [0.0, 0.0] | |
| 22.28 Nervous system disorders ‐ grand mal convulsion | 1 | Risk Ratio (M‐H, Fixed, 95% CI) | 0.0 [0.0, 0.0] | |
| 22.29 Nervous system disorders ‐ meningitis | 1 | Risk Ratio (M‐H, Fixed, 95% CI) | 0.0 [0.0, 0.0] | |
| 22.30 Respiratory, thoracic and mediastinal disorders ‐ acute tonsilitis | 1 | Risk Ratio (M‐H, Fixed, 95% CI) | 0.0 [0.0, 0.0] | |
| 23 Any AE (# participants affected) Show forest plot | 2 | 258 | Risk Ratio (M‐H, Fixed, 95% CI) | 0.94 [0.83, 1.08] |
| 24 AEs Show forest plot | 5 | Risk Ratio (M‐H, Fixed, 95% CI) | Subtotals only | |
| 24.1 Blood and lymphatic system disorder ‐ agranulocytosis | 2 | 657 | Risk Ratio (M‐H, Fixed, 95% CI) | 0.0 [0.0, 0.0] |
| 24.2 Blood and lymphatic system disorder ‐ leukopenia | 1 | 138 | Risk Ratio (M‐H, Fixed, 95% CI) | 7.0 [0.37, 133.02] |
| 24.3 Blood and lymphatic system disorder ‐ neutropenia | 1 | 71 | Risk Ratio (M‐H, Fixed, 95% CI) | 0.0 [0.0, 0.0] |
| 24.4 Blood and lymphatic system disorder ‐ thrombocytopenia | 2 | 209 | Risk Ratio (M‐H, Fixed, 95% CI) | 4.0 [0.46, 34.88] |
| 24.5 Cardiac disorders ‐ cardiac AE | 1 | 586 | Risk Ratio (M‐H, Fixed, 95% CI) | 0.73 [0.38, 1.41] |
| 24.6 Ear and labyrinth disorders ‐ hearing loss | 2 | 657 | Risk Ratio (M‐H, Fixed, 95% CI) | 1.12 [0.41, 3.05] |
| 24.7 Eye disorder ‐ lens abnormality | 2 | 657 | Risk Ratio (M‐H, Fixed, 95% CI) | 0.39 [0.08, 2.00] |
| 24.8 Eye disorder ‐ retinal abnormality | 1 | 71 | Risk Ratio (M‐H, Fixed, 95% CI) | 0.0 [0.0, 0.0] |
| 24.9 GI disorders ‐ abdominal pain | 2 | 258 | Risk Ratio (M‐H, Fixed, 95% CI) | 1.69 [0.93, 3.05] |
| 24.10 GI disorders ‐ abdominal pain upper | 1 | 187 | Risk Ratio (M‐H, Fixed, 95% CI) | 1.14 [0.36, 3.60] |
| 24.11 GI disorders ‐ diarrhoea | 2 | 258 | Risk Ratio (M‐H, Fixed, 95% CI) | 1.65 [0.86, 3.16] |
| 24.12 GI disorders ‐ dyspepsia | 1 | 71 | Risk Ratio (M‐H, Fixed, 95% CI) | 1.20 [0.25, 5.72] |
| 24.13 GI disorders ‐ GIT upset | 1 | 60 | Risk Ratio (M‐H, Fixed, 95% CI) | 3.0 [0.66, 13.69] |
| 24.14 GI disorders ‐ nausea | 2 | 258 | Risk Ratio (M‐H, Fixed, 95% CI) | 2.59 [0.90, 7.47] |
| 24.15 GI disorders ‐ vomiting | 2 | 258 | Risk Ratio (M‐H, Fixed, 95% CI) | 2.95 [0.91, 9.55] |
| 24.16 General disorders and administration site conditions ‐ asthenia | 1 | 71 | Risk Ratio (M‐H, Fixed, 95% CI) | 1.20 [0.42, 3.42] |
| 24.17 General disorders and administration site conditions ‐ influenza‐like illness | 1 | 71 | Risk Ratio (M‐H, Fixed, 95% CI) | 1.20 [0.42, 3.42] |
| 24.18 General disorders and administration site conditions ‐ pyrexia | 2 | 258 | Risk Ratio (M‐H, Fixed, 95% CI) | 1.27 [0.66, 2.44] |
| 24.19 Immune system disorders ‐ allergic conjunctivitis | 1 | 71 | Risk Ratio (M‐H, Fixed, 95% CI) | 4.41 [0.25, 78.58] |
| 24.20 Infections and infestations ‐ bronchitis | 1 | 71 | Risk Ratio (M‐H, Fixed, 95% CI) | 2.40 [0.30, 19.35] |
| 24.21 Infections and infestations ‐ upper respiratory tract infection | 1 | 187 | Risk Ratio (M‐H, Fixed, 95% CI) | 0.95 [0.37, 2.42] |
| 24.22 Infections and infestations ‐ urinary tract infection | 1 | 71 | Risk Ratio (M‐H, Fixed, 95% CI) | 2.40 [0.30, 19.35] |
| 24.23 Investigations ‐ ALT increased | 1 | 187 | Risk Ratio (M‐H, Fixed, 95% CI) | 1.71 [0.59, 4.90] |
| 24.24 Investigations ‐ elevated ALT (>2 UNL) | 1 | 586 | Risk Ratio (M‐H, Fixed, 95% CI) | 4.90 [0.24, 101.60] |
| 24.25 Investigations ‐ AST increased | 1 | 187 | Risk Ratio (M‐H, Fixed, 95% CI) | 2.21 [0.59, 8.29] |
| 24.26 Investigations ‐ blood creatinine increased | 1 | 187 | Risk Ratio (M‐H, Fixed, 95% CI) | 3.79 [0.83, 17.38] |
| 24.27 Investigations ‐ isolated serum creatinine increase above upper limit of normal | 2 | 657 | Risk Ratio (M‐H, Fixed, 95% CI) | 2.57 [1.88, 3.51] |
| 24.28 Investigations ‐ platelet count increased | 1 | 187 | Risk Ratio (M‐H, Fixed, 95% CI) | 0.38 [0.08, 1.91] |
| 24.29 Musculoskeletal and connective tissue disorders ‐ arthralgia | 2 | 258 | Risk Ratio (M‐H, Fixed, 95% CI) | 1.31 [0.55, 3.13] |
| 24.30 Musculoskeletal and connective tissue disorders ‐ back pain | 2 | 258 | Risk Ratio (M‐H, Fixed, 95% CI) | 1.30 [0.73, 2.34] |
| 24.31 Musculoskeletal and connective tissue disorders ‐ osteoporosis | 1 | 187 | Risk Ratio (M‐H, Fixed, 95% CI) | 2.37 [0.47, 11.91] |
| 24.32 Nervous system disorders ‐ headache | 2 | 258 | Risk Ratio (M‐H, Fixed, 95% CI) | 1.44 [0.68, 3.05] |
| 24.33 Nervous system disorders ‐ vertigo | 1 | 71 | Risk Ratio (M‐H, Fixed, 95% CI) | 1.12 [0.32, 3.93] |
| 24.34 Renal and urinary disorders ‐ proteinuria | 1 | 187 | Risk Ratio (M‐H, Fixed, 95% CI) | 1.16 [0.50, 2.66] |
| 24.35 Respiratory, thoracic and mediastinal disorders ‐ cough | 1 | 71 | Risk Ratio (M‐H, Fixed, 95% CI) | 1.80 [0.67, 4.81] |
| 24.36 Respiratory, thoracic and mediastinal disorders ‐ influenza | 2 | 258 | Risk Ratio (M‐H, Fixed, 95% CI) | 1.05 [0.52, 2.13] |
| 24.37 Respiratory, thoracic and mediastinal disorders ‐ nasopharyngitis | 1 | 187 | Risk Ratio (M‐H, Fixed, 95% CI) | 1.90 [0.59, 6.08] |
| 24.38 Respiratory, thoracic and mediastinal disorders ‐ oropharyngeal pain | 1 | 187 | Risk Ratio (M‐H, Fixed, 95% CI) | 2.84 [0.59, 13.73] |
| 24.39 Respiratory, thoracic and mediastinal disorders ‐ pharyngitis | 1 | 71 | Risk Ratio (M‐H, Fixed, 95% CI) | 1.02 [0.52, 2.00] |
| 24.40 Respiratory, thoracic and mediastinal disorders ‐ pharyngolaryngeal pain | 1 | 71 | Risk Ratio (M‐H, Fixed, 95% CI) | 0.88 [0.37, 2.08] |
| 24.41 Respiratory, thoracic and mediastinal disorders ‐ rhinitis | 1 | 71 | Risk Ratio (M‐H, Fixed, 95% CI) | 1.28 [0.58, 2.83] |
| 24.42 Skin and subcutaneous tissue disorders ‐ Rash | 1 | 60 | Risk Ratio (M‐H, Fixed, 95% CI) | 2.67 [0.78, 9.09] |
| 25 Any drug‐related AE (# participants affected) Show forest plot | 1 | Risk Ratio (M‐H, Fixed, 95% CI) | Totals not selected | |
| 26 Drug‐related AEs Show forest plot | 2 | Risk Ratio (M‐H, Fixed, 95% CI) | Totals not selected | |
| 26.1 Blood and lymphatic system disorder ‐ neutropenia | 1 | Risk Ratio (M‐H, Fixed, 95% CI) | 0.0 [0.0, 0.0] | |
| 26.2 Injury, poisoning and procedural complications ‐ infusion site haemorrhage | 1 | Risk Ratio (M‐H, Fixed, 95% CI) | 0.0 [0.0, 0.0] | |
| 26.3 Injury, poisoning and procedural complications ‐ infusion site pain | 1 | Risk Ratio (M‐H, Fixed, 95% CI) | 0.0 [0.0, 0.0] | |
| 26.4 Injury, poisoning and procedural complications ‐ infusion site swelling | 1 | Risk Ratio (M‐H, Fixed, 95% CI) | 0.0 [0.0, 0.0] | |
| 26.5 Injury, poisoning and procedural complications ‐ injection site pain | 1 | Risk Ratio (M‐H, Fixed, 95% CI) | 0.0 [0.0, 0.0] | |
| 26.6 Injury, poisoning and procedural complications ‐ injection site reaction | 1 | Risk Ratio (M‐H, Fixed, 95% CI) | 0.0 [0.0, 0.0] | |
| 26.7 Investigations ‐ blood creatinine increased | 1 | Risk Ratio (M‐H, Fixed, 95% CI) | 0.0 [0.0, 0.0] | |
| 26.8 Investigations ‐ ALT increased | 1 | Risk Ratio (M‐H, Fixed, 95% CI) | 0.0 [0.0, 0.0] | |
| 26.9 Investigations ‐ AST increased | 1 | Risk Ratio (M‐H, Fixed, 95% CI) | 0.0 [0.0, 0.0] | |
| 26.10 GI disorders ‐ abdominal pain | 1 | Risk Ratio (M‐H, Fixed, 95% CI) | 0.0 [0.0, 0.0] | |
| 26.11 GI disorders ‐ abdominal pain upper | 1 | Risk Ratio (M‐H, Fixed, 95% CI) | 0.0 [0.0, 0.0] | |
| 26.12 GI disorders ‐ diarrhoea | 1 | Risk Ratio (M‐H, Fixed, 95% CI) | 0.0 [0.0, 0.0] | |
| 26.13 GI disorders ‐ nausea | 1 | Risk Ratio (M‐H, Fixed, 95% CI) | 0.0 [0.0, 0.0] | |
| 26.14 GI disorders ‐ vomiting | 1 | Risk Ratio (M‐H, Fixed, 95% CI) | 0.0 [0.0, 0.0] | |
| 26.15 Immune system disorders ‐ hypersensitivity | 1 | Risk Ratio (M‐H, Fixed, 95% CI) | 0.0 [0.0, 0.0] | |
| 26.16 Immune system disorders ‐ urticaria | 1 | Risk Ratio (M‐H, Fixed, 95% CI) | 0.0 [0.0, 0.0] | |
| 26.17 Musculoskeletal and connective tissue disorders ‐ arthropathy | 1 | Risk Ratio (M‐H, Fixed, 95% CI) | 0.0 [0.0, 0.0] | |
| 26.18 Renal and urinary disorders ‐ proteinuria | 1 | Risk Ratio (M‐H, Fixed, 95% CI) | 0.0 [0.0, 0.0] | |
| 26.19 Skin and subcutaneous tissue disorders ‐ alopecia | 1 | Risk Ratio (M‐H, Fixed, 95% CI) | 0.0 [0.0, 0.0] | |
| 26.20 Skin and subcutaneous tissue disorders ‐ rash | 1 | Risk Ratio (M‐H, Fixed, 95% CI) | 0.0 [0.0, 0.0] | |
| 26.21 Injury, poisoning and procedural complications ‐ pulmonary toxicity | 1 | Risk Ratio (M‐H, Fixed, 95% CI) | 0.0 [0.0, 0.0] | |
| 26.22 Eye disorders ‐ Ophthalmological toxicity | 1 | Risk Ratio (M‐H, Fixed, 95% CI) | 0.0 [0.0, 0.0] | |
| 26.23 Ear and labyrinth disorders ‐ Audiological toxicity | 1 | Risk Ratio (M‐H, Fixed, 95% CI) | 0.0 [0.0, 0.0] | |
| 27 Satisfaction with treatment (very satisfied or satisfied) Show forest plot | 1 | Risk Ratio (M‐H, Fixed, 95% CI) | Totals not selected | |
| 27.1 Week 4 ‐ participants previously treated with DFO | 1 | Risk Ratio (M‐H, Fixed, 95% CI) | 0.0 [0.0, 0.0] | |
| 27.2 Week 24 ‐ participants previously treated with DFO | 1 | Risk Ratio (M‐H, Fixed, 95% CI) | 0.0 [0.0, 0.0] | |
| 27.3 End of study (1 year) ‐ participants previously treated with DFO | 1 | Risk Ratio (M‐H, Fixed, 95% CI) | 0.0 [0.0, 0.0] | |
| 27.4 Week 4 ‐ DFO‐naive participants | 1 | Risk Ratio (M‐H, Fixed, 95% CI) | 0.0 [0.0, 0.0] | |
| 27.5 Week 24 ‐ DFO‐naive participants | 1 | Risk Ratio (M‐H, Fixed, 95% CI) | 0.0 [0.0, 0.0] | |
| 27.6 End of study (1 year) ‐ DFO‐naive participants | 1 | Risk Ratio (M‐H, Fixed, 95% CI) | 0.0 [0.0, 0.0] | |
| 28 Convenience (good or very good) Show forest plot | 1 | Risk Ratio (M‐H, Fixed, 95% CI) | Totals not selected | |
| 28.1 Week 4 ‐ participants previously treated with DFO | 1 | Risk Ratio (M‐H, Fixed, 95% CI) | 0.0 [0.0, 0.0] | |
| 28.2 Week 24 ‐ participants previously treated with DFO | 1 | Risk Ratio (M‐H, Fixed, 95% CI) | 0.0 [0.0, 0.0] | |
| 28.3 End of study (1 year) ‐ participants previously treated with DFO | 1 | Risk Ratio (M‐H, Fixed, 95% CI) | 0.0 [0.0, 0.0] | |
| 28.4 Week 4 ‐ DFO‐naive participants | 1 | Risk Ratio (M‐H, Fixed, 95% CI) | 0.0 [0.0, 0.0] | |
| 28.5 Week 24 ‐ DFO‐naive participants | 1 | Risk Ratio (M‐H, Fixed, 95% CI) | 0.0 [0.0, 0.0] | |
| 28.6 End of study (1 year) ‐ DFO‐naive participants | 1 | Risk Ratio (M‐H, Fixed, 95% CI) | 0.0 [0.0, 0.0] | |
| 29 Willingness to continue treatment Show forest plot | 1 | Risk Ratio (M‐H, Fixed, 95% CI) | Totals not selected | |
| 29.1 Participants treated previously with DFO | 1 | Risk Ratio (M‐H, Fixed, 95% CI) | 0.0 [0.0, 0.0] | |
| 29.2 DFO‐naive participants | 1 | Risk Ratio (M‐H, Fixed, 95% CI) | 0.0 [0.0, 0.0] | |
| 30 Time lost from normal activities due to treatment (hours/month): participants treated previously with DFO Show forest plot | 1 | Mean Difference (IV, Fixed, 95% CI) | Totals not selected | |
| 30.1 week 4 ‐ patients treated previously with DFO | 1 | Mean Difference (IV, Fixed, 95% CI) | 0.0 [0.0, 0.0] | |
| 30.2 week 24 ‐ patients treated previously with DFO | 1 | Mean Difference (IV, Fixed, 95% CI) | 0.0 [0.0, 0.0] | |
| 30.3 end of study (1 year) ‐ patients treated previously with DFO | 1 | Mean Difference (IV, Fixed, 95% CI) | 0.0 [0.0, 0.0] | |
| 30.4 week 4 ‐ DFO‐naive patients | 1 | Mean Difference (IV, Fixed, 95% CI) | 0.0 [0.0, 0.0] | |
| 30.5 week 24 ‐ DFO‐naive patients | 1 | Mean Difference (IV, Fixed, 95% CI) | 0.0 [0.0, 0.0] | |
| 30.6 end of study (1 year) ‐ DFO‐naive patients | 1 | Mean Difference (IV, Fixed, 95% CI) | 0.0 [0.0, 0.0] | |
| 31 Adherence (% of planned dose) Show forest plot | 1 | Mean Difference (IV, Fixed, 95% CI) | Totals not selected | |
| 32 Discontinuations Show forest plot | 8 | 1211 | Risk Ratio (M‐H, Fixed, 95% CI) | 0.95 [0.60, 1.50] |
| 32.1 Deferasirox 10 mg/kg/day | 1 | 35 | Risk Ratio (M‐H, Fixed, 95% CI) | 0.16 [0.01, 3.64] |
| 32.2 Deferasirox 20 mg/kg/day | 2 | 174 | Risk Ratio (M‐H, Fixed, 95% CI) | 1.0 [0.10, 9.96] |
| 32.3 Deferasirox 25 mg/kg/day | 1 | 120 | Risk Ratio (M‐H, Fixed, 95% CI) | 0.09 [0.01, 1.61] |
| 32.4 Deferasirox 40 mg/kg/day | 2 | 211 | Risk Ratio (M‐H, Fixed, 95% CI) | 1.02 [0.51, 2.05] |
| 32.5 Deferasirox ‐ variable dosage | 2 | 646 | Risk Ratio (M‐H, Fixed, 95% CI) | 1.39 [0.67, 2.85] |
| 32.6 Deferasirox dosing unknown | 1 | 25 | Risk Ratio (M‐H, Fixed, 95% CI) | 0.0 [0.0, 0.0] |
| 33 Dose adjustments and dose interruptions Show forest plot | 1 | Risk Ratio (M‐H, Fixed, 95% CI) | Totals not selected | |
| 34 Dose interruptions (interrupted at least once) Show forest plot | 1 | Risk Ratio (M‐H, Fixed, 95% CI) | Totals not selected | |
| 35 Dose reduction (at least once) Show forest plot | 1 | Risk Ratio (M‐H, Fixed, 95% CI) | Totals not selected | |
| 36 Dose adjustments (# participants affected) Show forest plot | 1 | Risk Ratio (M‐H, Fixed, 95% CI) | Totals not selected | |
| 37 Dose interruptions due to an AE (# participants affected) Show forest plot | 1 | Risk Ratio (M‐H, Fixed, 95% CI) | Totals not selected | |
| 38 Haemoglobin (g/dL): mean change from baseline and at end of study Show forest plot | 2 | 180 | Mean Difference (IV, Fixed, 95% CI) | ‐0.52 [‐0.82, ‐0.21] |
| 38.1 At 8 months (change from baseline) | 1 | 138 | Mean Difference (IV, Fixed, 95% CI) | ‐0.46 [‐0.81, ‐0.11] |
| 38.2 At 1 year (at end of study) | 1 | 42 | Mean Difference (IV, Fixed, 95% CI) | ‐0.70 [‐1.33, ‐0.07] |
| 39 Transfusion index (mL/kg/year): mean at end of study Show forest plot | 1 | Mean Difference (IV, Fixed, 95% CI) | Totals not selected | |
| 40 Transferrin saturation (%): mean at end of study Show forest plot | 1 | Mean Difference (IV, Fixed, 95% CI) | Totals not selected | |
| 41 Platelet count (x10³/mm³): mean at end of study Show forest plot | 1 | Mean Difference (IV, Fixed, 95% CI) | Totals not selected | |
| 42 Absolute neutrophilic count (/mm³): mean at end of study Show forest plot | 1 | Mean Difference (IV, Fixed, 95% CI) | Totals not selected | |
| Outcome or subgroup title | No. of studies | No. of participants | Statistical method | Effect size |
| 1 Mortality at any time point Show forest plot | 3 | 146 | Risk Ratio (M‐H, Fixed, 95% CI) | 0.0 [0.0, 0.0] |
| 1.1 at 1 year | 2 | 128 | Risk Ratio (M‐H, Fixed, 95% CI) | 0.0 [0.0, 0.0] |
| 1.2 at 2 years | 1 | 18 | Risk Ratio (M‐H, Fixed, 95% CI) | 0.0 [0.0, 0.0] |
| 2 Incidence of thyroid disease at end of study Show forest plot | 1 | Risk Ratio (M‐H, Fixed, 95% CI) | Totals not selected | |
| 3 ALT (U/L): mean change from baseline Show forest plot | 1 | Mean Difference (IV, Fixed, 95% CI) | Totals not selected | |
| 4 AST (U/L): mean change from baseline Show forest plot | 1 | Mean Difference (IV, Fixed, 95% CI) | Totals not selected | |
| 5 Urea (mg/dL): mean change from baseline Show forest plot | 1 | Mean Difference (IV, Fixed, 95% CI) | Totals not selected | |
| 6 Creatinine (mg/dL): mean change from baseline Show forest plot | 1 | Mean Difference (IV, Fixed, 95% CI) | Totals not selected | |
| 7 Neutrophil (count per mm³): mean change from baseline Show forest plot | 1 | Mean Difference (IV, Fixed, 95% CI) | Totals not selected | |
| 8 Serum ferritin (ng/mL): mean change from baseline and at end of study Show forest plot | 2 | Mean Difference (IV, Fixed, 95% CI) | Subtotals only | |
| 8.1 All participants | 2 | 83 | Mean Difference (IV, Fixed, 95% CI) | 229.99 [‐403.14, 863.11] |
| 8.2 Ferritin > 4000 | 1 | 11 | Mean Difference (IV, Fixed, 95% CI) | 1129.0 [‐2226.18, 4484.18] |
| 8.3 Ferritin 2000 ‐ 4000 | 1 | 16 | Mean Difference (IV, Fixed, 95% CI) | ‐151.0 [‐743.80, 441.80] |
| 8.4 Ferritin < 2000 | 1 | 11 | Mean Difference (IV, Fixed, 95% CI) | 388.0 [‐255.71, 1031.71] |
| 9 LIC (mg/g) evaluated by MRI (R2*): mean change from baseline Show forest plot | 1 | Mean Difference (IV, Fixed, 95% CI) | Totals not selected | |
| 10 Myocardial T2* (ms): mean change from baseline Show forest plot | 1 | Mean Difference (IV, Fixed, 95% CI) | Totals not selected | |
| 11 Any AE (# participants affected) Show forest plot | 1 | Risk Ratio (M‐H, Fixed, 95% CI) | Totals not selected | |
| 12 AEs Show forest plot | 1 | Risk Ratio (M‐H, Fixed, 95% CI) | Totals not selected | |
| 12.1 GI disorders ‐ diarrhoea | 1 | Risk Ratio (M‐H, Fixed, 95% CI) | 0.0 [0.0, 0.0] | |
| 12.2 GI disorders ‐ nausea | 1 | Risk Ratio (M‐H, Fixed, 95% CI) | 0.0 [0.0, 0.0] | |
| 12.3 GI disorders ‐ pain abdomen | 1 | Risk Ratio (M‐H, Fixed, 95% CI) | 0.0 [0.0, 0.0] | |
| 12.4 GI disorders ‐ vomiting | 1 | Risk Ratio (M‐H, Fixed, 95% CI) | 0.0 [0.0, 0.0] | |
| 12.5 Musculoskeletal and connective tissue disorders ‐ arthralgia | 1 | Risk Ratio (M‐H, Fixed, 95% CI) | 0.0 [0.0, 0.0] | |
| 12.6 Skin and subcutaneous tissue disorders ‐ rash | 1 | Risk Ratio (M‐H, Fixed, 95% CI) | 0.0 [0.0, 0.0] | |
| 12.7 Blood and lymphatic system disorder ‐ agranulocytosis | 1 | Risk Ratio (M‐H, Fixed, 95% CI) | 0.0 [0.0, 0.0] | |
| 12.8 Blood and lymphatic system disorder ‐ neutropenia | 1 | Risk Ratio (M‐H, Fixed, 95% CI) | 0.0 [0.0, 0.0] | |
| 12.9 Investigations ‐ AST levels > 2x UNL | 1 | Risk Ratio (M‐H, Fixed, 95% CI) | 0.0 [0.0, 0.0] | |
| 12.10 Investigations ‐ ALT levels > 2x UNL | 1 | Risk Ratio (M‐H, Fixed, 95% CI) | 0.0 [0.0, 0.0] | |
| 12.11 Investigations ‐ serum creatinine 50% increase from baseline | 1 | Risk Ratio (M‐H, Fixed, 95% CI) | 0.0 [0.0, 0.0] | |
| 12.12 Renal and urinary disorders ‐ renal failure | 1 | Risk Ratio (M‐H, Fixed, 95% CI) | 0.0 [0.0, 0.0] | |
| 13 Discontinuations (# participants affected) Show forest plot | 3 | 179 | Risk Ratio (M‐H, Fixed, 95% CI) | 0.16 [0.01, 2.99] |
| 14 Discontinuation due to an AE (# participants affected) Show forest plot | 1 | Risk Ratio (M‐H, Fixed, 95% CI) | Totals not selected | |
| 15 Transferrin saturation (%): mean at end of study Show forest plot | 1 | Mean Difference (IV, Fixed, 95% CI) | Totals not selected | |
| 16 Haemoglobin (g/dL): mean at end of study Show forest plot | 1 | Mean Difference (IV, Fixed, 95% CI) | Totals not selected | |
| 17 Transfusion index (mL/kg/year): mean at end of study Show forest plot | 1 | Mean Difference (IV, Fixed, 95% CI) | Totals not selected | |
| 18 ALP (U/L): mean change from baseline Show forest plot | 1 | Mean Difference (IV, Fixed, 95% CI) | Totals not selected | |
| Outcome or subgroup title | No. of studies | No. of participants | Statistical method | Effect size |
| 1 Mortality at any time point Show forest plot | 1 | Risk Ratio (M‐H, Fixed, 95% CI) | Totals not selected | |
| 1.1 at 12 months | 1 | Risk Ratio (M‐H, Fixed, 95% CI) | 0.0 [0.0, 0.0] | |
| 2 Neutrophil (µg/L): mean at end of study Show forest plot | 1 | Mean Difference (IV, Fixed, 95% CI) | Totals not selected | |
| 3 ALT (g/dL): mean at end of study Show forest plot | 1 | Mean Difference (IV, Fixed, 95% CI) | Totals not selected | |
| 4 AST (g/dL): mean at end of study Show forest plot | 1 | Mean Difference (IV, Fixed, 95% CI) | Totals not selected | |
| 5 Serum ferritin: mean at end of study (ng/mL) Show forest plot | 1 | Mean Difference (IV, Fixed, 95% CI) | Totals not selected | |
| 6 Discontinuations Show forest plot | 1 | Risk Ratio (M‐H, Fixed, 95% CI) | Totals not selected | |
| 7 Haemoglobin (g/dL): mean at end of study Show forest plot | 1 | Mean Difference (IV, Fixed, 95% CI) | Totals not selected | |
| 8 ALP (g/dL): mean at end of study Show forest plot | 1 | Mean Difference (IV, Fixed, 95% CI) | Totals not selected | |
| Outcome or subgroup title | No. of studies | No. of participants | Statistical method | Effect size |
| 1 Mortality at any time point Show forest plot | 1 | Risk Ratio (M‐H, Fixed, 95% CI) | Totals not selected | |
| 1.1 at 12 months | 1 | Risk Ratio (M‐H, Fixed, 95% CI) | 0.0 [0.0, 0.0] | |
| 2 Serum ferritin (ng/mL): mean change from baseline Show forest plot | 1 | Mean Difference (IV, Fixed, 95% CI) | Totals not selected | |
| 3 LIC (mg/g) evaluated by MRI (R2*): mean change from baseline Show forest plot | 1 | Mean Difference (IV, Fixed, 95% CI) | Totals not selected | |
| 4 Myocardial T2* (ms): mean change from baseline Show forest plot | 1 | Mean Difference (IV, Fixed, 95% CI) | Totals not selected | |
| 5 Serious AE (# participants affected) Show forest plot | 1 | Risk Ratio (M‐H, Fixed, 95% CI) | Totals not selected | |
| 6 Serious drug‐related AE (# participants affected) Show forest plot | 1 | Risk Ratio (M‐H, Fixed, 95% CI) | Totals not selected | |
| 6.1 Cholecystitis | 1 | Risk Ratio (M‐H, Fixed, 95% CI) | 0.0 [0.0, 0.0] | |
| 7 Serious non‐related drug AE Show forest plot | 1 | Risk Ratio (M‐H, Fixed, 95% CI) | Totals not selected | |
| 7.1 Appendicitis | 1 | Risk Ratio (M‐H, Fixed, 95% CI) | 0.0 [0.0, 0.0] | |
| 8 AEs Show forest plot | 1 | Risk Ratio (M‐H, Fixed, 95% CI) | Totals not selected | |
| 8.1 Blood and lymphatic system disorder ‐ agranulocytosis | 1 | Risk Ratio (M‐H, Fixed, 95% CI) | 0.0 [0.0, 0.0] | |
| 8.2 Blood and lymphatic system disorder ‐ neutropenia | 1 | Risk Ratio (M‐H, Fixed, 95% CI) | 0.0 [0.0, 0.0] | |
| 9 Drug‐related AEs (# participants affected) Show forest plot | 1 | Risk Ratio (M‐H, Fixed, 95% CI) | Totals not selected | |
| 10 Drug‐related AEs Show forest plot | 1 | Risk Ratio (M‐H, Fixed, 95% CI) | Totals not selected | |
| 10.1 Blood and lymphatic system disorders ‐ agranulocytosis | 1 | Risk Ratio (M‐H, Fixed, 95% CI) | 0.0 [0.0, 0.0] | |
| 10.2 Blood and lymphatic system disorders ‐ neutropenia | 1 | Risk Ratio (M‐H, Fixed, 95% CI) | 0.0 [0.0, 0.0] | |
| 10.3 GI disorders ‐ GI problems | 1 | Risk Ratio (M‐H, Fixed, 95% CI) | 0.0 [0.0, 0.0] | |
| 10.4 Investigations ‐ ALT increase ( ≥ 3 folds) | 1 | Risk Ratio (M‐H, Fixed, 95% CI) | 0.0 [0.0, 0.0] | |
| 10.5 Investigations ‐ serum creatinine ( ≥ 33%) above baseline in 2 consecutive occasions | 1 | Risk Ratio (M‐H, Fixed, 95% CI) | 0.0 [0.0, 0.0] | |
| 10.6 Musculoskeletal and connective tissue disorders ‐ arthralgia | 1 | Risk Ratio (M‐H, Fixed, 95% CI) | 0.0 [0.0, 0.0] | |
| 10.7 Skin and subcutaneous tissue disorders ‐ skin rash | 1 | Risk Ratio (M‐H, Fixed, 95% CI) | 0.0 [0.0, 0.0] | |
| 11 Non‐related drug AEs (# participants affected) Show forest plot | 1 | Risk Ratio (M‐H, Fixed, 95% CI) | Totals not selected | |
| 12 Non‐related drug AEs Show forest plot | 1 | Risk Ratio (M‐H, Fixed, 95% CI) | Totals not selected | |
| 12.1 Infections and infestations ‐ infections | 1 | Risk Ratio (M‐H, Fixed, 95% CI) | 0.0 [0.0, 0.0] | |
| 12.2 GI disorders | 1 | Risk Ratio (M‐H, Fixed, 95% CI) | 0.0 [0.0, 0.0] | |
| 12.3 Skin and subcutaneous tissue disorders | 1 | Risk Ratio (M‐H, Fixed, 95% CI) | 0.0 [0.0, 0.0] | |
| 13 Mild elevation of hepatic transaminases at start of therapy (# participants affected) Show forest plot | 1 | Risk Ratio (M‐H, Fixed, 95% CI) | Totals not selected | |
| 14 Initial gastrointestinal manifestations (# participants affected) Show forest plot | 1 | Risk Ratio (M‐H, Fixed, 95% CI) | Totals not selected | |
| 15 Quality of life (%) (measured by SF‐36): mean change from baseline Show forest plot | 1 | Mean Difference (IV, Fixed, 95% CI) | Totals not selected | |
| 16 Adherence: actual dose/total prescribed dose Show forest plot | 1 | Mean Difference (IV, Fixed, 95% CI) | Totals not selected | |
| 17 Discontinuations Show forest plot | 1 | Risk Ratio (M‐H, Fixed, 95% CI) | Totals not selected | |
| 18 Serious AE resulting in study discontinuation or interruption Show forest plot | 1 | Risk Ratio (M‐H, Fixed, 95% CI) | Totals not selected | |
| Outcome or subgroup title | No. of studies | No. of participants | Statistical method | Effect size |
| 1 Mortality at any time point Show forest plot | 1 | 148 | Risk Ratio (M‐H, Fixed, 95% CI) | 0.0 [0.0, 0.0] |
| 1.1 Deferasirox 5 mg/kg/day: at 12 months | 1 | 73 | Risk Ratio (M‐H, Fixed, 95% CI) | 0.0 [0.0, 0.0] |
| 1.2 Deferasirox 10 mg/kg/day: at 12 months | 1 | 75 | Risk Ratio (M‐H, Fixed, 95% CI) | 0.0 [0.0, 0.0] |
| 2 Serum ferritin (ng/mL): mean change from baseline Show forest plot | 1 | 154 | Mean Difference (IV, Fixed, 95% CI) | ‐306.74 [‐398.23, ‐215.24] |
| 2.1 Deferasirox 5 mg/kg/day | 1 | 78 | Mean Difference (IV, Fixed, 95% CI) | ‐259.1 [‐377.35, ‐140.85] |
| 2.2 Deferasirox 10 mg/kg/day | 1 | 76 | Mean Difference (IV, Fixed, 95% CI) | ‐377.79 [‐522.21, ‐233.37] |
| 3 LIC (mg Fe/g dw) evaluated by MRI R2: least squares mean change from baseline Show forest plot | 1 | 159 | Mean Difference (IV, Fixed, 95% CI) | ‐3.27 [‐4.44, ‐2.09] |
| 3.1 Deferasirox 5 mg/kg/day | 1 | 78 | Mean Difference (IV, Fixed, 95% CI) | ‐2.33 [‐4.00, ‐0.66] |
| 3.2 Deferasirox 10 mg/kg/day | 1 | 81 | Mean Difference (IV, Fixed, 95% CI) | ‐4.18 [‐5.83, ‐2.53] |
| 4 LIC (mg Fe/g dw) evaluated by MRI R2: mean change from baseline Show forest plot | 1 | Mean Difference (IV, Fixed, 95% CI) | Totals not selected | |
| 4.1 Non‐transfusion‐dependent β‐thalassemia 5 mg/kg/day | 1 | Mean Difference (IV, Fixed, 95% CI) | 0.0 [0.0, 0.0] | |
| 4.2 Non‐transfusion‐dependent β‐thalassemia 10 mg/kg/day | 1 | Mean Difference (IV, Fixed, 95% CI) | 0.0 [0.0, 0.0] | |
| 4.3 α‐thalassemia 5 mg/kg/day | 1 | Mean Difference (IV, Fixed, 95% CI) | 0.0 [0.0, 0.0] | |
| 4.4 α‐thalassemia 10 mg/kg/day | 1 | Mean Difference (IV, Fixed, 95% CI) | 0.0 [0.0, 0.0] | |
| 4.5 HbE/β‐thalassemia 5 mg/kg/day | 1 | Mean Difference (IV, Fixed, 95% CI) | 0.0 [0.0, 0.0] | |
| 4.6 HbE/β‐thalassemia 10 mg/kg/day | 1 | Mean Difference (IV, Fixed, 95% CI) | 0.0 [0.0, 0.0] | |
| 4.7 < 18 years 5 mg/kg/day | 1 | Mean Difference (IV, Fixed, 95% CI) | 0.0 [0.0, 0.0] | |
| 4.8 < 18 years 10 mg/kg/day | 1 | Mean Difference (IV, Fixed, 95% CI) | 0.0 [0.0, 0.0] | |
| 4.9 ≥18 years 5 mg/kg/day | 1 | Mean Difference (IV, Fixed, 95% CI) | 0.0 [0.0, 0.0] | |
| 4.10 ≥18 years 10 mg/kg/day | 1 | Mean Difference (IV, Fixed, 95% CI) | 0.0 [0.0, 0.0] | |
| 5 LIC: decrease of ≥ 3 mg Fe/g dw (# participants affected) Show forest plot | 1 | 166 | Risk Ratio (M‐H, Fixed, 95% CI) | 4.16 [1.90, 9.11] |
| 5.1 Deferasirox 5 mg/kg/day | 1 | 83 | Risk Ratio (M‐H, Fixed, 95% CI) | 3.05 [0.98, 9.50] |
| 5.2 Deferasirox 10 mg/kg/day | 1 | 83 | Risk Ratio (M‐H, Fixed, 95% CI) | 5.26 [1.76, 15.71] |
| 6 LIC: ≥ 30% reduction Fe/g dw (# participants affected) Show forest plot | 1 | 166 | Risk Ratio (M‐H, Fixed, 95% CI) | 14.17 [2.88, 69.74] |
| 6.1 Deferasirox 5 mg/kg/day | 1 | 83 | Risk Ratio (M‐H, Fixed, 95% CI) | 15.02 [0.93, 242.87] |
| 6.2 Deferasirox 10 mg/kg/day | 1 | 83 | Risk Ratio (M‐H, Fixed, 95% CI) | 13.75 [1.97, 95.97] |
| 7 LIC: shift to lower iron burden range (# participants affected) Show forest plot | 1 | 166 | Risk Ratio (M‐H, Fixed, 95% CI) | 3.35 [1.62, 6.91] |
| 7.1 Deferasirox 5 mg/kg/day | 1 | 83 | Risk Ratio (M‐H, Fixed, 95% CI) | 3.39 [1.10, 10.45] |
| 7.2 Deferasirox 10 mg/kg/day | 1 | 83 | Risk Ratio (M‐H, Fixed, 95% CI) | 3.31 [1.28, 8.55] |
| 8 LIC: achieve LIC < 5 mg Fe/g dw (# participants affected) Show forest plot | 1 | 166 | Risk Ratio (M‐H, Fixed, 95% CI) | 5.35 [1.30, 21.99] |
| 8.1 deferasirox 5mg/kg/d | 1 | 83 | Risk Ratio (M‐H, Fixed, 95% CI) | 4.07 [0.54, 30.96] |
| 8.2 deferasirox 10mg/kg/d | 1 | 83 | Risk Ratio (M‐H, Fixed, 95% CI) | 6.62 [0.91, 48.05] |
| 9 Drug‐related serious AEs (# participants affected) Show forest plot | 1 | Risk Ratio (M‐H, Fixed, 95% CI) | Totals not selected | |
| 10 Drug‐related serious AEs (# participants affected) Show forest plot | 1 | Risk Ratio (M‐H, Fixed, 95% CI) | Totals not selected | |
| 10.1 GI disorders ‐ abdominal pain | 1 | Risk Ratio (M‐H, Fixed, 95% CI) | 0.0 [0.0, 0.0] | |
| 10.2 Infections and infestations ‐ cellulitis | 1 | Risk Ratio (M‐H, Fixed, 95% CI) | 0.0 [0.0, 0.0] | |
| 10.3 Skin and subcutaneous tissue disorders ‐ pruritus | 1 | Risk Ratio (M‐H, Fixed, 95% CI) | 0.0 [0.0, 0.0] | |
| 10.4 Skin and subcutaneous tissue disorders ‐ rash | 1 | Risk Ratio (M‐H, Fixed, 95% CI) | 0.0 [0.0, 0.0] | |
| 10.5 General disorders ‐ pyrexia | 1 | Risk Ratio (M‐H, Fixed, 95% CI) | 0.0 [0.0, 0.0] | |
| 10.6 Hepatobiliary disorders ‐ hepatotoxicity | 1 | Risk Ratio (M‐H, Fixed, 95% CI) | 0.0 [0.0, 0.0] | |
| 11 Any AE (# participants affected) Show forest plot | 1 | Risk Ratio (M‐H, Fixed, 95% CI) | Totals not selected | |
| 12 Mild AE (# participants affected) Show forest plot | 1 | Risk Ratio (M‐H, Fixed, 95% CI) | Totals not selected | |
| 13 Moderate AE (# participants affected) Show forest plot | 1 | Risk Ratio (M‐H, Fixed, 95% CI) | Totals not selected | |
| 14 Severe AE (# participants affected) Show forest plot | 1 | Risk Ratio (M‐H, Fixed, 95% CI) | Totals not selected | |
| 15 AEs Show forest plot | 1 | Risk Ratio (M‐H, Fixed, 95% CI) | Totals not selected | |
| 15.1 Ear and labyrinth disorders ‐ neurosensory deafness | 1 | Risk Ratio (M‐H, Fixed, 95% CI) | 0.0 [0.0, 0.0] | |
| 15.2 Investigations ‐ abnormal platelet count (post‐baseline) | 1 | Risk Ratio (M‐H, Fixed, 95% CI) | 0.0 [0.0, 0.0] | |
| 15.3 Investigations ‐ abnormal neutrophils count (post‐baseline) | 1 | Risk Ratio (M‐H, Fixed, 95% CI) | 0.0 [0.0, 0.0] | |
| 15.4 Investigations ‐ abnormal ALT (post‐baseline) | 1 | Risk Ratio (M‐H, Fixed, 95% CI) | 0.0 [0.0, 0.0] | |
| 15.5 Investigations ‐ abnormal AST (post‐baseline) | 1 | Risk Ratio (M‐H, Fixed, 95% CI) | 0.0 [0.0, 0.0] | |
| 15.6 Investigations ‐ abnormal serum creatinine (post‐baseline) | 1 | Risk Ratio (M‐H, Fixed, 95% CI) | 0.0 [0.0, 0.0] | |
| 15.7 Investigations ‐ abnormal creatinine clearance (post‐baseline) | 1 | Risk Ratio (M‐H, Fixed, 95% CI) | 0.0 [0.0, 0.0] | |
| 15.8 Investigations ‐ urinary protein/creatinine ratio (post‐baseline) | 1 | Risk Ratio (M‐H, Fixed, 95% CI) | 0.0 [0.0, 0.0] | |
| 15.9 Investigations ‐ abnormal (low) systolic blood pressure (post‐baseline) | 1 | Risk Ratio (M‐H, Fixed, 95% CI) | 0.0 [0.0, 0.0] | |
| 15.10 Investigations ‐ abnormal (high) systolic blood pressure (post‐baseline) | 1 | Risk Ratio (M‐H, Fixed, 95% CI) | 0.0 [0.0, 0.0] | |
| 15.11 Investigations ‐ abnormal (low) diastolic blood pressure (post‐baseline) | 1 | Risk Ratio (M‐H, Fixed, 95% CI) | 0.0 [0.0, 0.0] | |
| 15.12 Investigations ‐ abnormal (high) diastolic blood pressure (post‐baseline) | 1 | Risk Ratio (M‐H, Fixed, 95% CI) | 0.0 [0.0, 0.0] | |
| 15.13 Investigations ‐ abnormal (low) pulse rate (post‐baseline) | 1 | Risk Ratio (M‐H, Fixed, 95% CI) | 0.0 [0.0, 0.0] | |
| 15.14 Investigations ‐ abnormal (high) pulse rate (post‐baseline) | 1 | Risk Ratio (M‐H, Fixed, 95% CI) | 0.0 [0.0, 0.0] | |
| 15.15 Renal and urinary disorders ‐ proteinuria | 1 | Risk Ratio (M‐H, Fixed, 95% CI) | 0.0 [0.0, 0.0] | |
| 16 Drug‐related AEs Show forest plot | 1 | Risk Ratio (M‐H, Fixed, 95% CI) | Totals not selected | |
| 16.1 GI disorders ‐ abdominal pain | 1 | Risk Ratio (M‐H, Fixed, 95% CI) | 0.0 [0.0, 0.0] | |
| 16.2 GI disorders ‐ abdominal pain upper | 1 | Risk Ratio (M‐H, Fixed, 95% CI) | 0.0 [0.0, 0.0] | |
| 16.3 GI disorders ‐ diarrhoea | 1 | Risk Ratio (M‐H, Fixed, 95% CI) | 0.0 [0.0, 0.0] | |
| 16.4 GI disorders ‐ nausea | 1 | Risk Ratio (M‐H, Fixed, 95% CI) | 0.0 [0.0, 0.0] | |
| 16.5 Nervous system disorders ‐ headache | 1 | Risk Ratio (M‐H, Fixed, 95% CI) | 0.0 [0.0, 0.0] | |
| 16.6 Skin and subcutaneous tissue disorders ‐ skin rash | 1 | Risk Ratio (M‐H, Fixed, 95% CI) | 0.0 [0.0, 0.0] | |
| 17 Adherence (# participants taking the planned study dose) Show forest plot | 1 | Risk Ratio (M‐H, Fixed, 95% CI) | Totals not selected | |
| 18 Discontinuations Show forest plot | 1 | 166 | Risk Ratio (M‐H, Fixed, 95% CI) | 1.32 [0.50, 3.52] |
| 18.1 Deferasirox 5 mg/kg/day | 1 | 83 | Risk Ratio (M‐H, Fixed, 95% CI) | 1.19 [0.33, 4.25] |
| 18.2 Deferasirox 10 mg/kg/day | 1 | 83 | Risk Ratio (M‐H, Fixed, 95% CI) | 1.53 [0.33, 7.08] |
| 19 Discontinuing study due to AE (# participants affected) Show forest plot | 1 | Risk Ratio (M‐H, Fixed, 95% CI) | Totals not selected | |
| 20 Dose increase Show forest plot | 1 | 166 | Risk Ratio (M‐H, Fixed, 95% CI) | 0.87 [0.63, 1.19] |
| 20.1 Deferasirox 5 mg/kg/day | 1 | 83 | Risk Ratio (M‐H, Fixed, 95% CI) | 0.88 [0.57, 1.38] |
| 20.2 Deferasirox 10 mg/kg/day | 1 | 83 | Risk Ratio (M‐H, Fixed, 95% CI) | 0.85 [0.54, 1.33] |
| 21 Dose interruption (at least once) Show forest plot | 1 | 166 | Risk Ratio (M‐H, Fixed, 95% CI) | 1.10 [0.88, 1.39] |
| 21.1 Deferasirox 5 mg/kg/day | 1 | 83 | Risk Ratio (M‐H, Fixed, 95% CI) | 1.02 [0.73, 1.43] |
| 21.2 Deferasirox 10 mg/kg/day | 1 | 83 | Risk Ratio (M‐H, Fixed, 95% CI) | 1.19 [0.87, 1.62] |
| 22 Dose reduction Show forest plot | 1 | 166 | Risk Ratio (M‐H, Fixed, 95% CI) | 1.46 [0.70, 3.06] |
| 22.1 Deferasirox 5 mg/kg/day | 1 | 83 | Risk Ratio (M‐H, Fixed, 95% CI) | 1.53 [0.54, 4.30] |
| 22.2 Deferasirox 10 mg/kg/day | 1 | 83 | Risk Ratio (M‐H, Fixed, 95% CI) | 1.4 [0.49, 4.00] |
| 23 Dose reduction due to AE Show forest plot | 1 | 166 | Risk Ratio (M‐H, Fixed, 95% CI) | 1.53 [0.69, 3.38] |
| 23.1 Deferasirox 5 mg/kg/day | 1 | 83 | Risk Ratio (M‐H, Fixed, 95% CI) | 2.04 [0.63, 6.63] |
| 23.2 Deferasirox 10 mg/kg/day | 1 | 83 | Risk Ratio (M‐H, Fixed, 95% CI) | 1.15 [0.39, 3.39] |
| 24 Haemoglobin (g/L): mean change from baseline Show forest plot | 1 | 144 | Mean Difference (IV, Fixed, 95% CI) | 1.54 [‐0.82, 3.90] |
| 24.1 Deferasirox 5 mg/kg/day | 1 | 71 | Mean Difference (IV, Fixed, 95% CI) | 1.00 [‐2.31, 4.31] |
| 24.2 Deferasirox 10 mg/kg/day | 1 | 73 | Mean Difference (IV, Fixed, 95% CI) | 2.10 [‐1.27, 5.47] |
| 25 Transferrin saturation (%): mean change from baseline Show forest plot | 1 | 141 | Mean Difference (IV, Fixed, 95% CI) | ‐7.10 [‐11.71, ‐2.50] |
| 25.1 Deferasirox 5 mg/kg/day | 1 | 70 | Mean Difference (IV, Fixed, 95% CI) | ‐7.16 [‐12.95, ‐1.37] |
| 25.2 Deferasirox 10 mg/kg/day | 1 | 71 | Mean Difference (IV, Fixed, 95% CI) | ‐7.01 [‐14.59, 0.57] |