Scolaris Content Display Scolaris Content Display

Comparison 1 Massage versus non‐specific acupuncture (control group) ‐ all trials, Outcome 1 Evidence of clinical depression.
Figures and Tables -
Analysis 1.1

Comparison 1 Massage versus non‐specific acupuncture (control group) ‐ all trials, Outcome 1 Evidence of clinical depression.

Comparison 1 Massage versus non‐specific acupuncture (control group) ‐ all trials, Outcome 2 Evidence of depressive symptomatology ‐ HRSD.
Figures and Tables -
Analysis 1.2

Comparison 1 Massage versus non‐specific acupuncture (control group) ‐ all trials, Outcome 2 Evidence of depressive symptomatology ‐ HRSD.

Comparison 1 Massage versus non‐specific acupuncture (control group) ‐ all trials, Outcome 3 Evidence of depressive symptomatology‐ BDI.
Figures and Tables -
Analysis 1.3

Comparison 1 Massage versus non‐specific acupuncture (control group) ‐ all trials, Outcome 3 Evidence of depressive symptomatology‐ BDI.

Comparison 2 Depression‐specific acupuncture versus non‐specific acupuncture (control group) ‐ all trials, Outcome 1 Evidence of clinical depression.
Figures and Tables -
Analysis 2.1

Comparison 2 Depression‐specific acupuncture versus non‐specific acupuncture (control group) ‐ all trials, Outcome 1 Evidence of clinical depression.

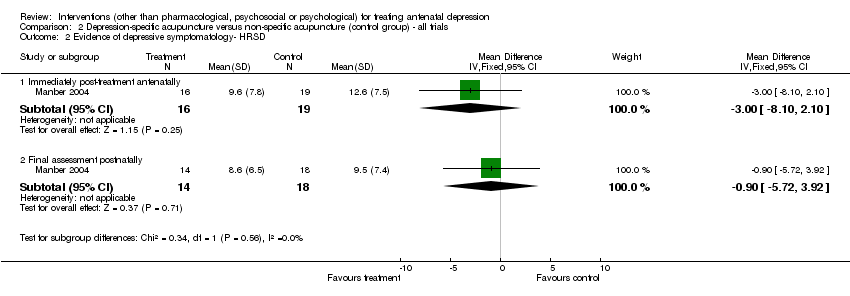
Comparison 2 Depression‐specific acupuncture versus non‐specific acupuncture (control group) ‐ all trials, Outcome 2 Evidence of depressive symptomatology‐ HRSD.
Figures and Tables -
Analysis 2.2

Comparison 2 Depression‐specific acupuncture versus non‐specific acupuncture (control group) ‐ all trials, Outcome 2 Evidence of depressive symptomatology‐ HRSD.

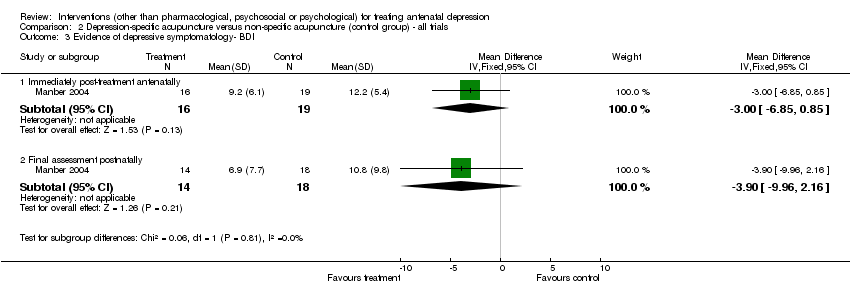
Comparison 2 Depression‐specific acupuncture versus non‐specific acupuncture (control group) ‐ all trials, Outcome 3 Evidence of depressive symptomatology‐ BDI.
Figures and Tables -
Analysis 2.3

Comparison 2 Depression‐specific acupuncture versus non‐specific acupuncture (control group) ‐ all trials, Outcome 3 Evidence of depressive symptomatology‐ BDI.

Comparison 1. Massage versus non‐specific acupuncture (control group) ‐ all trials

Outcome or subgroup title

No. of studies

No. of participants

Statistical method

Effect size

1 Evidence of clinical depression Show forest plot

1

Risk Ratio (M‐H, Fixed, 95% CI)

Subtotals only

1.1 Immediately post‐treatment antenatally

1

38

Risk Ratio (M‐H, Fixed, 95% CI)

0.8 [0.25, 2.53]

1.2 Final assessment postnatally

1

32

Risk Ratio (M‐H, Fixed, 95% CI)

1.93 [0.37, 10.01]

2 Evidence of depressive symptomatology ‐ HRSD Show forest plot

1

Mean Difference (IV, Fixed, 95% CI)

Subtotals only

2.1 Immediately post‐treatment antenatally

1

38

Mean Difference (IV, Fixed, 95% CI)

‐2.30 [‐6.51, 1.91]

2.2 Final assessment postnatally

1

33

Mean Difference (IV, Fixed, 95% CI)

‐0.20 [‐4.91, 4.51]

3 Evidence of depressive symptomatology‐ BDI Show forest plot

1

Mean Difference (IV, Fixed, 95% CI)

Subtotals only

3.1 Immediately post‐treatment antenatally

1

38

Mean Difference (IV, Fixed, 95% CI)

‐2.20 [‐5.22, 0.82]

3.2 Final assessment postnatally

1

33

Mean Difference (IV, Fixed, 95% CI)

‐0.60 [‐6.23, 5.03]

Figures and Tables -
Comparison 1. Massage versus non‐specific acupuncture (control group) ‐ all trials
Comparison 2. Depression‐specific acupuncture versus non‐specific acupuncture (control group) ‐ all trials

Outcome or subgroup title

No. of studies

No. of participants

Statistical method

Effect size

1 Evidence of clinical depression Show forest plot

1

Risk Ratio (M‐H, Fixed, 95% CI)

Subtotals only

1.1 Immediately post‐treatment antenatally

1

35

Risk Ratio (M‐H, Fixed, 95% CI)

0.48 [0.11, 2.13]

1.2 Final assessment postnatally

1

32

Risk Ratio (M‐H, Fixed, 95% CI)

0.64 [0.06, 6.39]

2 Evidence of depressive symptomatology‐ HRSD Show forest plot

1

Mean Difference (IV, Fixed, 95% CI)

Subtotals only

2.1 Immediately post‐treatment antenatally

1

35

Mean Difference (IV, Fixed, 95% CI)

‐3.0 [‐8.10, 2.10]

2.2 Final assessment postnatally

1

32

Mean Difference (IV, Fixed, 95% CI)

‐0.90 [‐5.72, 3.92]

3 Evidence of depressive symptomatology‐ BDI Show forest plot

1

Mean Difference (IV, Fixed, 95% CI)

Subtotals only

3.1 Immediately post‐treatment antenatally

1

35

Mean Difference (IV, Fixed, 95% CI)

‐3.0 [‐6.85, 0.85]

3.2 Final assessment postnatally

1

32

Mean Difference (IV, Fixed, 95% CI)

‐3.90 [‐9.96, 2.16]

Figures and Tables -
Comparison 2. Depression‐specific acupuncture versus non‐specific acupuncture (control group) ‐ all trials