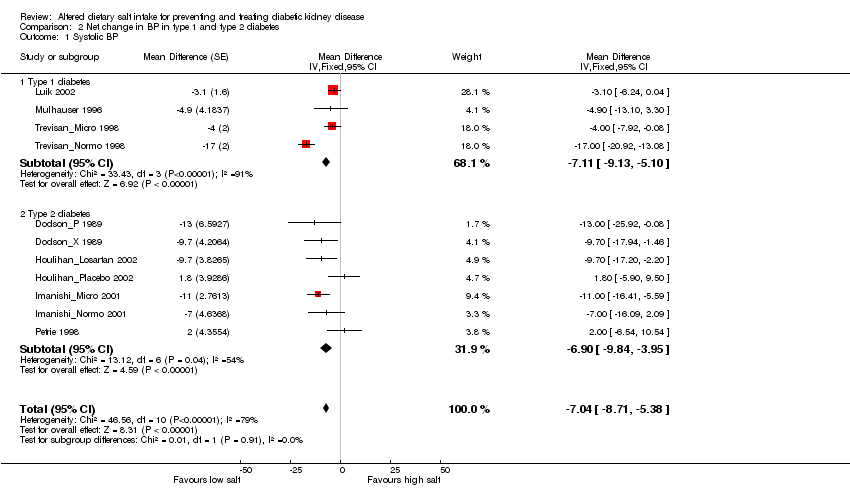
| 1 Systolic BP Show forest plot | 11 | | Mean Difference (Fixed, 95% CI) | ‐7.04 [‐8.71, ‐5.38] |
|
| 1.1 Long‐term studies | 5 | | Mean Difference (Fixed, 95% CI) | ‐6.20 [‐9.98, ‐2.43] |
| 1.2 Short‐term studies | 6 | | Mean Difference (Fixed, 95% CI) | ‐7.25 [‐9.10, ‐5.40] |
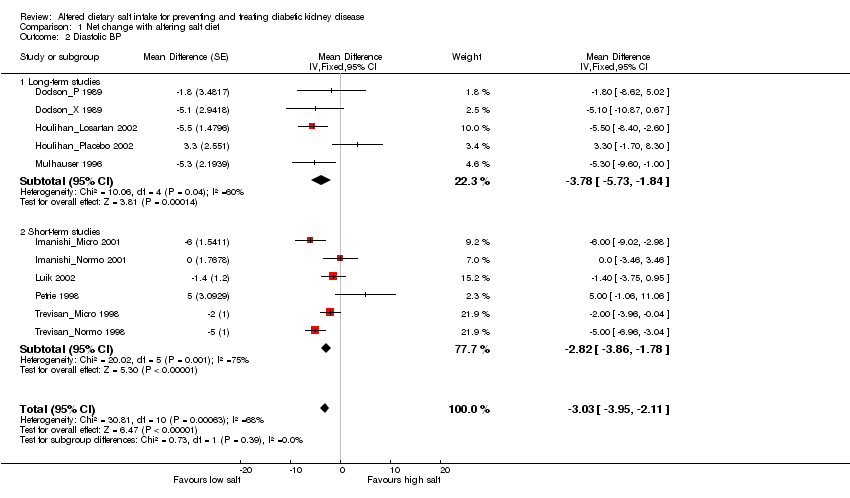
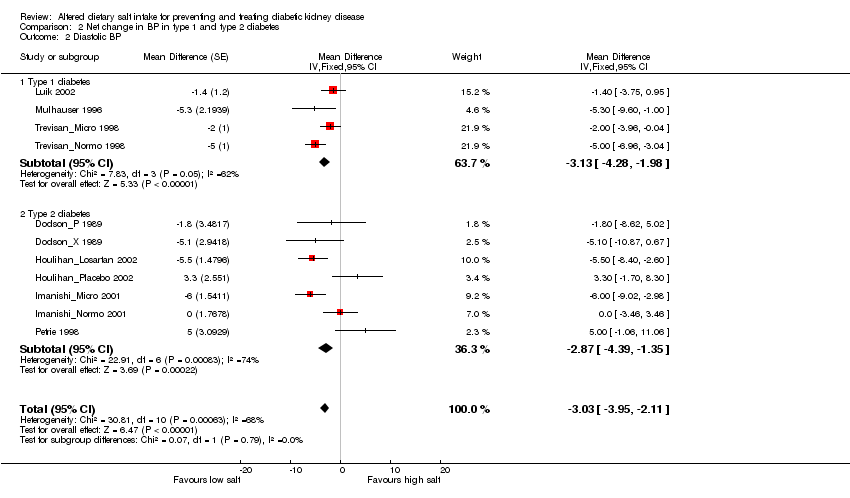
| 2 Diastolic BP Show forest plot | 11 | | Mean Difference (Fixed, 95% CI) | ‐3.03 [‐3.95, ‐2.11] |
|
| 2.1 Long‐term studies | 5 | | Mean Difference (Fixed, 95% CI) | ‐3.78 [‐5.73, ‐1.84] |
| 2.2 Short‐term studies | 6 | | Mean Difference (Fixed, 95% CI) | ‐2.82 [‐3.86, ‐1.78] |
| 3 Systolic BP (excluding Houlihan_Losartan 2002) Show forest plot | 10 | | Mean Difference (Fixed, 95% CI) | ‐6.91 [‐8.61, ‐5.20] |
|
| 3.1 Long‐term studies | 4 | | Mean Difference (Fixed, 95% CI) | ‐5.02 [‐9.38, ‐0.65] |
| 3.2 Short‐term studies | 6 | | Mean Difference (Fixed, 95% CI) | ‐7.25 [‐9.10, ‐5.40] |
| 4 Diastolic BP (excluding Houlihan_Losartan 2002) Show forest plot | 10 | | Mean Difference (Fixed, 95% CI) | ‐2.76 [‐3.73, ‐1.79] |
|
| 4.1 Long‐term studies | 4 | | Mean Difference (Fixed, 95% CI) | ‐2.38 [‐5.00, 0.24] |
| 4.2 Short‐term studies | 6 | | Mean Difference (Fixed, 95% CI) | ‐2.82 [‐3.86, ‐1.78] |
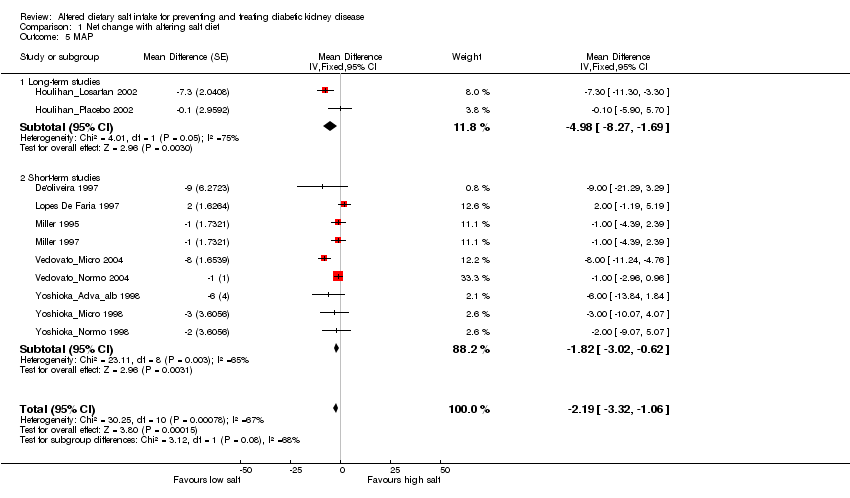
| 5 MAP Show forest plot | 11 | | Mean Difference (Fixed, 95% CI) | ‐2.19 [‐3.32, ‐1.06] |
|
| 5.1 Long‐term studies | 2 | | Mean Difference (Fixed, 95% CI) | ‐4.98 [‐8.27, ‐1.69] |
| 5.2 Short‐term studies | 9 | | Mean Difference (Fixed, 95% CI) | ‐1.82 [‐3.02, ‐0.62] |
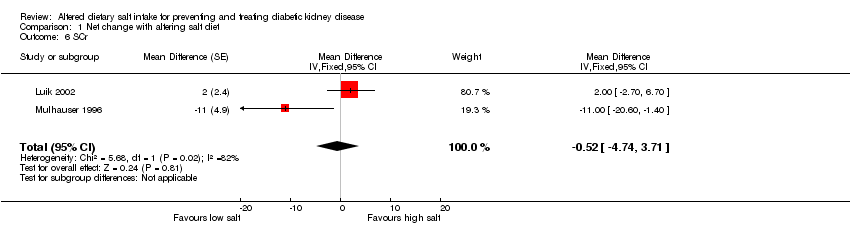
| 6 SCr Show forest plot | 2 | | Mean Difference (Fixed, 95% CI) | ‐0.52 [‐4.74, 3.71] |
|
| 7 CrCl Show forest plot | 5 | | Mean Difference (Fixed, 95% CI) | ‐6.33 [‐10.47, ‐2.19] |
|
| 8 GFR Show forest plot | 10 | | Mean Difference (Fixed, 95% CI) | ‐1.92 [‐4.49, 0.64] |
|
| 8.1 Long‐term studies | 3 | | Mean Difference (Fixed, 95% CI) | ‐2.41 [‐5.97, 1.14] |
| 8.2 Short‐term studies | 7 | | Mean Difference (Fixed, 95% CI) | ‐1.39 [‐5.10, 2.32] |
| 9 ERPF Show forest plot | 8 | | Mean Difference (Fixed, 95% CI) | ‐1.17 [‐3.25, 0.92] |
|
| 9.1 Long‐term studies | 3 | | Mean Difference (Fixed, 95% CI) | ‐0.73 [‐2.83, 1.37] |
| 9.2 Short‐term studies | 5 | | Mean Difference (Fixed, 95% CI) | ‐31.58 [‐49.14, ‐14.02] |
| 10 Proteinuria Show forest plot | 1 | | Mean Difference (Fixed, 95% CI) | Totals not selected |
|
| 11 HbA1c Show forest plot | 6 | | Mean Difference (Fixed, 95% CI) | ‐0.15 [‐0.31, 0.01] |
|
| 11.1 Long‐term studies | 4 | | Mean Difference (Fixed, 95% CI) | ‐0.05 [‐0.35, 0.25] |
| 11.2 Short‐term studies | 2 | | Mean Difference (Fixed, 95% CI) | ‐0.19 [‐0.38, ‐0.00] |
| 12 Weight Show forest plot | 11 | | Mean Difference (Fixed, 95% CI) | ‐1.01 [‐1.20, ‐0.82] |
|
| 12.1 Long‐term studies | 3 | | Mean Difference (Fixed, 95% CI) | ‐0.24 [‐1.57, 1.09] |
| 12.2 Short‐term studies | 8 | | Mean Difference (Fixed, 95% CI) | ‐1.03 [‐1.22, ‐0.83] |
| 13 BMI Show forest plot | 4 | | Mean Difference (Fixed, 95% CI) | ‐0.40 [‐0.53, ‐0.28] |
|