Ingesta de sal dietética modificada para la prevención y el tratamiento de la nefropatía diabética
References
Referencias de los estudios incluidos en esta revisión
Jump to:
Referencias de los estudios excluidos de esta revisión
Jump to:
Referencias adicionales
Jump to:
Characteristics of studies
Characteristics of included studies [ordered by study ID]
Jump to:
| Methods |
| |
| Participants | Inclusion criteria
Exclusion criteria
| |
| Interventions | Treatment group
Control group
Co‐interventions: No | |
| Outcomes |
| |
| Notes |
| |
| Risk of bias | ||
| Bias | Authors' judgement | Support for judgement |
| Allocation concealment? | Unclear risk | Not stated |
| Blinding? | Low risk | Yes |
| Blinding? | Low risk | Yes |
| Blinding? | Low risk | Yes |
| Blinding? | Low risk | Yes |
| Intention‐to‐treat analysis | High risk | ITT analysis not performed |
| Funding source | Low risk | NIH, Canadian Medical Research Fellowship Award, Northern Ireland Council for Postgraduate Education Award |
| Methods |
| |
| Participants | Inclusion criteria
Exclusion criteria
| |
| Interventions | Treatment group (parallel study)
Control group (parallel study)
Co‐interventions: none | |
| Outcomes |
| |
| Notes |
| |
| Risk of bias | ||
| Bias | Authors' judgement | Support for judgement |
| Allocation concealment? | Unclear risk | Not stated |
| Blinding? | Low risk | Yes |
| Blinding? | Low risk | Yes |
| Blinding? | Low risk | Yes |
| Blinding? | Unclear risk | Not stated |
| Intention‐to‐treat analysis | High risk | No |
| Funding source | High risk | Ciba provided slow sodium and placebo |
| Methods |
| |
| Participants | Inclusion criteria
Exclusion criteria
| |
| Interventions | Crossover study
| |
| Outcomes |
| |
| Notes |
| |
| Risk of bias | ||
| Bias | Authors' judgement | Support for judgement |
| Allocation concealment? | Unclear risk | Not stated |
| Blinding? | Low risk | Yes |
| Blinding? | Low risk | Yes |
| Blinding? | Low risk | Yes |
| Blinding? | Unclear risk | Not stated |
| Intention‐to‐treat analysis | High risk | No |
| Funding source | High risk | Ciba provided slow sodium and placebo |
| Methods |
| |
| Participants | Inclusion criteria
Exclusion criteria
| |
| Interventions | Treatment
Control
Co‐interventions
| |
| Outcomes |
| |
| Notes | Additional data requested from authors: UAE, no response from authors | |
| Risk of bias | ||
| Bias | Authors' judgement | Support for judgement |
| Allocation concealment? | Unclear risk | Not stated |
| Blinding? | High risk | Not blinded |
| Blinding? | Unclear risk | Not stated |
| Blinding? | Unclear risk | Not stated |
| Blinding? | Unclear risk | Not stated |
| Intention‐to‐treat analysis | Unclear risk | Not stated |
| Funding source | High risk | Merck and Apex Diabetes Australia Research Grant |
| Methods |
| |
| Participants | Inclusion criteria
Exclusion criteria
| |
| Interventions | Treatment
Control
| |
| Outcomes |
| |
| Notes | ||
| Risk of bias | ||
| Bias | Authors' judgement | Support for judgement |
| Allocation concealment? | Unclear risk | Not stated |
| Blinding? | Unclear risk | Not stated |
| Blinding? | Unclear risk | Not stated |
| Blinding? | Unclear risk | Not stated |
| Blinding? | Unclear risk | Not stated |
| Intention‐to‐treat analysis | High risk | No |
| Funding source | Unclear risk | Not stated |
| Methods |
| |
| Participants | Inclusion criteria
Exclusion criteria
| |
| Interventions | Treatment group
Control group
| |
| Outcomes |
| |
| Notes | ||
| Risk of bias | ||
| Bias | Authors' judgement | Support for judgement |
| Allocation concealment? | Unclear risk | Not stated |
| Blinding? | High risk | Not blinded |
| Blinding? | Unclear risk | Not stated |
| Blinding? | Unclear risk | Not stated |
| Blinding? | Unclear risk | Not stated |
| Intention‐to‐treat analysis | High risk | No ITT |
| Funding source | Unclear risk | None stated |
| Methods |
| |
| Participants | Inclusion criteria
| |
| Interventions | Treatment
Control
| |
| Outcomes |
| |
| Notes | ||
| Risk of bias | ||
| Bias | Authors' judgement | Support for judgement |
| Allocation concealment? | Unclear risk | Not stated |
| Blinding? | High risk | Not blinded |
| Blinding? | High risk | Not blinded |
| Blinding? | High risk | Not blinded |
| Blinding? | High risk | Not blinded |
| Intention‐to‐treat analysis | High risk | Not blinded |
| Funding source | Low risk | Work supported by grants from the Dutch Kidney Foundation and Diabetes Fonds Nederland (Diabetes Research fund) |
| Methods |
| |
| Participants | Inclusion criteria
| |
| Interventions | Treatment group
Control group
| |
| Outcomes |
| |
| Notes | ||
| Risk of bias | ||
| Bias | Authors' judgement | Support for judgement |
| Allocation concealment? | Unclear risk | Not stated |
| Blinding? | Low risk | Blinded |
| Blinding? | Low risk | Blinded |
| Blinding? | Low risk | Blinded |
| Blinding? | Low risk | Blinded |
| Intention‐to‐treat analysis | Unclear risk | Not stated |
| Funding source | Low risk | This work was supported by Grant 92‐27 from the physicians of Ontario through the Physicians Services Inc. Foundation |
| Methods |
| |
| Participants | Inclusion criteria
| |
| Interventions | Treatment group
Control group
| |
| Outcomes |
| |
| Notes | ||
| Risk of bias | ||
| Bias | Authors' judgement | Support for judgement |
| Allocation concealment? | Unclear risk | Not stated |
| Blinding? | Low risk | Blinded |
| Blinding? | Low risk | Blinded |
| Blinding? | Low risk | Blinded |
| Blinding? | Low risk | Blinded |
| Intention‐to‐treat analysis | Unclear risk | No ITT |
| Funding source | Low risk | This work was supported by Grant 92‐27 from the Physicians of Ontario through the Physicians’ Services Inc. Foundation |
| Methods |
| |
| Participants | Inclusion criteria
Exclusion criteria
| |
| Interventions | Treatment group
Control group
| |
| Outcomes |
| |
| Notes | ||
| Risk of bias | ||
| Bias | Authors' judgement | Support for judgement |
| Allocation concealment? | Unclear risk | Not stated |
| Blinding? | Low risk | Blinded |
| Blinding? | Low risk | Blinded |
| Blinding? | Low risk | Blinded |
| Blinding? | Low risk | Blinded |
| Intention‐to‐treat analysis | Unclear risk | No ITT |
| Funding source | High risk | The study has been supported by Cassella Riedel, Frankfurt, Germany, and by the E Klockner Stiftung, Duisburg, Germany. |
| Methods |
| |
| Participants | Inclusion criteria
| |
| Interventions | Treatment group
Control group
| |
| Outcomes |
| |
| Notes | ||
| Risk of bias | ||
| Bias | Authors' judgement | Support for judgement |
| Allocation concealment? | Low risk | Adequate |
| Blinding? | Low risk | Blinded |
| Blinding? | Low risk | Blinded |
| Blinding? | Low risk | Blinded |
| Blinding? | Low risk | Blinded |
| Intention‐to‐treat analysis | High risk | No ITT |
| Funding source | High risk | This work was supported by the British Diabetic Association. |
| Methods |
| |
| Participants | Inclusion criteria
Exclusion criteria:
| |
| Interventions | Treatment group
Control group
| |
| Outcomes |
| |
| Notes |
| |
| Risk of bias | ||
| Bias | Authors' judgement | Support for judgement |
| Allocation concealment? | Unclear risk | Not stated |
| Blinding? | High risk | Not blinded |
| Blinding? | Low risk | Blinded |
| Blinding? | Unclear risk | Not stated |
| Blinding? | Unclear risk | Not stated |
| Intention‐to‐treat analysis | Low risk | ITT performed |
| Funding source | High risk | This work was supported by Consiglio Nazionale delle Ricerche Grants 9603475CT04 and 9504361CT04. |
| Methods |
| |
| Participants | Inclusion criteria
Exclusion criteria:
| |
| Interventions | Treatment group
Control group
| |
| Outcomes |
| |
| Notes |
| |
| Risk of bias | ||
| Bias | Authors' judgement | Support for judgement |
| Allocation concealment? | Unclear risk | Not stated |
| Blinding? | Unclear risk | Not blinded |
| Blinding? | Unclear risk | Blinded |
| Blinding? | Unclear risk | Not stated |
| Blinding? | Unclear risk | Not stated |
| Intention‐to‐treat analysis | Unclear risk | ITT performed |
| Funding source | Unclear risk | This work was supported by Consiglio Nazionale delle Ricerche Grants 9603475CT04 and 9504361CT04. |
| Methods |
| |
| Participants | Inclusion criteria
Exclusion criteria
| |
| Interventions | Treatment group
Control group
| |
| Outcomes |
| |
| Notes | ||
| Risk of bias | ||
| Bias | Authors' judgement | Support for judgement |
| Allocation concealment? | Unclear risk | Not stated |
| Blinding? | Low risk | Blinded |
| Blinding? | Low risk | Blinded |
| Blinding? | Low risk | Blinded |
| Blinding? | Low risk | Blinded |
| Intention‐to‐treat analysis | Low risk | ITT performed |
| Funding source | Low risk | This study was supported by a research grant from the University of Padua, Italy |
| Methods |
| |
| Participants | Inclusion criteria
Exclusion criteria
| |
| Interventions | Treatment
Control
| |
| Outcomes |
| |
| Notes | ||
| Risk of bias | ||
| Bias | Authors' judgement | Support for judgement |
| Allocation concealment? | Low risk | Adequate |
| Blinding? | High risk | Not blinded |
| Blinding? | Low risk | Blinded |
| Blinding? | Low risk | Blinded |
| Blinding? | Low risk | Blinded |
| Intention‐to‐treat analysis | Unclear risk | Not stated |
| Funding source | Unclear risk | Not stated |
| Methods |
| |
| Participants | Inclusion criteria
Exclusion criteria
| |
| Interventions | Treatment
Control
| |
| Outcomes |
| |
| Notes | ||
| Risk of bias | ||
| Bias | Authors' judgement | Support for judgement |
| Allocation concealment? | Low risk | Adequate |
| Blinding? | High risk | Not blinded |
| Blinding? | Low risk | Blinded |
| Blinding? | Low risk | Blinded |
| Blinding? | Low risk | Blinded |
| Intention‐to‐treat analysis | Unclear risk | Not stated |
| Funding source | Unclear risk | Not stated |
ACEi ‐ angiotensin converting enzyme inhibitors; AER ‐ albumin excretion ratio; BMI ‐ body mass index; BP ‐ blood pressure; Cr ‐ creatinine; CrCl ‐ creatinine clearance; DBP ‐ diastolic blood pressure; DKD ‐ diabetic kidney disease; ERPF ‐ effective renal plasma flow; GFR ‐ glomerular filtration rate; HbA1c ‐ glycated haemoglobin; IDDM ‐ idiopathic diabetes mellitus; MAP ‐ mean arterial pressure; NSAID ‐ nonsteroidal anti‐inflammatory drugs; RPF ‐ renal plasma flow; SBP ‐ systolic blood pressure; SCr ‐ serum creatinine; UTI ‐ urinary tract infection
Characteristics of excluded studies [ordered by study ID]
Jump to:
| Study | Reason for exclusion |
| Appropriate data in diabetic patients within the study cohort unavailable | |
| Not RCT | |
| Study not salt reduction | |
| Study not in diabetic patients | |
| Study not in diabetic patients | |
| Study not in diabetic patients | |
| Not RCT | |
| Studies not in diabetic patients | |
| Study not in diabetic patients | |
| Study not in diabetic patients | |
| Multiple randomised interventions | |
| Study not in diabetic patients | |
| Study not in diabetic patients | |
| Studies not in diabetic patients | |
| Study not in diabetic patients | |
| Study not in diabetic patients | |
| Study not in diabetic patients | |
| Not RCT | |
| Study not in diabetic patients | |
| Not RCT | |
| Multiple randomised interventions | |
| Study not in diabetic patients | |
| Study not in diabetic patients | |
| Study not in diabetic patients | |
| Study not in diabetic patients | |
| Study not in diabetic patients | |
| Study not in diabetic patients | |
| Review article | |
| Study not in diabetic patients | |
| Study not in diabetic patients | |
| Appropriate data unavailable | |
| Study not in diabetic patients | |
| Study not in diabetic patients | |
| Not RCT | |
| Study not in diabetic patients | |
| Study not in diabetic patients | |
| Not RCT | |
| Multiple randomised interventions | |
| Study not in diabetic patients | |
| Not RCT | |
| Study not in diabetic patients | |
| Not RCT | |
| Study not in diabetic patients | |
| Study not in diabetic patients | |
| Study not in diabetic patients | |
| Study not in diabetic patients | |
| Study not in diabetic patients | |
| Not RCT | |
| Not RCT | |
| Study not in diabetic patients | |
| Review article | |
| Study not in diabetic patients | |
| Review article |
Data and analyses
| Outcome or subgroup title | No. of studies | No. of participants | Statistical method | Effect size |
| 1 Systolic BP Show forest plot | 11 | Mean Difference (Fixed, 95% CI) | ‐7.04 [‐8.71, ‐5.38] | |
| Analysis 1.1  Comparison 1 Net change with altering salt diet, Outcome 1 Systolic BP. | ||||
| 1.1 Long‐term studies | 5 | Mean Difference (Fixed, 95% CI) | ‐6.20 [‐9.98, ‐2.43] | |
| 1.2 Short‐term studies | 6 | Mean Difference (Fixed, 95% CI) | ‐7.25 [‐9.10, ‐5.40] | |
| 2 Diastolic BP Show forest plot | 11 | Mean Difference (Fixed, 95% CI) | ‐3.03 [‐3.95, ‐2.11] | |
| Analysis 1.2 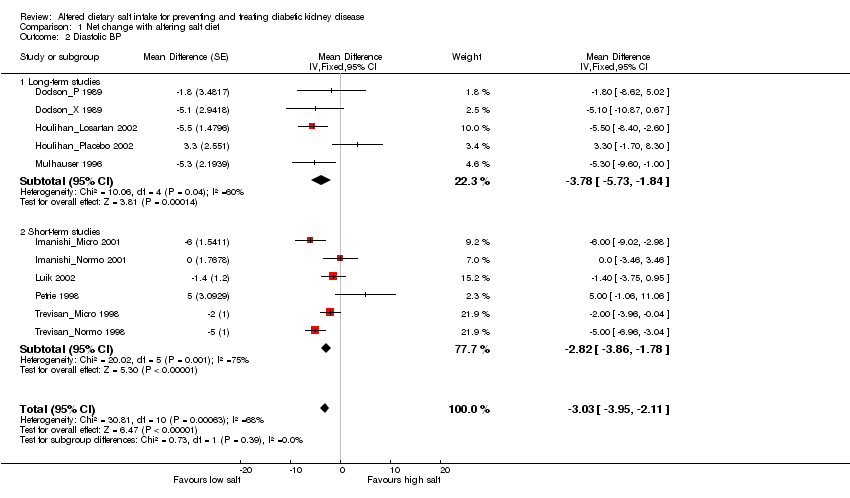 Comparison 1 Net change with altering salt diet, Outcome 2 Diastolic BP. | ||||
| 2.1 Long‐term studies | 5 | Mean Difference (Fixed, 95% CI) | ‐3.78 [‐5.73, ‐1.84] | |
| 2.2 Short‐term studies | 6 | Mean Difference (Fixed, 95% CI) | ‐2.82 [‐3.86, ‐1.78] | |
| 3 Systolic BP (excluding Houlihan_Losartan 2002) Show forest plot | 10 | Mean Difference (Fixed, 95% CI) | ‐6.91 [‐8.61, ‐5.20] | |
| Analysis 1.3  Comparison 1 Net change with altering salt diet, Outcome 3 Systolic BP (excluding Houlihan_Losartan 2002). | ||||
| 3.1 Long‐term studies | 4 | Mean Difference (Fixed, 95% CI) | ‐5.02 [‐9.38, ‐0.65] | |
| 3.2 Short‐term studies | 6 | Mean Difference (Fixed, 95% CI) | ‐7.25 [‐9.10, ‐5.40] | |
| 4 Diastolic BP (excluding Houlihan_Losartan 2002) Show forest plot | 10 | Mean Difference (Fixed, 95% CI) | ‐2.76 [‐3.73, ‐1.79] | |
| Analysis 1.4  Comparison 1 Net change with altering salt diet, Outcome 4 Diastolic BP (excluding Houlihan_Losartan 2002). | ||||
| 4.1 Long‐term studies | 4 | Mean Difference (Fixed, 95% CI) | ‐2.38 [‐5.00, 0.24] | |
| 4.2 Short‐term studies | 6 | Mean Difference (Fixed, 95% CI) | ‐2.82 [‐3.86, ‐1.78] | |
| 5 MAP Show forest plot | 11 | Mean Difference (Fixed, 95% CI) | ‐2.19 [‐3.32, ‐1.06] | |
| Analysis 1.5 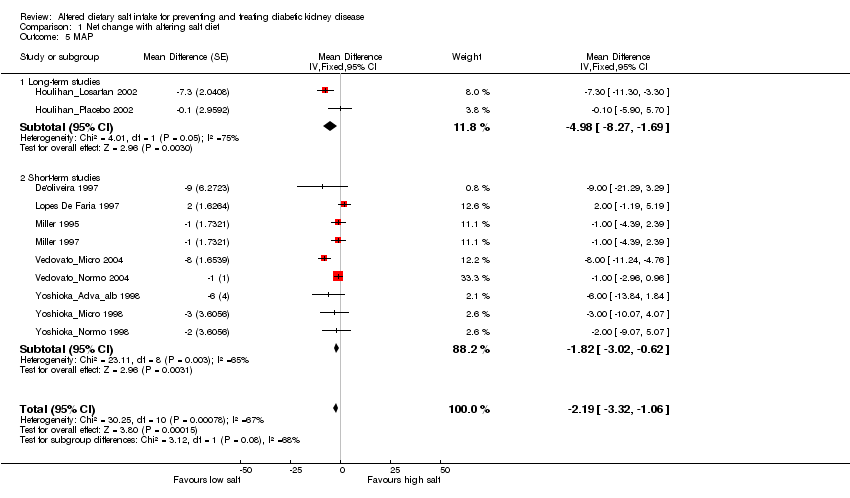 Comparison 1 Net change with altering salt diet, Outcome 5 MAP. | ||||
| 5.1 Long‐term studies | 2 | Mean Difference (Fixed, 95% CI) | ‐4.98 [‐8.27, ‐1.69] | |
| 5.2 Short‐term studies | 9 | Mean Difference (Fixed, 95% CI) | ‐1.82 [‐3.02, ‐0.62] | |
| 6 SCr Show forest plot | 2 | Mean Difference (Fixed, 95% CI) | ‐0.52 [‐4.74, 3.71] | |
| Analysis 1.6 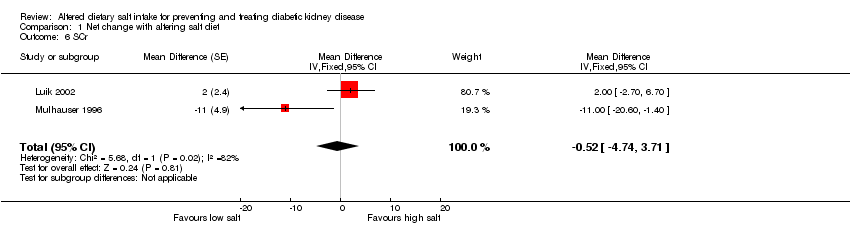 Comparison 1 Net change with altering salt diet, Outcome 6 SCr. | ||||
| 7 CrCl Show forest plot | 5 | Mean Difference (Fixed, 95% CI) | ‐6.33 [‐10.47, ‐2.19] | |
| Analysis 1.7  Comparison 1 Net change with altering salt diet, Outcome 7 CrCl. | ||||
| 8 GFR Show forest plot | 10 | Mean Difference (Fixed, 95% CI) | ‐1.92 [‐4.49, 0.64] | |
| Analysis 1.8  Comparison 1 Net change with altering salt diet, Outcome 8 GFR. | ||||
| 8.1 Long‐term studies | 3 | Mean Difference (Fixed, 95% CI) | ‐2.41 [‐5.97, 1.14] | |
| 8.2 Short‐term studies | 7 | Mean Difference (Fixed, 95% CI) | ‐1.39 [‐5.10, 2.32] | |
| 9 ERPF Show forest plot | 8 | Mean Difference (Fixed, 95% CI) | ‐1.17 [‐3.25, 0.92] | |
| Analysis 1.9  Comparison 1 Net change with altering salt diet, Outcome 9 ERPF. | ||||
| 9.1 Long‐term studies | 3 | Mean Difference (Fixed, 95% CI) | ‐0.73 [‐2.83, 1.37] | |
| 9.2 Short‐term studies | 5 | Mean Difference (Fixed, 95% CI) | ‐31.58 [‐49.14, ‐14.02] | |
| 10 Proteinuria Show forest plot | 1 | Mean Difference (Fixed, 95% CI) | Totals not selected | |
| Analysis 1.10  Comparison 1 Net change with altering salt diet, Outcome 10 Proteinuria. | ||||
| 11 HbA1c Show forest plot | 6 | Mean Difference (Fixed, 95% CI) | ‐0.15 [‐0.31, 0.01] | |
| Analysis 1.11  Comparison 1 Net change with altering salt diet, Outcome 11 HbA1c. | ||||
| 11.1 Long‐term studies | 4 | Mean Difference (Fixed, 95% CI) | ‐0.05 [‐0.35, 0.25] | |
| 11.2 Short‐term studies | 2 | Mean Difference (Fixed, 95% CI) | ‐0.19 [‐0.38, ‐0.00] | |
| 12 Weight Show forest plot | 11 | Mean Difference (Fixed, 95% CI) | ‐1.01 [‐1.20, ‐0.82] | |
| Analysis 1.12  Comparison 1 Net change with altering salt diet, Outcome 12 Weight. | ||||
| 12.1 Long‐term studies | 3 | Mean Difference (Fixed, 95% CI) | ‐0.24 [‐1.57, 1.09] | |
| 12.2 Short‐term studies | 8 | Mean Difference (Fixed, 95% CI) | ‐1.03 [‐1.22, ‐0.83] | |
| 13 BMI Show forest plot | 4 | Mean Difference (Fixed, 95% CI) | ‐0.40 [‐0.53, ‐0.28] | |
| Analysis 1.13  Comparison 1 Net change with altering salt diet, Outcome 13 BMI. | ||||
| Outcome or subgroup title | No. of studies | No. of participants | Statistical method | Effect size |
| 1 Systolic BP Show forest plot | 11 | Mean Difference (Fixed, 95% CI) | ‐7.04 [‐8.71, ‐5.38] | |
| Analysis 2.1 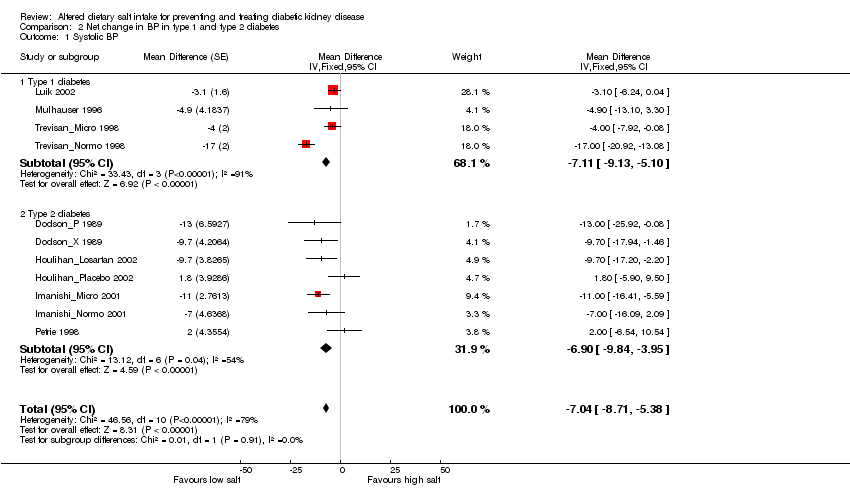 Comparison 2 Net change in BP in type 1 and type 2 diabetes, Outcome 1 Systolic BP. | ||||
| 1.1 Type 1 diabetes | 4 | Mean Difference (Fixed, 95% CI) | ‐7.11 [‐9.13, ‐5.10] | |
| 1.2 Type 2 diabetes | 7 | Mean Difference (Fixed, 95% CI) | ‐6.90 [‐9.84, ‐3.95] | |
| 2 Diastolic BP Show forest plot | 11 | Mean Difference (Fixed, 95% CI) | ‐3.03 [‐3.95, ‐2.11] | |
| Analysis 2.2 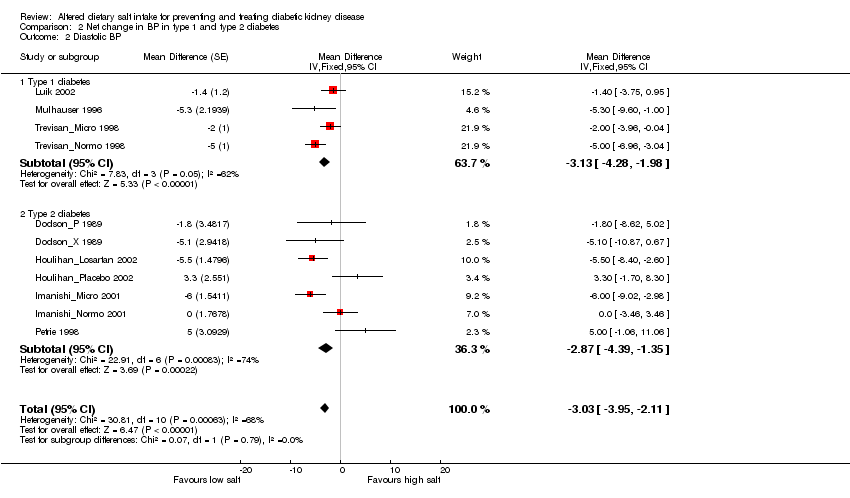 Comparison 2 Net change in BP in type 1 and type 2 diabetes, Outcome 2 Diastolic BP. | ||||
| 2.1 Type 1 diabetes | 4 | Mean Difference (Fixed, 95% CI) | ‐3.13 [‐4.28, ‐1.98] | |
| 2.2 Type 2 diabetes | 7 | Mean Difference (Fixed, 95% CI) | ‐2.87 [‐4.39, ‐1.35] | |
| 3 MAP Show forest plot | 11 | Mean Difference (Fixed, 95% CI) | ‐2.19 [‐3.32, ‐1.06] | |
| Analysis 2.3  Comparison 2 Net change in BP in type 1 and type 2 diabetes, Outcome 3 MAP. | ||||
| 3.1 Type 1 diabetes | 3 | Mean Difference (Fixed, 95% CI) | 0.09 [‐1.83, 2.00] | |
| 3.2 Type 2 diabetes | 8 | Mean Difference (Fixed, 95% CI) | ‐3.40 [‐4.80, ‐2.00] | |
| 4 HbA1c Show forest plot | 6 | Mean Difference (Fixed, 95% CI) | ‐0.15 [‐0.31, 0.01] | |
| Analysis 2.4  Comparison 2 Net change in BP in type 1 and type 2 diabetes, Outcome 4 HbA1c. | ||||
| 4.1 Type 1 diabetes | 3 | Mean Difference (Fixed, 95% CI) | ‐0.16 [‐0.32, 0.01] | |
| 4.2 Type 2 diabetes | 3 | Mean Difference (Fixed, 95% CI) | ‐0.12 [‐0.58, 0.34] | |
| Outcome or subgroup title | No. of studies | No. of participants | Statistical method | Effect size |
| 1 Systolic BP Show forest plot | 11 | Mean Difference (Fixed, 95% CI) | ‐7.04 [‐8.71, ‐5.38] | |
| Analysis 3.1  Comparison 3 Net change in BP in hypertensive and normotensive participants, Outcome 1 Systolic BP. | ||||
| 1.1 Hypertensive | 6 | Mean Difference (Fixed, 95% CI) | ‐4.86 [‐8.31, ‐1.41] | |
| 1.2 Normotensive | 5 | Mean Difference (Fixed, 95% CI) | ‐7.70 [‐9.60, ‐5.81] | |
| 2 Diastolic BP Show forest plot | 11 | Mean Difference (Fixed, 95% CI) | ‐3.03 [‐3.95, ‐2.11] | |
| Analysis 3.2  Comparison 3 Net change in BP in hypertensive and normotensive participants, Outcome 2 Diastolic BP. | ||||
| 2.1 Hypertensive | 6 | Mean Difference (Fixed, 95% CI) | ‐2.96 [‐4.81, ‐1.11] | |
| 2.2 Normotensive | 5 | Mean Difference (Fixed, 95% CI) | ‐3.06 [‐4.11, 0.00] | |
| 3 MAP Show forest plot | 11 | Mean Difference (Fixed, 95% CI) | ‐2.19 [‐3.32, ‐1.06] | |
| Analysis 3.3  Comparison 3 Net change in BP in hypertensive and normotensive participants, Outcome 3 MAP. | ||||
| 3.1 Hypertensive | 3 | Mean Difference (Fixed, 95% CI) | ‐5.25 [‐8.43, ‐2.07] | |
| 3.2 Normotensive | 8 | Mean Difference (Fixed, 95% CI) | ‐1.75 [‐2.96, ‐0.54] | |

Flow chart of study selection process
Comparison 1 Net change with altering salt diet, Outcome 1 Systolic BP.
Comparison 1 Net change with altering salt diet, Outcome 2 Diastolic BP.
Comparison 1 Net change with altering salt diet, Outcome 3 Systolic BP (excluding Houlihan_Losartan 2002).
Comparison 1 Net change with altering salt diet, Outcome 4 Diastolic BP (excluding Houlihan_Losartan 2002).
Comparison 1 Net change with altering salt diet, Outcome 5 MAP.
Comparison 1 Net change with altering salt diet, Outcome 6 SCr.
Comparison 1 Net change with altering salt diet, Outcome 7 CrCl.
Comparison 1 Net change with altering salt diet, Outcome 8 GFR.
Comparison 1 Net change with altering salt diet, Outcome 9 ERPF.
Comparison 1 Net change with altering salt diet, Outcome 10 Proteinuria.
Comparison 1 Net change with altering salt diet, Outcome 11 HbA1c.
Comparison 1 Net change with altering salt diet, Outcome 12 Weight.
Comparison 1 Net change with altering salt diet, Outcome 13 BMI.
Comparison 2 Net change in BP in type 1 and type 2 diabetes, Outcome 1 Systolic BP.
Comparison 2 Net change in BP in type 1 and type 2 diabetes, Outcome 2 Diastolic BP.
Comparison 2 Net change in BP in type 1 and type 2 diabetes, Outcome 3 MAP.
Comparison 2 Net change in BP in type 1 and type 2 diabetes, Outcome 4 HbA1c.
Comparison 3 Net change in BP in hypertensive and normotensive participants, Outcome 1 Systolic BP.
Comparison 3 Net change in BP in hypertensive and normotensive participants, Outcome 2 Diastolic BP.
Comparison 3 Net change in BP in hypertensive and normotensive participants, Outcome 3 MAP.
| Study | Number of participants | Age (years) | Males (%) | Diabetes | Study design | Blinding | Study duration (weeks) | Initial BP (SE) |
| 34 | 61 | 71/65 | Type 2 | P | SB | 12 | 180(18)/91(11) | |
| 9 | 62 | 67 | Type 2 | X | DB | 4 | 160(20)/88(11) | |
| 9 | 26 | 100 | Type 1 | X | SB | 1 | ‐‐ | |
| 14 | 31 | 75 | Type 1 | P | DB | 4 | ‐‐ | |
| 19 | 55 | 84 | Type 2 | P | NS | 1 | MAP 102(3) | |
| 10 | 30 | 70 | Type 1 | X | NS | 1 | MAP 91(9) | |
| 12 | 23 | 100 | Type 1 | X | SB | 1 | MAP 82(4) | |
| 9 | 57 | 89 | Type 2 | X | DB | 5 days | 148(25)/82(7) | |
| 9 | 42 | 67 | Type 1 | X | NS | 1 | 120/72 | |
| 7 | 38 | 86 | Type 1 | X | NS | 1 | 125/78 | |
| 8 | 60 | 58 | Type 2 | X | NS | 1 | 134(5)/78(1) | |
| 7 | 58 | 58 | Type 2 | X | NS | 1 | 133(6)/75(4) | |
| 4 | 51 | 58 | Type 2 | X | NS | 1 | 131(4)/75(4) | |
| 8 | 59 | 63 | Type 2 | X | SB | 1 | 132(11)/73(7) | |
| 8 | 61 | 50 | Type 2 | X | SB | 1 | 136(9)/82(6) | |
| 10 | 63 | 90 | Type 2 | X | SB | 2 | MAP 111(3) | |
| 10 | 61 | 100 | Type 2 | X | SB | 2 | MAP 114(3) | |
| 24 | 29 | 63 | Type 1 | X | NS | 1 | ‐‐ | |
| 21 | 60 | 75 | Type 2 | X | NS | 1 | 125(2)/79(2) | |
| 20 | 57 | 75 | Type 2 | X | NS | 1 | 130(2)/80(2) | |
| DB ‐ double‐blind; NS ‐ not stated; P ‐ parallel; X ‐ crossover; SB ‐ single blind; SE ‐ standard error | ||||||||
| Study | Urinary sodium (24h) | SCr | CrCl or GFR | RPF | Urinary albumin or protein (24h) | ACR | BP | HbA1c | BMI |
| X | X | X | |||||||
| X | X | X | |||||||
| X | X | ||||||||
| X | X | X | X | X | X | X | X | ||
| X | X | X | X | ||||||
| X | X | X | X | X | |||||
| X | X | X | X | ||||||
| X | X | ||||||||
| X | X | X | X | X | |||||
| Yoshioka_Adva_alb 1998; Yoshioka_Micro 1998; Yoshioka_Normo 1998 | X | X | X | ||||||
| X | X | X | X | ||||||
| X | X | X | X | X | X | X | |||
| X | X | X | X | X | X | X | X | X | |
| X | X | X | |||||||
| ACR ‐ albumin‐creatinine ratio; BMI ‐ body mass index; CrCl ‐ creatinine clearance; GFR ‐ glomerular filtration rate; HbA1c ‐ glycated haemoglobin; RPF ‐ renal plasma flow; SCr ‐ serum creatinine | |||||||||
| Study | Urine measurement | Change from high/normal salt to low salt | Significance |
| Reported as proteinuria | ‐412.6 mg/d (‐1035 to 210) | NS | |
| Reported as % change in geometric mean of albumin excretion (tolerance factor) | +38.5% (CI ‐31.7 to 108.8) | NS | |
| ‐43.5% (CI ‐77.5 to ‐9.6) | P = 0.02 | ||
| Reported as mg/24h of albumin | +1.4 mg/24 h | NS | |
| Reported as median of albumin (IQR) | 9 (6 to 12) µg/min to 8 (5 to 12) µg/min | NS | |
| 108 (84 to 178) µg/min to 80 (37 to 108) µg/min | P < 0.001 | ||
| IQR ‐ intraquartile range; NS ‐ not significant | |||
| Outcome or subgroup title | No. of studies | No. of participants | Statistical method | Effect size |
| 1 Systolic BP Show forest plot | 11 | Mean Difference (Fixed, 95% CI) | ‐7.04 [‐8.71, ‐5.38] | |
| 1.1 Long‐term studies | 5 | Mean Difference (Fixed, 95% CI) | ‐6.20 [‐9.98, ‐2.43] | |
| 1.2 Short‐term studies | 6 | Mean Difference (Fixed, 95% CI) | ‐7.25 [‐9.10, ‐5.40] | |
| 2 Diastolic BP Show forest plot | 11 | Mean Difference (Fixed, 95% CI) | ‐3.03 [‐3.95, ‐2.11] | |
| 2.1 Long‐term studies | 5 | Mean Difference (Fixed, 95% CI) | ‐3.78 [‐5.73, ‐1.84] | |
| 2.2 Short‐term studies | 6 | Mean Difference (Fixed, 95% CI) | ‐2.82 [‐3.86, ‐1.78] | |
| 3 Systolic BP (excluding Houlihan_Losartan 2002) Show forest plot | 10 | Mean Difference (Fixed, 95% CI) | ‐6.91 [‐8.61, ‐5.20] | |
| 3.1 Long‐term studies | 4 | Mean Difference (Fixed, 95% CI) | ‐5.02 [‐9.38, ‐0.65] | |
| 3.2 Short‐term studies | 6 | Mean Difference (Fixed, 95% CI) | ‐7.25 [‐9.10, ‐5.40] | |
| 4 Diastolic BP (excluding Houlihan_Losartan 2002) Show forest plot | 10 | Mean Difference (Fixed, 95% CI) | ‐2.76 [‐3.73, ‐1.79] | |
| 4.1 Long‐term studies | 4 | Mean Difference (Fixed, 95% CI) | ‐2.38 [‐5.00, 0.24] | |
| 4.2 Short‐term studies | 6 | Mean Difference (Fixed, 95% CI) | ‐2.82 [‐3.86, ‐1.78] | |
| 5 MAP Show forest plot | 11 | Mean Difference (Fixed, 95% CI) | ‐2.19 [‐3.32, ‐1.06] | |
| 5.1 Long‐term studies | 2 | Mean Difference (Fixed, 95% CI) | ‐4.98 [‐8.27, ‐1.69] | |
| 5.2 Short‐term studies | 9 | Mean Difference (Fixed, 95% CI) | ‐1.82 [‐3.02, ‐0.62] | |
| 6 SCr Show forest plot | 2 | Mean Difference (Fixed, 95% CI) | ‐0.52 [‐4.74, 3.71] | |
| 7 CrCl Show forest plot | 5 | Mean Difference (Fixed, 95% CI) | ‐6.33 [‐10.47, ‐2.19] | |
| 8 GFR Show forest plot | 10 | Mean Difference (Fixed, 95% CI) | ‐1.92 [‐4.49, 0.64] | |
| 8.1 Long‐term studies | 3 | Mean Difference (Fixed, 95% CI) | ‐2.41 [‐5.97, 1.14] | |
| 8.2 Short‐term studies | 7 | Mean Difference (Fixed, 95% CI) | ‐1.39 [‐5.10, 2.32] | |
| 9 ERPF Show forest plot | 8 | Mean Difference (Fixed, 95% CI) | ‐1.17 [‐3.25, 0.92] | |
| 9.1 Long‐term studies | 3 | Mean Difference (Fixed, 95% CI) | ‐0.73 [‐2.83, 1.37] | |
| 9.2 Short‐term studies | 5 | Mean Difference (Fixed, 95% CI) | ‐31.58 [‐49.14, ‐14.02] | |
| 10 Proteinuria Show forest plot | 1 | Mean Difference (Fixed, 95% CI) | Totals not selected | |
| 11 HbA1c Show forest plot | 6 | Mean Difference (Fixed, 95% CI) | ‐0.15 [‐0.31, 0.01] | |
| 11.1 Long‐term studies | 4 | Mean Difference (Fixed, 95% CI) | ‐0.05 [‐0.35, 0.25] | |
| 11.2 Short‐term studies | 2 | Mean Difference (Fixed, 95% CI) | ‐0.19 [‐0.38, ‐0.00] | |
| 12 Weight Show forest plot | 11 | Mean Difference (Fixed, 95% CI) | ‐1.01 [‐1.20, ‐0.82] | |
| 12.1 Long‐term studies | 3 | Mean Difference (Fixed, 95% CI) | ‐0.24 [‐1.57, 1.09] | |
| 12.2 Short‐term studies | 8 | Mean Difference (Fixed, 95% CI) | ‐1.03 [‐1.22, ‐0.83] | |
| 13 BMI Show forest plot | 4 | Mean Difference (Fixed, 95% CI) | ‐0.40 [‐0.53, ‐0.28] | |
| Outcome or subgroup title | No. of studies | No. of participants | Statistical method | Effect size |
| 1 Systolic BP Show forest plot | 11 | Mean Difference (Fixed, 95% CI) | ‐7.04 [‐8.71, ‐5.38] | |
| 1.1 Type 1 diabetes | 4 | Mean Difference (Fixed, 95% CI) | ‐7.11 [‐9.13, ‐5.10] | |
| 1.2 Type 2 diabetes | 7 | Mean Difference (Fixed, 95% CI) | ‐6.90 [‐9.84, ‐3.95] | |
| 2 Diastolic BP Show forest plot | 11 | Mean Difference (Fixed, 95% CI) | ‐3.03 [‐3.95, ‐2.11] | |
| 2.1 Type 1 diabetes | 4 | Mean Difference (Fixed, 95% CI) | ‐3.13 [‐4.28, ‐1.98] | |
| 2.2 Type 2 diabetes | 7 | Mean Difference (Fixed, 95% CI) | ‐2.87 [‐4.39, ‐1.35] | |
| 3 MAP Show forest plot | 11 | Mean Difference (Fixed, 95% CI) | ‐2.19 [‐3.32, ‐1.06] | |
| 3.1 Type 1 diabetes | 3 | Mean Difference (Fixed, 95% CI) | 0.09 [‐1.83, 2.00] | |
| 3.2 Type 2 diabetes | 8 | Mean Difference (Fixed, 95% CI) | ‐3.40 [‐4.80, ‐2.00] | |
| 4 HbA1c Show forest plot | 6 | Mean Difference (Fixed, 95% CI) | ‐0.15 [‐0.31, 0.01] | |
| 4.1 Type 1 diabetes | 3 | Mean Difference (Fixed, 95% CI) | ‐0.16 [‐0.32, 0.01] | |
| 4.2 Type 2 diabetes | 3 | Mean Difference (Fixed, 95% CI) | ‐0.12 [‐0.58, 0.34] | |
| Outcome or subgroup title | No. of studies | No. of participants | Statistical method | Effect size |
| 1 Systolic BP Show forest plot | 11 | Mean Difference (Fixed, 95% CI) | ‐7.04 [‐8.71, ‐5.38] | |
| 1.1 Hypertensive | 6 | Mean Difference (Fixed, 95% CI) | ‐4.86 [‐8.31, ‐1.41] | |
| 1.2 Normotensive | 5 | Mean Difference (Fixed, 95% CI) | ‐7.70 [‐9.60, ‐5.81] | |
| 2 Diastolic BP Show forest plot | 11 | Mean Difference (Fixed, 95% CI) | ‐3.03 [‐3.95, ‐2.11] | |
| 2.1 Hypertensive | 6 | Mean Difference (Fixed, 95% CI) | ‐2.96 [‐4.81, ‐1.11] | |
| 2.2 Normotensive | 5 | Mean Difference (Fixed, 95% CI) | ‐3.06 [‐4.11, 0.00] | |
| 3 MAP Show forest plot | 11 | Mean Difference (Fixed, 95% CI) | ‐2.19 [‐3.32, ‐1.06] | |
| 3.1 Hypertensive | 3 | Mean Difference (Fixed, 95% CI) | ‐5.25 [‐8.43, ‐2.07] | |
| 3.2 Normotensive | 8 | Mean Difference (Fixed, 95% CI) | ‐1.75 [‐2.96, ‐0.54] | |