Méthodes de prévention du sepsis bactérien et des complications des plaies après une greffe du foie
Résumé scientifique
Contexte
Le sepsis d'origine bactérienne et les complications des plaies après une greffe du foie augmentent la mortalité, la morbidité et la durée du séjour à l'hôpital, et sont susceptibles d'augmenter les coûts globaux de la greffe. Tous les patients subissant une greffe du foie reçoivent une prophylaxie antibiotique. Ceci est une mise à jour de notre revue systématique Cochrane de 2008 sur le même sujet dans laquelle nous avions identifié sept essais cliniques randomisés.
Objectifs
Évaluer les bénéfices et les inconvénients de différentes méthodes visant à prévenir le sepsis d'origine bactérienne et les complications des plaies chez les personnes subissant une greffe du foie.
Stratégie de recherche documentaire
Nous avons effectué des recherches dans le registre Cochrane des essais contrôlés (CENTRAL), MEDLINE, EMBASE et Science Citation Index Expanded jusqu'à février 2013.
Critères de sélection
Nous avons inclus uniquement les essais cliniques randomisés, indépendamment de la langue ou du statut de publication. Nous avons exclu les essais quasi randomisés et d'autres études observationnelles pour l'évaluation des bénéfices, mais pas pour les effets délétères.
Recueil et analyse des données
Deux auteurs de la revue ont recueilli les données de façon indépendante. Nous avons calculé le risque relatif (RR) ou la différence moyenne (DM) avec intervalles de confiance (IC) à 95 % à l'aide de modèles à effets fixes et à effets aléatoires, sur la base d'une analyse de cas disponibles.
Résultats principaux
Nous avons identifié seulement sept essais à inclure, portant sur 614 participants. Un seul essai était à faible risque de biais. Dans l'ensemble, la qualité des preuves était très faible. Il y avait cinq comparaisons dans les sept essais : décontamination intestinale sélective versus contrôle inactif ; décontamination intestinale sélective versus prébiotiques avec probiotiques ; décontamination intestinale sélective versus prébiotiques ; prébiotiques avec probiotiques versus prébiotiques ; et facteur de stimulation des colonies de granulocytes (G‐CSF) versus contrôle. Quatre essais comparaient la décontamination intestinale sélective à un placebo ou à l'absence de traitement. Dans un essai, les participants ont été randomisés pour la décontamination intestinale sélective, des lactobacilles actifs avec des fibres (probiotiques avec prébiotiques) ou des lactobacilles inactivés avec des fibres (prébiotiques). Dans un autre essai, les lactobacilles actifs avec des fibres (probiotiques avec prébiotiques) ont été comparés aux lactobacilles inactivés avec des fibres (prébiotiques). Dans le dernier essai, différentes doses de G‐CSF étaient comparées à un placebo. Il n'y avait aucun essai comparant différents schémas de prophylaxie antibiotique chez les personnes subissant une greffe du foie. La plupart des essais incluaient des adultes subissant une greffe hépatique élective. Il n'y avait aucune différence significative dans la proportion de personnes décédant ou nécessitant une nouvelle greffe entre les groupes d'intervention et témoins pour aucune des cinq groupes de comparaison.
Mortalité
Il n'y avait aucune différence entre 190 participants (trois essais) ; 5/87 (proportion ajustée : 6,2 %) dans le groupe de décontamination intestinale sélective contre 7/103 (6,8 %) dans le groupe de contrôle inactif ; RR 0,91 (IC à 95 % 0,31 à 2,72) ; 63 participants (un essai) ; 0/32 (0 %) dans le groupe de décontamination intestinale sélective contre 0/31 (0 %) dans le groupe de prébiotiques avec probiotiques ; RR ‐ non estimable ; 64 participants (un essai) ; 0/32 (0 %) dans le groupe de décontamination intestinale sélective contre 0/32 (0 %) dans le groupe de prébiotiques ; RR ‐ non estimable ; 129 participants (deux essais) ; 0/64 (0 %) dans le groupe de prébiotiques avec probiotiques contre 0/65 (0 %) dans le groupe de prébiotiques ; RR ‐ non estimable ; et 194 participants (un essai) ; 22/124 (17,7 %) dans le groupe de G‐CSF contre 10/70 (14,3 %) dans le groupe de placebo ; RR 1,24 (IC à 95 % 0,62 à 2,47).
Regreffe
Il n'y avait aucune différence entre 132 participants (deux essais) ; 4/58 (proportion ajustée : 6,9 %) dans le groupe de décontamination intestinale sélective contre 6/74 (8,1 %) dans le groupe de contrôle inactif ; RR 0,85 (IC à 95 % 0,26 à 2,85) ; 63 participants (un essai) ; 1/32 (3,1 %) dans le groupe de décontamination intestinale sélective contre 0/31 (0 %) dans le groupe de prébiotiques avec probiotiques ; RR 2,91 (0,12 à 68,81) ; 64 participants (un essai) ; 1/32 (3,1 %) dans le groupe de décontamination intestinale sélective contre 0/32 (0 %) dans le groupe de prébiotiques ; RR 3,00 (IC à 95 % 0,13 à 71,00) ; 129 participants (deux essais) ; 0/64 (0 %) dans le groupe de prébiotiques avec probiotiques contre 1/65 (1,5 %) dans le groupe de prébiotiques ; RR 0,33 (IC à 95 % 0,01 à 7,9) ; et 194 participants (un essai) ; 10/124 (7,1 %) dans le groupe de G‐CSF contre 5/70 (7,1 %) dans le groupe de placebo ; RR 1,13 (IC à 95 % 0,4 à 3,17).
Il n'y avait aucune différence significative dans le rejet de greffe, le séjour en unité de soins intensifs ou le séjour à l'hôpital entre les groupes d'intervention et témoins dans aucune des comparaisons. Dans l'ensemble, 193/611 participants (31,6 %) ont développé des complications infectieuses. La proportion de personnes ayant développé des complications infectieuses et le nombre d'épisodes de complications infectieuses ont été significativement plus élevés dans le groupe de décontamination intestinale sélective que dans le groupe de prébiotiques avec probiotiques (1 étude ; 63 participants ; 15/32 (46,9 %) dans le groupe de décontamination intestinale sélective contre 4/31 (12,9 %) dans le groupe de prébiotiques avec probiotiques ; RR 3,63 ; IC à 95 % 1,36 à 9,74 et 23/32 participants (0,72 complication infectieuse par participant) dans le groupe de décontamination intestinale sélective contre 4/31 participants (0,13 complication infectieuse par participant) dans le groupe de prébiotiques avec probiotiques ; rapport des taux 5,58 ; IC à 95 % 1,94 à 16,09). Il n'y avait aucune différence significative dans la proportion de participants ayant développé une infection et le nombre d'épisodes d'infection entre le groupe d'intervention et témoin dans aucune des autres comparaisons.
Aucun essai n'a rapporté la qualité de vie et les événements indésirables graves dans l'ensemble.
Conclusions des auteurs
Actuellement, il n'existe pas de preuves claires qu'une intervention apporte un avantage significatif dans la réduction des infections bactériennes et des complications des plaies dans la greffe du foie. La décontamination intestinale sélective peut même augmenter le taux d'infections par rapport aux prébiotiques avec probiotiques. Les intervalles de confiance étaient larges et d'autres essais cliniques randomisés à faible risque de biais sont nécessaires.
Résumé simplifié
Les interventions visant à prévenir les complications infectieuses bactériennes et les complications des plaies dans la greffe du foie
Contexte
Le foie est un organe important du corps qui a plusieurs fonctions, notamment la génération d'énergie à partir des aliments ;, la production de substances nécessaires pour la coagulation, la transformation et l'excrétion des médicaments et des déchets produits dans le sang, ainsi que la filtration des bactéries nocives qui entrent dans l'organisme à travers l'intestin. L'abus d'alcool et les infections virales peuvent entraîner des lésions au foie, généralement de manière insidieuse. Parfois, les lésions du foie peuvent être tellement graves que le foie n'est plus en mesure d'assurer ses fonctions normales, ce qui entraîne une insuffisance hépatique. La greffe du foie est efficace dans le traitement de l'insuffisance hépatique. Cependant, la greffe du foie est une procédure chirurgicale majeure et une proportion significative des patients développent des complications infectieuses et des complications des plaies en raison des médicaments administrés pour empêcher l'organisme receveur de déclencher une réponse de corps étranger au greffon de foie (régimes immunosuppresseurs). Plusieurs interventions ont été essayées pour prévenir les complications infectieuses bactériennes et les complications des plaies ; cependant, leur efficacité est inconnue. Nous avons effectué une revue détaillée de la littérature médicale (jusqu'à février 2013) pour déterminer les bénéfices et les inconvénients de différentes interventions visant à prévenir les complications infectieuses bactériennes et les complications des plaies dans la greffe du foie. Nous avons cherché des preuves issues d'essais cliniques randomisés uniquement. De tels essais, lorsqu'ils sont menés correctement, fournissent les meilleures données. Deux auteurs de la revue ont indépendamment identifié les essais et obtenu les informations des essais pour minimiser les erreurs.
Caractéristiques des études
Nous avons identifié sept essais à inclure, incluant 614 personnes. Quatre essais comparaient la décontamination intestinale sélective (utilisation prolongée d'antibiotiques pour éliminer les bactéries de l'intestin) par rapport à un placebo (intervention inactive) ou à l'absence de traitement. Dans un essai, les participants ont été aléatoirement assignés à la décontamination intestinale sélective, des lactobacilles actifs avec des fibres (probiotiques avec prébiotiques) ou des lactobacilles inactivés avec des fibres (prébiotiques). Dans un autre essai, les probiotiques avec les prébiotiques ont été comparés à des prébiotiques. Dans un dernier essai, différentes doses de facteur de stimulation des colonies de granulocytes (G‐CSF ; substance qui stimule la réponse immunitaire) ont été comparées à un placebo. La plupart des essais incluaient des adultes subissant une greffe du foie élective. Il y avait cinq comparaisons : décontamination intestinale sélective par rapport à un contrôle inactif ; décontamination intestinale sélective par rapport aux prébiotiques avec probiotiques ; décontamination intestinale sélective par rapport aux prébiotiques ; prébiotiques avec probiotiques par rapport aux prébiotiques ; et G‐CSF par rapport à un contrôle. Aucun essai ne comparait différents antibiotiques pour prévenir les complications infectieuses bactériennes et les complications des plaies chez les personnes subissant une greffe du foie.
Résultats principaux
Il n'y avait aucune différence significative dans la proportion de personnes décédant ou nécessitant une nouvelle greffe entre les groupes d'intervention et témoins pour aucune des cinq comparaisons. De même, il n'y avait pas de différence significative dans le rejet de greffe, le séjour en unité de soins intensifs ou le séjour à l'hôpital entre les groupes d'intervention et témoins dans aucune des comparaisons. Dans l'ensemble, 193/611 (31,6 %) participants ont développé des complications infectieuses. La proportion de personnes ayant développé des complications infectieuses et le nombre d'épisodes de complications infectieuses ont été significativement plus élevés dans le groupe de décontamination intestinale sélective que dans le groupe de prébiotiques avec probiotiques. Il n'y avait aucune différence significative dans la proportion de personnes ayant développé une infection et le nombre d'épisodes de complications infectieuses entre les groupes dans aucune des autres comparaisons. La qualité de vie et les événements indésirables graves dans les groupes n'étaient rapportés dans aucun des essais. Il n'existe aucune preuve claire que l'une de ces interventions puisse être bénéfique. La décontamination intestinale sélective peut même augmenter le risque d'infection par rapport aux prébiotiques avec probiotiques.
Qualité des preuves
La plupart des essais étaient à risque élevé d'erreurs systématiques (les conclusions pouvaient être erronées en raison de la manière dont l'essai était mené) et d'erreurs aléatoires (les conclusions pouvaient être erronées en raison de l'effet de hasard). La qualité globale des preuves est très faible.
Recherches futures
D'autres essais cliniques randomisés bien conçus sont nécessaires chez les personnes subissant une greffe du foie. De tels essais devraient inclure des critères de jugement orientés vers le patient, tels que la mortalité, l'échec de la greffe, la qualité de vie, la durée du séjour à l'hôpital et les événements indésirables graves liés au traitement.
Authors' conclusions
Summary of findings
| Mortality | |||||
| Patient or population: people undergoing liver transplantation. | |||||
| Comparisons | Illustrative comparative risks* (95% CI) | Relative effect | No. of participants | Quality of the evidence | |
| Assumed risk | Corresponding risk | ||||
| Control | Intervention | ||||
| Selective bowel decontamination versus inactive control | 68 per 1000 | 62 per 1000 | RR 0.91 | 190 | ⊕⊝⊝⊝ |
| Selective bowel decontamination versus prebiotics with probiotics | No mortality in either group | Not estimable | 63 | ⊕⊝⊝⊝ | |
| Selective bowel decontamination versus prebiotics | No mortality in either group | Not estimable | 64 | ⊕⊝⊝⊝ | |
| Prebiotics with probiotics versus prebiotics | No mortality in either group | Not estimable | 129 | ⊕⊝⊝⊝ | |
| Granulocyte‐colony stimulating factor (G‐CSF) versus placebo | 143 per 1000 | 177 per 1000 | RR 1.24 | 194 | ⊕⊝⊝⊝ |
| *The basis for the assumed risk is the control group risk across studies. The corresponding risk (and its 95% confidence interval) is based on the assumed risk in the comparison group and the relative effect of the intervention (and its 95% CI). | |||||
| GRADE Working Group grades of evidence | |||||
| 1 The trial(s) was (were) of high risk of bias. | |||||
| Retransplantation | |||||
| Patient or population: people undergoing liver transplantation. | |||||
| Comparisons | Illustrative comparative risks* (95% CI) | Relative effect | No. of participants | Quality of the evidence | |
| Assumed risk | Corresponding risk | ||||
| Control | Intervention | ||||
| Selective bowel decontamination versus inactive control | 81 per 1000 | 69 per 1000 | RR 0.85 | 132 | ⊕⊝⊝⊝ |
| Selective bowel decontamination versus prebiotics with probiotics | 15 per 1000* | 44 per 1000 | RR 2.91 | 63 | ⊕⊝⊝⊝ |
| Selective bowel decontamination versus prebiotics | 16 per 1000* | 48 per 1000 | RR 3.00 | 64 | ⊕⊝⊝⊝ |
| Prebiotics with probiotics versus prebiotics | 15 per 1000 | 5 per 1000 | RR 0.33 | 129 | ⊕⊝⊝⊝ |
| Granulocyte‐colony stimulating factor (G‐CSF) versus placebo | 71 per 1000 | 81 per 1000 | RR 1.13 | 194 | ⊕⊝⊝⊝ |
| *The basis for the assumed risk is the control group risk across studies except for the two comparisons indicated which did not have any retransplantation in the control group. The overall proportion of patients who required retransplantation in the comparison was used as the control group risk in these two comparisons. The corresponding risk (and its 95% confidence interval) is based on the assumed risk in the comparison group and the relative effect of the intervention (and its 95% CI). | |||||
| GRADE Working Group grades of evidence | |||||
| 1 The trial(s) was (were) of high risk of bias. | |||||
Background
Description of the condition
Around 700 liver transplantations are performed annually in the UK (NHS UK transplant). In the USA, the annual incidence of liver transplantation is 21 per one million population (OPTN/SRTR 2009). Liver transplant is performed mainly for end‐stage liver failure arising acutely (e.g., virus, drug overdose) or as a result of chronic liver disease (e.g., cirrhosis due to alcohol consumption, virus), or for tumours (Lim 2006).
The model for end‐stage liver disease (MELD) score (based on bilirubin, creatinine, and international normalised ratio (INR)) has been suggested as one of the methods of determining the severity of end‐stage liver failure (Kamath 2001), and is being used as a tool for allocation of donor livers to individual recipients in some countries (Shiffman 2006). A liver graft can be harvested from living donors (Bombuy 2004), or from deceased donors (Koneru 2005; Cescon 2006). Worldwide, there is a demand for liver transplants in surplus of organ supply. Split liver transplantation (using one deceased donor liver for two recipients, i.e., an adult and a paediatric recipient) has been suggested as a way to decrease the organ shortage for liver transplant (Corno 2006).
Between 33% and 68% of liver transplant recipients develop bacterial infections (Patel 1997). Immune dysfunction in people with cirrhosis may contribute to the increased infections after liver transplantation (Bonnel 2011). Bacterial sepsis and wound complications may result in mortality (Garbino 2005), and are common causes of significant morbidity, prolonged hospitalisation or hospital readmission, reoperation, and are likely to increase overall transplant costs (Mehrabi 2006). Gastrointestinal infections affect postoperative mortality and morbidity (Blair 2005).
Description of the intervention
Various methods have been attempted to decrease bacterial sepsis and wound complications. These include selective bowel decontamination, which involves reducing the aerobic gram‐negative bacterial and yeast populations of the gastrointestinal tract, without elimination of the anaerobic microbial flora (Hellinger 2002; Safdar 2004); prebiotics (fibres) (Rayes 2005); probiotics (living lactobacillus) to restore the physiological gastrointestinal flora (Rayes 2005); and different methods of wound closure (Diener 2010).
How the intervention might work
Selective bowel decontamination, prebiotics, and probiotics are aimed at decreasing the harmful bacteria thereby decreasing bacterial translocation (Rayes 2002; Rayes 2005). Different methods of wound closure are aimed at decreasing wound complications thereby improving the outcomes of liver transplantation.
Why it is important to do this review
This is an update of a previous Cochrane systematic review assessing the role of the different interventions in preventing bacterial sepsis and wound complications in liver transplantation (Gurusamy 2008). Since the role of antiviral and antifungal agents in liver transplantations are considered in different Cochrane reviews (Playford 2004; Hodson 2005; Strippoli 2006), we have excluded these interventions from this review. While sepsis and wound complications are some of the issues in the choice of the immunosuppressive agents after liver transplantation (Kato 2005), the main outcomes that affect the choice of the immunosuppressive agents are different (Haddad 2006), and hence we have excluded the comparisons of immunosuppressive agents with regards to the reduction in sepsis or wound complications from this review. We have also excluded the trials assessing the role of enteral nutrition and surgical interventions (such as method of suturing) in decreasing infections and incisional hernias as these interventions should be considered in separate reviews. By including all the other interventions aimed at preventing bacterial sepsis and wound complications in this review, we aim to provide a comprehensive review of the different methods aimed at preventing these complications in liver transplantation. Since immunosuppression and the transient anhepatic phase during liver transplantation may have a role in the incidence of sepsis and wound complications, we have considered only publications related to liver transplantation.
Objectives
To assess the benefits and harms of different methods aimed at preventing bacterial sepsis and wound complications in people undergoing liver transplantation.
Methods
Criteria for considering studies for this review
Types of studies
We considered all randomised clinical trials that compared any intervention aimed at preventing or reducing sepsis and wound complications in liver transplantation (irrespective of language, blinding, publication status, or sample size). We also included randomised trials that compared one intervention aimed at preventing sepsis or wound complications in liver transplantation versus another.
We excluded quasi‐randomised trials (i.e., the method of allocating participants to a treatment are not strictly random, e.g., date of birth, hospital record number, alternation) and non‐randomised comparative studies regarding assessment of benefit, but we considered them for inclusion regarding assessment of harms related to the treatment.
Types of participants
People who were about to undergo liver transplantation irrespective of age, deceased or living donor, indication for liver transplantation, first transplantation or retransplantation, and the immunosuppressive therapy used.
Types of interventions
We included any intervention aimed at preventing sepsis or wound complications (early or late). This includes selective bowel decontamination (using antibiotics), prebiotics, probiotics, as well as other interventions.
We excluded the following interventions.
-
Treatment for established septic or wound complications.
-
The role of different immunosuppressive therapies in reducing sepsis or wound complications.
-
The role of anti‐fungal agents or anti‐viral agents.
-
The role of nutrition.
-
The role of surgical interventions (such as method of suturing).
Types of outcome measures
Primary outcomes
-
Mortality (90‐day mortality and mortality at maximal follow‐up).
-
Retransplantation.
-
Quality of life during and after treatment.
-
Serious adverse events. These were defined as any events that would increase mortality; were life‐threatening; required hospitalisation; resulted in a persistent or significant disability; or any important medical event that might have jeopardised the patient or required intervention to prevent it (ICH‐GCP 1997).
Secondary outcomes
-
Infective complications (infected abdominal collections, liver and biliary tract infection, chest infection, urinary infection, wound infection, miscellaneous infections, bacteraemia, septicaemia, sepsis syndrome) as defined by authors.
-
Intensive therapy unit stay.
-
Total hospital stay.
Search methods for identification of studies
Electronic searches
We searched the Cochrane Central Register of Controlled Trials (CENTRAL) (Issue 1, 2013), MEDLINE, EMBASE, and Science Citation Index Expanded (Royle 2003) to February 2013. We have given the search strategies with the time spans for the searches in Appendix 1.
Searching other resources
We also searched the references of the identified trials to identify further relevant trials.
Data collection and analysis
Selection of studies
KG and MN independently identified the trials for inclusion (Characteristics of included studies). We have listed the excluded studies with the reasons for the exclusion (Characteristics of excluded studies).
Data extraction and management
KG and MN independently extracted the following data.
-
Year and language of publication.
-
Country.
-
Year of conduct of trial.
-
Inclusion and exclusion criteria.
-
Adult or paediatric.
-
Population characteristics such as recipient age, sex ratio, interval between transplantation and treatment.
-
Number undergoing retransplantation.
-
Immunosuppressive therapy.
-
Co‐interventions.
-
Duration of follow‐up.
-
Outcomes (mentioned in Primary outcomes; Secondary outcomes).
-
Risk of bias (described in Assessment of risk of bias in included studies).
We sought any unclear or missing information clarified by contacting the authors of the individual trials. If there was any doubt whether the trials shared the same participants ‐ completely or partially (by identifying common authors and centres) ‐ we intended to contact the authors of the trials to clarify whether the trial report had been duplicated. However, we had no such instances. It was clear from the multiple reports that they all reported on the same participants.
We resolved any differences in opinion through discussion and in case of unsettled disagreements, BRD adjudicated.
Assessment of risk of bias in included studies
KG and MN assessed the bias risk of the trials independently, without masking of the trial names. We followed the instructions given in the Cochrane Handbook for Systematic Reviews of Interventions (Higgins 2011), and the Cochrane Hepato‐Biliary Group Module (Gurusamy 2009; Gluud 2013). Due to the risk of biased overestimation of intervention effects in randomised trials with high risk of bias (Schulz 1995; Moher 1998; Kjaergard 2001; Wood 2008; Lundh 2012; Savović 2012; Savović 2012a), we assessed the following domains of risk of bias in the trials.
Allocation sequence generation
-
Low risk of bias: sequence generation was achieved using computer random number generation or a random number table. Drawing lots, tossing a coin, shuffling cards, and throwing dice were adequate if performed by an independent person not otherwise involved in the trial.
-
Uncertain risk of bias: the method of sequence generation was not specified.
-
High risk of bias: the sequence generation method was not random.
Allocation concealment
-
Low risk of bias: the participant allocations could not have been foreseen in advance of, or during, enrolment. Allocation was controlled by a central and independent randomisation unit. The allocation sequence was unknown to the investigators (e.g., if the allocation sequence was hidden in sequentially numbered, opaque, and sealed envelopes).
-
Uncertain risk of bias: the method used to conceal the allocation was not described so that intervention allocations may have been foreseen in advance of, or during, enrolment.
-
High risk of bias: the allocation sequence was likely to be known to the investigators who assigned the participants.
Blinding of participants, personnel, and outcome assessors
-
Low risk of bias: blinding was performed adequately, or the assessment of outcomes was not likely to be influenced by lack of blinding.
-
Uncertain risk of bias: there was insufficient information to assess whether blinding was likely to induce bias on the results.
-
High risk of bias: no blinding or incomplete blinding, and the assessment of outcomes were likely to be influenced by lack of blinding.
Incomplete outcome data
-
Low risk of bias: missing data were unlikely to make treatment effects depart from plausible values. Sufficient methods, such as multiple imputation, were employed to handle missing data.
-
Uncertain risk of bias: there was insufficient information to assess whether missing data in combination with the method used to handle missing data were likely to induce bias on the results.
-
High risk of bias: the results were likely to be biased due to missing data.
Selective outcome reporting
-
Low risk of bias: all outcomes were pre‐defined and reported, or all clinically relevant and reasonably expected outcomes were reported.
-
Uncertain risk of bias: it is unclear whether all pre‐defined and clinically relevant and reasonably expected outcomes were reported.
-
High risk of bias: one or more clinically relevant and reasonably expected outcomes were not reported, and data on these outcomes were likely to have been recorded.
For‐profit bias
-
Low risk of bias: the trial appeared to be free of industry sponsorship or other type of for‐profit support that may manipulate the trial design, conductance, or results of the trial.
-
Uncertain risk of bias: the trial may or may not be free of for‐profit bias as no information on clinical trial support or sponsorship was provided.
-
High risk of bias: the trial was sponsored by industry or received other type of for‐profit support.
We classified trials to be with low risk of bias if judged with low risk of bias in all domains. We classified the trials assessed with uncertain risk of bias or high risk of bias in any domain as trials with high risk of bias.
Measures of treatment effect
We performed the meta‐analyses according to the recommendations of The Cochrane Collaboration (Higgins 2011), and the Cochrane Hepato‐Biliary Group Module (Gluud 2013), using the software package Review Manager 5 (RevMan 2012). For dichotomous variables, we calculated the risk ratio (RR) with 95% confidence intervals (CI). For continuous variables, we calculated the mean difference (MD) with 95% CI. For count data outcomes such as infection episodes, we calculated the rate ratio (RaR) with 95% CI using the methods shown in Section 9.4.8 of the Cochrane Handbook for Systematic Reviews of Interventions (Higgins 2011). Such a calculation needs the time that the participants were exposed to the risk of infection in each of the groups. We considered that both groups were exposed to the risk of infection for the same time period, which is a reasonable assumption considering that the participants were followed up for the same time in both groups. For time‐to‐event outcomes, we planned to calculate the hazard ratio (HR) with 95% CI.
Unit of analysis issues
The units of analysis were the people undergoing liver transplantation.
Dealing with missing data
We performed the analysis on an intention‐to‐treat basis whenever possible (Newell 1992). Otherwise, we performed an available‐case analysis (Higgins 2011). In the absence of summary information, such as mean and standard deviation for continuous outcomes, we used the median for the meta‐analysis when the mean was not available and imputed the standard deviation from P values according to the instructions given in the Cochrane Handbook for Systematic Reviews of Intervention (Higgins 2011). If it was not possible to calculate the standard deviation from the P value or the CIs, we imputed the standard deviation as the highest standard deviation in the other trials included under that outcome, fully recognising that this form of imputation would decrease the weight of the study for calculation of MDs and bias the effect estimate to no effect in case of standardised mean difference (Higgins 2011). For time‐to‐event outcomes, we planned to calculate the natural logarithm of the HR and its standard error using methods suggested by Parmar et al. (Parmar 1998).
Assessment of heterogeneity
We explored heterogeneity using the Chi2 test with significance set at P value 0.10, and measured the quantity of heterogeneity using the I2 statistic (Higgins 2002). We also used overlapping of CIs on the forest plot to determine heterogeneity.
Assessment of reporting biases
We planned to use visual asymmetry on a funnel plot to explore reporting bias if 10 or more trials were identified (Egger 1997; Macaskill 2001). We also planned to perform linear regression approach described by Egger 1997 to determine the funnel plot asymmetry.
Data synthesis
We performed the meta‐analyses using the software package Review Manager 5 (RevMan 2012), and following the recommendations of The Cochrane Collaboration (Higgins 2011), and the Cochrane Hepato‐Biliary Group Module (Gluud 2013). We used both a random‐effects model (DerSimonian 1986), and a fixed‐effect model (DeMets 1987), meta‐analyses. In case of discrepancy between the two models resulting in change of conclusions, we have reported both results; otherwise, we have reported the results of the fixed‐effect model.
Trial sequential analysis
We used trial sequential analysis to control for random errors due to sparse data and repetitive testing of the accumulating data (CTU 2011; Thorlund 2011). We added the trials according to the year of publication, and, if more than one trial was published in a year, we added the trials in alphabetical order according to the last name of the first author. We constructed the trial sequential monitoring boundaries on the basis of the diversity‐adjusted required information size (DARIS) (Brok 2008; Wetterslev 2008; Brok 2009; Thorlund 2009; Wetterslev 2009; Thorlund 2010).
We calculated the diversity‐adjusted required sample size calculated from an alpha error of 0.05; a beta error of 0.20; a control group proportion obtained from the results; and a relative risk reduction of 20% for mortality, retransplantation, graft rejection requiring medical treatment, and proportion of participants with infective complications when there were at least two trials to determine whether more trials are necessary on this topic (if the trial sequential monitoring boundary and the required information size was reached or the futility zone was crossed, then more trials were unnecessary) and the observed diversity (Brok 2008; Wetterslev 2008; Brok 2009; Thorlund 2009;Wetterslev 2009; Thorlund 2010). For intensive therapy unit stay and length of hospital stay, we planned to calculate the required sample size from an alpha error of 0.05, a beta error of 0.20, the variance estimated from the meta‐analysis results of low risk of bias trials (if possible), and a minimal clinically relevant difference of one day. We did not plan to perform trial sequential analysis for quality of life and number of infectious episodes as it is not possible to perform trial sequential analysis for standardised mean difference or RaRs.
Subgroup analysis and investigation of heterogeneity
We planned to perform the following subgroup analysis.
-
Trials with low bias risk compared to trials with high bias risk.
-
Adult compared to paediatric liver transplantation.
-
Trials with additional antibiotic prophylaxis compared to trials without additional antibiotic prophylaxis.
-
Trials with immunosuppressive regimen compared to trials without steroid in the immunosuppressive regimen.
-
Trials with different immunosuppressive regimens compared to each other.
Sensitivity analysis
We planned to perform a sensitivity analysis excluding the trials in which mean or standard deviation, or both, were imputed from the analysis.
Results
Description of studies
We identified 10,594 references through electronic searches of CENTRAL (485 references), MEDLINE (5520 references), EMBASE (3210 references), and Science Citation Index Expanded (1379 references). We excluded 2268 duplicates and 8306 clearly irrelevant references through reading abstracts. We retrieved 20 references for further assessment. We did not identify any references through scanning reference lists of the identified randomised trials. We excluded eight references for the reasons listed in the Characteristics of excluded studies table. Twelve references of seven randomised trials involving 614 participants fulfilled the inclusion criteria and provided data for this systematic review (Bion 1994; Arnow 1996; Winston 1999; Hellinger 2002; Rayes 2002; Zwaveling 2002; Rayes 2005). The reference flow is shown in Figure 1. All the trials used steroids as a part of immunosuppressive therapy. Details about the trial design; sample size; patient characteristics; the inclusion and exclusion criteria used in the trials; intervention and control; the time at which the intervention was commenced and completed; outcomes measured in individual trials; and the risk of bias in the trials are shown in the Characteristics of included studies table.

Study flow diagram.
Five trials had two comparison groups and two trials had three comparison groups. Four trials compared selective bowel decontamination versus inactive control (placebo in two trials (Hellinger 2002; Zwaveling 2002) and no intervention in two trials (Bion 1994; Arnow 1996)). One trial compared selective bowel decontamination, active lactobacillus with fibres (probiotic with prebiotic), and inactivated lactobacillus with fibres (prebiotic) (Rayes 2002). One trial compared prebiotic with probiotic versus prebiotic (Rayes 2005). One trial compared different doses of granulocyte‐colony stimulating factor (G‐CSF) versus placebo (Winston 1999).
We found no trials assessing the benefits and harms of different antibiotic prophylactic regimens or wound closure techniques in the incidence of wound complications after liver transplantation.
Selective bowel decontamination versus inactive control
A total of 259 participants who underwent liver transplantation were randomised in four trials to selective bowel decontamination (n = 123) versus control (placebo, antifungal preparation, or no intervention) (n = 136) (Bion 1994; Arnow 1996; Hellinger 2002; Zwaveling 2002). The number of participants in each trial ranged from 52 to 80. The proportion of females varied between 35.0% and 80.8%. We were unable to obtain the mean age of participants in one trial (Arnow 1996). The mean age of participants in the remaining trials was between 43 and 53 years (Bion 1994; Hellinger 2002; Zwaveling 2002). Three trials included only adults (Bion 1994; Hellinger 2002; Zwaveling 2002). The fourth trial included adults and children (Arnow 1996). The time at which intervention was started varied from the time of randomisation to after transplantation was performed.
Selective bowel decontamination versus prebiotics with probiotics
A total of 95 participants were randomised in one trial to selective bowel decontamination (n = 32); prebiotics with probiotics (n = 31); and prebiotics (n = 32) (Rayes 2002). The proportion of females was 48.9% and the mean age was 49 years (Rayes 2002).
Prebiotics with probiotics versus prebiotics
A total of 66 participants were randomised in one trial to prebiotics with probiotics (n = 33) and prebiotics (n = 33) (Rayes 2005). The proportion of females was 48.5% and the mean age was 52 years (Rayes 2005). The characteristics of participants eligible for this comparison in another trial (31 participants to prebiotics with probiotics versus 32 participants to prebiotics) have been described under selective bowel decontamination versus prebiotics with probiotics (Rayes 2002).
Granulocyte‐colony stimulating factor versus placebo
A total of 194 participants were randomised in one trial to G‐CSF (300 micrograms, subcutaneously) (n = 61), G‐CSF (100 micrograms, subcutaneously) (n = 63), and placebo (subcutaneously) (n = 70) (Winston 1999). The proportion of females was 42.8% and the mean age was 50 years.
Risk of bias in included studies
The risk of bias in the trials is summarised in Figure 2 and Figure 3. Six trials had low risk of bias due to generation of allocation sequence (Bion 1994; Arnow 1996; Hellinger 2002; Rayes 2002; Zwaveling 2002; Rayes 2005). Five trials had low risk of bias due to allocation concealment (Arnow 1996; Hellinger 2002; Rayes 2002; Zwaveling 2002; Rayes 2005). Four trials had low risk of bias due to blinding of participants, healthcare providers, and outcome assessors (Winston 1999; Hellinger 2002; Zwaveling 2002; Rayes 2005). Only one trial was free from bias due to incomplete outcome data (Hellinger 2002). There were post‐randomisation drop‐outs in the remaining trials and these trials are considered to be at high risk of bias due to incomplete outcome data (Bion 1994; Arnow 1996; Winston 1999; Zwaveling 2002; Rayes 2002; Rayes 2005). Five trials reported mortality and retransplantation and were considered to be at low risk of bias due to selective outcome reporting (Bion 1994; Winston 1999; Hellinger 2002; Rayes 2002; Rayes 2005). Two trials were free from for‐profit bias (Hellinger 2002; Zwaveling 2002). Overall, only one trial was considered to be at low risk of bias (Hellinger 2002).
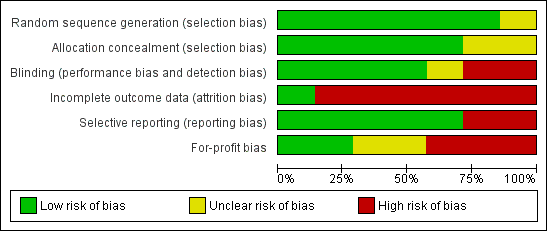
Risk of bias graph: review authors' judgements about each risk of bias item presented as percentages across all included studies.

Risk of bias summary: review authors' judgements about each risk of bias item for each included study.
Effects of interventions
See: Summary of findings for the main comparison Intervention compared to control for people undergoing liver transplantation (mortality); Summary of findings 2 Intervention compared to control for people undergoing liver transplantation (retransplantation)
Mortality
Mortality was reported in six trials (Bion 1994; Winston 1999; Hellinger 2002; Rayes 2002; Zwaveling 2002; Rayes 2005), and all five comparisons (Analysis 1.1). The results are summarised in summary of findings Table for the main comparison. There was no significant difference in the proportion of participants who died between the intervention and the control groups for any of the comparisons.
-
Selective bowel decontamination versus inactive control: RR 0.91; 95% CI 0.31 to 2.72.
-
Selective bowel decontamination versus prebiotics with probiotics: not estimable (no mortality in either group).
-
Selective bowel decontamination versus prebiotics: not estimable (no mortality in either group).
-
Prebiotics with probiotics versus prebiotics: not estimable (no mortality in either group).
-
G‐CSF versus control: RR 1.24; 95% CI 0.62 to 2.47.
The results did not change by using the random‐effects model for the comparisons with two or more trials or by calculating the risk difference. Trial sequential analysis was performed for selective bowel decontamination versus inactive control and prebiotics with probiotics versus prebiotics, the only comparisons with at least two trials. Since there was no mortality in either group in the comparison prebiotics with probiotics versus prebiotics, the mortality in the control group in the selective bowel decontamination versus inactive control comparison was used for the trial sequential analysis calculations. The proportion of participants recruited was less than 2% of the DARIS and so trial sequential boundaries were not drawn. The conventional boundaries were not crossed (Figure 4; Figure 5).

Trial sequential analysis of mortality (selective bowel decontamination versus inactive control)
The diversity‐adjusted required information size (DARIS) was calculated to 9753 participants, based on the proportion of participants in the control group with the outcome of 6.8%, a relative risk reduction of 20%, an alpha of 5%, a beta of 20%, and a diversity of 0%. To account for zero event groups, a continuity correction of 0.01 was used in the calculation of the cumulative Z‐curve (blue line). After accruing 190 participants in three trials, only 1.95% of the DARIS has been reached. Accordingly, the trial sequential analysis does not show the required information size and the trial sequential monitoring boundaries. As shown, the conventional boundaries (dotted red line) have also not been crossed by the cumulative Z‐curve.

Trial sequential analysis of mortality (prebiotics with probiotics versus prebiotics)
The diversity‐adjusted required information size (DARIS) was calculated to 9753 participants, based on the proportion of participants in the control group with the outcome of 6.8%, a relative risk reduction of 20%, an alpha of 5%, a beta of 20%, and a diversity of 0%. To account for zero event groups, a continuity correction of 0.01 was used in the calculation of the cumulative Z‐curve (blue line). After accruing 129 participants in two trials, only 1.32% of the DARIS has been reached. Accordingly, the trial sequential analysis does not show the required information size and the trial sequential monitoring boundaries. As shown, the conventional boundaries (dotted red line) have also not been crossed by the cumulative Z‐curve.
Retransplantation
Retransplantation was reported in five trials (Bion 1994; Winston 1999; Hellinger 2002; Rayes 2002; Rayes 2005), and all five comparisons (Analysis 1.2). The results are summarised in summary of findings Table 2. There was no significant difference in the proportion of participants who required retransplantation between the intervention and control groups for any of the comparisons.
-
Selective bowel decontamination versus inactive control: RR 0.85; 95% CI 0.26 to 2.85.
-
Selective bowel decontamination versus prebiotics with probiotics: RR 2.91; 95% CI 0.12 to 68.81.
-
Selective bowel decontamination versus prebiotics: RR 3.00; 95% CI 0.13 to 71.00.
-
Prebiotics with probiotics versus prebiotics: RR 0.33; 95% CI 0.01 to 7.90.
-
G‐CSF versus placebo: RR 1.13; 95% CI 0.40 to 3.17.
The results did not change by using the random‐effects model for the comparisons with two or more trials or by calculating the risk difference. Trial sequential analysis was performed for selective bowel decontamination versus inactive control and prebiotics with probiotics versus prebiotics, the only two comparisons with at least two trials. The proportion of participants recruited was less than 2% of the DARIS and so the trial sequential boundaries were not drawn. The conventional boundaries were not crossed (Figure 6; Figure 7).

Trial sequential analysis of retransplantation (selective bowel decontamination versus inactive control)
The diversity‐adjusted required information size (DARIS) was calculated to 8086 participants, based on the proportion of participants in the control group with the outcome of 8.1%, a relative risk reduction of 20%, an alpha of 5%, a beta of 20%, and a diversity of 0%. To account for zero event groups, a continuity correction of 0.01 was used in the calculation of the cumulative Z‐curve (blue line). After accruing 132 participants in two trials, only 1.63% of the DARIS has been reached. Accordingly, the trial sequential analysis does not show the required information size and the trial sequential monitoring boundaries. As shown, the conventional boundaries (dotted red line) have also not been crossed by the cumulative Z‐curve.

Trial sequential analysis of mortality (prebiotics with probiotics versus prebiotics)
The diversity‐adjusted required information size (DARIS) was calculated to 46,458 participants, based on the proportion of participants in the control group with the outcome of 1.5%, a relative risk reduction of 20%, an alpha of 5%, a beta of 20%, and a diversity of 0%. To account for zero event groups, a continuity correction of 0.01 was used in the calculation of the cumulative Z‐curve (blue line). After accruing 129 participants in two trials, only 0.28% of the DARIS has been reached. Accordingly, the trial sequential analysis does not show the required information size and the trial sequential monitoring boundaries. As shown, the conventional boundaries (dotted red line) have also not been crossed by the cumulative Z‐curve.
Quality of life
Quality of life was not reported in any of the trials.
Serious adverse events
The serious adverse events were not reported in sufficient details to calculate the proportion of patients who developed serious adverse events or the number of serious adverse events in the intervention and control groups.
Graft rejection
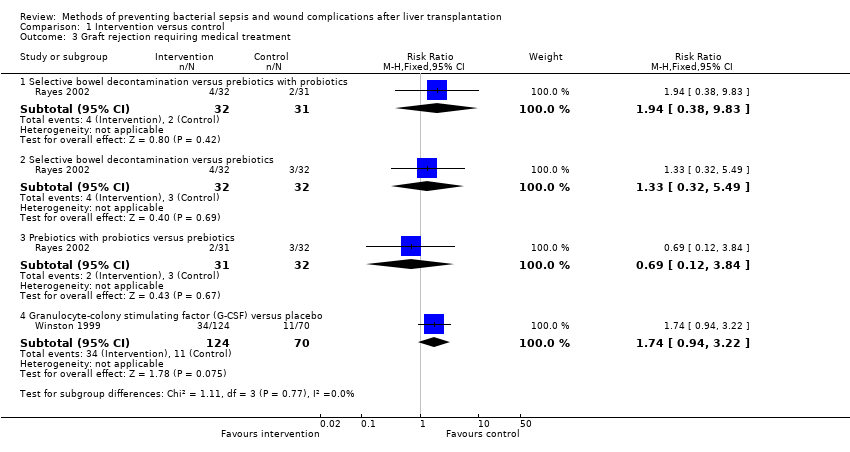
Graft rejection requiring medical treatment was reported in two trials (Winston 1999; Rayes 2002), and four comparisons (Analysis 1.3). There was no significant difference in the proportion of participants who developed graft rejection requiring medical treatment between the intervention and control groups for any of the comparisons.
-
Selective bowel decontamination versus prebiotics with probiotics: RR 1.94; 95% CI 0.38 to 9.83.
-
Selective bowel decontamination versus prebiotics: RR 1.33; 95% CI 0.32 to 5.49.
-
Prebiotics with probiotics versus prebiotics: RR 0.69; 95% CI 0.12 to 3.84.
-
G‐CSF versus placebo: RR 1.74; 95% CI 0.94 to 3.22.
The results did not change by using the random‐effects model or by calculating the risk difference. Trial sequential analysis was not performed since none of the comparisons had more than one trial.
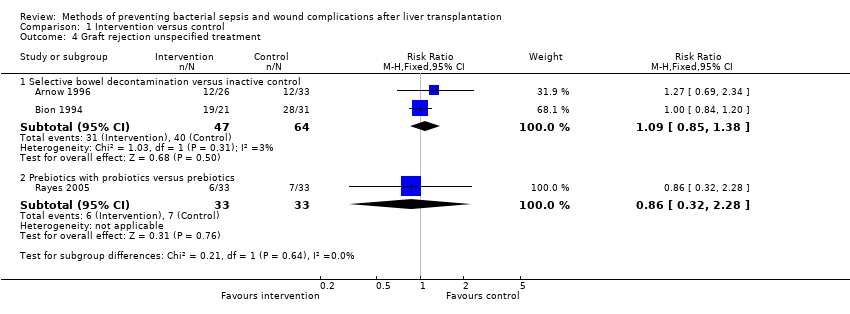
Graft rejection was reported in three trials without specifying the treatment (Bion 1994; Arnow 1996; Rayes 2005). This could be included in two comparisons (Analysis 1.4). There was no significant difference in the proportion of participants who developed graft rejection for which no treatment was specified between the intervention and control groups.
-
Selective bowel decontamination versus inactive control: RR 1.09; 95% CI 0.85 to 1.38.
-
Prebiotics with probiotics versus prebiotics: RR 0.86; 95% CI 0.32 to 2.28.
The results did not change by using the random‐effects model for the comparisons with two or more trials or by calculating the risk difference.
Infective complications
The proportion of participants who developed infective complications were reported in all the trials and all the five comparisons (Analysis 1.5). There was no significant difference in the proportion of participants who developed infective complications between the intervention and control groups for any of the comparisons except selective bowel decontamination versus prebiotics with probiotics. The proportion of participants who developed infective complications was significantly higher in the selective bowel decontamination group than the prebiotics with probiotics group.
-
Selective bowel decontamination versus inactive control: RR 0.94; 95% CI 0.63 to 1.41.
-
Selective bowel decontamination versus prebiotics with probiotics: RR 3.63; 95% CI 1.36 to 9.74.
-
Selective bowel decontamination versus prebiotics: RR 1.36; 95% CI 0.75 to 2.50.
-
Prebiotics with probiotics versus prebiotics: RR 0.18; 95% CI 0.03 to 1.17.
-
G‐CSF versus control: RR 1.03; 95% CI 0.55 to 1.96.
The results did not change by using the random‐effects model for the comparisons with two or more trials or by calculating the risk difference. The trial sequential analysis was performed for selective bowel decontamination versus inactive control and prebiotic with probiotics versus prebiotics, the only two comparisons with at least two trials.
Trial sequential analysis of selective bowel decontamination versus inactive control revealed that neither the trial sequential boundaries nor the conventional boundaries were crossed by the cumulative Z‐line (Figure 8). Trial sequential analysis of prebiotics with probiotics versus prebiotics revealed that the proportion of participants recruited was less than 2% of the DARIS and so the trial sequential boundaries were not drawn. The conventional boundaries were not crossed (Figure 9).

Trial sequential analysis of infection (selective bowel decontamination versus inactive control)
The diversity‐adjusted required information size (DARIS) was calculated to 2639 participants, based on the proportion of participants in the control group with the outcome of 44.9%, a relative risk reduction of 20%, an alpha of 5%, a beta of 20%, and a diversity of 0%. After accruing 256 participants in four trials, only 9.7% of the DARIS has been reached. Accordingly, the trial sequential analysis does not show the futility area. The cumulative Z‐curve (blue line) does not cross the trial sequential monitoring boundaries (continuous red line) or the conventional boundaries (dotted red line).

Trial sequential analysis of infection (prebiotics with probiotics versus prebiotics)
The diversity‐adjusted required information size (DARIS) was calculated to 3745 participants, based on the proportion of participants in the control group with the outcome of 41.5%, a relative risk reduction of 20%, an alpha of 5%, a beta of 20%, and a diversity of 71.51%. After accruing 129 participants in two trials, only 3.44% of the DARIS has been reached. Accordingly, the trial sequential analysis does not show the required information size and the trial sequential monitoring boundaries. As shown, the conventional boundaries (dotted red line) have not been crossed by the cumulative Z‐curve (blue line) after two trials although the conventional boundary was crossed favouring probiotics with prebiotics after the first trial.
The number of infection episodes were reported in three trials (Bion 1994; Winston 1999; Rayes 2002), and four comparisons (Analysis 1.6). There was no significant difference in the number of infection episodes between the intervention and control groups for any of the comparisons except selective bowel decontamination versus prebiotics with probiotics. The number of infection episodes was significantly higher in the selective bowel decontamination group than prebiotics with probiotics group.
-
Selective bowel decontamination versus inactive control: RaR 0.49; 95% CI 0.18 to 1.36.
-
Selective bowel decontamination versus prebiotics with probiotics: RaR 5.58; 95% CI 1.94 to 16.09.
-
Selective bowel decontamination versus prebiotics: RaR 1.35; 95% CI 0.72 to 2.53.
-
Prebiotics with probiotics versus prebiotics: RaR 0.81; 95% CI 0.49 to 1.35.
The issue of fixed‐effect versus random‐effects model did not arise because of the presence of only one trial for each comparison.
Intensive therapy unit stay
The intensive therapy unit stay was reported in four trials (Winston 1999; Rayes 2002; Zwaveling 2002; Rayes 2005), and in all five comparisons (Analysis 1.7). There was no significant difference in the Intensive therapy unit stay between the intervention and control groups for any of the comparisons.
-
Selective bowel decontamination versus inactive control: MD 2.00 days; 95% CI ‐34.00 to 38.00.
-
Selective bowel decontamination versus prebiotics with probiotics: MD 4.00 days; 95% CI ‐23.45 to 31.45.
-
Selective bowel decontamination versus prebiotics: MD 2.20 days; 95% CI ‐31.12 to 35.52.
-
Prebiotics with probiotics versus prebiotics: MD ‐1.41 days; 95% CI ‐5.30 to 2.49.
-
G‐CSF versus control: MD 0.00 days; 95% CI ‐19.92 to 19.92.
There was no change in results by using the random‐effects model for the comparisons with two or more trials. The standard deviation was imputed from the standard error in two trials (Rayes 2002; Rayes 2005). In the remaining two trials, there were no details to calculate the standard deviation and the highest standard deviation in the comparisons was used (Winston 1999; Zwaveling 2002). Therefore, we did not perform a sensitivity analysis excluding the trials in which standard deviation was imputed. Trial sequential analysis was performed only for the comparison between prebiotics with probiotics versus probiotics since this was the only comparison with more than two trials. The proportion of participants recruited was less than 2% of the DARIS and so the trial sequential boundaries were not drawn. The conventional boundaries were not crossed (Figure 10).

Trial sequential analysis of intensive therapy unit stay (prebiotics with probiotics versus prebiotics)
The diversity‐adjusted required information size (DARIS) was 8005 participants based on a minimal relevant difference (MIRD) of 1 day, a variance (VAR) of 254.96, an alpha (a) of 5%, a beta (b) of 20%, and a diversity (D2) of 0%. After accruing 129 participants in two trials, only 1.61% of the DARIS has been reached. Accordingly, the trial sequential analysis does not show the required information size and the trial sequential monitoring boundaries. As shown, the conventional boundaries (dotted red line) have not been crossed by the cumulative Z‐curve (blue line).
Hospital stay
The hospital stay was reported in four trials (Bion 1994; Winston 1999; Rayes 2002; Rayes 2005), and in all five comparisons (Analysis 1.8). There was no significant difference in the hospital stay between the intervention and control groups for any of the comparisons.
-
Selective bowel decontamination versus inactive control: MD 0.60 days; 95% CI ‐7.71 to 8.91.
-
Selective bowel decontamination versus prebiotics with probiotics: MD 4.00 days; 95% CI ‐0.82 to 8.82.
-
Selective bowel decontamination versus prebiotics: MD 3.00 days; 95% CI ‐2.39 to 8.39.
-
Prebiotics with probiotics versus prebiotics: MD ‐0.49 days; 95% CI ‐5.19 to 4.20.
-
G‐CSF versus control: MD 0.00 days; 95% CI ‐5.13 to 5.13.
There was no change in results by using the random‐effects model for the comparisons with two or more trials. The standard deviation was imputed from the standard error in two trials (Rayes 2002; Rayes 2005). In one of the remaining two trials, there were no details to calculate the standard deviation and the highest standard deviation in the comparisons was used (Winston 1999). Therefore, we did not perform a sensitivity analysis excluding the trials in which standard deviation was imputed. Trial sequential analysis was performed only for the comparison between prebiotics with probiotics versus probiotics since this was the only comparison with more than two trials. The proportion of participants recruited was less than 2% of the DARIS and so the trial sequential boundaries were not drawn. The conventional boundaries were not crossed (Figure 11).

Trial sequential analysis of hospital stay (prebiotics with probiotics versus prebiotics)
The diversity‐adjusted required information size (DARIS) was 11,621 participants based on a minimal relevant difference (MIRD) of 1 day, a variance (VAR) of 370.14, an alpha (a) of 5%, a beta (b) of 20%, and a diversity (D2) of 0%. After accruing 129 participants in two trials, only 1.11% of the DARIS has been reached. Accordingly, the trial sequential analysis does not show the required information size and the trial sequential monitoring boundaries. As shown, the conventional boundaries (dotted red line) have not been crossed by the cumulative Z‐curve (blue line).
Subgroup analysis
We did not perform any of the subgroup analyses because only one of the trials was of low risk of bias (Hellinger 2002), and too few trials were included under each outcome for the other subgroups.
Reporting bias
We did not explore reporting bias with a funnel plot because of the presence of fewer than 10 trials for each comparison.
'Summary of findings' tables
We have provided the 'Summary of findings' tables for mortality and retransplantation using GRADEpro (ims.cochrane.org/revman/other‐resources/gradepro). Because of the high number of outcomes and the high number of comparisons, we have not presented the other outcomes in 'Summary of findings' tables.
Discussion
Summary of main results
This systematic review revealed that there is no clear evidence supporting any of the evaluated interventions and that selective bowel decontamination may increase infections compared with a combination of prebiotics with probiotics.
Previous systematic reviews assessing the role of selective bowel decontamination in critical care found a benefit of selective bowel decontamination in decreasing chest infection and hospital mortality (Schulz 1995). Selective bowel decontamination appears to be of no significant benefit in people undergoing liver transplantation. In addition, people need very high motivation if they have to take the antibiotics continuously for many months or even years, while they are waiting for the availability of donor. Even in the trial that started the selective bowel decontamination just at the time of organ donor availability, the medicines frequently reached expiry date and had to be continually replaced (Bion 1994). Thus, selective bowel decontamination requires highly motivated healthcare providers and participants. Poor patient compliance could be one reason for the lack of beneficial effect from selective bowel decontamination. Patient compliance was not reported in any of the trials. Other possible reasons for the lack of beneficial effect of selective bowel decontamination include development of microbial tolerance to these antibiotics due to prolonged use (assuming good patient compliance) and lack of efficacy of antibiotics. The only quasi‐randomised trial identified reported six participants with diarrhoea out of the 18 participants who received selective bowel decontamination (Smith 1993). None of these people had pseudomembranous colitis. The prevalence of diarrhoea in the control group was not stated and so the outcome could not be included in a meta‐analysis.
The use of prebiotics with probiotics appears to decrease the number of people with any bacterial infection compared with selective bowel decontamination. However, only one trial assessed this comparison. Using lactobacillus in addition to fibres (prebiotics with probiotics) did not increase the abdominal cramps or diarrhoea (adverse effects due to the use of fibres) when compared with fibres alone. However, there was no comparison of these adverse effects with placebo. Therefore, it is unclear whether the use of prebiotics with probiotics causes discomfort to the patients. There are no direct comparisons of prebiotics either alone or in combination with probiotics versus placebo. Because of the heterogeneity in the treatments used to achieve selective bowel decontamination, it is not possible to use indirect comparisons to provide an estimate of the beneficial effect due to prebiotics alone or in combination with probiotics over no intervention. It should also be pointed out that there have been reports about infective complications such as abscesses due to Lactobacillus as a result of the use of probiotics (Rautio 1999; De Groote 2005). Therefore, the use of probiotics in people undergoing liver transplantation who receive immunosuppression should be further evaluated before such routine recommendations are given.
There was no beneficial effect of G‐CSF in reducing infections. Rejection and retransplantation are relevant in this comparison, as G‐CSF modulates the immune system. Although there was no significant difference in rejection after G‐CSF versus placebo, the CIs were wide and it was impossible to determine whether this lack of significant observed difference was because of lack of effect or lack of evidence of effect. G‐CSF does not appear to be safe and in the absence of any evidence of decreased complications, there appears to be no reason in using G‐CSF.
None of the trials investigated the relationship between the incidence of the infective complications and patient variables (such as pre‐operative MELD score, reason for liver transplantation, duration of pre‐operative hospital stay) or donor variables (such as donor instability at retrieval, donor infections at retrieval) that could potentially influence the results. It is possible that some interventions work in some groups of people and not in others.
Overall completeness and applicability of evidence
Most of the trials included adults undergoing elective liver transplantation. Therefore, this evidence is applicable only in adults undergoing elective liver transplantation. It should be noted that the selection of participants undergoing liver transplantation was based on the pre‐MELD era, and it is not clear whether the evidence is applicable for people in the MELD era. However, it must be pointed out that some studies state that there is no significant difference in the prediction of prognosis between MELD and Child‐Turcotte‐Pugh scores (Cholongitas 2006), while other studies showed that the results were better in the post‐MELD era (Agopian 2013). Most of the trials included in this review are more than 10 years old and the survival has improved significantly since the mid‐2000s despite riskier patients receiving transplants (Agopian 2013). Therefore, it is unclear whether the results of this review are applicable in the current era of liver transplantation. It should also be noted that all the participants in the trials included in this review received antibiotics, and so the findings of this review are applicable only to people who receive antibiotic prophylaxis when they undergo liver transplantation. In addition, none of the trials compared different antibiotic regimens or compared antibiotic prophylaxis versus no antibiotic prophylaxis. While trials comparing different antibiotic regimens can be conducted, the ethical nature of antibiotic prophylaxis versus no antibiotic prophylaxis in people undergoing liver transplantation is debatable since people undergoing liver transplantation routinely receive immunosuppression and the intact digestive tract is breached (the donor bile duct is anastomosed to the recipient bile duct) and antibiotic prophylaxis is recommended in both these situations (Bratzler 2013). Even with antibiotic prophylaxis, about one‐third of people develop infective complications.
Quality of the evidence
Most of the trials were of high risk of bias. Many of the trials had significant withdrawals or drop‐outs. For some interventions that require prolonged period of the intervention (such as prolonged period of antibiotics for selective bowel decontamination) and a long wait for liver transplantation, there will be withdrawals or drop‐outs. It is debatable whether to use intention‐to‐treat analysis or available‐case analysis for deaths during the waiting period or during the operation (with both methods of analysis having advantages and disadvantages), particularly if the deaths (unrelated to intervention) were more in one group. However, intention‐to‐treat analysis should be used if the withdrawal is due to intolerance to the intervention. Most of the trials in this review excluded these participants from the analysis. Future trials should perform intention‐to‐treat analyses.
In many of the trials, it is possible to blind the participants, healthcare providers, and outcome assessors to the intervention being administered. However, only four of the seven trials performed this (Winston 1999; Hellinger 2002; Zwaveling 2002; Rayes 2005). Blinding should be performed to obtain a better estimate of the true effect of the intervention (Schulz 1995; Kjaergard 2001; Wood 2008; Savović 2012; Savović 2012a).
Overall, the quality of evidence was very low as indicated in summary of findings Table for the main comparison; summary of findings Table 2. However, it must be pointed out that this is the best evidence available on this topic currently.
Potential biases in the review process
We evaluated a heterogeneous group of trials and decided not to include a number of interventions, for example, nutrition or procedure‐related interventions. Other systematic reviews ought to assess the benefits and harms of such interventions.
Agreements and disagreements with other studies or reviews
This review broadly agrees with the previous version of our review (Gurusamy 2008). We do not agree with another systematic review, which suggested that selective bowel decontamination is beneficial in decreasing gram‐negative infections (Safdar 2004). However, the review also mentioned that selective bowel decontamination can increase gram‐positive cocci and suggested a cautious approach (Safdar 2004). In our review, we gave more importance to the clinical implications of infections rather than the presence or absence of an infective microorganism in order to arrive at our conclusion.
Risk of bias graph: review authors' judgements about each risk of bias item presented as percentages across all included studies.
Risk of bias summary: review authors' judgements about each risk of bias item for each included study.
Trial sequential analysis of mortality (selective bowel decontamination versus inactive control)
The diversity‐adjusted required information size (DARIS) was calculated to 9753 participants, based on the proportion of participants in the control group with the outcome of 6.8%, a relative risk reduction of 20%, an alpha of 5%, a beta of 20%, and a diversity of 0%. To account for zero event groups, a continuity correction of 0.01 was used in the calculation of the cumulative Z‐curve (blue line). After accruing 190 participants in three trials, only 1.95% of the DARIS has been reached. Accordingly, the trial sequential analysis does not show the required information size and the trial sequential monitoring boundaries. As shown, the conventional boundaries (dotted red line) have also not been crossed by the cumulative Z‐curve.
Trial sequential analysis of mortality (prebiotics with probiotics versus prebiotics)
The diversity‐adjusted required information size (DARIS) was calculated to 9753 participants, based on the proportion of participants in the control group with the outcome of 6.8%, a relative risk reduction of 20%, an alpha of 5%, a beta of 20%, and a diversity of 0%. To account for zero event groups, a continuity correction of 0.01 was used in the calculation of the cumulative Z‐curve (blue line). After accruing 129 participants in two trials, only 1.32% of the DARIS has been reached. Accordingly, the trial sequential analysis does not show the required information size and the trial sequential monitoring boundaries. As shown, the conventional boundaries (dotted red line) have also not been crossed by the cumulative Z‐curve.
Trial sequential analysis of retransplantation (selective bowel decontamination versus inactive control)
The diversity‐adjusted required information size (DARIS) was calculated to 8086 participants, based on the proportion of participants in the control group with the outcome of 8.1%, a relative risk reduction of 20%, an alpha of 5%, a beta of 20%, and a diversity of 0%. To account for zero event groups, a continuity correction of 0.01 was used in the calculation of the cumulative Z‐curve (blue line). After accruing 132 participants in two trials, only 1.63% of the DARIS has been reached. Accordingly, the trial sequential analysis does not show the required information size and the trial sequential monitoring boundaries. As shown, the conventional boundaries (dotted red line) have also not been crossed by the cumulative Z‐curve.
Trial sequential analysis of mortality (prebiotics with probiotics versus prebiotics)
The diversity‐adjusted required information size (DARIS) was calculated to 46,458 participants, based on the proportion of participants in the control group with the outcome of 1.5%, a relative risk reduction of 20%, an alpha of 5%, a beta of 20%, and a diversity of 0%. To account for zero event groups, a continuity correction of 0.01 was used in the calculation of the cumulative Z‐curve (blue line). After accruing 129 participants in two trials, only 0.28% of the DARIS has been reached. Accordingly, the trial sequential analysis does not show the required information size and the trial sequential monitoring boundaries. As shown, the conventional boundaries (dotted red line) have also not been crossed by the cumulative Z‐curve.
Trial sequential analysis of infection (selective bowel decontamination versus inactive control)
The diversity‐adjusted required information size (DARIS) was calculated to 2639 participants, based on the proportion of participants in the control group with the outcome of 44.9%, a relative risk reduction of 20%, an alpha of 5%, a beta of 20%, and a diversity of 0%. After accruing 256 participants in four trials, only 9.7% of the DARIS has been reached. Accordingly, the trial sequential analysis does not show the futility area. The cumulative Z‐curve (blue line) does not cross the trial sequential monitoring boundaries (continuous red line) or the conventional boundaries (dotted red line).
Trial sequential analysis of infection (prebiotics with probiotics versus prebiotics)
The diversity‐adjusted required information size (DARIS) was calculated to 3745 participants, based on the proportion of participants in the control group with the outcome of 41.5%, a relative risk reduction of 20%, an alpha of 5%, a beta of 20%, and a diversity of 71.51%. After accruing 129 participants in two trials, only 3.44% of the DARIS has been reached. Accordingly, the trial sequential analysis does not show the required information size and the trial sequential monitoring boundaries. As shown, the conventional boundaries (dotted red line) have not been crossed by the cumulative Z‐curve (blue line) after two trials although the conventional boundary was crossed favouring probiotics with prebiotics after the first trial.
Trial sequential analysis of intensive therapy unit stay (prebiotics with probiotics versus prebiotics)
The diversity‐adjusted required information size (DARIS) was 8005 participants based on a minimal relevant difference (MIRD) of 1 day, a variance (VAR) of 254.96, an alpha (a) of 5%, a beta (b) of 20%, and a diversity (D2) of 0%. After accruing 129 participants in two trials, only 1.61% of the DARIS has been reached. Accordingly, the trial sequential analysis does not show the required information size and the trial sequential monitoring boundaries. As shown, the conventional boundaries (dotted red line) have not been crossed by the cumulative Z‐curve (blue line).
Trial sequential analysis of hospital stay (prebiotics with probiotics versus prebiotics)
The diversity‐adjusted required information size (DARIS) was 11,621 participants based on a minimal relevant difference (MIRD) of 1 day, a variance (VAR) of 370.14, an alpha (a) of 5%, a beta (b) of 20%, and a diversity (D2) of 0%. After accruing 129 participants in two trials, only 1.11% of the DARIS has been reached. Accordingly, the trial sequential analysis does not show the required information size and the trial sequential monitoring boundaries. As shown, the conventional boundaries (dotted red line) have not been crossed by the cumulative Z‐curve (blue line).

Comparison 1 Intervention versus control, Outcome 1 Mortality.

Comparison 1 Intervention versus control, Outcome 2 Retransplantation.
Comparison 1 Intervention versus control, Outcome 3 Graft rejection requiring medical treatment.
Comparison 1 Intervention versus control, Outcome 4 Graft rejection unspecified treatment.

Comparison 1 Intervention versus control, Outcome 5 Proportion of participants with infections.

Comparison 1 Intervention versus control, Outcome 6 Number of infection episodes.

Comparison 1 Intervention versus control, Outcome 7 Intensive therapy unit stay.

Comparison 1 Intervention versus control, Outcome 8 Hospital stay.
| Mortality | |||||
| Patient or population: people undergoing liver transplantation. | |||||
| Comparisons | Illustrative comparative risks* (95% CI) | Relative effect | No. of participants | Quality of the evidence | |
| Assumed risk | Corresponding risk | ||||
| Control | Intervention | ||||
| Selective bowel decontamination versus inactive control | 68 per 1000 | 62 per 1000 | RR 0.91 | 190 | ⊕⊝⊝⊝ |
| Selective bowel decontamination versus prebiotics with probiotics | No mortality in either group | Not estimable | 63 | ⊕⊝⊝⊝ | |
| Selective bowel decontamination versus prebiotics | No mortality in either group | Not estimable | 64 | ⊕⊝⊝⊝ | |
| Prebiotics with probiotics versus prebiotics | No mortality in either group | Not estimable | 129 | ⊕⊝⊝⊝ | |
| Granulocyte‐colony stimulating factor (G‐CSF) versus placebo | 143 per 1000 | 177 per 1000 | RR 1.24 | 194 | ⊕⊝⊝⊝ |
| *The basis for the assumed risk is the control group risk across studies. The corresponding risk (and its 95% confidence interval) is based on the assumed risk in the comparison group and the relative effect of the intervention (and its 95% CI). | |||||
| GRADE Working Group grades of evidence | |||||
| 1 The trial(s) was (were) of high risk of bias. | |||||
| Retransplantation | |||||
| Patient or population: people undergoing liver transplantation. | |||||
| Comparisons | Illustrative comparative risks* (95% CI) | Relative effect | No. of participants | Quality of the evidence | |
| Assumed risk | Corresponding risk | ||||
| Control | Intervention | ||||
| Selective bowel decontamination versus inactive control | 81 per 1000 | 69 per 1000 | RR 0.85 | 132 | ⊕⊝⊝⊝ |
| Selective bowel decontamination versus prebiotics with probiotics | 15 per 1000* | 44 per 1000 | RR 2.91 | 63 | ⊕⊝⊝⊝ |
| Selective bowel decontamination versus prebiotics | 16 per 1000* | 48 per 1000 | RR 3.00 | 64 | ⊕⊝⊝⊝ |
| Prebiotics with probiotics versus prebiotics | 15 per 1000 | 5 per 1000 | RR 0.33 | 129 | ⊕⊝⊝⊝ |
| Granulocyte‐colony stimulating factor (G‐CSF) versus placebo | 71 per 1000 | 81 per 1000 | RR 1.13 | 194 | ⊕⊝⊝⊝ |
| *The basis for the assumed risk is the control group risk across studies except for the two comparisons indicated which did not have any retransplantation in the control group. The overall proportion of patients who required retransplantation in the comparison was used as the control group risk in these two comparisons. The corresponding risk (and its 95% confidence interval) is based on the assumed risk in the comparison group and the relative effect of the intervention (and its 95% CI). | |||||
| GRADE Working Group grades of evidence | |||||
| 1 The trial(s) was (were) of high risk of bias. | |||||
| Outcome or subgroup title | No. of studies | No. of participants | Statistical method | Effect size |
| 1 Mortality Show forest plot | 6 | Risk Ratio (M‐H, Fixed, 95% CI) | Subtotals only | |
| 1.1 Selective bowel decontamination versus inactive control | 3 | 190 | Risk Ratio (M‐H, Fixed, 95% CI) | 0.91 [0.31, 2.72] |
| 1.2 Selective bowel decontamination versus prebiotics with probiotics | 1 | 63 | Risk Ratio (M‐H, Fixed, 95% CI) | 0.0 [0.0, 0.0] |
| 1.3 Selective bowel decontamination versus prebiotics | 1 | 64 | Risk Ratio (M‐H, Fixed, 95% CI) | 0.0 [0.0, 0.0] |
| 1.4 Prebiotics with probiotics versus prebiotics | 2 | 129 | Risk Ratio (M‐H, Fixed, 95% CI) | 0.0 [0.0, 0.0] |
| 1.5 Granulocyte‐colony stimulating factor (G‐CSF) versus placebo | 1 | 194 | Risk Ratio (M‐H, Fixed, 95% CI) | 1.24 [0.62, 2.47] |
| 2 Retransplantation Show forest plot | 5 | Risk Ratio (M‐H, Fixed, 95% CI) | Subtotals only | |
| 2.1 Selective bowel decontamination versus inactive control | 2 | 132 | Risk Ratio (M‐H, Fixed, 95% CI) | 0.85 [0.26, 2.85] |
| 2.2 Selective bowel decontamination versus prebiotics with probiotics | 1 | 63 | Risk Ratio (M‐H, Fixed, 95% CI) | 2.91 [0.12, 68.81] |
| 2.3 Selective bowel decontamination versus prebiotics | 1 | 64 | Risk Ratio (M‐H, Fixed, 95% CI) | 3.0 [0.13, 71.00] |
| 2.4 Prebiotics with probiotics versus prebiotics | 2 | 129 | Risk Ratio (M‐H, Fixed, 95% CI) | 0.33 [0.01, 7.90] |
| 2.5 Granulocyte‐colony stimulating factor (G‐CSF) versus placebo | 1 | 194 | Risk Ratio (M‐H, Fixed, 95% CI) | 1.13 [0.40, 3.17] |
| 3 Graft rejection requiring medical treatment Show forest plot | 2 | Risk Ratio (M‐H, Fixed, 95% CI) | Subtotals only | |
| 3.1 Selective bowel decontamination versus prebiotics with probiotics | 1 | 63 | Risk Ratio (M‐H, Fixed, 95% CI) | 1.94 [0.38, 9.83] |
| 3.2 Selective bowel decontamination versus prebiotics | 1 | 64 | Risk Ratio (M‐H, Fixed, 95% CI) | 1.33 [0.32, 5.49] |
| 3.3 Prebiotics with probiotics versus prebiotics | 1 | 63 | Risk Ratio (M‐H, Fixed, 95% CI) | 0.69 [0.12, 3.84] |
| 3.4 Granulocyte‐colony stimulating factor (G‐CSF) versus placebo | 1 | 194 | Risk Ratio (M‐H, Fixed, 95% CI) | 1.74 [0.94, 3.22] |
| 4 Graft rejection unspecified treatment Show forest plot | 3 | Risk Ratio (M‐H, Fixed, 95% CI) | Subtotals only | |
| 4.1 Selective bowel decontamination versus inactive control | 2 | 111 | Risk Ratio (M‐H, Fixed, 95% CI) | 1.09 [0.85, 1.38] |
| 4.2 Prebiotics with probiotics versus prebiotics | 1 | 66 | Risk Ratio (M‐H, Fixed, 95% CI) | 0.86 [0.32, 2.28] |
| 5 Proportion of participants with infections Show forest plot | 7 | Risk Ratio (M‐H, Random, 95% CI) | Subtotals only | |
| 5.1 Selective bowel decontamination versus inactive control | 4 | 256 | Risk Ratio (M‐H, Random, 95% CI) | 0.94 [0.63, 1.41] |
| 5.2 Selective bowel decontamination versus prebiotics with probiotics | 1 | 63 | Risk Ratio (M‐H, Random, 95% CI) | 3.63 [1.36, 9.74] |
| 5.3 Selective bowel decontamination versus prebiotics | 1 | 64 | Risk Ratio (M‐H, Random, 95% CI) | 1.36 [0.75, 2.50] |
| 5.4 Prebiotics with probiotics versus prebiotics | 2 | 129 | Risk Ratio (M‐H, Random, 95% CI) | 0.18 [0.03, 1.17] |
| 5.5 Granulocyte‐colony stimulating factor (G‐CSF) versus placebo | 1 | 194 | Risk Ratio (M‐H, Random, 95% CI) | 1.03 [0.55, 1.96] |
| 6 Number of infection episodes Show forest plot | 3 | Rate Ratio (Fixed, 95% CI) | 1.10 [0.78, 1.56] | |
| 6.1 Selective bowel decontamination versus inactive control | 1 | Rate Ratio (Fixed, 95% CI) | 0.49 [0.18, 1.36] | |
| 6.2 Selective bowel decontamination versus prebiotics with probiotics | 1 | Rate Ratio (Fixed, 95% CI) | 5.58 [1.94, 16.09] | |
| 6.3 Selective bowel decontamination versus prebiotics | 1 | Rate Ratio (Fixed, 95% CI) | 1.35 [0.72, 2.53] | |
| 6.4 Prebiotics with probiotics versus prebiotics | 2 | Rate Ratio (Fixed, 95% CI) | 0.81 [0.49, 1.35] | |
| 7 Intensive therapy unit stay Show forest plot | 4 | Mean Difference (IV, Fixed, 95% CI) | Subtotals only | |
| 7.1 Selective bowel decontamination versus inactive control | 1 | 55 | Mean Difference (IV, Fixed, 95% CI) | 2.0 [‐32.00, 38.00] |
| 7.2 Selective bowel decontamination versus prebiotics with probiotics | 1 | 63 | Mean Difference (IV, Fixed, 95% CI) | 4.0 [‐23.45, 31.45] |
| 7.3 Selective bowel decontamination versus prebiotics | 1 | 64 | Mean Difference (IV, Fixed, 95% CI) | 2.20 [‐31.12, 35.52] |
| 7.4 Prebiotics with probiotics versus prebiotics | 2 | 129 | Mean Difference (IV, Fixed, 95% CI) | ‐1.41 [‐5.30, 2.49] |
| 7.5 Granulocyte‐colony stimulating factor (G‐CSF) versus placebo | 1 | 194 | Mean Difference (IV, Fixed, 95% CI) | 0.0 [‐19.92, 19.92] |
| 8 Hospital stay Show forest plot | 4 | Mean Difference (IV, Fixed, 95% CI) | Subtotals only | |
| 8.1 Selective bowel decontamination versus inactive control | 1 | 52 | Mean Difference (IV, Fixed, 95% CI) | 0.60 [‐7.71, 8.91] |
| 8.2 Selective bowel decontamination versus prebiotics with probiotics | 1 | 63 | Mean Difference (IV, Fixed, 95% CI) | 4.0 [‐0.82, 8.82] |
| 8.3 Selective bowel decontamination versus prebiotics | 1 | 64 | Mean Difference (IV, Fixed, 95% CI) | 3.0 [‐2.39, 8.39] |
| 8.4 Prebiotics with probiotics versus prebiotics | 2 | 129 | Mean Difference (IV, Fixed, 95% CI) | ‐0.49 [‐5.19, 4.20] |
| 8.5 Granulocyte‐colony stimulating factor (G‐CSF) versus placebo | 1 | 194 | Mean Difference (IV, Fixed, 95% CI) | 0.0 [‐5.13, 5.13] |