Tranexamic acid for upper gastrointestinal bleeding
Information
- DOI:
- https://doi.org/10.1002/14651858.CD006640.pub3Copy DOI

- Database:
-
- Cochrane Database of Systematic Reviews
- Version published:
-
- 21 November 2014see what's new
- Type:
-
- Intervention
- Stage:
-
- Review
- Cochrane Editorial Group:
-
Cochrane Gut Group
- Copyright:
-
- Copyright © 2014 The Cochrane Collaboration. Published by John Wiley & Sons, Ltd.
Article metrics
Altmetric:
Cited by:
Authors
Contributions of authors
LLG drafted the review and performed the statistical analyses. SLK and ELA participated in interpretation of the results and revision of the review. All review authors have approved the final version.
Sources of support
Internal sources
-
The present review did not receive funding, Other.
External sources
-
No sources of support supplied
Declarations of interest
None of the review authors has reported any conflicts of interest with regard to the present work.
CB is the proprietor of Systematic Research Ltd and was paid by the CUGPD Editorial Group for her contributions to this review.
Acknowledgements
We would like to thank Dr GM Hawkey (Hawkey 2001), who responded to our request for additional data and Dimitrinka Nikolova of the Cochrane Hepato‐Biliary Group for translations.
Version history
| Published | Title | Stage | Authors | Version |
| 2014 Nov 21 | Tranexamic acid for upper gastrointestinal bleeding | Review | Cathy Bennett, Sarah Louise Klingenberg, Ebbe Langholz, Lise Lotte Gluud | |
| 2012 Jan 18 | Tranexamic acid for upper gastrointestinal bleeding | Review | Lise Lotte Gluud, Sarah Louise Klingenberg, Ebbe Langholz | |
| 2007 Jul 18 | Tranexamic acid for upper gastrointestinal bleeding | Protocol | Lise Lotte Gluud, Sarah Louise Klingenberg, Ebbe Langholz | |
Differences between protocol and review
We updated the review in 2014 to comply with MECIR standards for the conduct and reporting of systematic reviews. We updated the format of the review for clarity and provided the following information about our methods.
-
We included adverse effects as a primary outcome (formerly a secondary outcome) to comply with recent guidance on conduct and presentation of the systematic review.
-
We clarified that because of the risk of selection bias in the allocation of participants to intervention or control groups and bias in the administration of collateral interventions, we did not include cluster‐randomised trials.
-
For trials with multiple intervention groups, we partitioned the numbers of participants in individual allocation arms into pair‐wise comparisons.
-
We used simple imputation to evaluate the potential influence of missing data: imputing failures, imputing successes, worst‐ and best‐case.
-
We provided additional explanations of our assessment and reporting of heterogeneity for clarity; our methods remain unchanged.
-
We performed all meta‐analyses using both random‐effects and fixed‐effect models. Fixed‐effect meta‐analyses are reported only when results of the two models differ (e.g. one model shows no difference between interventions and the other shows an intervention effect).
-
We performed separate analyses of trials on tranexamic acid versus placebo or no intervention and trials on tranexamic acid versus antiulcer drugs. We performed subgroup analyses of trials with low risk of bias based on assessment of the separate domains. We also analysed subgroups of trials that used endoscopic therapy and trials published in English or Russian.
-
We performed an analysis when all participants with missing outcome data were included as treatment failures, and we used a per‐protocol analysis to evaluate the influence of missing data when we excluded participants with missing outcome data.
-
For analyses with at least 10 trials, we planned to assess reporting biases and other dissemination biases on the basis of funnel plots (Higgins 2011) and regression analyses by using Harbord's modified test (Harbord 2006). Our analyses included only eight trials; therefore we did not carry out statistical analysis of reporting bias.
-
We performed a post hoc trial sequential analysis to evaluate the risk of bias associated with cumulative testing and to evaluate futility in assessment of mortality and bleeding (Higgins 2008; Wetterslev 2008). We performed the analysis with power set to 80%, alpha to 5%, model‐based diversity and relative risk reduction (RRR) to 25%. We set the control group incidence to 8% in our analysis of mortality and to 18% in our analysis of bleeding.
-
We prepared a 'Summary of findings' table (Guyatt 2008) using GRADEpro software (Gradepro 3.6) and included information on results of our primary outcomes in relation to risk of heterogeneity, duration of follow‐up and quality of the evidence.
Keywords
MeSH
Medical Subject Headings (MeSH) Keywords
- Administration, Oral;
- Aluminum Hydroxide [therapeutic use];
- Anti‐Ulcer Agents [therapeutic use];
- Antifibrinolytic Agents [adverse effects, *therapeutic use];
- Cimetidine [therapeutic use];
- Drug Combinations;
- Endoscopy, Gastrointestinal;
- Gastrointestinal Hemorrhage [*drug therapy, mortality];
- Injections, Intravenous;
- Lansoprazole [therapeutic use];
- Magnesium [therapeutic use];
- Magnesium Hydroxide [therapeutic use];
- Randomized Controlled Trials as Topic;
- Tranexamic Acid [adverse effects, *therapeutic use];
Medical Subject Headings Check Words
Humans;
PICOs

Risk of bias summary: review authors' judgements about each risk of bias item for each included study.

Trial sequential analysis of eight trials on tranexamic acid versus placebo or no intervention. Outcome measure is mortality. Analysis was performed with alpha 5% and power 80%. Model‐based heterogeneity correction was 0%, relative risk reduction 30% and control group incidence 10%. Graph shows the Z‐curve, which is the cumulative result of analysis with trials added according to year of publication. Horizontal line represents 'traditional' 5% level of significance, and inward sloping red line shows trial sequential monitoring boundary. Vertical line represents required information size. Analysis shows that the Z‐curve crosses the trial sequential monitoring boundary, suggesting that the result of the meta‐analysis is confirmed when analysis is adjusted for cumulative testing. Total number of included participants (N = 1701) is only 62% of required information size (N=2714). The meta‐analysis therefore remains inconclusive.

Trial sequential analysis of seven trials on tranexamic acid versus placebo or no intervention. Outcome measure is bleeding. Analysis was performed with alpha 5% and power 80%. Model‐based heterogeneity correction was 53%, relative risk reduction 30% and control group incidence 10%. Graph shows the Z‐curve, which is the cumulative result of analysis with trials added according to year of publication. Horizontal line represents 'traditional' 5% level of significance, and inward sloping red line shows trial sequential monitoring boundary. Vertical line represents required information size. Analysis shows that the Z‐curve does not cross the trial sequential monitoring boundary, and the total number of participants (N = 1651) is 95% of required information size (N = 1734). The meta‐analysis therefore remains inconclusive.
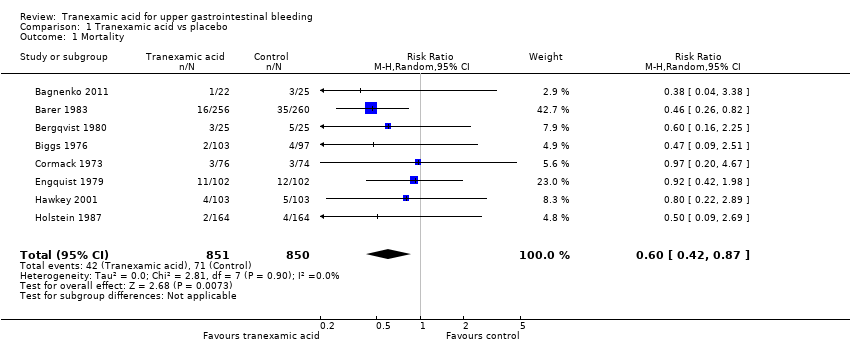
Comparison 1 Tranexamic acid vs placebo, Outcome 1 Mortality.
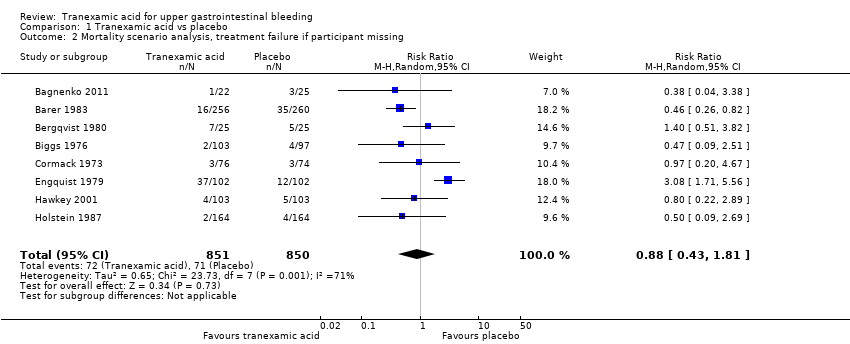
Comparison 1 Tranexamic acid vs placebo, Outcome 2 Mortality scenario analysis, treatment failure if participant missing.
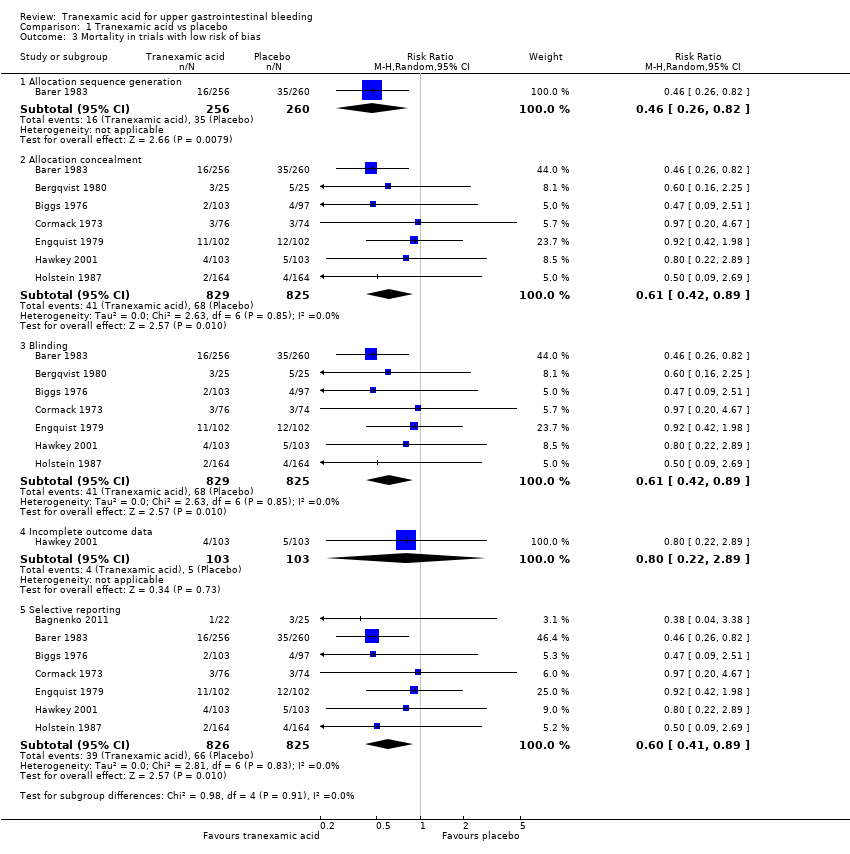
Comparison 1 Tranexamic acid vs placebo, Outcome 3 Mortality in trials with low risk of bias.

Comparison 1 Tranexamic acid vs placebo, Outcome 4 Mortality in relation to endoscopic therapy.

Comparison 1 Tranexamic acid vs placebo, Outcome 5 Mortality in relation to language of publication.

Comparison 1 Tranexamic acid vs placebo, Outcome 6 Rebleeding.

Comparison 1 Tranexamic acid vs placebo, Outcome 7 Rebleeding scenario analysis, treatment failure if participant missing.

Comparison 1 Tranexamic acid vs placebo, Outcome 8 Rebleeding in trials with low risk of bias.

Comparison 1 Tranexamic acid vs placebo, Outcome 9 Rebleeding in relation to endoscopic therapy.

Comparison 1 Tranexamic acid vs placebo, Outcome 10 Rebleeding in relation to language of publication.

Comparison 1 Tranexamic acid vs placebo, Outcome 11 Myocardial infarction, pulmonary embolism and cerebral infarction.
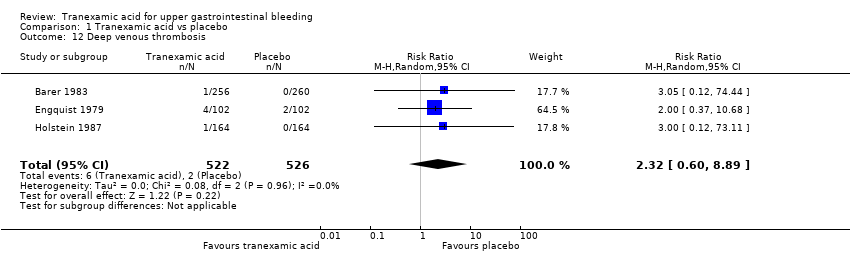
Comparison 1 Tranexamic acid vs placebo, Outcome 12 Deep venous thrombosis.

Comparison 1 Tranexamic acid vs placebo, Outcome 13 Any thromboembolic event.

Comparison 1 Tranexamic acid vs placebo, Outcome 14 Surgery.

Comparison 1 Tranexamic acid vs placebo, Outcome 15 Transfusion required.
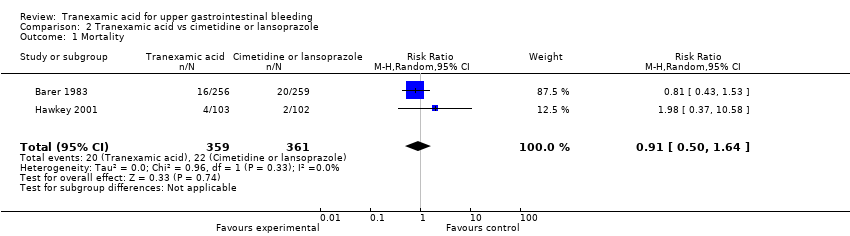
Comparison 2 Tranexamic acid vs cimetidine or lansoprazole, Outcome 1 Mortality.
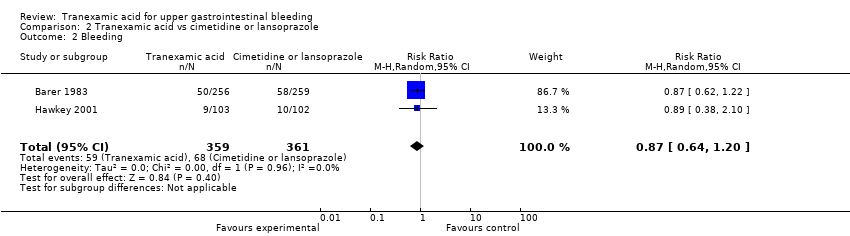
Comparison 2 Tranexamic acid vs cimetidine or lansoprazole, Outcome 2 Bleeding.

Comparison 2 Tranexamic acid vs cimetidine or lansoprazole, Outcome 3 Surgery.

Comparison 2 Tranexamic acid vs cimetidine or lansoprazole, Outcome 4 Transfusion.
| Tranexamic acid vs placebo for upper gastrointestinal bleeding | ||||||
| Patient or population: patients with upper gastrointestinal bleeding | ||||||
| Outcomes | Illustrative comparative risks* (95% CI) | Relative effect | Number of participants | Quality of the evidence | Comments | |
| Assumed risk | Corresponding risk | |||||
| Control | Tranexamic acid vs placebo | |||||
| Mortality | Study population | RR 0.6 | 1701 | ⊕⊕⊕⊝ | ||
| 84 per 1000 | 50 per 1000 | |||||
| Moderate | ||||||
| 83 per 1000 | 50 per 1000 | |||||
| Rebleeding | Study population | RR 0.72 | 1651 | ⊕⊕⊝⊝ | ||
| 177 per 1000 | 142 per 1000 | |||||
| Moderate | ||||||
| 196 per 1000 | 157 per 1000 | |||||
| Any thromboembolic event | Study population | RR 1.86 | 1095 | ⊕⊕⊕⊝ | ||
| 11 per 1000 | 20 per 1000 | |||||
| Moderate | ||||||
| 10 per 1000 | 19 per 1000 | |||||
| Surgery | Study population | RR 0.61 | 1551 | ⊕⊕⊕⊝ | ||
| 142 per 1000 | 103 per 1000 | |||||
| Moderate | ||||||
| 154 per 1000 | 112 per 1000 | |||||
| Transfusion | Study population | RR 1.02 | 931 | ⊕⊝⊝⊝ | ||
| 564 per 1000 | 558 per 1000 | |||||
| Moderate | ||||||
| 583 per 1000 | 577 per 1000 | |||||
| *The basis for the assumed risk (e.g. median control group risk across studies) is provided in footnotes. The corresponding risk (and its 95% confidence interval) is based on the assumed risk in the comparison group and the relative effect of the intervention (and its 95% CI). | ||||||
| GRADE Working Group grades of evidence. | ||||||
| aMost trials had high risk of attrition bias. | ||||||
| Tranexamic acid vs cimetidine or lansoprazole for upper gastrointestinal bleeding | ||||||
| Patient or population: patients with upper gastrointestinal bleeding | ||||||
| Outcomes | Illustrative comparative risks* (95% CI) | Relative effect | Number of participants | Quality of the evidence | Comments | |
| Assumed risk | Corresponding risk | |||||
| Control | Tranexamic acid vs cimetidine or lansoprazole | |||||
| Mortality | Study population | RR 0.91 | 720 | ⊕⊕⊕⊝ | ||
| 61 per 1000 | 56 per 1000 | |||||
| Moderate | ||||||
| 48 per 1000 | 44 per 1000 | |||||
| Rebleeding | Study population | RR 0.87 | 720 | ⊕⊕⊕⊝ | ||
| 188 per 1000 | 166 per 1000 | |||||
| Moderate | ||||||
| 161 per 1000 | 142 per 1000 | |||||
| Surgery | Study population | RR 0.83 | 720 | ⊕⊕⊕⊝ | ||
| 139 per 1000 | 115 per 1000 | |||||
| Moderate | ||||||
| 105 per 1000 | 87 per 1000 | |||||
| Transfusion | Study population | RR 0.97 | 720 | ⊕⊕⊝⊝ | ||
| 573 per 1000 | 579 per 1000 | |||||
| Moderate | ||||||
| 599 per 1000 | 605 per 1000 | |||||
| *The basis for the assumed risk (e.g. median control group risk across studies) is provided in footnotes. The corresponding risk (and its 95% confidence interval) is based on the assumed risk in the comparison group and the relative effect of the intervention (and its 95% CI). | ||||||
| GRADE Working Group grades of evidence. | ||||||
| aHigh risk of bias based on assessment of attrition. | ||||||
| Trial | Serious adverse events | Non‐serious adverse events | Non‐serious adverse events | ||
| Tranexamic acid | Control group | Intervention group not specified | Tranexamic acid | Control group | |
| Fatal stroke (n = 1) | Confusion | Pulmonary embolism (n = 5). Myocardial infarction (n = 8) | None described | Confusion (n = 1) | |
| None described | None described | None described | Thrombophlebitis at injection site (n = 3). Nausea or headache (n = 4) | Thrombophlebitis at injection site (n = 2). Nausea or headache (n = 5). Fever (n = 2) | |
| Pulmonary embolism (n = 2). Myocardial infarction (n = 2) | Cerebral infarction | None described | None described | None described | |
| None described | None described | Several participants experienced thromboembolic complications. The numbers were described as not significantly different in treatment and control groups, but no specific data are provided | None described | None described | |
| None described | Cerebral infarction | Five additional participants were excluded as the result of thromboembolic disease, but whether these participants were randomly assigned to tranexamic acid or placebo is not reported | Nausea and vomiting, tachycardia (n = 3). Hypotension (n = 3). Thrombophlebitis at injection site (n = 2). Deep venous thrombosis (n = 1) | None described | |
| Outcome or subgroup title | No. of studies | No. of participants | Statistical method | Effect size |
| 1 Mortality Show forest plot | 8 | 1701 | Risk Ratio (M‐H, Random, 95% CI) | 0.60 [0.42, 0.87] |
| 2 Mortality scenario analysis, treatment failure if participant missing Show forest plot | 8 | 1701 | Risk Ratio (M‐H, Random, 95% CI) | 0.88 [0.43, 1.81] |
| 3 Mortality in trials with low risk of bias Show forest plot | 8 | Risk Ratio (M‐H, Random, 95% CI) | Subtotals only | |
| 3.1 Allocation sequence generation | 1 | 516 | Risk Ratio (M‐H, Random, 95% CI) | 0.46 [0.26, 0.82] |
| 3.2 Allocation concealment | 7 | 1654 | Risk Ratio (M‐H, Random, 95% CI) | 0.61 [0.42, 0.89] |
| 3.3 Blinding | 7 | 1654 | Risk Ratio (M‐H, Random, 95% CI) | 0.61 [0.42, 0.89] |
| 3.4 Incomplete outcome data | 1 | 206 | Risk Ratio (M‐H, Random, 95% CI) | 0.8 [0.22, 2.89] |
| 3.5 Selective reporting | 7 | 1651 | Risk Ratio (M‐H, Random, 95% CI) | 0.60 [0.41, 0.89] |
| 4 Mortality in relation to endoscopic therapy Show forest plot | 8 | 1701 | Risk Ratio (M‐H, Random, 95% CI) | 0.60 [0.42, 0.87] |
| 4.1 Endoscopic therapy not used | 6 | 1448 | Risk Ratio (M‐H, Random, 95% CI) | 0.60 [0.40, 0.88] |
| 4.2 Endoscopic therapy used to control bleeding | 2 | 253 | Risk Ratio (M‐H, Random, 95% CI) | 0.66 [0.22, 2.00] |
| 5 Mortality in relation to language of publication Show forest plot | 8 | 1701 | Risk Ratio (M‐H, Random, 95% CI) | 0.60 [0.42, 0.87] |
| 5.1 Trials published in English | 7 | 1654 | Risk Ratio (M‐H, Random, 95% CI) | 0.61 [0.42, 0.89] |
| 5.2 Trials translated from Russian | 1 | 47 | Risk Ratio (M‐H, Random, 95% CI) | 0.38 [0.04, 3.38] |
| 6 Rebleeding Show forest plot | 7 | 1651 | Risk Ratio (M‐H, Random, 95% CI) | 0.72 [0.50, 1.03] |
| 7 Rebleeding scenario analysis, treatment failure if participant missing Show forest plot | 7 | 1651 | Risk Ratio (M‐H, Random, 95% CI) | 0.80 [0.51, 1.27] |
| 8 Rebleeding in trials with low risk of bias Show forest plot | 7 | 5581 | Risk Ratio (M‐H, Random, 95% CI) | 0.78 [0.65, 0.93] |
| 8.1 Allocation sequence generation | 1 | 516 | Risk Ratio (M‐H, Random, 95% CI) | 1.16 [0.83, 1.61] |
| 8.2 Allocation concealment | 6 | 1604 | Risk Ratio (M‐H, Random, 95% CI) | 0.73 [0.50, 1.07] |
| 8.3 Blinding | 6 | 1604 | Risk Ratio (M‐H, Random, 95% CI) | 0.73 [0.50, 1.07] |
| 8.4 Incomplete outcome data | 1 | 206 | Risk Ratio (M‐H, Random, 95% CI) | 0.9 [0.38, 2.12] |
| 8.5 Selective reporting | 7 | 1651 | Risk Ratio (M‐H, Random, 95% CI) | 0.72 [0.50, 1.03] |
| 9 Rebleeding in relation to endoscopic therapy Show forest plot | 7 | 1651 | Risk Ratio (M‐H, Random, 95% CI) | 0.72 [0.50, 1.03] |
| 9.1 Endoscopic therapy not used | 5 | 1398 | Risk Ratio (M‐H, Random, 95% CI) | 0.70 [0.45, 1.08] |
| 9.2 Endoscopic therapy used to control bleeding | 2 | 253 | Risk Ratio (M‐H, Random, 95% CI) | 0.77 [0.36, 1.62] |
| 10 Rebleeding in relation to language of publication Show forest plot | 7 | 1651 | Risk Ratio (M‐H, Random, 95% CI) | 0.72 [0.50, 1.03] |
| 10.1 Trials published in English | 6 | 1604 | Risk Ratio (M‐H, Random, 95% CI) | 0.73 [0.50, 1.07] |
| 10.2 Trials translated from Russian | 1 | 47 | Risk Ratio (M‐H, Random, 95% CI) | 0.45 [0.10, 2.11] |
| 11 Myocardial infarction, pulmonary embolism and cerebral infarction Show forest plot | 3 | 1048 | Risk Ratio (M‐H, Random, 95% CI) | 1.37 [0.36, 5.28] |
| 12 Deep venous thrombosis Show forest plot | 3 | 1048 | Risk Ratio (M‐H, Random, 95% CI) | 2.32 [0.60, 8.89] |
| 13 Any thromboembolic event Show forest plot | 4 | 1095 | Risk Ratio (M‐H, Random, 95% CI) | 1.86 [0.66, 5.24] |
| 14 Surgery Show forest plot | 7 | 1551 | Risk Ratio (M‐H, Random, 95% CI) | 0.61 [0.35, 1.04] |
| 15 Transfusion required Show forest plot | 5 | 931 | Risk Ratio (M‐H, Random, 95% CI) | 1.02 [0.94, 1.11] |
| Outcome or subgroup title | No. of studies | No. of participants | Statistical method | Effect size |
| 1 Mortality Show forest plot | 2 | 720 | Risk Ratio (M‐H, Random, 95% CI) | 0.91 [0.50, 1.64] |
| 2 Bleeding Show forest plot | 2 | 720 | Risk Ratio (M‐H, Random, 95% CI) | 0.87 [0.64, 1.20] |
| 3 Surgery Show forest plot | 2 | 720 | Risk Ratio (M‐H, Random, 95% CI) | 0.83 [0.54, 1.26] |
| 4 Transfusion Show forest plot | 2 | 720 | Risk Ratio (M‐H, Random, 95% CI) | 0.97 [0.78, 1.22] |